non-parametric tests in spss (between...
TRANSCRIPT

Outline
• Introduction
• Mann-Whitney U– SPSS procedure
– Interpretation of SPSS output
– Reporting
• Kruskall-Wallis– SPSS procedure
– Interpretation of SPSS output
– Reporting
Introduction
• Non-parametric tests are based on ranks rather than raw scores: – SPSS converts the raw data into rankings before comparing
groups (ordinal level)
• These tests are advised when – scores on the DV are ordinal– when scores are interval, but ANOVA is not robust enough
to deal with the existing deviations from assumptions for the DV distribution (check “assumptions of ANOVA”)
• If the underlying data meet the assumptions of parametricity, use parametric tests – they have more power

Introduction
• These are sometimes referred to as “distribution free” tests, because they do not make assumptions about the normality or variance of the data
• If you have decided to use a non-parametric test then the most appropriate measure of central tendency will probably be the median
Limitations of non-parametric methods
• Converting ratio level data to ordinal ranked data entails a loss of information
• This reduces the sensitivity of the non-parametric test compared to the parametric alternative in most circumstances– sensitivity is the power to reject the null hypothesis, given
that it is false in the population – lower sensitivity gives a higher type 2 error rate
• Many parametric tests have no non-parametric equivalent– e.g. Two way ANOVA, where two IV’s and their interaction
are considered simultaneously

Mann-Whitney U
• Design: Non-parametric
– 1 continuous DV (criminal thinking)
– 2 comparison groups (IV) - different participants in each group (violent and non-violent offenders)
• Purpose: To determine if there is a significant difference in level of criminal thinking between violent and non-violent offenders
SPSS Procedure
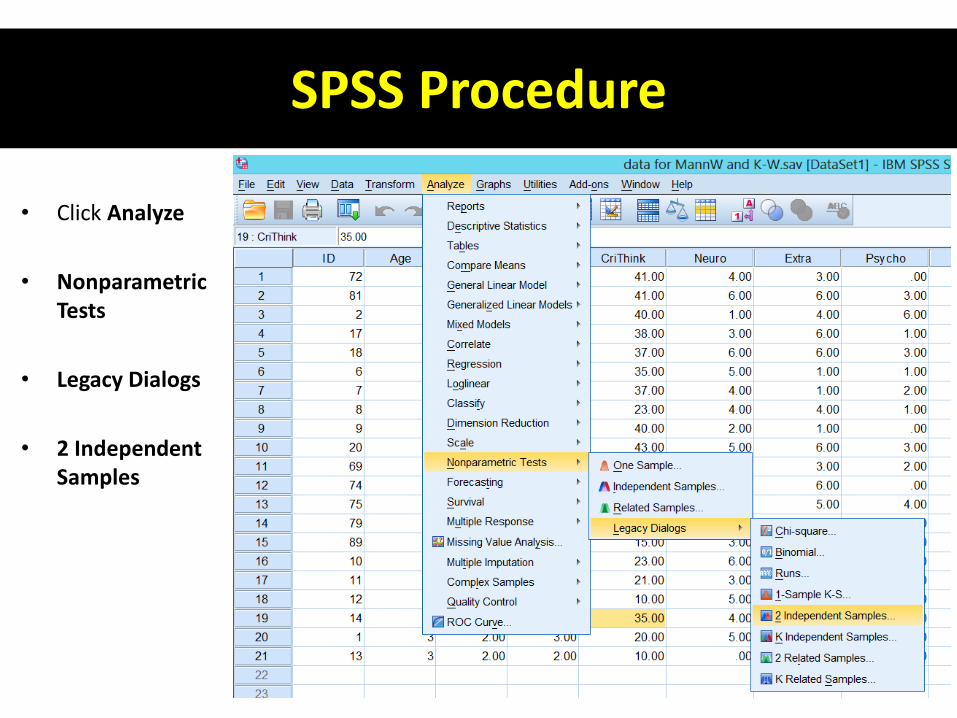
• Click Analyze
• Nonparametric Tests
• Legacy Dialogs
• 2 Independent Samples
SPSS Procedure
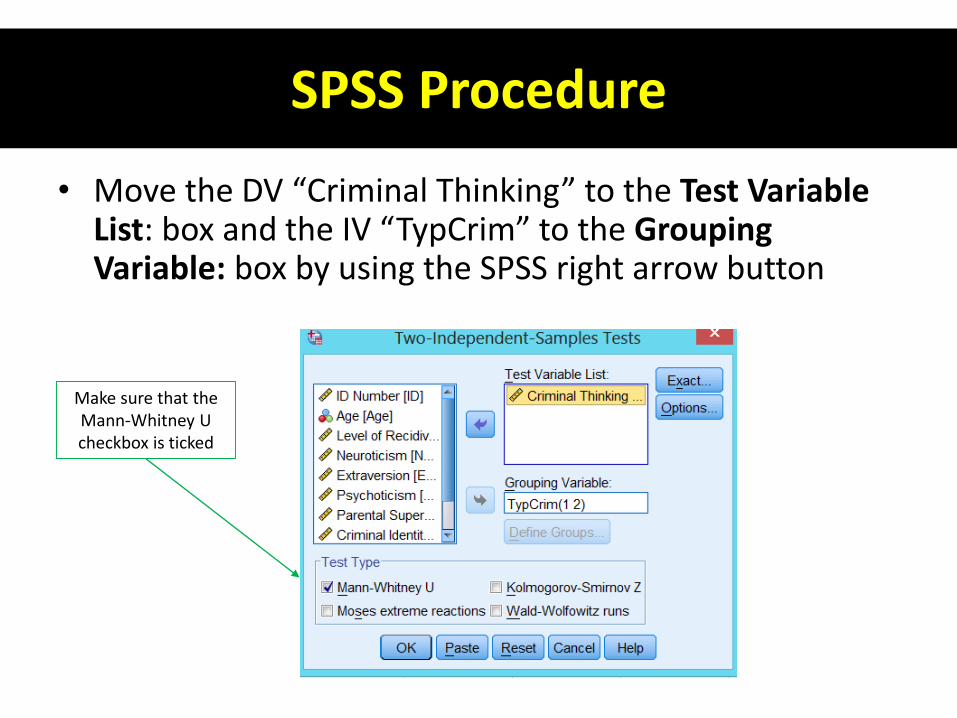
• Move the DV “Criminal Thinking” to the Test Variable List: box and the IV “TypCrim” to the Grouping Variable: box by using the SPSS right arrow button
Make sure that the Mann-Whitney U checkbox is ticked

SPSS Procedure
• Click on the Define Groupsbutton
• Enter 1 into the Group 1: box and enter 2 into the Group 2: box.
• Remember that we labelled the non-violent group as 1 and the violent group as 2
• Click Continue

SPSS Procedure
• Click on the Options button and then tick Descriptiveand Quartiles within the Statistics area
• Click Continue
• Then click OK button, which
will get SPSS to generate the
output for the Mann-Whitney
U Test
SPSS Output
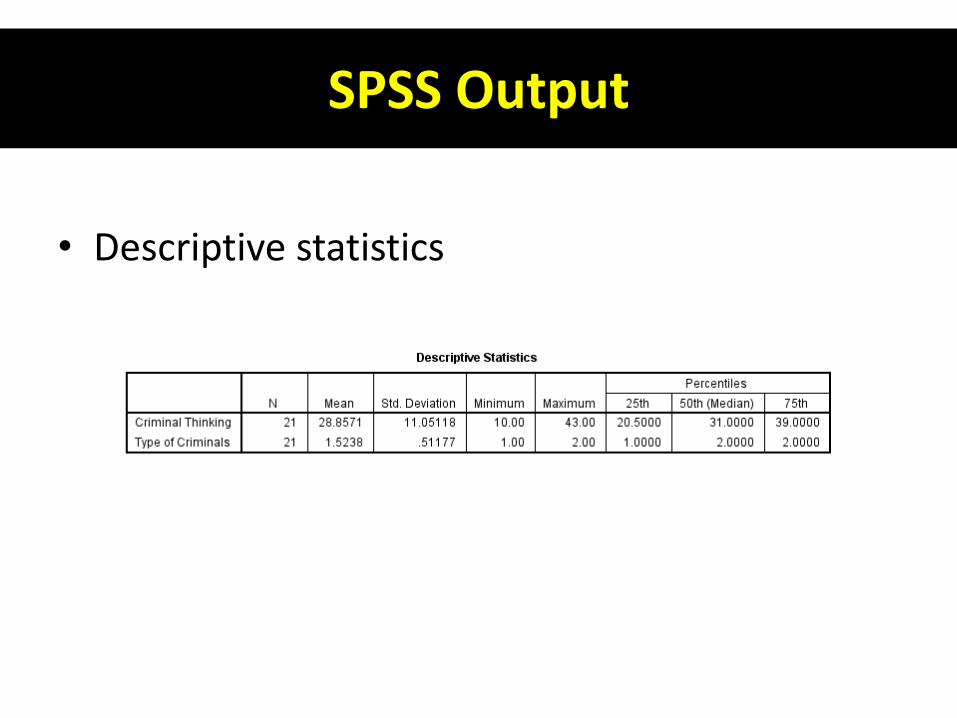
• Descriptive statistics
SPSS Output
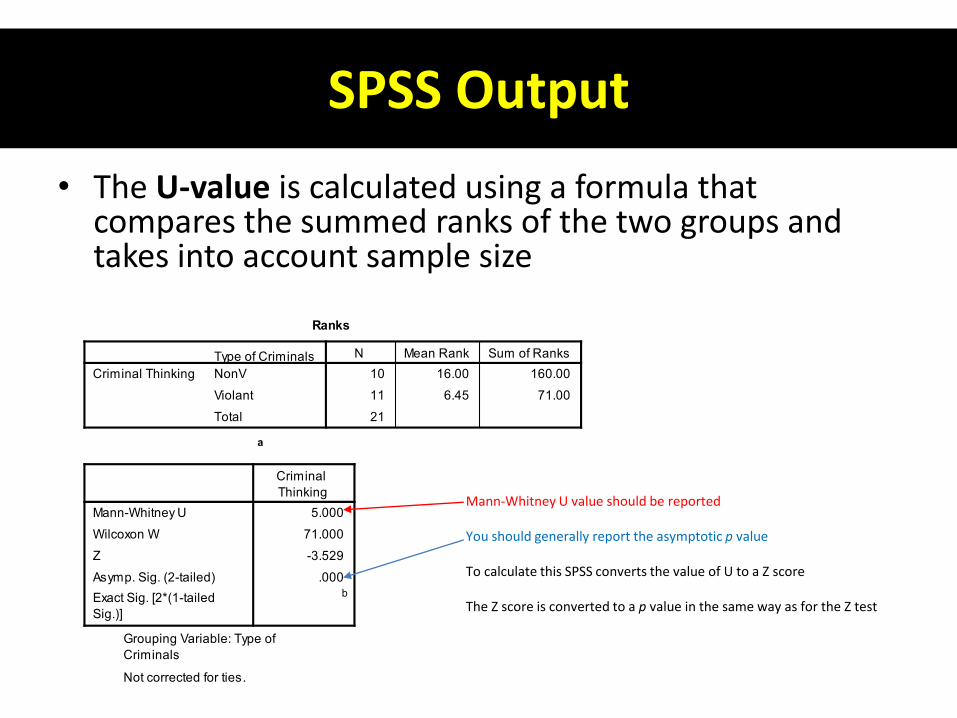
• The U-value is calculated using a formula that compares the summed ranks of the two groups and takes into account sample size
Mann-Whitney U value should be reported
You should generally report the asymptotic p value
To calculate this SPSS converts the value of U to a Z score
The Z score is converted to a p value in the same way as for the Z test
Effect Size
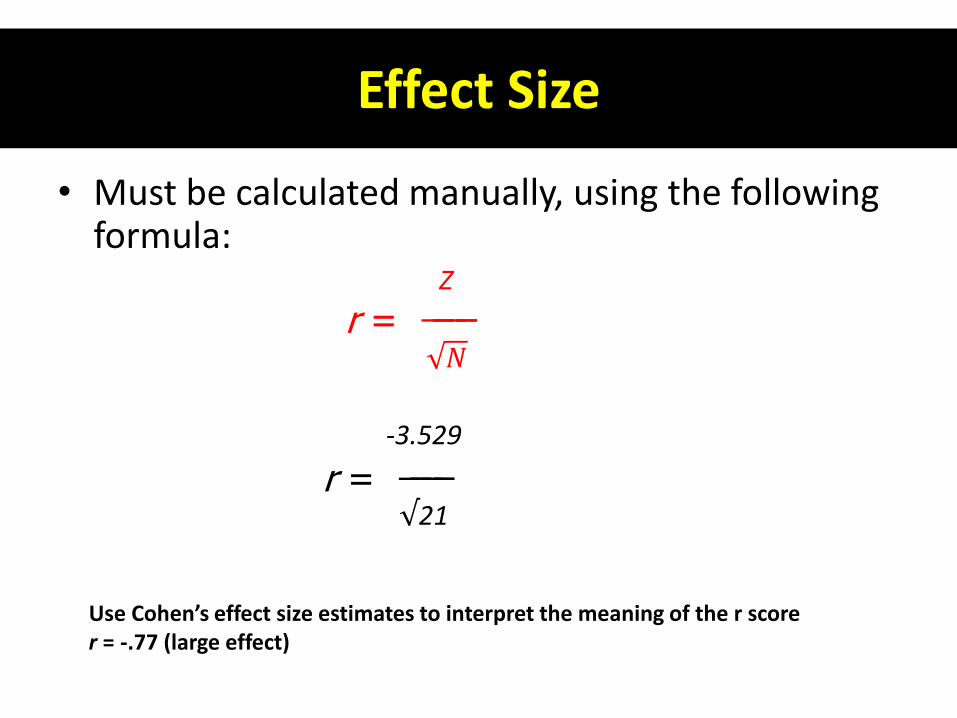
• Must be calculated manually, using the following formula:
Z
𝑁
-3.529
√21
r = ̶ ̶̶ ̶ ̶̶
r = ̶ ̶̶ ̶ ̶̶
Use Cohen’s effect size estimates to interpret the meaning of the r scorer = -.77 (large effect)

Reporting Mann-Whitney U
• As the data was skewed (not normally distributed) the most appropriate statistical test was Mann-Whitney U. Descriptive statistics showed that non-violent offenders (median = 39.00; mean rank = 16.00 ) scored higher on criminal thinking than violent offenders (median = 21.00; mean rank = 6.45). Mann-Whitney U-value was found to be statistically significant U = 5.00 (Z = -3.53), p < 0.01, and the difference between the violent and non-violent groups was large (r = -.77)
Kruskal-Wallis H
• The Kruskal-Wallis test is the nonparametric test equivalent to the one-way ANOVA, and an extension of the Mann-Whitney U test
– it allows the comparison of more than two independent groups

Kruskal-Wallis H
• Design: Non-parametric, – 1 continuous DV (psychoticism)
– 2 or more comparison groups (3 age groups) different participants in each group
• Purpose: To determine if there is an overall effect of prisoners’ age on level of psychoticism (i.e., if at least 2 groups are different from each other) while controlling for experiment-wise inflation of Type I error

SPSS Procedure
• Click Analyze
• Nonparametric Tests
• Legacy Dialogs
• K Independent Samples

SPSS Procedure
• Move the DV “Psychoticism” to the Test Variable List: box and the IV “Age” to the Grouping Variable: box by using the SPSS Right Arrow button
Make sure that the Kruskal-Wallis H
checkbox is ticked
SPSS Procedure
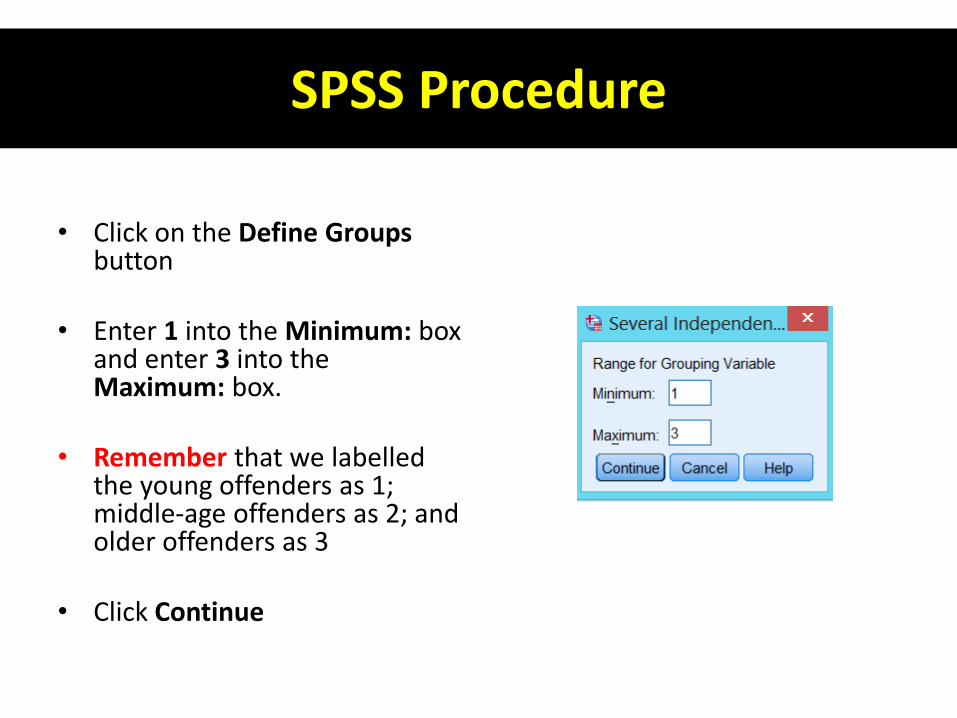
• Click on the Define Groupsbutton
• Enter 1 into the Minimum: box and enter 3 into the Maximum: box.
• Remember that we labelled the young offenders as 1; middle-age offenders as 2; and older offenders as 3
• Click Continue
SPSS Procedure
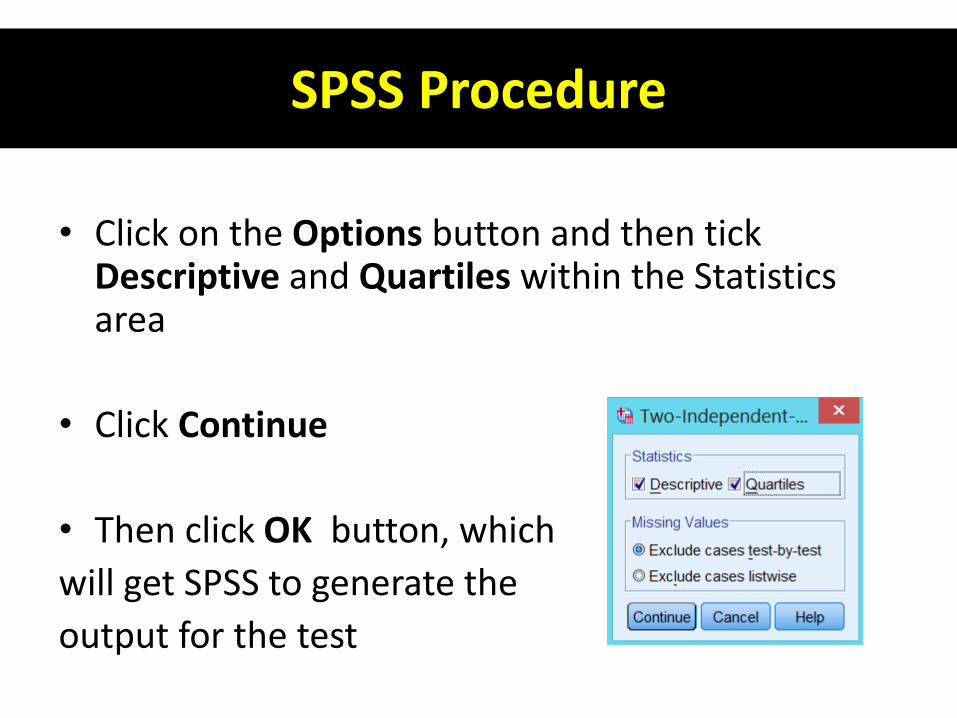
• Click on the Options button and then tick Descriptive and Quartiles within the Statistics area
• Click Continue
• Then click OK button, which
will get SPSS to generate the
output for the test

SPSS Output
• Descriptive statistics
SPSS Output
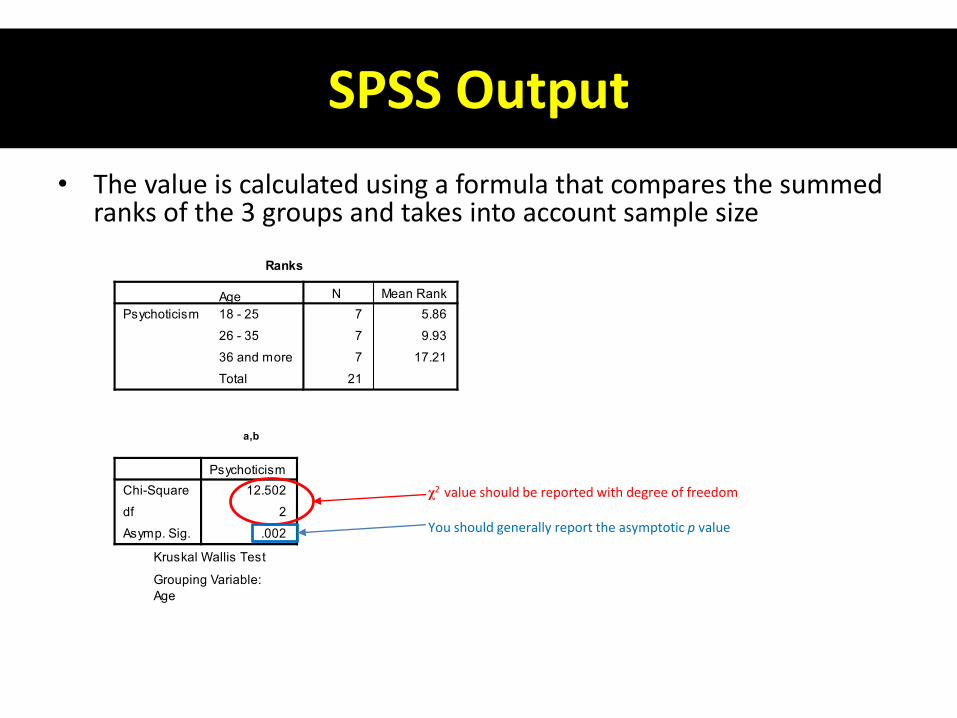
• The value is calculated using a formula that compares the summed ranks of the 3 groups and takes into account sample size
χ2 value should be reported with degree of freedom
You should generally report the asymptotic p value
Following-up a Significant K-W Result
• If overall K-W test is significant, conduct a series of Mann-Whitney tests to compare the groups (to investigate which groups significantly differ) but with corrections to control for inflation of type I error
• No option for this in SPSS, so manually conduct a Bonferroni correction ( = .05 / number of comparisons) and use the corrected -value to interpret the results– This example .05/3 = .016
Effect size
• SPSS has no options to calculate effect-size, so it must be done manually
• Kruskal-Wallis test gives you a chi-squared. However, its degree of freedom is more than 1, and thus it is not straightforward to convert the chi-squared into the effect size.
• Thus, we calculate the effect size for the post-hoc comparison (check Mann-Whitney U procedure)
Reporting Kruskal-Wallis
• In our example, we can report that there was a statistically significant difference between age groups on levels of psychoticism (H(2) = 12.50, p = 0.002) or (χ2 (2) = 12.50, p = 0.002) with a mean rank of 5.86 (median = 27) for young offenders, 9.93 (median = 35) for middle-age offenders and 17.21 (median = 27) for older offenders.
• Also report the post-hoc tests with effect size (see lecture on Mann-Whitney U)