non network options report notting hill supply area … non network options report notting hill...
TRANSCRIPT

RIT-D Report This report presents the network limitations at Notting Hill zone substation and the distribution feeder network within the Notting Hill Supply Area, including network options and technical characteristics of non-network options to alleviate those limitations.
Non Network Options Report Notting Hill Supply Area
Project № UE-DZA-N-17-001

RIT-D Non Network Options Report
Notting Hill Supply Area Project № UE-DZA-N-17-001 Page 1 of 34
This page has been intentionally left blank

RIT-D Non Network Options Report
Notting Hill Supply Area Project № UE-DZA-N-17-001
Page 2 of 34
Table of Contents
1 Approval and Document Control 3
2 Executive summary 4
3 Introduction 8
4 Identified Need 9
4.1 Network overview 9
4.2 Description of the identified need 10
4.3 Quantification of the identified need 16
5 Key assumptions in relation to the Identified Need 18
5.1 Method for quantifying the identified need 18
5.1.1 Expected unserved energy due to Station Risk 18
5.1.2 Expected unserved energy due to Distribution Feeder Risk 19
5.2 Forecast maximum demand 19
5.3 Characteristic of load profile 20
5.4 Load transfer capacity and supply restoration times 23
5.5 Plant failure rates 23
5.6 Discount rates 24
5.7 Plant ratings 24
5.8 Value of customer reliability 25
6 Potential credible options to address the identified need 26
7 Technical characteristics of non-network options 29
7.1 Size and location 29
7.2 Time of year and duration of support 29
7.3 Reliability 30
7.4 Operation 30
8 Submission 31
8.1 Request for submission 31
8.2 Next steps 31
9 Abbreviations and Glossary 32

RIT-D Non Network Options Report
Notting Hill Supply Area Project № UE-DZA-N-17-001
Page 3 of 34
1 Approval and Document Control
Project № UE-DZA-N-17-001 – Notting Hill Supply Area
VERSION DATE AUTHOR
1 8 April 2016 UE Network Planning
Amendment overview
New document

RIT-D Non Network Options Report
Notting Hill Supply Area Project № UE-DZA-N-17-001
Page 4 of 34
2 Executive summary
Summary
Notting Hill (NO) zone substation was commissioned in the late 1960s, as a two-transformer zone substation to provide capacity to the growing Notting Hill, Springvale and Clayton supply areas. This region has developed over time into a flourishing commercial and educational precinct with ongoing development and further growth opportunities. It is a strategically important part of Melbourne with it earmarked as the National Employment Cluster of Monash in the Victorian Government’s Plan - Melbourne Metropolitan Planning Strategy.1 The Notting Hill, Springvale and Clayton area covers approximately 20 square kilometres of UE’s electricity distribution area north of Whiteside Road, Rosebank Avenue and Osborne Avenue, east of Westall Road and Blackburn Road, west of Clayton Road and south of the Monash Freeway.
NO 66/22kV zone substation has connectivity to neighbouring zone substations at Springvale West (SVW), Glen Waverley (GW) and Clarinda (CDA), via the 22kV distribution feeder network. With committed large customer load increases, the spare capacity at NO and the neighbouring networks during high demand periods is diminishing. This limits the load transfer capability away from NO onto neighbouring networks. With NO operating well above its firm rating during periods of high demand, some customers could potentially be without electricity supply in the event of a transformer failure at NO.
UE has identified the following two potential credible network options that are technically comparable to address the identified need:
1. Install a third 20/33MVA 66/22kV transformer, one 66 kV bus tie circuit breaker and a third 22 kV bus at Notting Hill zone substation with two new 22 kV distribution feeders for service by December 2017. The estimated capital cost of this option is $ 6.0 million (±30%) in 2015-16 $AUD.
2. Install a fifth 20/33MVA 66/22kV transformer, one 66 kV bus tie circuit breaker and a new 66kV bus at Springvale/Springvale West zone substation with new 22 kV distribution feeders, to offload NO feeders for service by December 2017. The estimated capital cost of this option is $ 8.0 million (±30%) in 2015-16 $AUD.
Alternatively, demand reduction or embedded generation up to 4.5 MW in summer 2017-18 after considering 11.3 MW of available transfer capacity, then a minimum of 2.5 MW per annum (averaged over 5 years) thereafter to manage the diminishing load transfer capability and load growth to maintain reliable supply to the Notting Hill area.
1 http://www.planmelbourne.vic.gov.au/

RIT-D Non Network Options Report
Notting Hill Supply Area Project № UE-DZA-N-17-001
Page 5 of 34
Purpose
This Non Network Options Report has been prepared by UE in accordance with the requirements of clause 5.17.4(e) of the National Electricity Rules (NER).
This report represents the first stage of the consultation process in relation to the application of the RIT-D on potential credible options to address the network limitations in the Notting Hill supply area.
This report:
Provides background information on the network capacity limitations at NO zone substation.
Identifies the need which UE is seeking to address, together with the assumption used in identifying that need.
Describes the credible options that UE currently considers may address the identified need, including for each:
o Its technical definitions;
o The estimated commissioning date; and
o The total indicative cost (including capital and operating costs).
Sets out the technical characteristics that a non-network option would be required to deliver in order to address the identified need.
An invitation to registered participants and interested parties to make submission on credible options to address the identified need.
The need for investment
UE’s NO zone substation supply approximately 3,800 customer premises in the Notting Hill supply area. By number, 80% of these are residential and 20% are commercial/industrial. By energy volume, 80% is consumed by commercial/industrial customers and 20% by residential.
The area is generally well developed but has visible signs of ongoing building construction and development. The area includes the designated Major Activity Centres of Springvale and Clayton, as well as the Monash University / Health Research Precinct which is designated as a Specialised Activity Centre. The large customers supplied in the area include Monash University, Australian Synchrotron (Supplied from SV) and two major customer data centres. Both the data centres have recently applied to increase their demand, including the requirement for a dedicated supply feeder as well as a backup feeder. Monash Medical Centre is also proceeding with an expansion to establish a new Children’s Hospital due to open in early 2017 and the development of a new retail centre is also planned. Major railway works are also proposed in the area.
NO is a summer-critical zone substation, that is, it experiences high demands during the summer months. The figure below depicts the historical actual maximum demands, 10% PoE summer maximum demand forecast together with the zone substation’s summer (N) and (N-1) ratings representing all transformers in service and one transformer out of service respectively.

RIT-D Non Network Options Report
Notting Hill Supply Area Project № UE-DZA-N-17-001
Page 6 of 34
Figure 1 – Forecast maximum demand against station ratings for NO zone substation
The figure above shows that the actual maximum demand at NO zone substation has been above its summer (N-1) rating for every summer since 2010-11. Given a forecast high demand growth over the next five years (predominantly driven by committed large customer connections), there could be a significant amount of energy-at-risk should a forced transformer outage occur during periods of high demand.
The forecast impact of the ‘identified need’ discussed above is presented in Figure 2.
0
10
20
30
40
50
60
70
80
2010-11 2011-12 2012-13 2013-14 2014-15 2015-16 2016-17 2017-18 2018-19 2019-20 2020-21 2021-22 2022-23 2023-24 2024-25
Lo
ad
(M
VA
)
Year
NO Summer Maximum Demand
Actual Demand 10% PoE Forecast Demand 50% PoE Forecast Demand
Summer (N) Cyclic Rating Summer (N-1) Cyclic Rating Weather corrected 10% PoE

RIT-D Non Network Options Report
Notting Hill Supply Area Project № UE-DZA-N-17-001
Page 7 of 34
Figure 2 – Forecast impact of the identified need
Presently, there are no 66 kV sub-transmission line circuit breakers at NO zone substation. Therefore, a forced outage of one of the sub-transmission lines into NO zone substation would also lead to an outage of one of the NO zone substation transformers. However, the probability of such an outage is low and the restoration time is expected to be shorter compared to a transformer outage.
Next steps
UE is aware that there may be potential credible non-network options to address the identified need. UE therefore welcomes written submissions from registered parties and interested parties to address the issues described in this consultation report.
All enquiries should be directed to the United Energy Manager Network Planning at [email protected] quoting reference number UE-DZA-N-17-001.
Detailed submissions must be emailed to our tender box at [email protected] by the Closing Date on 8th July 2016 by 5pm (Australian Eastern Standard Time) quoting reference number UE-DZA-N-17-001.
All submissions will be published on UE’s website.2
2 If you do not want your submission to be publically available, please clearly stipulate this at the time of lodgment. However we do
require a cover letter to be published on our web-site.
$-
$200,000
$400,000
$600,000
$800,000
$1,000,000
$1,200,000
$1,400,000
$1,600,000
$1,800,000
$2,000,000
0
5000
10000
15000
20000
25000
30000
35000
40000
45000
2016-17 2017-18 2018-19 2019-20 2020-21 2021-22 2022-23 2023-24 2024-25
Exp
ecte
d V
alu
e o
f U
nserv
ed
En
erg
y (
$)
Exp
ecte
d U
nserv
ed
En
erg
y (
kW
h)
an
d H
ou
rs a
t R
isk (
hrs
)
Year
Forecast impact of limitation at NO supply area
Hours at risk above N-1 Expected Unserved Energy (kWhr) Expected Value of Unserved Energy ($)

RIT-D Non Network Options Report
Notting Hill Supply Area Project № UE-DZA-N-17-001
Page 8 of 34
3 Introduction
This Non Network Options Report (NNOR) has been prepared by United Energy (UE) in accordance with the requirements of clause 5.17.4(e) of the National Electricity Rules (NER).
This report represents the first stage of the consultation process in relation to the application of the Regulatory Investment Test for Distribution (RIT-D) on potential credible options to address the capacity limitations at Notting Hill (NO), referred to in this report as the Notting Hill supply area.
The need for investment and the possible options for addressing capacity limitations at NO has been foreshadowed in UE’s 2015 Distribution Annual Planning Report (DAPR).3
This NNOR:
Provides background information on the network capacity limitations at NO zone substation.
Identifies the need which UE is seeking to address, together with the assumption used in identifying that need.
Describes the credible options that UE currently considers may address the identified need, including for each:
o Its technical definitions;
o The estimated commissioning date; and
o The total indicative cost (including capital and operating costs).
Sets out the technical characteristics that a non-network option would be required to deliver in order to address the identified need.
An invitation to registered participants and interested parties to make submission on credible options to address the identified need.
3 UE: Distribution Annual Planning Report. Available at: https://www.unitedenergy.com.au/industry/mdocuments-library/#reports

RIT-D Non Network Options Report
Notting Hill Supply Area Project № UE-DZA-N-17-001
Page 9 of 34
4 Identified Need
4.1 Network overview
Notting Hill (NO) zone substation is equipped with two 20/30 MVA 66/22 kV transformers and provides electricity supply to approximately 3,800 customers. The areas supplied include Notting Hill and parts of Clayton. Neighbouring Springvale (SV) and Springvale West (SVW) zone substations supply electricity to approximately 11,700 customers in Clayton and Springvale. It is a strategically important part of Melbourne with it earmarked as the National Employment Cluster of Monash in the Victorian Government’s Plan - Melbourne Metropolitan Planning Strategy. The Notting Hill supply area covers approximately 20 square kilometres of UE’s distribution area north of Whiteside Road, Rosebank Avenue and Osborne Avenue, east of Westall Road and Blackburn Road, west of Clayton Road and south of the Monash Freeway. A total of about 15,500 customers supplied within the area forms about 2.4% of UE’s total customer base. When counted by number, 80% of these are domestic customers and 20% are commercial/industrial, however most of the energy supplied (80%) is consumed by commercial/industrial customers.
Figure 3 – Geographical areas supplied by Notting Hill (and Springvale/Springvale West) zone substations
NO zone substation was established in the late 1960s.
Figure 4 below presents the Single Line Diagram of NO zone substation depicting the present configuration.

RIT-D Non Network Options Report
Notting Hill Supply Area Project № UE-DZA-N-17-001
Page 10 of 34
Figure 4 – Existing configuration of NO (schematic view)
NO zone substation is supplied via two 66 kV sub-transmission lines - one from Springvale Terminal Station (SVTS) and the other from Glen Waverly (GW) zone substation. Presently, there are no 66 kV sub-transmission line circuit breakers at NO zone substation. Therefore, a forced outage of one of the sub-transmission line into NO zone substation would also lead to an outage of one of the NO zone substation transformers. However, the probability of such outage is low and the restoration time is expected to be shorter compared to a transformer outage.
4.2 Description of the identified need
The identified need has been split into two major categories:
1. Station Risk - It includes energy at risk (under N-1 condition) due to:
Insufficient capacity at NO zone substation;
Incremental energy at risk at neighbouring zone substations following load transfers from NO;
Incremental energy at risk at neighbouring distribution feeder network following load transfers from NO; and

RIT-D Non Network Options Report
Notting Hill Supply Area Project № UE-DZA-N-17-001
Page 11 of 34
Insufficient transfer capability away from NO, leading to excessive load shedding in the NO network.
2. Distribution Feeder Risk – It includes energy at risk due to:
Thermal limitation at Notting Hill and its neighbouring HV distribution network under system normal and switching operation during high demand periods.
4.2.1 Station Risk
4.2.1.1 Insufficient capacity at Notting Hill zone substation
NO is a summer critical zone substation with two transformers and a name plate rating of 60 MVA during the summer season.
The figure below depicts the historical actual maximum demands, 10% and 50% PoE maximum demand forecasts together with the zone substation’s operational ratings.
Figure 5 – Forecast maximum demand against station ratings for NO zone substation
As illustrated above:
The historic actual maximum demand at NO zone substation has been above its N-1 rating of 36.5 MVA for every summer since 2010-11, but below its N cyclic rating of 74.0 MVA.
Anticipating high demand growth over the next five years primarily driven by committed large customer connections.
0
10
20
30
40
50
60
70
80
2010-11 2011-12 2012-13 2013-14 2014-15 2015-16 2016-17 2017-18 2018-19 2019-20 2020-21 2021-22 2022-23 2023-24 2024-25
Lo
ad
(M
VA
)
Year
NO Summer Maximum Demand
Actual Demand 10% PoE Forecast Demand 50% PoE Forecast Demand
Summer (N) Cyclic Rating Summer (N-1) Cyclic Rating Weather corrected 10% PoE

RIT-D Non Network Options Report
Notting Hill Supply Area Project № UE-DZA-N-17-001
Page 12 of 34
The 10% and 50% PoE maximum demand4 at NO zone substation is expected to exceed the zone substation’s (N-1) cyclic rating in summer 2016-17, for about 42 hours5.
In other words, in the absence of any mitigation action, inadequate capacity at the zone substation would be expected to lead to supply interruption from summer 2016-17, under system N-1 conditions (i.e. with any one transformer at NO out of service).
4.2.1.2 Incremental energy at risk in neighbouring zone substations
Springvale (SV), Springvale West (SVW) and Glen Waverley (GW) are neighbouring zone substations to NO with load transfer capabilities at the 22kV distribution network level. Clarinda (CDA) is also a neighbouring zone substation to NO, operating above its N-1 rating during maximum demand periods. Due to thermal limitations of the CDA distribution feeders, no load can be transferred away from NO onto CDA from summer 2016-17. Therefore no unserved energy at CDA has been accounted for in the energy-at-risk calculations.
SV/ SVW is a summer critical combined zone substation with four transformers and a Summer N cyclic rating of 160 MVA. The figure below depicts the historical actual maximum demands, 10% and 50% PoE maximum demand forecasts together with the station’s operational ratings.
Figure 6 – Forecast maximum demand against station ratings for SV / SVW zone substation
4 This forecast is also referred to as having a 10% probability of exceedance. It represents a forecast that is expected, on average, to
be exceeded once in ten years. 5 After considering load transfers.
0
20
40
60
80
100
120
140
160
180
2010-11 2011-12 2012-13 2013-14 2014-15 2015-16 2016-17 2017-18 2018-19 2019-20 2020-21
Lo
ad
(M
VA
)
Year
SV/SVW Summer Maximum Demand
Actual Demand 10% PoE Demand Forecast 50% PoE Demand Forecast
Summer (N) Cyclic Rating Summer (N-1) Cyclic Rating

RIT-D Non Network Options Report
Notting Hill Supply Area Project № UE-DZA-N-17-001
Page 13 of 34
As illustrated above the historic actual maximum demand at SV / SVW zone substation has been below its N cyclic rating of 160 MVA. However, the 10% PoE maximum demand forecast is expected to exceed zone substation’s (N-1) cyclic rating of 121.1 MVA from summer 2017-18 and from 2019-20 under the 50% PoE maximum demand forecast.
GW is also a summer critical zone substation with three 66/22 kV transformers with a combined cyclic rating of 103.4 MVA during summer season. The figure below depicts the historical actual maximum demands, 10% and 50% PoE maximum demand forecasts together with the station’s operational ratings.
Figure 7 – Forecast maximum demand against station ratings for GW zone substation
As illustrated above the historic actual maximum demand at GW zone substation has been below its N-1 cyclic rating of 68.9 MVA. However, the 10% PoE maximum demand forecast is expected to exceed the zone substation’s N-1 cyclic rating from summer 2016-17.
The amount of unserved energy in the SV / SVW and GW supply areas increase after load is transferred away from NO (following the loss of one of the NO transformers). Therefore, the incremental risk due to load being transferred away from NO to neighbouring network has been included in the risk assessment calculation.
4.2.2 Incremental energy at risk in neighbouring distribution network
Following a major outage of any one of the two transformers at NO zone substation, only part of customers’ supply can be restored via the distribution network from neighbouring zone substations at SVW and GW from 2016-17. As a result, some customers could potentially be without electricity supply until the capacity in the neighbouring network becomes available as the demand
0
20
40
60
80
100
120
2010-11 2011-12 2012-13 2013-14 2014-15 2015-16 2016-17 2017-18 2018-19 2019-20 2020-21
Lo
ad
(M
VA
)
Year
GW Summer Maximum Demand
Actual Demand 10% PoE Demand Forecast 50% PoE Demand Forecast
Summer (N) Cyclic Rating Summer (N-1) Cyclic Rating

RIT-D Non Network Options Report
Notting Hill Supply Area Project № UE-DZA-N-17-001
Page 14 of 34
subsides. With forecast demand growth, the available load transfer capability reduces further, leaving greater numbers of customers exposed to the risk of supply interruption for longer periods of time as shown in table below.
Table 1 – Forecast load at risk at 10% PoE demand conditions
Year Demand Forecast6
(MVA)
Transfer Capability7
(MVA)
Load at Risk8after
transfers
(MVA)
Hours at Risk
(Hours)
2016-17 53.2 11.9 5.2 42
2017-18 57.4 11.3 9.6 57
2018-19 61.6 10.9 14.1 103
2019-20 63.1 11.0 15.7 126
2020-21 64.8 10.4 17.8 162
2021-22 66.6 9.9 20.1 208
2022-23 67.5 9.4 21.6 242
2023-24 68.1 8.9 22.7 271
2024-25 70.0 8.5 25.0 339
As shown above the load transfer capability away from NO is less than that required to fully restore NO load following the loss of one zone substation transformer (i.e. N-1) during periods of high demand for 42 hours (at 10% PoE demand conditions) in 2016-17.
4.2.3 Distribution Feeder Risk
Utilisation of critical distribution feeders within the NO supply area and neighbouring SV / SVW and GW supply areas are presented in Figure 8.
Utilisation describes the ratio of the feeder maximum demand to the summer cyclic rating (N) under normal operating conditions.
6 The maximum demand forecasts are based on the expected (base) economic growth scenario.
7 Load transfer capability away from NO.
8 Load-at-risk is the amount of load that would not be supplied due to a major outage of a NO zone substation transformer. These
represent ‘Demand minus Load Transfer Capability minus (N-1) cyclic rating of NO’, reflecting the impact of load transfer capability.

RIT-D Non Network Options Report
Notting Hill Supply Area Project № UE-DZA-N-17-001
Page 15 of 34
Figure 8 – Feeder utilisation in summer 2017-18 (10% PoE maximum demand)
As illustrated above:
The loading on NO 2 is forecast to be 97% utilised in summer 2017-18.
The loading on SVW 41 and CDA 11 is forecast to be reaching 90% utilised in summer 2017-18.
Emerging capacity limitations in distribution feeders are managed operationally by transferring load away to neighbouring feeders at maximum demand periods. For instance, some load can be transferred away from NO 4 and NO 5 to GW 10. Such actions are adopted usually as a short-term mitigation action but this action merely reduces the load transfer capability further. Losing a highly utilised NO feeder during high demand periods, may lead to supply interruption for some customers until either spare capacity becomes available in neighbouring feeders or the faulty asset is repaired.
4.2.4 Closing comments on the need for investment
The following limitations are to be addressed by this RIT-D:
From summer 2016-17, inadequate load transfer capability between NO and the neighbouring network is expected to lead to supply interruption, following the loss of a transformer at NO zone substation during very high demand periods;
There will be an increase in energy-at-risk in the neighbouring zone substations and distribution network, following load transfers from NO; and
As shown in Figure 8, maximum loading of a number of distribution feeders in the NO, CDA, SVW and GW supply areas are forecast to exceed their thermal capability within the
0%
10%
20%
30%
40%
50%
60%
70%
80%
90%
100%
110%
CDA 11 GW 10 NO 2 SVW 41
Uti
lisati
on
(%
)
Distribution feeder utilisation expected in summer 2017-18

RIT-D Non Network Options Report
Notting Hill Supply Area Project № UE-DZA-N-17-001
Page 16 of 34
next five years under system normal operation. Losing highly utilised NO feeders during a period of high demand will lead to supply interruption for some customers.
The forecast impact of the total ‘identified need’ discussed above is presented in Figure 9.
Figure 9 – Forecast impact of the identified need
In light of the rapidly growing demand at NO and the increase in load-at-risk, UE has examined a number of options to alleviate the identified need. These options are outlined in Section 6.
4.3 Quantification of the identified need
The forecast impact of the identified need discussed in Section 4.2 is presented in Table 2.
The table shows:
Load-at-risk, which is the MVA load shedding required to avoid network limitation under the 10% PoE maximum demand forecast after taking load transfer capability into consideration.
Hours-at-risk, which is the number of hours the demand at NO zone substation is expected to exceed its N-1 thermal rating after taking load transfer capability into consideration.
$-
$200,000
$400,000
$600,000
$800,000
$1,000,000
$1,200,000
$1,400,000
$1,600,000
$1,800,000
$2,000,000
0
5000
10000
15000
20000
25000
30000
35000
40000
45000
2016-17 2017-18 2018-19 2019-20 2020-21 2021-22 2022-23 2023-24 2024-25
Exp
ecte
d V
alu
e o
f U
nserv
ed
En
erg
y (
$)
Exp
ecte
d U
nserv
ed
En
erg
y (
kW
h)
an
d H
ou
rs a
t R
isk (
hrs
)
Year
Forecast impact of limitation at NO supply area
Hours at risk above N-1 Expected Unserved Energy (kWhr) Expected Value of Unserved Energy ($)

RIT-D Non Network Options Report
Notting Hill Supply Area Project № UE-DZA-N-17-001
Page 17 of 34
Customer value of lost load is the cost of the expected unserved energy, obtained by multiplying the expected unserved energy9 (kWh) by the Value of Customer Reliability (VCR $/kWh) using a detailed assessment of risk which includes consideration of the load transfer capability. The Station Risk and Distribution Feeder Risk, when combined together reflects the total value of energy-at-risk for the identified need described in Section 4.2.
Table 2 – Forecast network limitation
Year Load at Risk
(MVA)
Hours at Risk
(Hours)
Expected value of unserved energy
($,000)
Station Risk Distribution Feeder Risk
Total Risk
2016-17 5.2 42 172 142 314
2017-1810
9.6 57 302 146 448
2018-19 14.1 103 498 149 647
2019-20 15.7 126 638 153 791
2020-21 17.8 162 817 153 971
2021-22 20.1 208 1,046 153 1,200
2022-23 21.6 242 1,219 153 1,372
2023-24 22.7 271 1,365 153 1,519
2024-25 25.0 339 1,705 153 1,859
9 The expected unserved energy is the portion of the energy-at-risk after taking into account the probability of an outage of critical
plants, combined with 30% weighting of the 10% PoE demand and 70% weighting of the 50% PoE demand, as described in Section 5.3
10
Year of preferred network augmentation
RIT-D Non Network Options Report
Notting Hill Supply Area Project № UE-DZA-N-17-001
Page 18 of 34
5 Key assumptions in relation to the Identified Need
5.1 Method for quantifying the identified need
The identified need that is to be addressed by this RIT-D, presented in Section 4.3, is comprised of the following components:
Station Risk
o Expected unserved energy due to insufficient N-1 capacity at NO zone substation after considering load transfer to neighbouring zone substations; and
o Expected incremental unserved energy at neighbouring zone substations and distribution feeder network, following load transfers away from NO.
Distribution Feeder Risk
o Expected unserved energy due to the limitations in the distribution feeders’ capacity within the NO and neighbouring supply areas during high demand periods under system normal and feeder N-1 conditions.
The section below summarises the method adopted to quantify the abovementioned risks.
5.1.1 Expected unserved energy due to Station Risk
The expected unserved energy due to insufficient capacity at NO and neighbouring zone substations and neighbouring distribution feeder was calculated as follows:
1. Identify the expected unserved energy at NO zone substation under system normal conditions (i.e. N condition) and following the loss of any one of the two NO zone substation transformers (i.e. N-1 condition) considering load transfer capability.
2. Identify the incremental expected unserved energy at neighbouring zone substations (SV/SVW and GW) due to transferring load away from NO, following the loss of one of the NO zone substation transformer. This was achieved by comparing the expected unserved energy at neighbouring zone substations before load transfers (by considering the transformer failure rate) with the expected unserved energy at neighbouring zone substations after load transfers (by considering the transformer failure rate).
3. Identify the incremental expected unserved energy on the neighbouring distribution feeders due (SV/SVW and GW) due to transferring load away from NO, following the loss of one of the NO zone substation transformer. This was achieved by comparing the expected unserved energy on neighbouring distribution feeders before load transfers (by considering the transformer failure rate) with the expected unserved energy on neighbouring zone substations after load transfers (by considering the transformer failure rate).
4. Identify the expected unserved energy on the NO distribution feeder network due to additional load-shedding following the loss of any one of the two NO zone substation transformers (i.e. N-1 condition) due to the discrete size of the load shedding blocks.

RIT-D Non Network Options Report
Notting Hill Supply Area Project № UE-DZA-N-17-001
Page 19 of 34
The combined expected unserved energy from (1) to (4) represents the expected unserved energy that is to be addressed due to insufficient capacity at NO zone substation under the N-1 condition.
5.1.2 Expected unserved energy due to Distribution Feeder Risk
The expected unserved energy due to distribution feeder limitations was calculated as follows:
1. Identify the expected unserved energy in the distribution feeder network at NO and neighbouring feeders under status-quo for each credible option.
2. Identify the expected unserved energy in the distribution feeder network at NO and neighbouring feeders following the implementation of each potential credible option considered in this RIT-D (i.e. residual risks).
3. Identify the market benefits realised under each potential credible option by comparing (1) with (2).
The highest market benefits realised under each credible option represents the expected unserved energy that is to be addressed due to limitations in the distribution feeder network.
5.2 Forecast maximum demand
Zone substation
Forecasts of the 10% PoE and 50% PoE summer maximum demand at NO zone substation is presented in Figure 10 below. This forecast are based on the base (expected) economic growth scenario.
Figure 10 – 10% PoE summer maximum demand forecasts at NO, SV/SVW and GW zone substations
0
20
40
60
80
100
120
140
160
2015-16 2016-17 2017-18 2018-19 2019-20 2020-21 2021-22 2022-23 2023-24 2024-25
Maxim
um
dem
an
d (
MV
A)
Forecast 10 % PoE summer maximum demand
NO SV/SVW GW

RIT-D Non Network Options Report
Notting Hill Supply Area Project № UE-DZA-N-17-001
Page 20 of 34
Figure 11 – 50% PoE summer maximum demand forecasts at NO, SV/SVW and GW zone substations
Distribution feeders
Average annual growth in the summer maximum demand of the distribution feeders in the NO, SV/SVW and CDA supply areas are presented in Table 3.
Table 3 – Annual growth rate of distribution feeders
Distribution feeders Annual growth rate at 10% PoE Annual growth rate at 50% PoE
NO 2 1.5% 1.4%
CDA 11 2.4% 2.3%
SVW 41 3.0% 2.8%
GW 3, GW 5 and GW 10 2.7% 2.5%
Average UE growth rate (for comparison) 1.4% 1.2%
The amount of expected unserved energy was estimated by taking 30% weighting of the unserved energy at 10% PoE demand forecast and 70% weighting of the unserved energy at 50% PoE demand forecast.
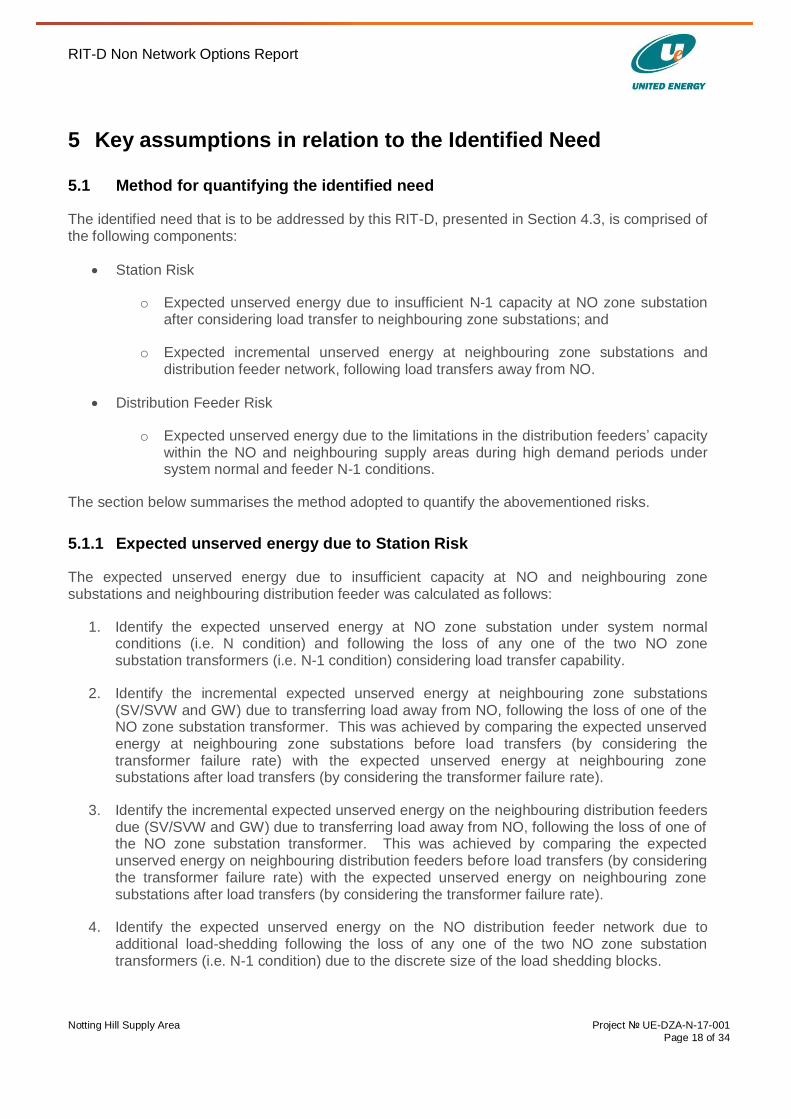
5.3 Characteristic of load profile
NO zone substation provides electricity supply to approximately 3,800 customers in the areas of Notting Hill and Clayton North. The substation load is characterised primarily of commercial and industrial loads with some residential loads. The very high demand events occur during the summer season i.e. in the month of December, January and February as illustrated in Figure 12.
0
20
40
60
80
100
120
140
2015-16 2016-17 2017-18 2018-19 2019-20 2020-21 2021-22 2022-23 2023-24 2024-25
Maxim
um
dem
an
d (
MV
A)
Forecast 50 % PoE summer maximum demand
NO SV/SVW GW
RIT-D Non Network Options Report
Notting Hill Supply Area Project № UE-DZA-N-17-001
Page 21 of 34
Figure 12 – Load profile at NO zone substation (2013-14)
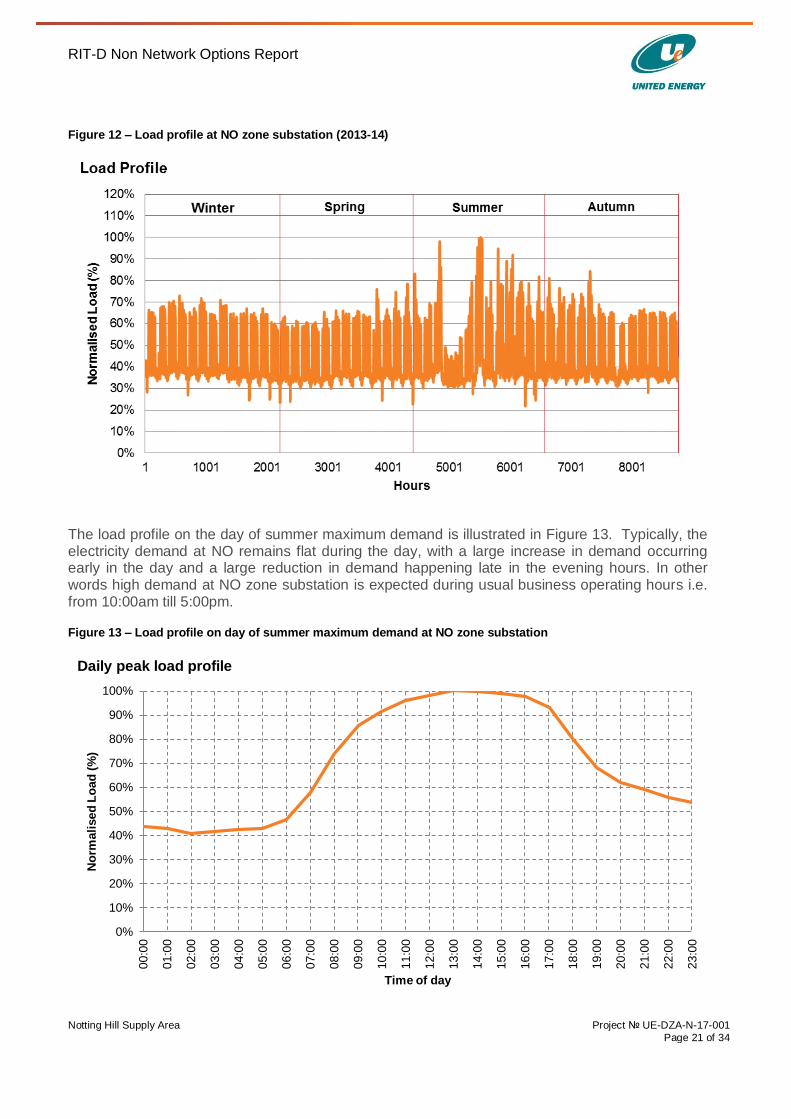
The load profile on the day of summer maximum demand is illustrated in Figure 13. Typically, the electricity demand at NO remains flat during the day, with a large increase in demand occurring early in the day and a large reduction in demand happening late in the evening hours. In other words high demand at NO zone substation is expected during usual business operating hours i.e. from 10:00am till 5:00pm.
Figure 13 – Load profile on day of summer maximum demand at NO zone substation
0%
10%
20%
30%
40%
50%
60%
70%
80%
90%
100%
00:0
0
01:0
0
02:0
0
03:0
0
04:0
0
05:0
0
06:0
0
07:0
0
08:0
0
09:0
0
10:0
0
11:0
0
12:0
0
13:0
0
14:0
0
15:0
0
16:0
0
17:0
0
18:0
0
19:0
0
20:0
0
21:0
0
22:0
0
23:0
0
No
rmali
sed
Lo
ad
(%
)
Time of day
Daily peak load profile

RIT-D Non Network Options Report
Notting Hill Supply Area Project № UE-DZA-N-17-001
Page 22 of 34
Figure 14 shows the normalised load duration curves at NO zone substation for the last five summers.
Figure 14 – Historical load duration curves at NO zone substation
The figure above shows that the load characteristics can vary from year to year due to the sensitivity of the maximum demand to temperature, however the shape is consistent. It also shows that the actual demand in the previous years remained above 60% of the maximum demand for 20-30% of the year.
To account for variability in load characteristics, UE has prepared load traces based on historical load traces that are characterised by 10% PoE and 50% PoE demand profiles (or close to) at NO zone substation.
Based on this approach, the expected unserved energy at NO zone substation was estimated using the expected 2009-1011 and 2013-1412 historical traces.
The above-mentioned approach was adopted to estimate the expected incremental unserved energy at SV/SVW and GW zone substations and distribution networks. The SV/SVW and GW load traces were therefore based on the following base years:
11
The 2009-10 historic load trace characterised (or close to) a 50% PoE maximum demand profile at NO. 12
The 2013-14 historic load trace characterised (or close to) a 10% PoE maximum demand profile at NO.
0%
10%
20%
30%
40%
50%
60%
70%
80%
90%
100%
0% 10% 20% 30% 40% 50% 60% 70% 80% 90% 100%
Pro
po
rati
on
of
maxim
um
dem
an
d
Proportion of time
Load duration curve
2010-11 2011-12 2012-13 2013-14 2014-15

RIT-D Non Network Options Report
Notting Hill Supply Area Project № UE-DZA-N-17-001
Page 23 of 34
Table 4 – Base years used to develop load traces
Zone substation Base year
10% PoE load trace
Base year
50% PoE load trace
NO 2009-10 2013-14
SV/SVW 2009-10 2013-14
GW 2009-10 2013-14
5.4 Load transfer capacity and supply restoration times
The load transfer capability between NO and neighbouring network is estimated to be 11.9 MVA for summer 2016-17.
Future load transfer capability between NO and neighbouring network were estimated by considering the available spare capacity on neighbouring distribution feeders (by comparing the forecast maximum demand and the feeder rating), and the likely transferability based on network configuration.
For the purpose of this RIT-D, the customers’ supply is restored within 60 minutes following the loss of a major plant (i.e. zone substation transformer / distribution feeders) when the load transfer capability is sufficient to restore supply. This figure represents UE’s current reliability performance target for CAIDI.13
5.5 Plant failure rates
The base (average) reliability data adopted in this assessment are presented in tables below. The data is derived from the Australian CIGRE Transformer Reliability Survey carried out in 1995 and UE’s observed network performance since 1994-95.
Table 5 – Summary of transformer outage rates
Major plant item: zone substation transformer Interpretation
Transformer failure rate (major fault)
0.5% per annum A major failure is expected to occur once per 200 transformer-years.
Duration of outage (major fault) 2190 hours
A total of 3 months is required to repair / replace the transformer, during which time the transformer is not available for service.
Transformer failure rate (minor fault) 1.0% per annum
A minor failure is expected to occur once per 100 transformer-years.
Duration of outage (minor fault) 48 hours
A total of 48 hours is required to repair the transformer, during which time the transformer is not available for service.
13
CAIDI represents the average restoration time for each outage.

RIT-D Non Network Options Report
Notting Hill Supply Area Project № UE-DZA-N-17-001
Page 24 of 34
Table 6 – Summary of distribution feeder outage rates
Major plant item: distribution feeder Interpretation
Distribution feeder failure rate per km (major fault)
7 faults per 100 km per annum The average sustained failure rate of UE’s distribution feeder is 7.0 faults per 100 km per year.
Duration of outage (major fault)
4 hours
A total of 4 hours is required to repair / replace the feeder (or sections of feeder), during which time the feeder (or sections of the feeder) is not available.
Table 7 – Summary of other plant outage rates
Equipment Outage rate Outage duration
22 kV bus (major fault)
2% per annum 3 months
22 kV circuit breaker (minor fault)
0.3% per annum 24 hours
5.6 Discount rates
To compare cash flows of options with different time profiles, it is necessary to use a discount rate to express future costs and benefits in present value terms. The choice of discount rate will impact on the estimated present value of net market benefits, and may affect the ranking of alternative options.
A real, pre-tax discount rate of 6.12 per-cent is adopted in this assessment.
5.7 Plant ratings
The zone substation ratings of NO, SV/SVW and GW are limited by the thermal capability of the zone substation transformers. The transformer summer cyclic ratings are calculated based on ambient temperature of 40°C and corresponding load profiles at respective zone substations. The transformer winter cyclic ratings are based on 10°C ambient temperature.
The distribution feeder ratings are calculated based on ambient temperature of 40°C. In addition to temperature, overhead line ratings are based on solar radiation of 1000 W/m2 and a wind speed of 3 m/s at an angle to the conductor of 15° (i.e. an effective transverse wind speed of 0.78 m/s), while the underground cable ratings are based on soil thermal resistivity of 0.9 °Cm/W or 1.2 °Cm/W at specific sites. For underground cables, a typical load profile has been considered to accommodate the variability in demand over time.
Summer and winter ratings of corresponding zone substation transformers are presented in Table 8 below.

RIT-D Non Network Options Report
Notting Hill Supply Area Project № UE-DZA-N-17-001
Page 25 of 34
Table 8 – Summary of zone substation cyclic ratings (MVA)
Zone substation
Summer cyclic rating at 40°C Winter cyclic rating at 10°C
N N-1 N N-1
NO 73.0 36.5 85.9 43.0
SV/SVW 163.1 121.1 189.8 141.8
GW 105.0 68.9 121.2 80.5
5.8 Value of customer reliability
Location specific Value of Customer Reliability (VCR) is used to calculated expected unserved energy presented in Section 4.3. The location VCR was derived from the sector VCR estimates provided by AEMO in late 2014, escalated by a factor of 1.013 using the 2015 CPI index, and weighted in accordance with the composition of the load, by sector, at the relevant zone substations.
Table 9 – Summary of location specific VCR
Zone substation VCR
($ per MWh)
NO, SV/ SVW and GW 43,596

RIT-D Non Network Options Report
Notting Hill Supply Area Project № UE-DZA-N-17-001
Page 26 of 34
6 Potential credible options to address the identified need
The table below provides a summary of potential credible options to address the identified need. Table 10 – Credible options under consideration
Option Description
1 Third transformer at Notting Hill zone substation
This option includes:
Installing a new 20/33 MVA 66/22 kV transformer at Notting Hill zone substation.
Installing a new 66kV bus tie circuit breaker
Installing a Neutral Earthing Resistor (NER)
Extending the 22 kV busbar at Notting Hill zone substation.
Developing two new 22 kV distribution feeders to supply the existing loads in and around Notting Hill area.
This option will:
Eliminate the risk of supply interruption following the loss of one of the two Notting Hill zone substation transformers.
Eliminate the risk of supply interruptions from distribution feeders exceeding their rating under system normal conditions.
Reduce the risk of supply interruptions for loss of a distribution feeder.
The estimated capital cost of this option is $6.0 million (± 30%), in 2015-16 $AUD. Annual operating and maintenance costs are anticipated to be around 1% of the capital cost.
The estimated commissioning date is December 2017.
The estimated total annual cost of the Preferred Network Option is $367,200. This cost provides a broad upper bound indication of the maximum contribution from UE which may be available to non-network service providers to avoid this augmentation.
2 Fifth transformer at SV/ SVW zone substation
This option includes:
Installing a new 20/33 MVA 66/22 kV transformer at Springvale / Springvale West zone substation.
Installing a new 66kV bus tie circuit breaker
Developing two new 22 kV distribution feeders at SV/ SVW zone substation to supply the existing loads in and around Notting Hill and Springvale/ Springvale West area.
This option will:
Reduce the risk of supply interruption following the loss of one of the two Notting Hill zone substation transformers.
Eliminate the risk of supply interruptions from distribution feeders exceeding their rating under system normal conditions.
Reduce the risk of supply interruptions for loss of a distribution feeder.
The estimated capital cost of this option is $8.0 million (± 30%), in 2015-16 $AUD. Annual operating and maintenance costs are anticipated to be around 1% of the capital cost.
The estimated commissioning date is December 2017.

RIT-D Non Network Options Report
Notting Hill Supply Area Project № UE-DZA-N-17-001
Page 27 of 34
Option Description
3 Non-network solutions
Embedded generation or demand reduction may defer network investments to address the identified need. At this stage, UE requires further information regarding the likely costs and operating parameters of embedded generation or demand management options in order to evaluate such options as alternative or complimentary measures to network augmentation. UE would therefore welcome proposals, including cost estimates from non-network service providers to address the issues described in Section 4.
Section 7 provides information to assist non-network service providers in responding to this consultation report.
The table below describes the options that have been considered by UE, and are currently regarded as being not credible for the reasons set out:
Table 11 – Options regarded as being not credible
Option Description
4 Installing new 66kV circuit breakers at Notting Hill zone substation
This option includes:
Installing new 66kV circuit breakers at NO zone substation on SVTS-NO and GW-NO sub-transmission lines.
Installing an automatic load shedding scheme at NO zone substations.
This option will:
Reduce the risk of supply interruption at NO supply area following an unplanned outage of SVTS-NO or GW-NO 66kV lines during high demand periods.
Will not reduce the risk of supply interruption following the loss of any one of the two transformers at Notting Hill zone substation.
The estimated capital cost of this option is $0.75 million (± 30%), in 2015-16 $AUD. Annual operating and maintenance costs are anticipated to be around 1% of the capital cost.
The estimated commissioning date is December 2017.
This option only partially reduces the energy at risk and does not completely address the identified need described in Section 4.2. As this option does not address the issue of deteriorating load transfer capability, the amount of residual energy at risk, after implementing this option, remains significantly high leaving customers in NO supply area exposed to the risk of supply interruption during high demand periods.
For these reasons, this option is considered not credible.
For this option to be credible it would need to be coupled with a non-network solution.
5 Permanent load transfer away from Notting Hill zone substation to neighbouring SV/SVW zone substations
This option includes:
Developing two new 22 kV distribution feeders at Springvale/ Springvale West zone substation to offload the existing loads in and around Notting Hill supply area.
This option will:
Reduce the risk of supply interruption following the loss of any one of the two transformers at Notting Hill zone substation.
Increase the risk of supply interruptions at Springvale/ Springvale West zone substation.

RIT-D Non Network Options Report
Notting Hill Supply Area Project № UE-DZA-N-17-001
Page 28 of 34
Option Description
The estimated capital cost of this option is $3.0 million (± 30%), in 2015-16 $AUD. Annual operating and maintenance costs are anticipated to be around 1% of the capital cost.
The estimated commissioning date is December 2017.
While this option partially addresses the identified need at Notting Hill area, the load at SV/SVW zone substation will exceed its (N-1) cyclic rating. Load transfers will adversely affect the reliability of supply in the area. For these reasons, this option is considered not credible.
6 Establish a new zone substation near Notting Hill/ Springvale/ Springvale West zone substation
This option includes:
Establishing a new 66/22 kV zone substation with a single transformer
Developing minimum of three new 22 kV distribution feeders at the new zone substation to supply the existing load in and around Notting Hill supply area.
Building new 66 kV line to connect the new zone substation from the existing SVTS-NO-GW-SVTS sub-transmission system.
There are presently no sites under consideration to be developed as a new zone substation. The preferred location in the Notting Hill area will be around Clayton North area. UE does not own a land suitable for a new zone substation in this area. Given UE would need to acquire a suitable site for a new zone substation and significant connection works, this option is considered to be significantly more expensive with relatively longer lead time.
Although this option addresses the identified need, the expected net market benefits of this option is likely to be lower than all other credible options due to the high establishment costs.
This option has an estimated total capital cost of $18.0 million (± 30%), in 2015-16 $AUD. Annual operating and maintenance costs are anticipated to be around 1% of the capital cost.
For these reasons, this option is considered not credible.

RIT-D Non Network Options Report
Notting Hill Supply Area Project № UE-DZA-N-17-001
Page 29 of 34
7 Technical characteristics of non-network options
This section describes the technical characteristics of the identified need that a non-network option would be required to deliver. A credible non-network option must satisfy timing, operational and technical requirements stipulated below.
7.1 Size and location
Table 12 outlines the estimated amount of load reduction, or additional generation to be supplied by a credible non-network solution within the Notting Hill supply area. These values reflect the impact of load transfer capability.
Table 12 – Peak Demand offsets required from non-network solutions (accumulated)
Year Load at Risk
(MVA)
Hours at Risk
(Hours)
Non-network support required
(MW)
Minimum14
Maximum15
2016-17 5.2 42 - -
2017-1816
9.6 57 4.5 9.6
2018-19 14.1 103 9.0 14.1
2019-20 15.7 126 10.5 15.7
2020-21 17.8 162 13.0 17.8
2021-22 20.1 208 15.0 20.1
2022-23 21.6 242 16.5 21.6
2023-24 22.7 271 17.5 22.7
2024-25 25.0 339 20.0 25.0
7.2 Time of year and duration of support
Proposed non-network options, as a minimum, must be capable of reducing network loading or increasing network capacity in the Notting Hill supply area during summer maximum demand periods (typically from 15th November till 15th March).
The load curve in Figure 13 shows that the demand in the Notting Hill area remains high over the hours from 10:00am to 5:00pm. The maximum duration of a non-network support can be anything up to 7 consecutive hours per day. Therefore the non-network solution will need to be capable of
14
It reflects the minimum MW of demand reduction required in any given year to defer the preferred network augmentation 15
It reflects the maximum MW of demand reduction that can be implemented in any given year which will not only defer the prefer red network augmentation but may also capture maximum market benefits 16
Year of preferred network augmentation

RIT-D Non Network Options Report
Notting Hill Supply Area Project № UE-DZA-N-17-001
Page 30 of 34
operating continuously, during periods of high demand where there is insufficient spare capacity or insufficient transfer capability in distribution feeders, until the faulted asset is repaired or replaced.
The non-network support can be provided either as a pre-contingent or post-contingent service. Support offered as a post-contingent service will assessed as a hybrid solution with a network requirement to install 66kV line circuit breakers at NO combined with an automatic load shedding scheme (Network Option 4) to protect the existing transformers from damaging overloads prior to the service being dispatched.
The non-network support can defer network augmentation by any number of years as reasonably practical, although multiple year deferral proposal is recommended because the implementation of network option has long lead times associated with it.
7.3 Reliability
Proposed non-network options must be capable of reliably meeting electricity demand under a range of conditions and scenarios. If the non-network option is a generator operating in parallel with UE’s network, the generator must comply with the requirements set out in UE’s Embedded Generation Network Access Standard17 (Document No. UE ST 2008). UE will conduct a detailed technical assessment if the non-network solution proposes embedded generators to operate in parallel with UE’s Network.
7.4 Operation
The market benefits associated with the identified need relate to:
Reducing the expected energy at risk that is forecast to occur following the loss of any one of the two transformers at NO zone substation.
Reducing the expected incremental risk of supply interruption that is forecast to occur in neighbouring zone substations and distribution feeders due to load transfers away from NO following the loss of any one of the two transformers at NO zone substation.
Reducing the expected amount of supply interruption that is forecast to occur in the distribution feeder network under system normal and N-1 conditions.
To achieve similar levels of market benefits as captured by the network augmentation, it is expected that a Non-Network solution would be able to reduce the risk of supply interruption by nearly the same amount as Network Augmentation, during summer maximum demand periods.
17
https://www.unitedenergy.com.au/industry/mdocuments-library/

RIT-D Non Network Options Report
Notting Hill Supply Area Project № UE-DZA-N-17-001
Page 31 of 34
8 Submission
8.1 Request for submission
UE is aware that there may be potential credible non-network options to address the identified need. UE invites written submission on this report from registered participants and interested parties.
All submissions should completely and comprehensively address the technical characteristics of non-network options provided in Section 7 and include information listed in listed in Section 5 of UE’s Demand Side Engagement Document (DSED).18
All enquiries should be directed to the United Energy Manager Network Planning at [email protected] quoting reference number UE-DZA-N-17-001.
This consultation closes on Friday 8th July 2016.
Detailed submissions must be emailed to our tender box at [email protected] by the Closing Date on 8th July 2016 by 5pm (Australian Eastern Standard Time) quoting reference number UE-DZA-N-17-001.
All submissions will be published on UE’s website.19
8.2 Next steps
Following UE’s consideration of the submissions, a detailed option assessment including the Preferred Option to address the identified need, and a summary of, and commentary on, the submissions to this report will be included as part of the Draft Project Assessment Report. This report represents the second stage of the consultation process in relation to the application of the RIT-D.
UE intends to publish the Draft Project Assessment Report in October 2016.
18
UE: Demand Side Engagement Document. Available at: https://www.unitedenergy.com.au/industry/mdocuments-library/ under Regulatory Reports.
19 If you do not want your submission to be publically available, please clearly stipulate this at the time of lodgment. However we do
require a cover letter to be published on our web-site.

RIT-D Non Network Options Report
Notting Hill Supply Area Project № UE-DZA-N-17-001
Page 32 of 34
9 Abbreviations and Glossary
Abbreviations
AEMO Australian Energy Market Operator
CDA Clarinda Zone Substation
DAPR Distribution Annual Planning Report
DPAR Draft Project Assessment Report
DSED Demand Side Engagement Document
FPAR Final Project Assessment Report
GW Glen Waverley Zone Substation
NEM National Electricity Market
NER National Electricity Rules
NNOR Non Network Options Report
NO Notting Hill Zone Substation
PoE Probability of Exceedance
RIT-D Regulatory Investment Test for Distribution
SV Springvale Zone Substation
SVW Springvale West Zone Substation
UE United Energy Distribution Pty Ltd
VCR Value of Customer Reliability

RIT-D Non Network Options Report
Notting Hill Supply Area Project № UE-DZA-N-17-001
Page 33 of 34
Glossary
1-in-2 peak day The 1-in-2 peak day demand projection has a 50%
probability of exceedance (PoE). This projected level
of demand is expected, on average, to be exceeded
once in two years.
1-in-10 peak day The 1-in-10 peak day demand projection has a 10%
probability of exceedance (PoE). This projected level
of demand is expected, on average, to be exceeded
once in ten years.
Credible option An option that:
Addresses the identified ‘need’;
Is commercially and technically feasible; and
Can be implemented in sufficient time to meet
the identified ‘need’.
Expected Energy at Risk The expected amount of energy that cannot be
supplied each year because there is insufficient
capacity to meet demand, taking into account
equipment unavailability and load-at-risk.
Identified ‘need’ Any capacity or voltage limitation on the distribution
system that will give rise to Expected Energy at Risk.
Limitation Any limitations on the operation of the distribution
system that will give rise to expected energy at risk.
Network option A means by which an identified ‘need’ can be fully or
partly addressed by expenditure on the distribution
asset.
Non-network option A means by which an identified ‘need’ can be fully or
partially addressed other than by a network option.
Non-network service provider A party who provides a non-network option
Potential credible option An option has the potential to be a credible option
based on an initial assessment of the identified ‘need’.
Preferred Network Option A credible network option that maximise the present
value of net economic benefit to all those who produce,
consume and transport electricity in the market. The
Preferred Network Option can be a network option, or
do nothing (i.e. status quo).
Preferred Option A credible option that maximise the present value of net
economic benefit to all those who produce, consume

RIT-D Non Network Options Report
Notting Hill Supply Area Project № UE-DZA-N-17-001
Page 34 of 34
and transport electricity in the market. The Preferred
Option can be a network option, non-network option, or
do nothing (i.e. status quo).
Probability of exceedance Refers to the probability that a forecast temperature
condition will occur one or more times in any given year
and the maximum demand that is expected to
materialise under these temperature conditions. For
example, a forecast 10% probability of exceedance
maximum demand will, on average, be exceeded only 1
year in every 10.
System-normal condition All system components are in-service and configured in
the optimum network configuration.
System-normal limitation A limitation that arises even when all electrical plant is
available for service.
Value of customer reliability The value customer places on having a reliable supply
of energy, which is equivalent to the cost to the
customer of having that supply interrupted expressed in
$/MWh.