non-linear finite element analysis of cone penetration in ... · fe analysis was performed in...
TRANSCRIPT

This is not a peer-reviewed article Computers in Agriculture and Natural Resources, 4th World Congress Conference,
Proceedings of the 24-26 July 2006 (Orlando, Florida USA) Publication Date 24 July 2006
ASABE Publication Number 701P0606. Eds. F. Zazueta, J. Kin, S. Ninomiya and G. Schiefer
Non-linear Finite Element Analysis of Cone Penetration in Layered Sandy Loam Soil: Considering the
Precompression stress state
Authors: M.Z. Tekeste a*, E.W. Tollner a, R.L. Raper b, T.R. Way b, C.E. Johnson c
a Driftmier Engineering Center, Biological and Agricultural Engineering Department, University of Georgia, Athens, Georgia, 30602, USA
b National Soils Dynamics Laboratory, Auburn, Alabama, 63830, USA c Agricultural Engineering Department, Auburn University, Alabama, 36849, USA
* Corresponding author
Email Address: [email protected] (M.Z. Tekeste)
Abstract. A computer simulation of cone penetration in layered soil was carried out using axisymmetric finite element (FE) to investigate soil deformation and soil hardpan prediction during cone penetration. The FE analysis was performed in ABAQUS, commercially available FE package. Soil was considered as a nonlinear elastic plastic material modeled using Drucker Prager material model with hardening option. The soil – cone interaction was modeled as contact problem with frictional property. The FE analysis simulated cone penetration in soil with three bulk density treatments and three soil-cone surfaces (Metal, Tmetal and Teflon). The FE model predicted soil hardpan depths were smaller than the depths predicted using cone penetrometer method. Soil moisture, bulk density and cone material significantly affected the cone penetrometer data in predicting soil hardpan depths; however the FE results were not affected by the factors. Inclusion of the influence of preconsolidation stress into the yield stress vs. plastic strain relationship of the material hardening part of the model (NSDL-AU soil compaction model) improved the performance of FE in predicting the peak penetration resistance.
Keywords. Finite element, Drucker-Prager, Hardpan, Precompression stress, Cone penetration.
Introduction Soil compaction is a process by which soil particles are rearranged into a dense state and is caused by
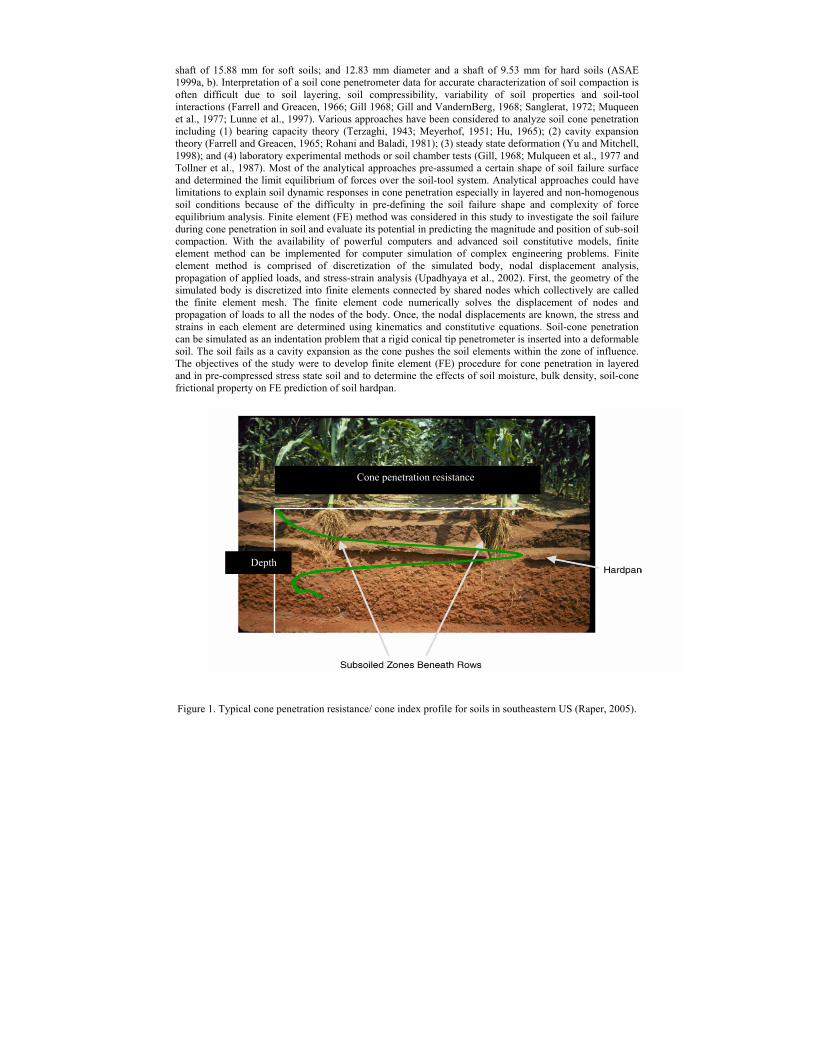
natural forces or human induced mechanical loads such as wheel traffic and tillage. Soil compaction results a reduction in soil porosity mainly its air-filled fraction. The effects of compaction on soil are decrease in aeration and water infiltration, and an increase in soil strength. Many soils in the southeastern USA typically have a highly compacted root restricting layers, commonly called hardpans (Fig. 1). Soil compaction is desirable in civil engineering works that require increased soil strength for foundations and trafficability. From an agronomic point of view, excessive soil compaction has adverse effects on crop growth and yield by decreasing the available water for crops, oxygen for root respiration, limiting root’s ability to penetrate below the compacted zone for uptake of soil moisture and nutrient reserves. Recently understanding the compression/densification of biomass materials become an important component in the bio-energy production systems for efficient transportation and handling, and determining the durability tests of the bio-mass materials. Precision tillage management that would site-specifically disrupt the root restricting layers is recently being studied to evaluate its potential for management of soil compaction in the Southeastern US. The decision making for precision tillage depends on the accuracy of soil compaction sensing.
Soil compaction can be diagnosed by observing crop symptoms, measuring the bulk density or indirectly measuring reaction of soil medium to fluids (air or water) movement or cone penetration. A soil-cone penetrometer is a widely used instrument to measure soil strength, foundation bearing capacity, and trafficability (Perumpral, 1987). American Society of Agricultural and Biological Engineers (ASABE) has standardized a soil cone penetrometer that has 30-deg cone with a cone base of 20.27 mm diameter and a
shaft of 15.88 mm for soft soils; and 12.83 mm diameter and a shaft of 9.53 mm for hard soils (ASAE 1999a, b). Interpretation of a soil cone penetrometer data for accurate characterization of soil compaction is often difficult due to soil layering, soil compressibility, variability of soil properties and soil-tool interactions (Farrell and Greacen, 1966; Gill 1968; Gill and VandernBerg, 1968; Sanglerat, 1972; Muqueen et al., 1977; Lunne et al., 1997). Various approaches have been considered to analyze soil cone penetration including (1) bearing capacity theory (Terzaghi, 1943; Meyerhof, 1951; Hu, 1965); (2) cavity expansion theory (Farrell and Greacen, 1965; Rohani and Baladi, 1981); (3) steady state deformation (Yu and Mitchell, 1998); and (4) laboratory experimental methods or soil chamber tests (Gill, 1968; Mulqueen et al., 1977 and Tollner et al., 1987). Most of the analytical approaches pre-assumed a certain shape of soil failure surface and determined the limit equilibrium of forces over the soil-tool system. Analytical approaches could have limitations to explain soil dynamic responses in cone penetration especially in layered and non-homogenous soil conditions because of the difficulty in pre-defining the soil failure shape and complexity of force equilibrium analysis. Finite element (FE) method was considered in this study to investigate the soil failure during cone penetration in soil and evaluate its potential in predicting the magnitude and position of sub-soil compaction. With the availability of powerful computers and advanced soil constitutive models, finite element method can be implemented for computer simulation of complex engineering problems. Finite element method is comprised of discretization of the simulated body, nodal displacement analysis, propagation of applied loads, and stress-strain analysis (Upadhyaya et al., 2002). First, the geometry of the simulated body is discretized into finite elements connected by shared nodes which collectively are called the finite element mesh. The finite element code numerically solves the displacement of nodes and propagation of loads to all the nodes of the body. Once, the nodal displacements are known, the stress and strains in each element are determined using kinematics and constitutive equations. Soil-cone penetration can be simulated as an indentation problem that a rigid conical tip penetrometer is inserted into a deformable soil. The soil fails as a cavity expansion as the cone pushes the soil elements within the zone of influence. The objectives of the study were to develop finite element (FE) procedure for cone penetration in layered and in pre-compressed stress state soil and to determine the effects of soil moisture, bulk density, soil-cone frictional property on FE prediction of soil hardpan.
Cone penetration resistance
Depth
Figure 1. Typical cone penetration resistance/ cone index profile for soils in southeastern US (Raper, 2005).

Materials and Methods
Figure 2. Cone penetrometer measurement.
FE verification experiment Soil cone penetration measurements were conducted to verify the FE model on layered Norfolk sandy
loam (sand 71.6%, silt 17.4% and clay 11.0%) that vary in soil moisture, bulk density, and cone material as treatment factors arranged in split plot design. Figure 1 shows the setup of the cone penetration measurement at the national soil dynamics laboratory in Auburn, AL. Three soil – cone frication surfaces were modeled representing the cone materials of Metal, TMetal and Teflon. The Metal was a stainless steel. The TMetal was a stainless steel with dry power of Teflon sprayed at the time of cone penetration measurement. The coefficients of friction between soil and the cone surfaces were determined as shown in Fig. 2 with the soil properties being similar to the cone penetration measurement soil conditions.
Teflon
Soil
Weights for normal forces to be on top of the cone material surfaces
Figure 3. Soil cone materials (Teflon, Telflon metal and Metal) coefficient of friction measurement at the USDA-ARS- NSDL facility in Auburn, AL precision farming lab.
FE model formation The deformable soil (CAX4R; ABAQUS axisymmetric element) and rigid cone (RAX2 ; ABAQUS
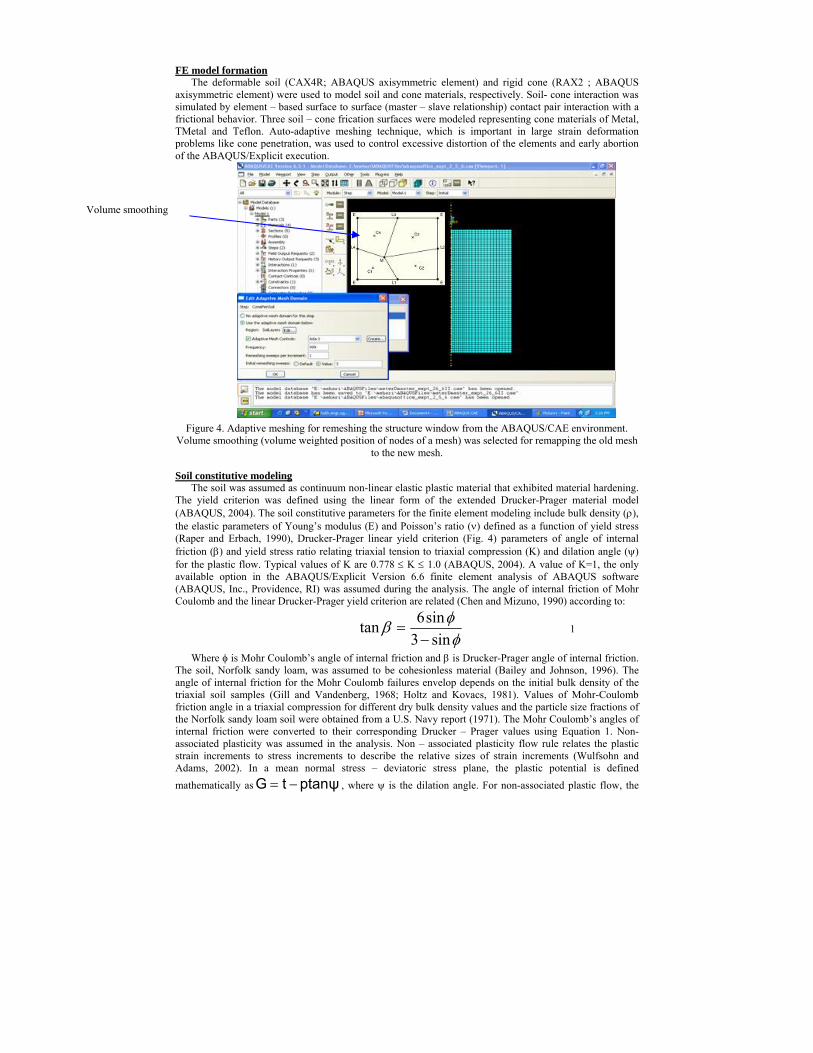
axisymmetric element) were used to model soil and cone materials, respectively. Soil- cone interaction was simulated by element – based surface to surface (master – slave relationship) contact pair interaction with a frictional behavior. Three soil – cone frication surfaces were modeled representing cone materials of Metal, TMetal and Teflon. Auto-adaptive meshing technique, which is important in large strain deformation problems like cone penetration, was used to control excessive distortion of the elements and early abortion of the ABAQUS/Explicit execution.
Volume smoothing
Figure 4. Adaptive meshing for remeshing the structure window from the ABAQUS/CAE environment. Volume smoothing (volume weighted position of nodes of a mesh) was selected for remapping the old mesh
to the new mesh.
Soil constitutive modeling The soil was assumed as continuum non-linear elastic plastic material that exhibited material hardening.
The yield criterion was defined using the linear form of the extended Drucker-Prager material model (ABAQUS, 2004). The soil constitutive parameters for the finite element modeling include bulk density (ρ), the elastic parameters of Young’s modulus (Ε) and Poisson’s ratio (ν) defined as a function of yield stress (Raper and Erbach, 1990), Drucker-Prager linear yield criterion (Fig. 4) parameters of angle of internal friction (β) and yield stress ratio relating triaxial tension to triaxial compression (K) and dilation angle (ψ) for the plastic flow. Typical values of K are 0.778 ≤ K ≤ 1.0 (ABAQUS, 2004). A value of K=1, the only available option in the ABAQUS/Explicit Version 6.6 finite element analysis of ABAQUS software (ABAQUS, Inc., Providence, RI) was assumed during the analysis. The angle of internal friction of Mohr Coulomb and the linear Drucker-Prager yield criterion are related (Chen and Mizuno, 1990) according to:
6sinφtan β = 13 − sinφ
Where φ is Mohr Coulomb’s angle of internal friction and β is Drucker-Prager angle of internal friction. The soil, Norfolk sandy loam, was assumed to be cohesionless material (Bailey and Johnson, 1996). The angle of internal friction for the Mohr Coulomb failures envelop depends on the initial bulk density of the triaxial soil samples (Gill and Vandenberg, 1968; Holtz and Kovacs, 1981). Values of Mohr-Coulomb friction angle in a triaxial compression for different dry bulk density values and the particle size fractions of the Norfolk sandy loam soil were obtained from a U.S. Navy report (1971). The Mohr Coulomb’s angles of internal friction were converted to their corresponding Drucker – Prager values using Equation 1. Non-associated plasticity was assumed in the analysis. Non – associated plasticity flow rule relates the plastic strain increments to stress increments to describe the relative sizes of strain increments (Wulfsohn and Adams, 2002). In a mean normal stress – deviatoric stress plane, the plastic potential is defined mathematically as G = t − ptanψ , where ψ is the dilation angle. For non-associated plastic flow, the

dilation angle and material friction angle are related as ψ <β. The dilation angles for the non-associated model are related to the Mohr Coulomb angle of internal friction, φ (Bolton, 1986; Susila, 2002) as:
φ = φcv +ψ , 2
where φcv is the constant volume angle of internal friction for a loose earth (Bolton, 1986). A constant value of φcv = 33o was assumed, based on observations for silica sands presented by Bolton (1986).
For the hardening part of the material behavior, the tabular data of yield stress (σoct = (σ1+σ2+σ3)/3) and − p
the plastic volumetric strain ( ε ) were obtained from the National Soil Dynamics and Auburn University v (NSDL – AU) soil compaction model (eq. 3 and 4). The NSDL – AU soil compaction was modified to account variation in soil moisture and bulk density of the soil layers and the pre - compression stress state of the soil. The stress-strain relationship of the NSDL-AU soil compaction model (Bailey and Johnson, 1989) was defined as:
Octε −
= (A + Bσ )(1− e−Cσ ) + D(τ / σ ) 3v oct oct oct − −
where: ε = natural volumetric strain [ ε = ln(V/V ) = ln(ρ / ρ) ].v v o o σoct =octahedral or mean normal stress [σoct= (σ1+σ2+σ3)/3]. τ oct = octahedral shear stress [τ oct ={ (σ1-σ2)2 + (σ2-σ3)2 +(σ1-σ3)2 }1/2 /3]. V= volume at stress state. Vo = initial volume. ρ= dry bulk density at stress state. ρo = initial dry bulk density. A, B, C and D were compactibility coefficients for a specific soil at a specific soil moisture content. Bailey and Johnson (1989) also found a linear relationship between the total natural volumetric strain
and the natural plastic volumetric strain according to: p
d−
ε v = α d−
ε v
− p
Where: ε = natural plastic volumetric strain.α = constant.v The coefficients of the NSDL-AU model (Eq. 3) for Norfolk sandy loam soil that were developed at a
specific soil moisture content (6.3% d.b.) are shown in Table 1. The NSDL-AU model coefficients (A, B, C and D) were determined using non-linear curve fitting on the triaxial test data for Norfolk sandy loam soil (Bailey and Johnson, 1989).
Table 1. Soil parameters and coefficients of the NSDL-AU soil compaction model for Norfolk sandy loam soil.
Soil moisture Initial bulk Poisson’s A[a] B C D α[b]
content (% d.b.)
density (Mg m-3)
Ratio (ν)
(kPa-1) (kPa-1)
Value 6.3 1.35 0.3 -0.241 0.0002 0.0126 -0.1122 0.926
[a] A, B, C and D are model coefficients for the NSDL-AU soil compaction model from Bailey and Johnson (1989).
[b] α is the slope of a straight regression line fit to data in a graph of the plastic natural volumetric strain as a function of total natural volumetric strain, from Foster et al. (2005).
The ‘virgin’ stress and strain relationship of the NSDL-AU model (eq. 3) was modified to account for the pre-compression stress state of the soil layers and different soil moisture contents. For estimating the NSDL-AU soil compaction model parameters, loading was applied on an initial loose soil sample was applied at constant octahedral normal stress (σoct ) value of 500 kPa while the shear stresses were applied (Bailey and Johnson, 1996). Using the total volumetric and plastic strain components of the volumetric
4

strains (Eq. 3 and 4), new stress and strain relationships were developed for the various initial bulk density conditions of the soil layers. The soil layers above, within and below the hardpan was assumed to be pre-compressed. To account for the different soil moisture contents, the relationship between the triaxial stress state and Proctor density curve as explained in Tekeste et al. (2005) was used.
Figure 5. Drucker-Prager yield function (A) (Shoop, 2001) and yield stress and plastic volumetric strain for the hardening part of the material model from the NSDL-AU stress-strain relationship (B).
Results and Discussion The stress-strain relationships as shown in Figure 5 indicated the variation in the magnitude of
volumetric strains after the modification of the ‘virgin’ curve of the NSDL-AU model (Fig 5; blue with initial bulk density of 1.27 Mg m-3). For the hardpan layer (Fig. 5 B), the plastic strain values were decreased by nearly 15 times from the original (‘virgin’) NSDL-AU strain values indicating a soil initially compressed to 1.71 Mg m-3 bulk density had experienced small deformation under the loading.

(II)
(I)
Figure 6. FE analysis results showing Von Misses stresses from soil cone penetration simulation on Norfolk sandy loam soil with bulk density (Within hardpan) of 1.76 Mg m -3 and soil moisture level II (3.48 % d.b.) for cone materials of Metal (A), TMetal (B), and Teflon (C). The graphs in the top (I) and in the bottom (II)
are for illustration of the axi-symmetric and front view of the model, respectively.
(I)
(II)
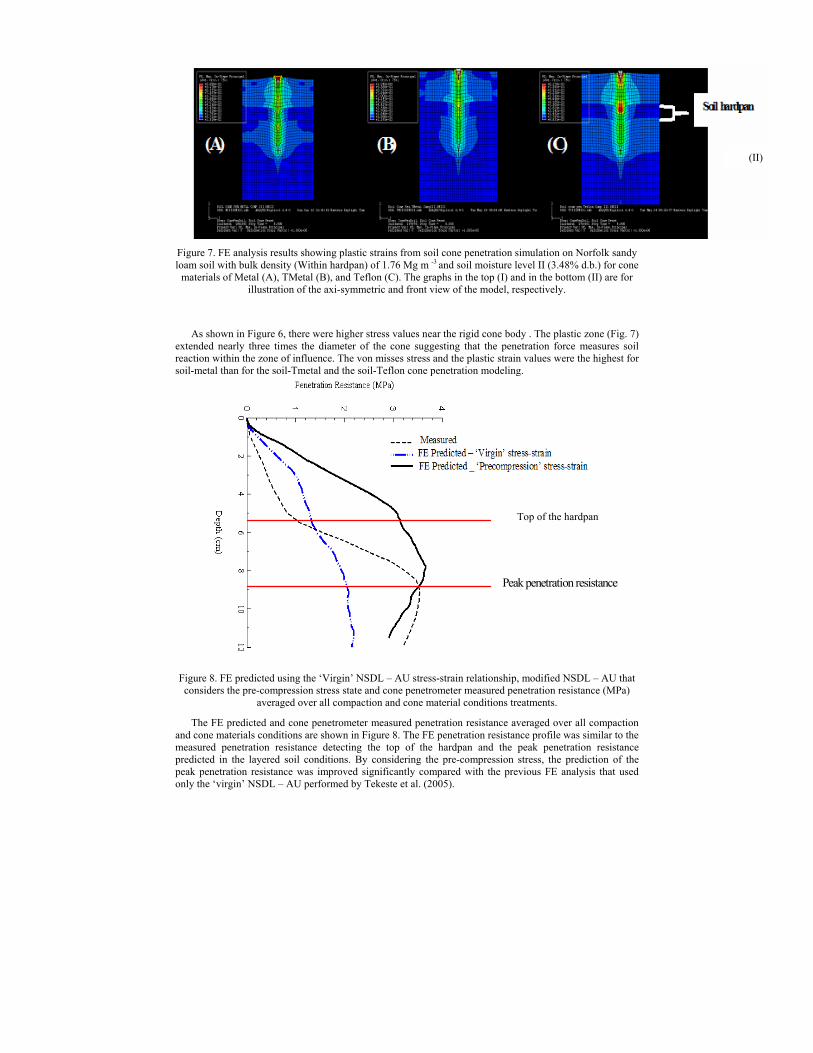
Figure 7. FE analysis results showing plastic strains from soil cone penetration simulation on Norfolk sandy loam soil with bulk density (Within hardpan) of 1.76 Mg m -3 and soil moisture level II (3.48% d.b.) for cone
materials of Metal (A), TMetal (B), and Teflon (C). The graphs in the top (I) and in the bottom (II) are for illustration of the axi-symmetric and front view of the model, respectively.
As shown in Figure 6, there were higher stress values near the rigid cone body . The plastic zone (Fig. 7) extended nearly three times the diameter of the cone suggesting that the penetration force measures soil reaction within the zone of influence. The von misses stress and the plastic strain values were the highest for soil-metal than for the soil-Tmetal and the soil-Teflon cone penetration modeling.
Peak penetration resistance
Top of the hardpan
Figure 8. FE predicted using the ‘Virgin’ NSDL – AU stress-strain relationship, modified NSDL – AU that considers the pre-compression stress state and cone penetrometer measured penetration resistance (MPa)
averaged over all compaction and cone material conditions treatments.
The FE predicted and cone penetrometer measured penetration resistance averaged over all compaction and cone materials conditions are shown in Figure 8. The FE penetration resistance profile was similar to the measured penetration resistance detecting the top of the hardpan and the peak penetration resistance predicted in the layered soil conditions. By considering the pre-compression stress, the prediction of the peak penetration resistance was improved significantly compared with the previous FE analysis that used only the ‘virgin’ NSDL – AU performed by Tekeste et al. (2005).

Conclusion The finite element procedure was successfully developed in ABAQUS to simulate soil cone penetration
in layered Norfolk sandy loam soil that varied in soil moisture and bulk density. The FE method predicted the magnitude of the hardpan and its location as observed in the cone penetrometer data. The hardpan location was predicted a depth shallower than the depth measured by the cone penetrometer. For Norfolk sandy loam soil, the FE and cone penetrometer methods showed that under wet soil moisture conditions and reduced soil-cone friction (e.g. Teflon) the accuracy of soil hardpan depths prediction appear to improve.
References ABAQUS, Version 6.4. 2004. ABAQUS/Explicit. ABAQUS, Inc. Providence, RL, USA. ABAQUS, Version 6.4. 2004. ABAQUS theory manual. ABAQUS, Inc. Providence, RL, USA. ASAE Standards, 46Ed. 1999a. S313.3. Soil cone penetrometer. St. Joseph, Mich.: ASAE. ASAE Standards, 46Ed. 1999b. EP542. Soil cone penetrometer. St. Joseph, Mich.: ASAE. Bailey, A.C. and C.E. Johnson. 1989. A soil compaction model for cylindrical stress states. Trans. ASAE
32(3): 822-825. Bolton, M.D. 1986. Geotechnique. 36 (1): 65 – 78. Chen, W.F. and E. Mizuno. 1990. Non-linear Analysis in soil mechanics: Theory and Implementation.
Developments in geotechnical engineering vol. 53. Elsevier Science Publishing Company, Inc. 655 Avenue of the Americas, New York, NY 10010, U.S.A.
Gill, W.R. 1968. Influence of compaction hardening of soil on penetration resistance. Trans. ASAE 11(6): 741-745.
Gill, W.R. and G.E. Vanden Berg. 1968. Soil dynamics in tillage and traction. Agriculture Handbook No. 316. USDA-Agricultural Research Service, Washington. D.C.
Farell, D.A. and E.L. Greacen. 1966. Resistance to penetration on fine probes in compressible soil. Australian Journal of Soil Res. 4:1-17.
Hu, G. C. Y. 1965. Bearing capacity of foundations with overburden shear. Sols Soils 13: 11-18. Lunne, T., P.K. Robertson, and J.J.M. Powell. 1997. Cone penetration testing in geotechnical practices.
Blackie Academic and Professional, London, UK. Meyerhof, G. G. 1951. The ultimate bearing capacity of foundations. Géotechnique 2(4): 301-332. Mulqueen, J., J.KV. Stafford and D.W. Tanner. 1977. Evaluation of penetrometers for measuring soil
strength. Journal of Terramechanics 14(3):137-151.
Perumpral, J.V. 1987. Cone penetrometer applications-A review. Trans. ASAE 30(4):939-944. Raper, R.L. and D.C. Erbach. 1990. Prediction of soil stresses using the finite element method. Trans.
ASAE, 33: 725–30. Raper, R. L. 2005. Vehicle traffic effects on soil. J. Terramechanics42(3-4): 259-280. Rohani, B. and G. Y. Baladi. 1981. Correlation of mobility cone index with fundamental engineering
properties of soil. International Society for Terrain-Vehicle Systems. Vol 3:959-990. Alberta, Canada. Sanglerat, G. 1972. Interpretation of penetration diagrams- theory and practice. Developments in
geotechnical engineering. Elsevier Science Publishing company. Amsterdam, The Netherlands. Shoop, S.A. 2001. Finite element modeling of tire-terrain interaction. Technical report ERDC/CRREL TR-
01-16. Tekeste, M. Z., R.L. Raper, E. W. Tollner and T.R. Way. 2005. Finite element analysis of cone
penetrometer for predicting soil hardpan attributes as influenced by soil moisture, soil density and cone material. Submitted to the Trans. ASAE.
Terzaghi, K. 1943. Theoretical Soil Mechanics. New York, N.Y.: Wiley. Tollner E. W., B.P. Verma, and J.M. Cheshire. 1987. Observing soil-tool interactions and soil organics
using X-ray computer tomography. Trans. ASAE 30 (6): 1605-1610. Upadhyaya, S. K., W. J. Chancellor, J. V. Perumpral, R. L. Schafer, W. R. Gill, and G. E. Vanden Berg
(editors). 1994. Advances in Soil Dynamics. Vol. 1. American Society of Agricultural Engineers. 313p. U.S. Navy. 1971. Soil mechanics, foundations, and earth structures. NAVFAC Design Manual DM-7.
Washington, D.C. Wulfsohn, D., and B. A. Adams. 2002. Elastoplastic soil mechanics. In Advances in Soil Dynamics. Volume
2, 1- 116. St. Joseph, Mich.: ASAE. Yu, H.S., J.K. Mitchell, 1998. Analysis of cone resistance: review of methods. J Geotechnical and
Geoenvironmental Engg. 141 (2): 140-149.

ASABE Standards, 36th ed. 1989. S352.1: Moisture measurement -- Grain and seeds. St. Joseph, Mich.: ASAE.
Coombs, T. R., and F. C. Watson. 1997. Computational Fluid Dynamics. 3rd ed. Wageningen, The Netherlands: Elsevier Science.
NSC. 2001. Injury Facts Online. Itasca, Ill.: National Safety Council. Available at: www.nsc.org. Accessed 17 December 2001.
Waladi, W., B. Partek, and J. Manoosh. 1999. Regulating ammonia concentration in swine housing: Part II. Application examples. Trans. ASAE 43(4): 540-547.