nokia in 2008...nokia, eurm 2008 2007 change, % net sales 50 710 51 058 – 1 operating profit 4 966...
TRANSCRIPT

Nokia in 2008


Review by the Board of Directors and Nokia Annual Accounts 2008
Key data ...................................................................................................................................................... 2
Review by the Board of Directors ...................................................................................................... 3
Annual Accounts 2008
Consolidated profit and loss accounts, IFRS ..................................................................................... 8
Consolidated balance sheets, IFRS ....................................................................................................... 9
Consolidated cash flow statements, IFRS ....................................................................................... 10
Consolidated statements of changes in shareholders’ equity, IFRS ........................................ 11
Notes to the consolidated financial statements ........................................................................... 13
Profit and loss accounts, parent company, FAS ............................................................................. 48
Balance sheets, parent company, FAS .............................................................................................. 48
Cash flow statements, parent company, FAS ................................................................................. 49
Notes to the financial statements of the parent company ........................................................ 50
Nokia shares and shareholders ......................................................................................................... 54
Nokia Group 2004–2008, IFRS ............................................................................................................ 58
Calculation of key ratios ...................................................................................................................... 60
Proposal by the Board of Directors for distribution of profit .................................................... 61
Auditors’ report ..................................................................................................................................... 62
Additional information
Critical accounting policies ................................................................................................................ 64
Group Executive Board ........................................................................................................................ 68
Board of Directors ................................................................................................................................. 70
Corporate governance ......................................................................................................................... 72
Investor information ............................................................................................................................ 88
Contact information ............................................................................................................................. 89
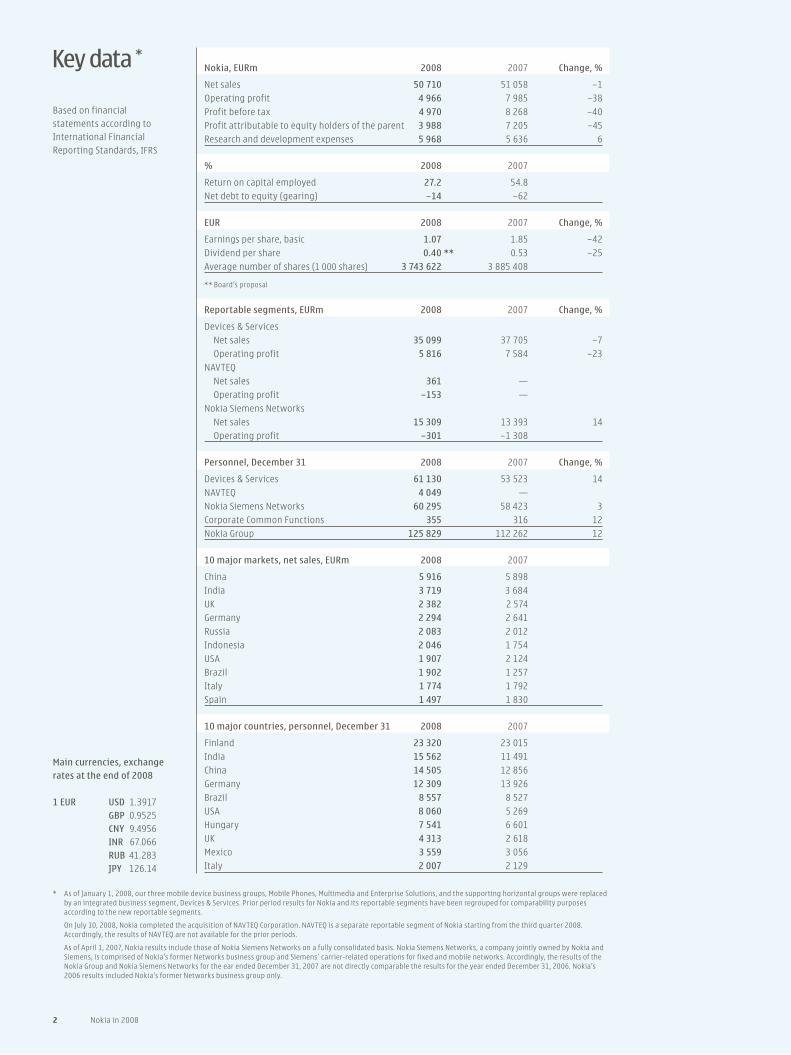
Nokia, EURm 2008 2007 Change, %
Net sales 50 710 51 058 – 1Operating profit 4 966 7 985 – 38Profit before tax 4 970 8 268 – 40Profit attributable to equity holders of the parent 3 988 7 205 – 45Research and development expenses 5 968 5 636 6
% 2008 2007
Return on capital employed 27.2 54.8Net debt to equity (gearing) – 14 – 62
EUR 2008 2007 Change, %
Earnings per share, basic 1.07 1.85 – 42Dividend per share 0.40 ** 0.53 – 25Average number of shares (1 000 shares) 3 743 622 3 885 408
** Board’s proposal
Reportable segments, EURm 2008 2007 Change, %
Devices & Services Net sales 35 099 37 705 – 7 Operating profit 5 816 7 584 – 23NAVTEQ Net sales 361 — Operating profit – 153 —Nokia Siemens Networks Net sales 15 309 13 393 14 Operating profit – 301 – 1 308
Personnel, December 31 2008 2007 Change, %
Devices & Services 61 130 53 523 14NAVTEQ 4 049 — Nokia Siemens Networks 60 295 58 423 3Corporate Common Functions 355 316 12Nokia Group 125 829 112 262 12
10 major markets, net sales, EURm 2008 2007
China 5 916 5 898India 3 719 3 684UK 2 382 2 574Germany 2 294 2 641Russia 2 083 2 012Indonesia 2 046 1 754USA 1 907 2 124Brazil 1 902 1 257Italy 1 774 1 792Spain 1 497 1 830
10 major countries, personnel, December 31 2008 2007
Finland 23 320 23 015India 15 562 11 491China 14 505 12 856Germany 12 309 13 926Brazil 8 557 8 527USA 8 060 5 269Hungary 7 541 6 601UK 4 313 2 618Mexico 3 559 3 056Italy 2 007 2 129
Key data *
Based on financial statements according to International Financial Reporting Standards, IFRS
Main currencies, exchange rates at the end of 2008
1 EUR USD 1.3917 GBP 0.9525 CNY 9.4956 INR 67.066 RUB 41.283 JPY 126.14
2 Nokia in 2008
* As of January 1, 2008, our three mobile device business groups, Mobile Phones, Multimedia and Enterprise Solutions, and the supporting horizontal groups were replaced by an integrated business segment, Devices & Services. Prior period results for Nokia and its reportable segments have been regrouped for comparability purposes according to the new reportable segments.
On July 10, 2008, Nokia completed the acquisition of NAVTEQ Corporation. NAVTEQ is a separate reportable segment of Nokia starting from the third quarter 2008. Accordingly, the results of NAVTEQ are not available for the prior periods.
As of April 1, 2007, Nokia results include those of Nokia Siemens Networks on a fully consolidated basis. Nokia Siemens Networks, a company jointly owned by Nokia and Siemens, is comprised of Nokia’s former Networks business group and Siemens’ carrier-related operations for fixed and mobile networks. Accordingly, the results of the Nokia Group and Nokia Siemens Networks for the ear ended December 31, 2007 are not directly comparable the results for the year ended December 31, 2006. Nokia’s 2006 results included Nokia’s former Networks business group only.

Review by the Board of Directors 2008 *
Review by the Board of Directors 3
In 2008, Nokia’s net sales decreased 1% to EUR 50 710 million (EUR 51 058 million in 2007). Net sales of De-vices & Services for 2008 decreased 7% to EUR 35 099 million (EUR 37 705 million). Net sales of NAVTEQ for the six months ended December 31, 2008 were EUR
361 million. Net sales of Nokia Siemens Networks in-creased 14% to EUR 15 309 million (EUR 13 393 million).
In 2008, Europe accounted for 37% (39% in 2007) of Nokia’s net sales, Asia-Pacific 22% (22%), Greater China 13% (12%), North America 4% (5%), Latin America 10% (8%), and Middle East & Africa 14% (14%). The 10 markets in which Nokia generated the greatest net sales in 2008 were, in descending order of magnitude, China, India, the UK, Germany, Russia, Indonesia, the US, Brazil, Italy and Spain, together representing approximately 50% of total net sales in 2008. In comparison, the 10 markets in which Nokia generated the greatest net sales in 2007 were China, India, Germany, the UK, the US, Russia, Spain, Italy, Indonesia and Brazil, together representing approxi-mately 50% of total net sales in 2007.
Nokia’s gross margin in 2008 was 34.3%, com-pared to 33.8% in 2007. Nokia’s 2008 operating profit decreased 38% to EUR 4 966 million, compared with EUR 7 985 million in 2007. Nokia’s 2008 operating margin was 9.8% (15.6%). Nokia’s operating profit in 2008 included purchase price accounting items and other special items of net negative EUR 2 067 million (net positive EUR 288 million). Devices & Services operating profit decreased 23% to EUR 5 816 million, compared with EUR 7 584 million in 2007, with an operating margin of 16.6% (20.1%). Devices & Services operating profit in 2008 included special items of net negative EUR 557 million (net negative EUR 4 million). NAVTEQ’s operating loss for the six months ended on December 31, 2008 was EUR 153 million, representing an operating margin of – 42.4%. NAVTEQ’s operating loss included purchase price accounting items and other special items of net negative EUR 235 million. Nokia Siemens Networks had an operating loss of EUR
301 million, compared with a EUR 1 308 million operat-ing loss in 2007, representing an operating margin of
– 2.0% (– 9.8%). Nokia Siemens Networks operating loss in 2008 included purchase price accounting items and other special items of net negative EUR 1 058 million (net negative EUR 1 639 million).
The global economic slowdown, combined with unprecedented currency volatility, resulted in a sharp pull back in global consumer spending in the second half of 2008, particularly in the fourth quarter. The more limited availability of credit also reduced the purchasing ability of some trade customers. In 2008,
Nokia’s net sales and profitability, in particular in Devices & Services, were negatively impacted by these factors.
Research and development expenses were EUR
5 968 million in 2008, up 6% from EUR 5 636 million in 2007. Research and development costs represented 11.8% of Nokia’s net sales in 2008, up from 11.0% in 2007. Research and development expenses included purchase price accounting items and other special items of EUR 550 million in 2008 (EUR 575 million in 2007). At December 31, 2008, Nokia employed 39 350 people in research and development, representing approximately 31% of Nokia’s total workforce, and had a strong research and development presence in 16 countries.
In 2008, Nokia’s selling and marketing expenses were EUR 4 380 million, compared with EUR 4 379 million in 2007. Selling and marketing expenses for Nokia represented 8.6% of its net sales in 2008 (8.6%
in 2007). Selling and marketing expenses included purchase price accounting items and other special items of EUR 341 million in 2008 (EUR 363 million).
Administrative and general expenses were EUR
1 284 million in 2008, compared to EUR 1 165 million in 2007. Administrative and general expenses were equal to 2.5% of net sales in 2008 (2.3% in 2007). Adminis-trative and general expenses included special items of EUR 163 million in 2008 (EUR 146 million).
Corporate Common Functions expenses totaled EUR 396 million in 2008, compared with an operating profit of EUR 1 709 million in 2007. Expenses in 2008 included a EUR 217 million loss due to transfer of Finn-ish pension liabilities.
Net financial expense was EUR 2 million in 2008 (income of EUR 239 million in 2007).
Profit before tax and minority interests was EUR 4 970 million (EUR 8 268 million in 2007). Net profit totaled EUR 3 988 million (EUR 7 205 million in 2007). Earnings per share decreased to EUR 1.07 (basic) and EUR 1.05 (diluted), compared to EUR 1.85 (basic) and EUR 1.83 (diluted) in 2007.
Operating cash flow for the year ended December 31, 2008 was EUR 3 197 million (EUR 7 882 million for the year ended December 31, 2007) and total com-bined cash and other liquid assets were EUR 6 820 mil-lion (EUR 11 753 million). As at December 31, 2008, our net debt-to-equity ratio (gearing) was – 14% (– 62% as at December 31, 2007). In 2008, capital expenditure amounted to EUR 889 million (EUR 715 million).
The key financial data, including the calculation of key ratios, for the years 2008, 2007 and 2006 may be found in the Annual Accounts.
Main events in 2008
Nokia Group
» Nokia began operating under its new orga-nizational structure, with its three former mobile device business groups–Mobile Phones, Multimedia and Enterprise Solutions–and the supporting horizontal groups forming one integrated business group, Devices & Services. The new organizational structure is designed to align Nokia with the opportunities Nokia sees for future growth in devices and services and increase efficient ways of working across the company. Devices & Services has three business units: Devices; Services (operated in 2008 under the Services & Software name); and Markets. The three units receive operational support from our Corporate Development Office, which is also responsible for exploring corporate strategic and future growth opportunities.
» Nokia announced and completed the closure of its mobile devices production facility in Bochum, Germany, began production of mobile devices at its new facility in Cluj, Romania, and made invest-ments to upgrade its mobile device production facilities in Chennai, India and Manaus, Brazil.
» Nokia and Qualcomm announced that they entered into a new 15 year license agreement covering various standards, including GSM, EDGE,
CDMA, WCDMA, HSDPA, OFDM, WiMAX, LTE and other technologies. The agreement resulted in settle-ment of all litigation between the two companies.
Devices
» Further strengthening its Nokia Nseries range of mobile devices, Nokia announced and began shipments of the Nokia N78, Nokia N79, Nokia N85 and Nokia N96, and unveiled the flagship Nokia N97 mobile computer.
» Building out the Nokia Eseries range of mobile devices, Nokia announced and began shipments of the Nokia E63, Nokia E66 and Nokia E71.
» Nokia announced that Microsoft Exchange ActiveSync will be available in all Nokia S60 3rd Edition devices, as well as compatibility with IBM Lotus Notes Traveler on all Nokia S60 3rd Edition devices. These announcements enable access to over 80% of the world’s corporate email accounts.
» Nokia announced and began shipments of eight mobile devices with functions and features specially designed for consumers in emerging markets, starting with the Nokia 1202 and up to the Nokia 7100 Supernova.
* As of January 1, 2008, our three mobile device business groups, Mobile Phones, Multimedia and Enterprise Solutions, and the supporting hori-zontal groups were replaced by an integrated business segment, Devices & Services. Prior period results for Nokia and its reportable segments have been regrouped for comparability purposes according to the new reportable segments.
On July 10, 2008, Nokia completed the acquisition of NAVTEQ Corporation. NAVTEQ is a separate reportable segment of Nokia starting from the third quarter 2008. Accordingly, the results of NAVTEQ are not available for the prior periods.
As of April 1, 2007, Nokia results include those of Nokia Siemens Networks on a fully consolidated basis. Nokia Siemens Networks, a company jointly owned by Nokia and Siemens, is comprised of the former Nokia Networks and Siemens’ carrier-related operations for fixed and mobile networks. Accordingly, the results of Nokia Group and Nokia Siemens Networks for the full year 2008 are not directly comparable to the results for the full years 2007 and 2006. Nokia’s first quarter 2007 and the full year 2006 results included Nokia’s former Networks business group only.

4 Nokia in 2008
» Nokia announced and began shipments of the Nokia 5800 XpressMusic, a mobile device optimized for music and featuring a 3.2 inch touch screen display with tactile feedback, a 3.2
megapixel camera and A-GPS functionality.
» Nokia announced and began shipments of the Nokia 6210 Navigator, the first Nokia GPS-enabled device with an integrated compass for pedestrian guidance, and the Nokia 6220 classic.
Services & Software
» Nokia announced that it is focusing on develop-ing services in five core areas: music, maps, media, messaging and games.
» Nokia expanded Nokia Music Store, its digital mu-sic store, to a cumulative total of 12 across three continents in 2008, from one at the end of 2007.
» Nokia launched Comes With Music first in the United Kingdom, with the support of all major music labels–Universal Music Group International, Warner Music Group, Sony BMG Music Entertain-ment and EMI Group–numerous independent labels as well as music publishing rights.
» The number of titles available on the N-Gage mobile games service grew to 27 by the end of the year.
» Nokia updated Ovi.com with functionality for syncing your calendar, contacts, notes and tasks between a Nokia mobile device and www.ovi.com.
NAVTEQ
» NAVTEQ announced an industry strategy for map-enhanced ADAS (advanced driver assistance systems) using the Map-Enhanced Positioning Engine (MPE).
» NAVTEQ started providing both NAVTEQ Traffic RDS delivery service and NAVTEQ interactive advertis-ing services for multiple Garmin devices (the nuvi 755T and 775T and nuvi 2x5 family). Together with Garmin, NAVTEQ is the first to bring an advertising supported, real-time traffic service to market in North America.
» NAVTEQ expanded its portfolio of dynamic content –or real-time data–to include flight status and fuel prices, leveraging leading dynamic distribution capabilities from traffic and camera alerts.
Review by the Board of Directors
Nokia Siemens Networks
» At the Mobile World Congress 2008, Nokia Sie-mens Networks launched its LTE solution for radio and core networks, including the new Flexi Mul-timode Base Station, and in October announced that it had begun shipping LTE-compatible Flexi base stations.
» Nokia Siemens Networks demonstrated its technological leadership throughout the year with a number of industry-leading events: the launch of the industry’s first DWDM single optical platform serving Metro to Core; the world’s first demonstration of LTE-Advanced technology; a record-breaking 100 Gbps. transmission on a single wavelength for more than 1 040 kilometers over deployed field fiber (with Verizon); and the worlds fastest IHSPA data call using a mobile device.
» Nokia Siemens Networks secured major 3G radio access deals all over the world, from the UK to Mexico and Brazil to Indonesia.
» Nokia Siemens Networks’ Services expanded its global remote delivery capability, delivering more than 200 projects across the world with successes including major event support ensuring network quality and performance, software upgrades and maintenance, and network monitoring and plan-ning services.
» Nokia Siemens Networks continued to win major managed services deals including a breakthrough network operations agreement with Embarq Corporation in the United States.
» Demonstrating its ongoing commitment to devel-oping innovative solutions for emerging markets, Nokia Siemens Networks launched its eCommerce rural trading platform with Fujian Mobile in China, and added internet capability to its Village Con-nection solution.
» In November 2008, Nokia Siemens Networks an-nounced that it completed the preliminary plan-ning process to identify the proposed remaining headcount reductions necessary to reach its previously announced synergy-related headcount adjustment goal of 9 000 and began the process of sharing those plans with employees and their representatives.
» Nokia Siemens Networks achieved substantially all of the EUR 2.0 billion of targeted annual cost synergies by the end of 2008.
Acquisitions and divestments 2008
» On December 22, 2008, Nokia announced that it had signed an agreement to sell its security appliance business to Check Point Software Technologies. The disposal related to the renewal of Nokia’s business mobility strategy and discon-tinuance of developing and marketing its own behind-the-firewall business mobility solutions.
» On December 2, 2008, Nokia announced the completion of its acquisition of Symbian Limited, the company that develops and licenses Symbian OS, the market-leading operating system for mobile devices. The acquisition is an important step by Nokia and industry partners to develop Symbian OS into an open and unified mobile software platform, which will be licensed royalty-free and eventually move towards ‘open source’. Nokia and its partners plan to establish Symbian Foundation, an independent entity, to manage and unify the platform.
» On November 20, 2008, NAVTEQ announced an agreement to acquire T-Traffic Systems GmbH, a leading provider of traffic services in Germany. The acquisition was completed in January 2009.
» On November 4, 2008, Nokia announced the completion of its acquisition of OZ Communica-tions Inc., the leading consumer mobile messag-ing solution provider which delivers access to popular instant messaging and email services on consumer mobile devices.
» On July 15, 2008, Nokia announced the comple-tion of its acquisition of Plazes AG, a context-aware social activity service provider, to help Nokia to accelerate its vision of bringing people and places closer together, in line with Nokia’s broader services strategy.
» On July 10, 2008, Nokia completed the acquisition of NAVTEQ, a leading provider of comprehensive digital map information. As part of Nokia, NAVTEQ continues to develop its world-class expertise in the navigation industry, service its strong customer base, and invest in the further devel-opment of its industry-leading map data and technology platform.
» On June 17, 2008, Nokia announced the completion of its acquisition of Trolltech ASA, a recognized software provider with world-class software development platforms and frameworks. Trolltech now operates as Qt Software, taking its new name from its Qt technology that forms the basis for tens of thousands of commercial and open source applications.
» On May 15, 2008, Nokia announced the comple-tion of its disposal of Identity Systems to Infor-matica Corporation.

Review by the Board of Directors 5
Review by the Board of Directors
» On February 11, 2008, Nokia Siemens Networks announced that it had completed the acquisition of Apertio Ltd., a leading provider of open real-time subscriber data platforms and applications.
» On January 7, 2008, Nokia Siemens Networks announced the completion of the acquisition of Carrier Ethernet specialist Atrica.
Personnel
The average number of employees for 2008 was 121 723, (100 534 for 2007 and 65 324 for 2006). At December 31, 2008, Nokia employed a total of 125 829
people (112 262 at December 31, 2007, and 68 483 peo-ple at December 31, 2006). The total amount of wages and salaries paid in 2008 was EUR 5 615 million (EUR
4 664 million in 2007 and EUR 3 457 million in 2006).
Management and Board of Directors
Board of Directors, Group Executive Board and PresidentPursuant to the articles of association, Nokia has a Board of Directors composed of a minimum of seven and a maximum of twelve members. The members of the Board are elected for a term of one year at each Annual General Meeting, i.e. as from the close of that Annual General Meeting until the close of the following Annual General Meeting, which convenes each year by June 30. A general meeting may also dismiss a member of the Board of Directors. The Board has the responsi-bility for appointing and discharging the President as well as the CEO and the other members of the Group Executive Board. The CEO also acts as the President.
The current members of the Board of Directors were elected at the Annual General Meeting on May 8,
2008. On December 31, 2008, the Board consisted of the following members: Jorma Ollila (Chairman), Marjorie Scardino (Vice Chairman), Georg Ehrnrooth, Lalita D. Gupte, Bengt Holmström, Henning Kagermann, Per Karlsson, Olli-Pekka Kallasvuo, Risto Siilasmaa and Keijo Suila.
Information on shares and stock options held by the members of the Board of Directors and the Presi-dent and CEO (and the other members of the Group Executive Board) may be found in the Annual Accounts.
Changes in the Group Executive BoardVeli Sundbäck, Executive Vice President, Corporate Relations and Responsibility, resigned from the Group Executive Board as of December 31, 2008, but Mr. Sundbäck will continue in Nokia as an executive advisor until his retirement on May 31, 2009. Esko Aho, Executive Vice President, Corporate Relations and Re-sponsibility, was appointed as a member of the Group Executive Board as of January 1, 2009.
Service contractsOlli Pekka Kallasvuo’s service contract covers his cur-rent position as President and CEO and Chairman of the Group Executive Board. As at December 31, 2008, Mr. Kallasvuo’s annual total gross base salary, which is subject to an annual review by the Board of Directors and confirmation by the independent members of the Board, was EUR 1 176 000. His incentive targets under the Nokia short-term cash incentive plan are 150% of the annual gross base salary. In case of termination by Nokia for reasons other than cause, including a change of control, Mr. Kallasvuo is entitled to a severance pay-ment of up to 18 months of compensation (both the annual total gross base salary and target incentive). In case of termination by Mr. Kallasvuo, the notice period is six months and he is entitled to a payment for such notice period (both annual total gross base salary and target incentive for six months). Mr. Kallasvuo is subject to a 12-month non-competition obligation after termi-nation of the contract. Unless the contract is terminated for cause, Mr. Kallasvuo may be entitled to compensa-tion during the non-competition period or a part of it. Such compensation amounts to the annual total gross base salary and target incentive for the respective period during which no severance payment is paid.
Provisions on the amendment of Articles of Association
Amendment of the Articles of Association requires a decision of the general meeting, supported by two-thirds of the votes cast and two-thirds of the shares represented at the meeting. Amendment of the provisions of Article 13 of the Articles of Association requires a resolution supported by three-quarters of the votes cast and three-quarters of the shares repre-sented at the meeting.
Shares and share capital
Nokia has one class of shares. Each Nokia share entitles the holder to one vote at general meetings of Nokia.
In 2008, Nokia issued 3 546 508 new shares upon exercise of stock options issued to personnel in 2003 and 2005. Effective March 27, 2008, a total of 185 409 913 shares held by the company were cancelled. The issuance of new shares and cancella-tion of shares did not have an effect on the amount of share capital of the company. Neither the issuance nor the cancellation of shares had any significant effect on the relative holdings of the other shareholders of the company nor on their voting power.
Nokia repurchased through its share repurchase plan a total of 157.4 million shares on NASDAQ OMX
Helsinki at an aggregate price of approximately EUR
3 123 million during the period from January 25, 2008,
to August 7, 2008. The price paid is based on the mar-ket price at the time of repurchase. The shares were repurchased to be used for the purposes specified in the authorizations given by the Annual General Meet-ings of 2007 and 2008 to the Board. The aggregate amount of shares repurchased in 2008 represented approximately 4.1% of the total number of shares of the company and the total voting rights at the end of 2008. These new holdings did not have any significant effect on the relative holdings of the other sharehold-ers of the company nor on their voting power.
In 2008, Nokia transferred a total of 4.2 million Nokia shares held by it under the Performance Share Plans and 1.4 million shares held by it under its Restricted Share Plans as settlement under the plans to the Plan participants, personnel of Nokia Group. The amount of shares transferred represented ap-proximately 0.1% of the total number of shares of the company and the total voting rights. The transfers did not have a significant effect on the relative holdings of the other shareholders of the company nor on their voting power.
On December 31, 2008, Nokia and its subsidiary companies owned 103 076 379 Nokia shares. The shares represented approximately 2.7 % of the total number of the shares of the company and the total voting rights. The total number of shares at December 31, 2007, was 3 800 948 552. On December 31, 2008, Nokia’s share capital was EUR 245 896 461.96.
Information on the authorizations held by the Board of Directors in 2008 to issue shares and special rights entitling to shares, transfer shares and repurchase own shares as well as information on the shareholders, stock options, shareholders’ equity per share, dividend yield, price per earnings ratio, share prices, market capitalization, share turnover and average number of shares may be found in the Annual Accounts.
Industry and Nokia outlook for full year 2009
» While noting the extremely limited visibility, Nokia expects 2009 industry mobile device volumes to decline approximately 10% from 2008 levels.
» Nokia targets an increase in its market share in mobile devices in 2009.
» Nokia and Nokia Siemens Networks expect the mobile infrastructure and fixed infrastructure and related services market to decline 5% or more in Euro terms in 2009, from 2008 levels.
» Nokia and Nokia Siemens Networks target for Nokia Siemens Networks market share to remain constant in 2009, compared to 2008.

6 Nokia in 2008
Review by the Board of Directors
Subsequent events
In February 2009, Nokia issued EUR 1 750 million of Eurobonds with maturities of five and ten years under our EUR 3 000 million Euro Medium Term Note, or EMTN program, to repay part of its existing short-term borrowings. Nokia voluntarily cancelled its USD 2 000 million committed credit facility maturing in 2009 due to this repayment. In February 2009 Nokia also signed and fully drew down EUR 500 million loan from the European Investment Bank to finance part of its smartphone research and development expenses.
Risk factors
Set forth below is a description of risk factors that could affect Nokia. There may be, however, additional risks unknown to Nokia and other risks currently believed to be immaterial that could turn out to be material. These risks, either individually or together, could adversely affect our business, sales, results of operations, financial condition and share price from time to time.
» We are a global company and have sales in most countries of the world and, consequently, our sales and profitability are dependent on general economic conditions globally and locally. The impact of the current global economic turmoil and any further deterioration of global economic conditions, as well as the related financial crisis, on us, our customers and end-users of our products, services and solutions, and suppliers and collaborative partners may have a material adverse effect on our business, results of opera-tions and financial condition.
» Our sales and profitability depend materially on the development of the mobile and fixed com-munications industry as well as the growth and profitability of the new market segments that we target and our ability to successfully develop or acquire and market products, services and solu-tions in those segments. If the mobile and fixed communications industry develop in an adverse manner, or if the new market segments we target and invest in grow less or are less profitable than expected, or if new faster growing market segments emerge in which we have not invested, our business, results of operations and financial condition may be materially adversely affected.
» Competition in our industry is intense. Our failure to maintain or improve our market position or respond successfully to changes in the competi-tive landscape may have a material adverse effect on our business and results of operations.
» We need to have a competitive portfolio of prod-ucts, services and solutions that are preferred by our current and potential customers to those of our competitors. If we fail to achieve or maintain a competitive portfolio, our business, market share and results of operations may be materially adversely affected.
» Our business and results of operations, particu-larly our profitability, may be materially adversely affected if we are not able to successfully manage costs related to our products, services, solutions and operations.
» Our sales, costs and results of operations as well as the US dollar value of our dividends and mar-ket price of our ADSs are affected by exchange rate fluctuations, particularly between the euro, which is our reporting currency, and the US dollar, the Japanese yen, the Chinese yuan and the UK pound sterling, as well as certain other curren-cies.
» We depend on a limited number of suppliers for the timely delivery of sufficient amounts of fully functional components, sub-assemblies, soft-ware and content and for their compliance with our supplier requirements, such as our own and our customers’ product quality, safety, security and other standards. Their failure to deliver or meet those requirements could materially ad-versely affect our ability to deliver our products, services and solutions successfully and on time.
» We must timely and successfully develop or otherwise acquire the appropriate technologies to use in our business. If we fail to develop or oth-erwise acquire these technologies as required by the market, or to successfully commercialize such technologies as new advanced products, services and solutions that meet customer demand, or fail to do so on a timely basis, this may have a mate-rial adverse effect on our business and results of operations.
» Any actual or even alleged defects or other qual-ity issues in our products, services and solutions could materially adversely affect our sales, results of operations, reputation and the value of the Nokia brand.
» Our sales derived from, and assets located in, emerging market countries may be materially adversely affected by economic, regulatory and political developments in those countries or by other countries imposing regulations against imports to such countries. As sales from these countries represent a significant portion of our total sales, economic or political turmoil in these countries could materially adversely affect our sales and results of operations. Our investments in emerging market countries may also be sub-ject to other risks and uncertainties.
» Changes in various types of regulation and trade policies in countries around the world could have a material adverse effect on our business and results of operations.
» We are developing a number of new products, services and solutions together with other com-panies. If any of these companies were to fail to perform as planned, we may not be able to bring our products, services and solutions to market successfully or in a timely way and this could have a material adverse effect on our sales and results of operations.
» Our sales and results of operations could be ma-terially adversely affected if we fail to efficiently manage our manufacturing and logistics without interruption or make timely and appropriate adjustments, or fail to ensure that our products, services and solutions meet our and our custom-ers’ quality, safety, security and other require-ments and are delivered on time and in sufficient volumes.
» Our products, services and solutions include in-creasingly complex technologies, some of which have been developed by us or licensed to us by certain third parties. As a consequence, evaluat-ing the rights related to the technologies we use or intend to use is more and more challenging, and we expect increasingly to face claims that we have infringed third parties’ intellectual property rights. The use of these technologies may also result in increased licensing costs for us, restric-tions on our ability to use certain technologies in our products, services and solution offerings, and/or costly and time-consuming litigation, which could have a material adverse effect on our business, results of operations and financial condition.
» Our products, services and solutions include numerous new Nokia, NAVTEQ and Nokia Siemens Networks patented, standardized or proprietary technologies on which we depend. Third parties may use without a license or unlawfully infringe our intellectual property or commence actions seeking to establish the invalidity of the intel-lectual property rights of these technologies. This may have a material adverse effect on our business and results of operations.
» Our operations rely on the efficient and uninter-rupted operation of complex and centralized information technology systems and networks. If a system or network inefficiency, malfunction or disruption occurs, this could have a material adverse effect on our business and results of operations.

Review by the Board of Directors 7
Review by the Board of Directors
» The networks infrastructure business relies on a limited number of customers and large multi-year contracts. Unfavorable developments under such a contract or in relation to a major customer may adversely and materially affect our sales, results of operations and financial condition.
» Providing customer financing or extending pay-ment terms to customers can be a competitive requirement and could have a material adverse effect on our results of operations and financial condition.
» If we are unable to retain, motivate, develop and recruit appropriately skilled employees, our abil-ity to implement our strategies may be hampered and, consequently, that may have a material adverse effect on our business and results of operations.
» Some of the Siemens carrier-related operations transferred to Nokia Siemens Networks have been and continue to be the subject of various criminal and other governmental investigations related to whether certain transactions and payments arranged by some former employees of Siemens were unlawful. As a result of those in-vestigations, government authorities and others have taken and may take further actions against Siemens and/or its employees that may involve and affect the assets and employees transferred by Siemens to Nokia Siemens Networks, or there may be undetected additional violations that may have occurred prior to the transfer or violations that may have occurred after the transfer of such assets and employees that could have a material adverse effect on Nokia Siemens Networks and our reputation, business, results of operations and financial condition.
» An unfavorable outcome of litigation could have a material adverse effect on our business, results of operations and financial condition.
» Allegations of possible health risks from the elec-tromagnetic fields generated by base stations and mobile devices, and the lawsuits and public-ity relating to this matter, regardless of merit, could have a material adverse effect on our sales, results of operations, share price, reputation and brand value by leading consumers to reduce their use of mobile devices, by increasing difficulty in obtaining sites for base stations, or by leading regulatory bodies to set arbitrary use restrictions and exposure limits, or by causing us to allocate additional monetary and personnel resources to these issues.
Dividend
Nokia’s Board of Directors will propose a dividend of EUR 0.40 per share for 2008.

8 Nokia in 2008
2008 2007 2006Financial year ended December 31 Notes EURm EURm EURm
Net sales 50 710 51 058 41 121
Cost of sales – 33 337 – 33 781 – 27 742
Gross profit 17 373 17 277 13 379
Research and development expenses – 5 968 – 5 636 – 3 897
Selling and marketing expenses – 4 380 – 4 379 – 3 314
Administrative and general expenses – 1 284 – 1 165 – 666
Other income 6 420 2 312 522
Other expenses 6, 7 – 1 195 – 424 – 536
Operating profit 2–9, 22 4 966 7 985 5 488
Share of results of associated companies 14, 31 6 44 28
Financial income and expenses 10 – 2 239 207
Profit before tax 4 970 8 268 5 723
Tax 11 – 1 081 – 1 522 – 1 357
Profit before minority interests 3 889 6 746 4 366
Minority interests 99 459 – 60
Profit attributable to equity holders of the parent 3 988 7 205 4 306
Earnings per share 2008 2007 2006(for profit attributable to the equity holders of the parent) 28 EUR EUR EUR
Basic 1.07 1.85 1.06
Diluted 1.05 1.83 1.05
Average number of shares (1 000 shares) 28 2008 2007 2006
Basic 3 743 622 3 885 408 4 062 833
Diluted 3 780 363 3 932 008 4 086 529
See Notes to consolidated financial statements.
Nokia Corporation and Subsidiaries
Consolidated profit and loss accounts, IFRS
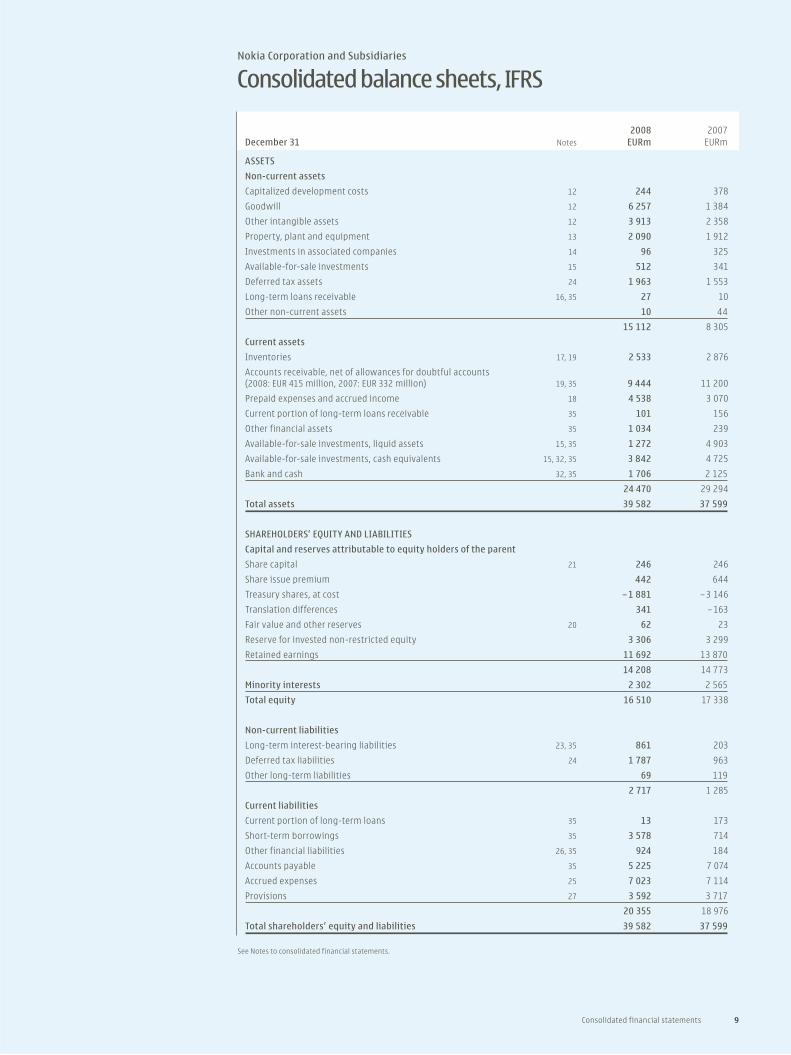
2008 2007December 31 Notes EURm EURm
ASSETS
Non-current assets
Capitalized development costs 12 244 378
Goodwill 12 6 257 1 384
Other intangible assets 12 3 913 2 358
Property, plant and equipment 13 2 090 1 912
Investments in associated companies 14 96 325
Available-for-sale investments 15 512 341
Deferred tax assets 24 1 963 1 553
Long-term loans receivable 16, 35 27 10
Other non-current assets 10 44
15 112 8 305
Current assets
Inventories 17, 19 2 533 2 876
Accounts receivable, net of allowances for doubtful accounts (2008: EUR 415 million, 2007: EUR 332 million) 19, 35 9 444 11 200
Prepaid expenses and accrued income 18 4 538 3 070
Current portion of long-term loans receivable 35 101 156
Other financial assets 35 1 034 239
Available-for-sale investments, liquid assets 15, 35 1 272 4 903
Available-for-sale investments, cash equivalents 15, 32, 35 3 842 4 725
Bank and cash 32, 35 1 706 2 125
24 470 29 294
Total assets 39 582 37 599
SHAREHOLDERS’ EQUITY AND LIABILITIES
Capital and reserves attributable to equity holders of the parent
Share capital 21 246 246
Share issue premium 442 644
Treasury shares, at cost – 1 881 – 3 146
Translation differences 341 – 163
Fair value and other reserves 20 62 23
Reserve for invested non-restricted equity 3 306 3 299
Retained earnings 11 692 13 870
14 208 14 773
Minority interests 2 302 2 565
Total equity 16 510 17 338
Non-current liabilities
Long-term interest-bearing liabilities 23, 35 861 203
Deferred tax liabilities 24 1 787 963
Other long-term liabilities 69 119
2 717 1 285
Current liabilities
Current portion of long-term loans 35 13 173
Short-term borrowings 35 3 578 714
Other financial liabilities 26, 35 924 184
Accounts payable 35 5 225 7 074
Accrued expenses 25 7 023 7 114
Provisions 27 3 592 3 717
20 355 18 976
Total shareholders’ equity and liabilities 39 582 37 599
See Notes to consolidated financial statements.
Consolidated financial statements 9
Nokia Corporation and Subsidiaries
Consolidated balance sheets, IFRS

10 Nokia in 2008
2008 2007 2006Financial year ended December 31 Notes EURm EURm EURm
Cash flow from operating activities
Profit attributable to equity holders of the parent 3 988 7 205 4 306
Adjustments, total 32 3 469 1 269 1 857
Change in net working capital 32 – 2 546 605 – 793
Cash generated from operations 4 911 9 079 5 370
Interest received 416 362 235
Interest paid – 155 – 59 – 18
Other financial income and expenses, net received – 195 – 43 54
Income taxes paid, net received – 1 780 – 1 457 – 1 163
Net cash from operating activities 3 197 7 882 4 478
Cash flow from investing activities
Acquisition of Group companies, net of acquired cash – 5 962 253 – 517
Purchase of current available-for-sale investments, liquid assets – 669 – 4 798 – 3 219
Purchase of non-current available-for-sale investments – 121 – 126 – 88
Purchase of shares in associated companies – 24 – 25 – 15
Additions to capitalized development costs – 131 – 157 – 127
Long-term loans made to customers — – 261 – 11
Proceeds from repayment and sale of long-term loans receivable 129 163 56
Recovery of impaired long-term loans made to customers — — 276
Proceeds from (+) / payment of (–) other long-term receivables – 1 5 – 3
Proceeds from (+) / payment of (–) short-term loans receivable – 15 – 119 199
Capital expenditures – 889 – 715 – 650
Proceeds from disposal of shares in associated companies 3 6 1
Proceeds from disposal of businesses 41 — —
Proceeds from maturities and sale of current available-for-sale investments, liquid assets 4 664 4 930 5 058
Proceeds from sale of non-current available-for-sale investments 10 50 17
Proceeds from sale of fixed assets 54 72 29
Dividends received 6 12 —
Net cash from (+)/used in (–) investing activities – 2 905 – 710 1 006
Cash flow from financing activities
Proceeds from stock option exercises 53 987 46
Purchase of treasury shares – 3 121 – 3 819 – 3 371
Proceeds from long-term borrowings 714 115 56
Repayment of long-term borrowings – 34 – 16 – 7
Proceeds from (+) / repayment of (–) short-term borrowings 2 891 661 – 137
Dividends paid – 2 048 – 1 760 – 1 553
Net cash used in financing activities – 1 545 – 3 832 – 4 966
Foreign exchange adjustment – 49 – 15 – 51
Net increase (+) / decrease (–) in cash and cash equivalents – 1 302 3 325 467
Cash and cash equivalents at beginning of period 6 850 3 525 3 058
Cash and cash equivalents at end of period 5 548 6 850 3 525
Cash and cash equivalents comprise of:
Bank and cash 1 706 2 125 1 479
Current available-for-sale investments, cash equivalents 15, 35 3 842 4 725 2 046
5 548 6 850 3 525
The figures in the consolidated cash flow statement cannot be directly traced from the balance sheet without additional information as a result of acquisitions and disposals of subsidiaries and net foreign exchange differences arising on consolidation.
See Notes to consolidated financial statements.
Nokia Corporation and Subsidiaries
Consolidated cash flow statements, IFRS

Consolidated financial statements 11
Reserve for Share Fair value invested Before Number of Share issue Treasury Translation and other non-restricted Retained minority MinorityEURm shares (1 000’s) capital premium shares differences reserves equity earnings interests interests Total
Balance at December 31, 2005 4 172 376 266 2 458 – 3 616 69 – 176 — 13 308 12 309 205 12 514
Tax benefit on stock options exercised 23 23 23
Excess tax benefit on share-based compensation 14 14 14
Translation differences – 141 – 141 – 13 – 154
Net investment hedge gains, net of tax 38 38 38
Cash flow hedges, net of tax 171 171 171
Available-for-sale investments, net of tax – 9 – 9 – 9
Other decrease, net – 52 – 52 – 1 – 53
Profit 4 306 4 306 60 4 366
Total recognized income and expense — 37 — – 103 162 — 4 254 4 350 46 4 396
Stock options exercised 3 046 43 43 43
Stock options exercised related to acquisitions – 1 – 1 – 1
Share-based compensation 1 219 219 219
Settlement of performance shares 2 236 – 69 38 – 31 – 31
Acquisition of treasury shares – 212 340 – 3 413 – 3 413 – 3 413
Reissuance of treasury shares 412 4 4 4
Cancellation of treasury shares – 20 20 4 927 – 4 927 — —
Dividend – 1 512 – 1 512 – 40 – 1 552
Acquisition of minority interests — – 119 – 119
Total of other equity movements – 20 212 1 556 — — — – 6 439 – 4 691 – 159 – 4 850
Balance at December 31, 2006 3 965 730 246 2 707 – 2 060 – 34 – 14 — 11 123 11 968 92 12 060
Excess tax benefit on share-based compensation 128 128 128
Translation differences – 167 – 167 16 – 151
Net investment hedge gains, net of tax 38 38 38
Cash flow hedges, net of tax – 11 – 11 – 11
Available-for-sale investments, net of tax 48 48 48
Other decrease, net – 40 – 40 – 40
Profit 7 205 7 205 – 459 6 746
Total recognized income and expense — 128 — – 129 37 — 7 165 7 201 – 443 6 758
Stock options exercised 57 269 46 932 978 978
Stock options exercised related to acquisitions – 3 – 3 – 3
Share-based compensation 228 228 228
Settlement of performance shares 3 138 – 104 58 9 – 37 – 37
Acquisition of treasury shares – 180 590 – 3 884 – 3 884 – 3 884
Reissuance of treasury shares 403 7 7 7
Cancellation of treasury shares 2 733 – 2 733 — —
Share premium reduction and transfer – 2 358 2 358 — —
Dividend – 1 685 – 1 685 – 75 – 1 760
Minority interest on formation of Nokia Siemens Networks — 2 991 2 991
Total of other equity movements — – 2 191 – 1 086 — — 3 299 – 4 418 – 4 396 2 916 – 1 480
Balance at December 31, 2007 3 845 950 246 644 – 3 146 – 163 23 3 299 13 870 14 773 2 565 17 338
Nokia Corporation and Subsidiaries
Consolidated statements of changes in shareholders’ equity, IFRS
1 In 2006 share-based compensation is shown net of deferred compensation recorded related to social security costs on share-based payments.

12 Nokia in 2008
Reserve for Share Fair value invested Before Number of Share issue Treasury Translation and other non-restricted Retained minority MinorityEURm shares (1 000’s) capital premium shares differences reserves equity earnings interests interests Total
Balance at December 31, 2007 3 845 950 246 644 – 3 146 – 163 23 3 299 13 870 14 773 2 565 17 338
Tax benefit on stock options exercised 4 4 4
Excess tax benefit on share-based compsensation – 121 – 121 – 121
Translation differences 595 595 — 595
Net investment hedge losses, net of tax – 91 – 91 – 91
Cash flow hedges, net of tax 42 42 42
Available-for-sale investments, net of tax – 3 – 3 – 3
Other increase, net 46 46 46
Profit 3 988 3 988 – 99 3 889
Total recognized income and expense — – 117 — 504 39 — 4 034 4 460 – 99 4 361
Stock options exercised 3 547 51 51 51
Stock options exercised related to acquisitions 1 1 1
Share-based compensation 74 74 74
Settlement of performance shares 5 622 – 179 154 – 44 – 69 – 69
Acquisition of treasury shares – 157 390 – 3 123 – 3 123 – 3 123
Reissuance of treasury shares 143 2 2 2
Cancellation of treasury shares 4 232 – 4 232 — —
Dividend – 1 992 – 1 992 – 35 – 2 027
Acquisitions and other changes in minority interests — – 129 – 129
Vested portion of share-based payment awards related to acquisitions 19 19 19
Acquisition of Symbian 12 12 12
Total of other equity movements — – 85 1 265 — — 7 – 6 212 – 5 025 – 164 – 5 189
Balance at December 31, 2008 3 697 872 246 442 – 1 881 341 62 3 306 11 692 14 208 2 302 16 510
Nokia Corporation and Subsidiaries
Consolidated statements of changes in shareholders’ equity, IFRS (continued)
Dividends declared per share were EUR 0.40 for 2008 (EUR 0.53 for 2007 and EUR 0.43 for 2006), subject to shareholders’ approval.

Notes to the consolidated financial statements 13
Notes to the consolidated financial statements
Notes to the consolidated financial statements
1. Accounting principles
Basis of presentation
The consolidated financial statements of Nokia Corpo-ration (“Nokia” or “the Group”), a Finnish public lim-ited liability company with domicile in Helsinki, in the Republic of Finland, are prepared in accordance with International Financial Reporting Standards as issued by the International Accounting Standards Board (“IASB”) and in conformity with IFRS as adopted by the European Union (collectively “IFRS”). The consolidated financial statements are presented in millions of euros (“EURm”), except as noted, and are prepared under the historical cost convention, except as disclosed in the accounting policies below. The notes to the con-solidated financial statements also conform to Finnish Accounting legislation. On March 5, 2009, Nokia’s Board of Directors authorized the financial statements for issuance and filing.
As described in Note 8 the Group completed the acquisition of all of the outstanding equity of NAVTEQ Corporation (“NAVTEQ“) on July 10, 2008 and a transac-tion to form Nokia Siemens Networks on April 1, 2007. The NAVTEQ and the Nokia Siemens Networks business combinations have had a material impact on the con-solidated financial statements and associated notes.
Adoption of pronouncements under IFRS
In the current year, the Group has adopted all of the new and revised standards, amendments and inter-pretations to existing standards issued by the IASB that are relevant to its operations and effective for accounting periods commencing on or after January 1, 2008.
» IFRS 8, Operating Segments requires the segment information to be presented on the same basis as that used for internal reporting purposes. Under IFRS 8, segments are components of the entity that are regularly reviewed by the chief operating decision-maker in order to allocate resources to a segment and to evaluate its performance.
» IFRIC 11, IFRS 2–Group and Treasury Share Trans-actions clarifies how IFRS 2 should be applied to share-based payment arrangements involving treasury shares, and arrangements involving grant of the entity’s own equity instruments or equity instruments of another entity within the same group.
» IFRIC 14 and IAS 19, The Limit on a Defined benefit Asset, Minimum Funding Requirements and their Interaction addresses when refunds or reductions in future contributions should be regarded as available when measuring a pension asset and how a minimum funding requirement might affect the availability of reductions in future contributions.
» IAS 39 and IFRS 7 (Amendments), Reclassification of Financial Instruments allow an entity to reclas-sify non-derivative financial assets out of the fair value through profit or loss and available-for-
sale categories in particular circumstances and require additional disclosures for the reclassifica-tions.
The adoption of each of the above mentioned stan-dards did not have a material impact to the Group’s balance sheet, profit and loss or cash flows.
Principles of consolidation
The consolidated financial statements include the accounts of Nokia’s parent company (“Parent Company”), and each of those companies over which the Group exercises control. Control over an entity is presumed to exist when the Group owns, directly or indirectly through subsidiaries, over 50% of the voting rights of the entity, the Group has the power to govern the operating and financial policies of the entity through agreement or the Group has the power to appoint or remove the majority of the members of the board of the entity.
The Group’s share of profits and losses of as-sociated companies is included in the consolidated profit and loss account in accordance with the equity method of accounting. An associated company is an entity over which the Group exercises significant influence. Significant influence is generally presumed to exist when the Group owns, directly or indirectly through subsidiaries, over 20% of the voting rights of the company.
All inter-company transactions are eliminated as part of the consolidation process. Minority interests are presented separately as a component of net profit and they are shown as a component of shareholders’ equity in the consolidated balance sheet.
Profits realized in connection with the sale of fixed assets between the Group and associated compa-nies are eliminated in proportion to share ownership. Such profits are deducted from the Group’s equity and fixed assets and released in the Group accounts over the same period as depreciation is charged.
The companies acquired during the financial periods presented have been consolidated from the date on which control of the net assets and operations was transferred to the Group. Similarly the result of a Group company divested during an accounting period is included in the Group accounts only to the date of disposal.
Business combinations
The purchase method of accounting is used to account for acquisitions of separate entities or businesses by the Group. The cost of an acquisition is measured as the aggregate of the fair values at the date of exchange of the assets given, liabilities incurred, equity instruments issued and costs directly attribut-able to the acquisition. Identifiable assets, liabilities and contingent liabilities acquired or assumed by the Group are measured separately at their fair value as of the acquisition date. The excess of the cost of the acquisition over the Group’s interest in the fair value
of the identifiable net assets acquired is recorded as goodwill.
Assessment of the recoverability of long-lived and intangible assets and goodwill
For the purposes of impairment testing, goodwill is al-located to cash-generating units that are expected to benefit from the synergies of the acquisition in which the goodwill arose.
The Group assesses the carrying value of goodwill annually or more frequently if events or changes in circumstances indicate that such carrying value may not be recoverable. The Group assesses the carrying value of identifiable intangible assets and long-lived assets if events or changes in circumstances indicate that such carrying value may not be recoverable. Factors that trigger an impairment review include underperformance relative to historical or projected future results, significant changes in the manner of the use of the acquired assets or the strategy for the overall business and significant negative industry or economic trends.
The Group conducts its impairment testing by determining the recoverable amount for the asset or cash-generating unit. The recoverable amount of an asset or a cash-generating unit is the higher of its fair value less costs to sell and its value in use. The recoverable amount is then compared to its carrying amount and an impairment loss is recognized if the recoverable amount is less than the carrying amount. Impairment losses are recognized immediately in the profit and loss account.
Foreign currency translation
Functional and presentation currencyThe financial statements of all Group entities are measured using the currency of the primary economic environment in which the entity operates (functional currency). The consolidated financial statements are presented in Euro, which is the functional and presen-tation currency of the Parent Company.
Transactions in foreign currenciesTransactions in foreign currencies are recorded at the rates of exchange prevailing at the dates of the individual transactions. For practical reasons, a rate that approximates the actual rate at the date of the transaction is often used. At the end of the accounting period, the unsettled balances on foreign currency receivables and liabilities are valued at the rates of ex-change prevailing at the year-end. Foreign exchange gains and losses arising from balance sheet items, as well as fair value changes in the related hedging instruments, are reported in Financial Income and Expenses.
Foreign Group companiesIn the consolidated accounts all income and expenses of foreign subsidiaries are translated into Euro at the average foreign exchange rates for the account-
14 Nokia in 2008
Notes to the consolidated financial statements
ing period. All assets and liabilities of foreign Group companies are translated into Euro at the year-end foreign exchange rates with the exception of goodwill arising on the acquisition of foreign companies prior to the adoption of IAS 21 (revised 2004) on January 1, 2005, which is translated to Euro at historical rates. Differences resulting from the translation of income and expenses at the average rate and assets and liabilities at the closing rate are treated as an adjust-ment affecting consolidated shareholders’ equity. On the disposal of all or part of a foreign Group company by sale, liquidation, repayment of share capital or abandonment, the cumulative amount or proportion-ate share of the translation difference is recognized as income or as expense in the same period in which the gain or loss on disposal is recognized.
Revenue recognition
Sales from the majority of the Group are recognized when the significant risks and rewards of ownership have transferred to the buyer, continuing managerial involvement usually associated with ownership and effective control have ceased, the amount of revenue can be measured reliably, it is probable that economic benefits associated with the transaction will flow to the Group and the costs incurred or to be incurred in respect of the transaction can be measured reliably. An immaterial part of the revenue from products sold through distribution channels is recognized when the reseller or distributor sells the products to the end users. The Group records reductions to revenue for special pricing agreements, price protection and other volume based discounts. Service revenue is generally recognized on a straight line basis over the service pe-riod unless there is evidence that some other method better represents the stage of completion. License fees from usage are recognized in the period in which the customer reports them to the Group.
The Group enters into transactions involving multiple components consisting of any combination of hardware, services and software. The commercial effect of each separately identifiable component of the transaction is evaluated in order to reflect the substance of the transaction. The consideration received from these transactions is allocated to each separately identifiable component based on the relative fair value of each component. The Group de-termines the fair value of each component by taking into consideration factors such as the price when the component or a similar component is sold separately by the Group or a third party. The consideration al-located to each component is recognized as revenue when the revenue recognition criteria for that compo-nent have been met. If the Group is unable to reliably determine the fair value attributable to the separately identifiable undelivered components, the Group de-fers revenue until the revenue recognition criteria for the undelivered components have been met.
In addition, sales and cost of sales from contracts involving solutions achieved through modification of complex telecommunications equipment are rec-ognized using the percentage of completion method
when the outcome of the contract can be estimated reliably. A contract’s outcome can be estimated reliably when total contract revenue and the costs to complete the contract can be estimated reliably, it is probable that the economic benefits associated with the contract will flow to the Group and the stage of contract completion can be measured reliably. When the Group is not able to meet those conditions, the policy is to recognize revenues only equal to costs incurred to date, to the extent that such costs are expected to be recovered.
Progress towards completion is measured by reference to cost incurred to date as a percentage of estimated total project costs, the cost-to-cost method.
The percentage of completion method relies on estimates of total expected contract revenue and costs, as well as dependable measurement of the progress made towards completing a particular project. Recognized revenues and profits are subject to revisions during the project in the event that the assumptions regarding the overall project outcome are revised. The cumulative impact of a revision in estimates is recorded in the period such revisions become likely and estimable. Losses on projects in progress are recognized in the period they become probable and estimable.
Shipping and handling costs
The costs of shipping and distributing products are included in cost of sales.
Research and development
Research and development costs are expensed as they are incurred, except for certain development costs, which are capitalized when it is probable that a development project will generate future economic benefits, and certain criteria, including commercial and technological feasibility, have been met. Capital-ized development costs, comprising direct labor and related overhead, are amortized on a systematic basis over their expected useful lives between two and five years.
Capitalized development costs are subject to regular assessments of recoverability based on anticipated future revenues, including the impact of changes in technology. Unamortized capitalized development costs determined to be in excess of their recoverable amounts are expensed immediately.
Other intangible assets
Acquired patents, trademarks, licenses, software licenses for internal use, customer relationships and developed technology are capitalized and amortized using the straight-line method over their useful lives, generally 3 to 6 years, but not exceeding 20 years. Where an indication of impairment exists, the carry-ing amount of any intangible asset is assessed and written down to its recoverable amount.
Pensions
The Group companies have various pension schemes in accordance with the local conditions and practices in the countries in which they operate. The schemes are generally funded through payments to insurance companies or to trustee-administered funds as deter-mined by periodic actuarial calculations.
In a defined contribution plan, the Group has no legal or constructive obligation to make any additional contributions if the party receiving the contributions is unable to pay the pension obligations in question. The Group’s contributions to defined con-tribution plans, multi-employer and insured plans are recognized in the profit and loss account in the period to which the contributions relate.
All arrangements that do not fulfill these conditions are considered defined benefit plans. If a defined benefit plan is funded through an insurance contract where the Group does not retain any legal or constructive obligations, such a plan is treated as a defined contribution plan.
For defined benefit plans, pension costs are assessed using the projected unit credit method: The pension cost is recognized in the profit and loss account so as to spread the service cost over the service lives of employees. The pension obligation is measured as the present value of the estimated future cash outflows using interest rates on high quality cor-porate bonds with appropriate maturities. Actuarial gains and losses outside the corridor are recognized over the average remaining service lives of employees. The corridor is defined as ten percent of the greater of the value of plan assets or defined benefit obligation at the beginning of the respective year.
Past service costs are recognized immediately in income, unless the changes to the pension plan are conditional on the employees remaining in service for a specified period of time (the vesting period). In this case, the past service costs are amortized on a straight-line basis over the vesting period.
The liability (or asset) recognized in the balance sheet is pension obligation at the closing date less the fair value of plan assets, the share of unrecognized actuarial gains and losses, and past service costs.
Property, plant and equipment
Property, plant and equipment are stated at cost less accumulated depreciation. Depreciation is recorded on a straight-line basis over the expected useful lives of the assets as follows:
Buildings and constructions 20–33 years
Production machinery, measuring and test equipment . 1–3 years
Other machinery and equipment 3–10 years
Land and water areas are not depreciated.Maintenance, repairs and renewals are generally
charged to expense during the financial period in which they are incurred. However, major renovations

Notes to the consolidated financial statements 15
Notes to the consolidated financial statements
are capitalized and included in the carrying amount of the asset when it is probable that future economic benefits in excess of the originally assessed standard of performance of the existing asset will flow to the Group. Major renovations are depreciated over the remaining useful life of the related asset. Leasehold improvements are depreciated over the shorter of the lease term or useful life.
Gains and losses on the disposal of fixed assets are included in operating profit/loss.
Leases
The Group has entered into various operating leases, the payments under which are treated as rentals and recognized in the profit and loss account on a straight-line basis over the lease terms unless another systematic approach is more representative of the pattern of the user’s benefit.
Inventories
Inventories are stated at the lower of cost or net realizable value. Cost is determined using standard cost, which approximates actual cost on a FIFO basis. Net realizable value is the amount that can be realized from the sale of the inventory in the normal course of business after allowing for the costs of realization.
In addition to the cost of materials and direct labor, an appropriate proportion of production over-head is included in the inventory values.
An allowance is recorded for excess inventory and obsolescence based on the lower of cost or net realizable value.
Financial assets
The Group has classified its financial assets as one of the following categories: available-for-sale invest-ments, loans and receivables, bank and cash and financial assets at fair value through profit or loss.
Available-for-sale investmentsThe Group classifies the following investments as available for sale based on the purpose for acquiring the investments as well as ongoing intentions: (1) highly liquid, interest-bearing investments with ma-turities at acquisition of less than 3 months, which are classified in the balance sheet as current available-for-sale investments, cash equivalents, (2) similar types of investments as in category (1), but with maturities at acquisition of longer than 3 months, classified in the balance sheet as current available-for-sale invest-ments, liquid assets, (3) investments in technology related publicly quoted equity shares, or unlisted private equity shares and unlisted funds, classified in the balance sheet as non-current available-for-sale investments.
Current fixed income and money-market invest-ments are fair valued by using quoted market rates, discounted cash flow analyses and other appropriate
valuation models at the balance sheet date. Invest-ments in publicly quoted equity shares are measured at fair value using exchange quoted bid prices. Other available-for-sale investments carried at fair value include holdings in unlisted shares. Fair value is estimated by using various factors, including, but not limited to: (1) the current market value of similar instruments, (2) prices established from a recent arm’s length financing transaction of the target companies, (3) analysis of market prospects and operating perfor-mance of the target companies taking into consider-ation the public market of comparable companies in similar industry sectors. The remaining available-for-sale investments are carried at cost less impairment, which are technology related investments in private equity shares and unlisted funds for which the fair value cannot be measured reliably due to non-exis-tence of public markets or reliable valuation methods against which to value these assets. The investment and disposal decisions on these investments are busi-ness driven.
All purchases and sales of investments are recorded on the trade date, which is the date that the Group commits to purchase or sell the asset.
The fair value changes of available-for-sale investments are recognized in fair value and other reserves as part of shareholders’ equity, with the exception of interest calculated using effective inter-est method and foreign exchange gains and losses on monetary assets, which are recognized directly in profit and loss. Dividends on available-for-sale equity instruments are recognized in profit and loss when the Group’s right to receive payment is established. When the investment is disposed of, the related accumulated fair value changes are released from shareholders’ equity and recognized in the profit and loss account. The weighted average method is used when determining the cost-basis of publicly listed equities being disposed of. FIFO (First-in First-out) method is used to determine the cost basis of fixed income securities being disposed of. An impairment is recorded when the carrying amount of an available-for-sale investment is greater than the estimated fair value and there is objective evidence that the asset is impaired including but not limited to counterparty default and other factors causing a reduction in value that can be considered permanent. The cumulative net loss relating to that investment is removed from equity and recognized in the profit and loss account for the period. If, in a subsequent period, the fair value of the investment in a non-equity instrument increases and the increase can be objectively related to an event occurring after the loss was recognized, the loss is reversed, with the amount of the reversal included in the profit and loss account.
Loans receivableLoans receivable include loans to customers and suppliers and are measured at amortized cost using the effective interest method less impairment. Loans are subject to regular and thorough review as to their collectability and as to available collateral; in the event that any loan is deemed not fully recoverable, a provision is made to reflect the shortfall between
the carrying amount and the present value of the ex-pected cash flows. Interest income on loans receivable is recognized by applying the effective interest rate. The long term portion of loans receivable is included on the balance sheet under long-term loans receivable and the current portion under current portion of long-term loans receivable.
Bank and cashBank and cash consist of cash at bank and in hand.
Accounts receivableAccounts receivable are carried at the original amount invoiced to customers, which is considered to be fair value, less allowances for doubtful accounts based on a periodic review of all outstanding amounts including an analysis of historical bad debt, customer concentrations, customer creditworthiness, current economic trends and changes in our customer pay-ment terms. Bad debts are written off when identified as uncollectible.
Financial liabilities
Loans payableLoans payable are recognized initially at fair value, net of transaction costs incurred. Any difference between the fair value and the proceeds received is recognized in profit and loss at initial recognition. In the subse-quent periods, they are stated at amortized cost using the effective interest method. The long term portion of loans payable is included on the balance sheet under long-term interest-bearing liabilities and the current portion under current portion of long-term loans.
Accounts payableAccounts payable are carried at the original invoiced amount, which is considered to be fair value due to the short-term nature.
Derivative financial instruments
All derivatives are initially recognized at fair value on the date a derivative contract is entered into and are subsequently remeasured at their fair value. The method of recognizing the resulting gain or loss varies according to whether the derivatives are designated and qualify under hedge accounting or not.
Derivatives not designated in hedge accounting relationships carried at fair value through profit and loss
Fair values of forward rate agreements, interest rate options, futures contracts and exchange traded options are calculated based on quoted market rates at each balance sheet date. Discounted cash flow analyses are used to value interest rate and currency swaps. Changes in the fair value of these contracts are recognized in the profit and loss account.
Fair values of cash settled equity derivatives are calculated by revaluing the contract at each balance

16 Nokia in 2008
Notes to the consolidated financial statements
sheet date end quoted market rates. Changes in fair value are recognized in the profit and loss account.
Forward foreign exchange contracts are valued at the market forward exchange rates. Changes in fair value are measured by comparing these rates with the original contract forward rate. Currency options are valued at each balance sheet date by using the Garman & Kohlhagen option valuation model. Changes in the fair value on these instruments are recognized in the profit and loss account.
Embedded derivatives are identified and moni-tored by the Group and fair valued as at each balance sheet date. In assessing the fair value of embedded derivatives, the Group employs a variety of methods including option pricing models and discounted cash flow analysis using assumptions that are based on market conditions existing at each balance sheet date. The fair value changes are recognized in the profit and loss account.
Hedge accounting
Cash flow hedges: Hedging of anticipated foreign currency denominated sales and purchases
The Group applies hedge accounting for “Qualifying hedges”. Qualifying hedges are those properly docu-mented cash flow hedges of the foreign exchange rate risk of future anticipated foreign currency denomi-nated sales and purchases that meet the requirements set out in IAS 39. The cash flow being hedged must be “highly probable” and must present an exposure to variations in cash flows that could ultimately affect profit or loss. The hedge must be highly effective both prospectively and retrospectively.
The Group claims hedge accounting in respect of certain forward foreign exchange contracts and options, or option strategies, which have zero net pre-mium or a net premium paid, and where the critical terms of the bought and sold options within a collar or zero premium structure are the same and where the nominal amount of the sold option component is no greater than that of the bought option.
For qualifying foreign exchange forwards the change in fair value that reflects the change in spot exchange rates is deferred in shareholders’ equity to the extent that the hedge is effective. For qualifying foreign exchange options, or option strategies, the change in intrinsic value is deferred in shareholders’ equity to the extent that the hedge is effective. In all cases the ineffective portion is recognized immedi-ately in the profit and loss account as financial income and expenses. Hedging costs, expressed either as the change in fair value that reflects the change in forward exchange rates less the change in spot ex-change rates for forward foreign exchange contracts, or changes in the time value for options, or options strategies, are recognized within other operating income or expenses.
Accumulated fair value changes from qualifying hedges are released from shareholders’ equity into the profit and loss account as adjustments to sales and cost of sales, in the period when the hedged cash flow affects the profit and loss account. If the hedged
cash flow is no longer expected to take place, all deferred gains or losses are released immediately into the profit and loss account as adjustments to sales and cost of sales. If the hedged cash flow ceases to be highly probable, but is still expected to take place, ac-cumulated gains and losses remain in equity until the hedged cash flow affects the profit and loss account.
Changes in the fair value of any derivative instru-ments that do not qualify for hedge accounting under IAS 39 are recognized immediately in the profit and loss account. The fair value changes of derivative instruments that directly relate to normal business operations are recognized within other operating income and expenses. The fair value changes from all other derivative instruments are recognized in financial income and expenses.
Cash flow hedges: Hedging of foreign currency risk of highly probable business acquisitions and other transactions
The Group hedges the cash flow variability due to foreign currency risk inherent in highly probable business acquisitions and other future transactions that result in the recognition of non-financial assets. When those non-financial assets are recognized in the balance sheet the gains and losses previously deferred in equity are transferred from equity and included in the initial acquisition cost of the asset. The deferred amounts are ultimately recognized in the profit and loss as a result of goodwill assessments in case of business acquisitions and through depreciation in case of other assets. In order to apply for hedge ac-counting, the forecasted transactions must be highly probable and the hedges must be highly effective prospectively and retrospectively.
The Group claims hedge accounting in respect of forward foreign exchange contracts, foreign currency denominated loans, and options, or option strategies, which have zero net premium or a net premium paid, and where the terms of the bought and sold options within a collar or zero premium structure are the same.
For qualifying foreign exchange forwards, the change in fair value that reflects the change in spot exchange rates is deferred in shareholders’ equity. The change in fair value that reflects the change in for-ward exchange rates less the change in spot exchange rates is recognized in the profit and loss account within financial income and expenses. For qualify-ing foreign exchange options the change in intrinsic value is deferred in shareholders’ equity. Changes in the time value are at all times recognized directly in the profit and loss account as financial income and expenses. In all cases the ineffective portion is recognized immediately in the profit and loss account as financial income and expenses.
Hedges of net investments in foreign operationsThe Group also applies hedge accounting for its for-eign currency hedging on net investments.
Qualifying hedges are those properly document-ed hedges of the foreign exchange rate risk of foreign currency denominated net investments that meet the requirements set out in IAS 39. The hedge must be
effective both prospectively and retrospectively.The Group claims hedge accounting in respect of
forward foreign exchange contracts, foreign currency denominated loans, and options, or option strategies, which have zero net premium or a net premium paid, and where the terms of the bought and sold options within a collar or zero premium structure are the same.
For qualifying foreign exchange forwards, the change in fair value that reflects the change in spot exchange rates is deferred in shareholders’ equity. The change in fair value that reflects the change in for-ward exchange rates less the change in spot exchange rates is recognized in the profit and loss account within financial income and expenses. For qualify-ing foreign exchange options the change in intrinsic value is deferred in shareholders’ equity. Changes in the time value are at all times recognized directly in the profit and loss account as financial income and expenses. If a foreign currency denominated loan is used as a hedge, all foreign exchange gains and losses arising from the transaction are recognized in share-holders’ equity. In all cases the ineffective portion is recognized immediately in the profit and loss account as financial income and expenses.
Accumulated fair value changes from qualifying hedges are released from shareholders’ equity into the profit and loss account only if the legal entity in the given country is sold, liquidated, repays its share capital or is abandoned.
Income taxes
Current taxes are based on the results of the Group companies and are calculated according to local tax rules.
Deferred tax assets and liabilities are deter-mined, using the liability method, for all temporary differences arising between the tax bases of assets and liabilities and their carrying amounts in the con-solidated financial statements. Deferred tax assets are recognized to the extent that it is probable that future taxable profit will be available against which the unused tax losses or deductible temporary differences can be utilized. Deferred tax liabilities are recognized for temporary differences that arise between the fair value and tax base of identifiable net assets acquired in business combinations.
The enacted or substantially enacted tax rates as of each balance sheet date that are expected to apply in the period when the asset is realized or the liability is settled are used in the measurement of deferred tax assets and liabilities.
Deferred taxes are recognized directly in equity, when temporary differences arise on items that are not recognized in the profit and loss.
Provisions
Provisions are recognized when the Group has a present legal or constructive obligation as a result of past events, it is probable that an outflow of resources
Notes to the consolidated financial statements 17
Notes to the consolidated financial statements
will be required to settle the obligation and a reli-able estimate of the amount can be made. Where the Group expects a provision to be reimbursed, the reimbursement is recognized as an asset only when the reimbursement is virtually certain. At each bal-ance sheet date, the Group assesses the adequacy of its preexisting provisions and adjusts the amounts as necessary based on actual experience and changes in future estimates.
Warranty provisionsThe Group provides for the estimated liability to repair or replace products under warranty at the time revenue is recognized. The provision is an estimate calculated based on historical experience of the level of repairs and replacements.
Intellectual property rights (IPR) provisionsThe Group provides for the estimated future settle-ments related to asserted and unasserted IPR infringe-ments based on the probable outcome of potential infringement.
Tax provisionsThe Group recognizes a provision for tax contingen-cies based upon the estimated future settlement amount at each balance sheet date.
Restructuring provisionsThe Group provides for the estimated cost to restruc-ture when a detailed formal plan of restructuring has been completed and the restructuring plan has been announced.
Other provisionsThe Group recognizes the estimated liability for non-cancellable purchase commitments for inventory in excess of forecasted requirements at each balance sheet date.
The Group provides for onerous contracts based on the lower of the expected cost of fulfilling the contract and the expected cost of terminating the contract.
Share-based compensation
The Group offers three types of equity settled share-based compensation schemes for employees: stock options, performance shares and restricted shares. Employee services received, and the corresponding increase in equity, are measured by reference to the fair value of the equity instruments as of the date of grant, excluding the impact of any non-market vesting conditions. Non-market vesting conditions attached to the performance shares are included in assump-tions about the number of shares that the employee will ultimately receive. On a regular basis, the Group reviews the assumptions made and, where necessary, revises its estimates of the number of performance shares that are expected to be settled. Share-based compensation is recognized as an expense in the prof-it and loss account over the service period. A separate vesting period is defined for each quarterly lot of the
stock options plans. When stock options are exercised, the proceeds received net of any transaction costs are credited to share premium and the reserve for invested non-restricted equity.
Treasury shares
The Group recognizes acquired treasury shares as a deduction from equity at their acquisition cost. When cancelled, the acquisition cost of treasury shares is recognized in retained earnings.
Dividends
Dividends proposed by the Board of Directors are not recorded in the financial statements until they have been approved by the shareholders at the Annual General Meeting.
Earnings per share
The Group calculates both basic and diluted earnings per share. Basic earnings per share is computed using the weighted average number of shares outstanding during the period. Diluted earnings per share is com-puted using the weighted average number of shares outstanding during the period plus the dilutive effect of stock options, restricted shares and performance shares outstanding during the period.
Use of estimates
The preparation of financial statements in conformity with IFRS requires the application of judgment by management in selecting appropriate assumptions for calculating financial estimates, which inherently contain some degree of uncertainty. Management bases its estimates on historical experience and various other assumptions that are believed to be reasonable under the circumstances, the results of which form the basis for making judgments about the reported carrying values of assets and liabilities and the reported amounts of revenues and expenses that may not be readily apparent from other sources. Actual results may differ from these estimates under different assumptions or conditions.
Set forth below are areas requiring significant judgment and estimation that may have an impact on reported results and the financial position.
Revenue recognitionSales from the majority of the Group are recognized when the significant risks and rewards of ownership have transferred to the buyer, continuing managerial involvement usually associated with ownership and effective control have ceased, the amount of revenue can be measured reliably, it is probable that economic benefits associated with the transaction will flow to the Group and the costs incurred or to be incurred in respect of the transaction can be measured reliably.
Sales may materially change if management’s assess-ment of such criteria was determined to be inaccurate.
The Group makes price protection adjustments based on estimates of future price reductions and certain agreed customer inventories at the date of the price adjustment. Possible changes in these estimates could result in revisions to the sales in future periods.
Revenue from contracts involving solutions achieved through modification of complex tele-communications equipment is recognized on the percentage of completion basis when the outcome of the contract can be estimated reliably. Recog-nized revenues and profits are subject to revisions during the project in the event that the assumptions regarding the overall project outcome are revised. Current sales and profit estimates for projects may materially change due to the early stage of a long-term project, new technology, changes in the project scope, changes in costs, changes in timing, changes in customers’ plans, realization of penalties, and other corresponding factors.
Customer financingThe Group has provided a limited amount of customer financing and agreed extended payment terms with selected customers. Should the actual financial posi-tion of the customers or general economic conditions differ from assumptions, the ultimate collectability of such financings and trade credits may be required to be re-assessed, which could result in a write-off of these balances and thus negatively impact profits in future periods. The Group endeavors to mitigate this risk through the transfer of its rights to the cash col-lected from these arrangements to third party finan-cial institutions on a non-recourse basis in exchange for an upfront cash payment.
Allowances for doubtful accountsThe Group maintains allowances for doubtful accounts for estimated losses resulting from the subsequent in-ability of customers to make required payments. If the financial conditions of customers were to deteriorate, resulting in an impairment of their ability to make payments, additional allowances may be required in future periods.
Inventory-related allowancesThe Group periodically reviews inventory for excess amounts, obsolescence and declines in market value below cost and records an allowance against the inventory balance for any such declines. These reviews require management to estimate future demand for products. Possible changes in these estimates could result in revisions to the valuation of inventory in future periods.
Warranty provisionsThe Group provides for the estimated cost of product warranties at the time revenue is recognized. The Group’s warranty provision is established based upon best estimates of the amounts necessary to settle future and existing claims on products sold as of each balance sheet date. As new products incorporating complex technologies are continuously introduced,

18 Nokia in 2008
Notes to the consolidated financial statements
and as local laws, regulations and practices may change, changes in these estimates could result in ad-ditional allowances or changes to recorded allowances being required in future periods.
Provision for intellectual property rights, or IPR, infringements
The Group provides for the estimated future settlements related to asserted and unasserted IPR infringements based on the probable outcome of potential infringement. IPR infringement claims can last for varying periods of time, resulting in irregular movements in the IPR infringement provision. The ul-timate outcome or actual cost of settling an individual infringement may materially vary from estimates.
Legal contingenciesLegal proceedings covering a wide range of matters are pending or threatened in various jurisdictions against the Group. Provisions are recorded for pending litigation when it is determined that an unfavorable outcome is probable and the amount of loss can be reasonably estimated. Due to the inherent uncertain nature of litigation, the ultimate outcome or actual cost of settlement may materially vary from estimates.
Capitalized development costsThe Group capitalizes certain development costs when it is probable that a development project will generate future economic benefits and certain criteria, includ-ing commercial and technological feasibility, have been met. Should a product fail to substantiate its estimated feasibility or life cycle, material develop-ment costs may be required to be written-off in future periods.
Business combinationsThe purchase method of accounting is used to account for acquisitions of separate entities or businesses by the Group. The cost of an acquisition is measured as the aggregate of the fair values at the date of exchange of the assets given, liabilities incurred, equity instruments issued and costs directly attribut-able to the acquisition. Identifiable assets, liabilities and contingent liabilities acquired or assumed by the Group are measured separately at their fair value as of the acquisition date. The excess of the cost of the acquisition over the Group’s interest in the fair value of the identifiable net assets acquired is recorded as goodwill.
The allocation of fair values to the identifiable as-sets acquired and liabilities assumed is based on vari-ous assumptions requiring management judgment. Actual results may differ from the forecasted amounts and the difference could be material.
Assessment of the recoverability of long-lived assets, intangible assets and goodwill
The recoverable amounts for long-lived assets, intangible assets and goodwill have been determined based on value in use calculations. Value in use is calculated based on the expected future cash flows attributable to the asset or cash-generating unit discounted to present value. The key assumptions ap-
plied in the determination of the value in use include the discount rate, length of the explicit forecast period and estimated growth rates, profit margins and level of operational and capital investment. Amounts esti-mated could differ materially from what will actually occur in the future.
Fair value of derivatives and other financial instruments
The fair value of financial instruments that are not traded in an active market (for example, unlisted equi-ties, currency options and embedded derivatives) are determined using various valuation techniques. The Group uses judgment to select an appropriate valua-tion methodology as well as underlying assumptions based on existing market practice and conditions. Changes in these assumptions may cause the Group to recognize impairments or losses in future periods.
Income taxesManagement judgment is required in determining provisions for income taxes, deferred tax assets and liabilities and the extent to which deferred tax assets can be recognized. If the final outcome of these matters differs from the amounts initially recorded, differences may impact the income tax and deferred tax provisions in the period in which such determina-tion is made.
PensionsThe determination of pension benefit obligation and expense for defined benefit pension plans is dependent on the selection of certain assumptions used by actuaries in calculating such amounts. Those assumptions include, among others, the discount rate, expected long-term rate of return on plan assets and annual rate of increase in future compensation levels. A portion of plan assets is invested in equity securities which are subject to equity market volatility. Changes in assumptions and actuarial conditions may materi-ally affect the pension obligation and future expense.
Share-based compensationThe Group operates various types of equity settled share-based compensation schemes for employees. Fair value of stock options is based on certain assump-tions, including, among others, expected volatility and expected life of the options. Non-market vesting con-ditions attached to performance shares are included in assumptions about the number of shares that the employee will ultimately receive relating to projec-tions of net sales and earnings per share. Significant differences in equity market performance, employee option activity and the Group’s projected and actual net sales and earnings per share performance, may materially affect future expense.
New accounting pronouncements under IFRS
The Group will adopt the following new and revised standards, amendments and interpretations to exist-ing standards issued by the IASB that are expected to be relevant to its operations:
Amendment to IFRS 2, Share-based payment, Group and Treasury Share Transactions, clarifies the definition of different vesting conditions, treatment of all non-vesting conditions and provides further guid-ance on the accounting treatment of cancellations by parties other than the entity.
IAS 1 (Revised), Presentation of financial state-ments, prompts entities to aggregate information in the financial statements on the basis of shared characteristics. All non-owner changes in equity (i.e. comprehensive income) should be presented either in one statement of comprehensive income or in a separate income statement and statement of compre-hensive income.
Amendment to IAS 20, Accounting for govern-ment grants and disclosure of government assistance, requires that the benefit of a below-market rate gov-ernment loan is measured as the difference between the carrying amount in accordance with IAS 39 and the proceeds received, with the benefit accounted for in accordance with IAS 20.
Amendment to IAS 23, Borrowing costs, changes the treatment of borrowing costs that are directly attributable to an acquisition, construction or production of a qualifying asset. These costs will consequently form part of the cost of that asset. Other borrowing costs are recognized as an expense.
Under the amended IAS 32 Financial Instru-ments: Presentation, the Group must classify puttable financial instruments or instruments or components thereof that impose an obligation to deliver to another party, a pro-rata share of net assets of the entity only on liquidation, as equity. Previously, these instruments would have been classified as financial liabilities.
IFRIC 13, Customer Loyalty Programs addresses the accounting surrounding customer loyalty pro-grams and whether some consideration should be allocated to free goods or services provided by a company. Consideration should be allocated to award credits based on their fair value, as they are a sepa-rately identifiable component.
IFRIC 16, Hedges of a Net Investment in a Foreign Operation clarifies the accounting treatment in respect of net investment hedging. This includes the fact that net investment hedging relates to differences in functional currency not presentation currency, and hedging instruments may be held anywhere in the group.
IFRIC 18 Transfers of Assets from Customers clarifies the requirements for agreements in which an entity receives an item of property, plant and equipment or cash it is required to use to construct or acquire an item of property, plant and equipment that must be used to provide access to a supply of goods or services.
IFRS 3 (revised) Business Combinations replaces IFRS 3 (as issued in 2004). The main changes brought by IFRS 3 (revised) include immediate recognition of all acquisition-related costs in profit or loss, recognition of subsequent changes in the fair value of contingent consideration in accordance with other IFRSs and measurement of goodwill arising from step acquisitions at the acquisition date.

Notes to the consolidated financial statements 19
Notes to the consolidated financial statements
2. Segment information
As of January 1, 2008, the Group’s three mobile device business groups and the supporting horizontal groups have been replaced by an integrated business segment, Devices & Services. Devices & Services and Nokia Siemens Networks are each reportable segments for financial reporting purposes. Com-mencing with the third quarter 2008, NAVTEQ is also a reportable segment. Prior period results for Nokia and its reportable segments have been regrouped for comparabality purposes according to the new report-able segments effective in 2008.
Nokia is organized on a worldwide basis into three reportable segments: Devices & Services, NAVTEQ, and Networks. Nokia’s reportable segments represent the strategic business units that offer different products and services for which monthly financial information is provided to the chief operat-ing decision-maker.
Devices & Services segment is responsible for developing and managing the Group’s portfolio of mo-bile devices and consumer Internet services, as well as the management of our supply chains, sales channels, brand and marketing activities.
NAVTEQ is a leading provider of comprehensive digital map information for automotive systems, mobile navigation devices, Internet-based mapping applications, and government and business solutions.
Nokia Siemens Networks provides mobile and fixed network solutions and services to operators and service providers.
Corporate Common Functions consists of com-pany wide functions.
The accounting policies of the segments are the same as those described in Note 1. Nokia accounts for intersegment revenues and transfers as if the rev-enues or transfers were to third parties, that is, at cur-rent market prices. Nokia evaluates the performance of its segments and allocates resources to them based on operating profit.
No single customer represents 10% or more of Group revenues.
IAS 27 (revised), “Consolidated and Separate Financial Statements” clarifies presentation of changes in parent-subsidiary ownership. Changes in a parent’s ownership interest in a subsidiary that do not result in the loss of control must be accounted for exclusively within equity. If a parent loses control of a subsidiary it shall derecognize the consolidated assets and liabilities, and any investment retained in the former subsidiary shall be recognized at fair value at the date when control is lost. Any differences resulting from this shall be recognized in profit or loss. When losses attributed to the minority (non-controlling) interests exceed the minority’s interest in the subsidiary’s equity, these losses shall be allocated to the non-controlling interests even if this results in a deficit balance.
In addition, there are a number of other amend-ments that form part of the IASB’s annual improve-ment project, which will be adopted by the Group on January 1, 2009.
The Group will adopt the amendments to IFRS 2, IAS 1, IAS 20, IAS 23, IAS 32, IFRIC 13, IFRIC 16 and IFRIC 18 as well as the additional amendments that form part of the IASB’s annual improvement project on January 1, 2009. The Group does not expect that the adoption of these revised standards, interpretations and amendments will have a material impact on the financial condition and results of operations.
The Group is required to adopt both IFRS 3 (revised) and IAS 27 (revised) on January 1, 2010 with early adoption permitted. The Group is currently evaluating the impact of these standards on the Group’s accounts.
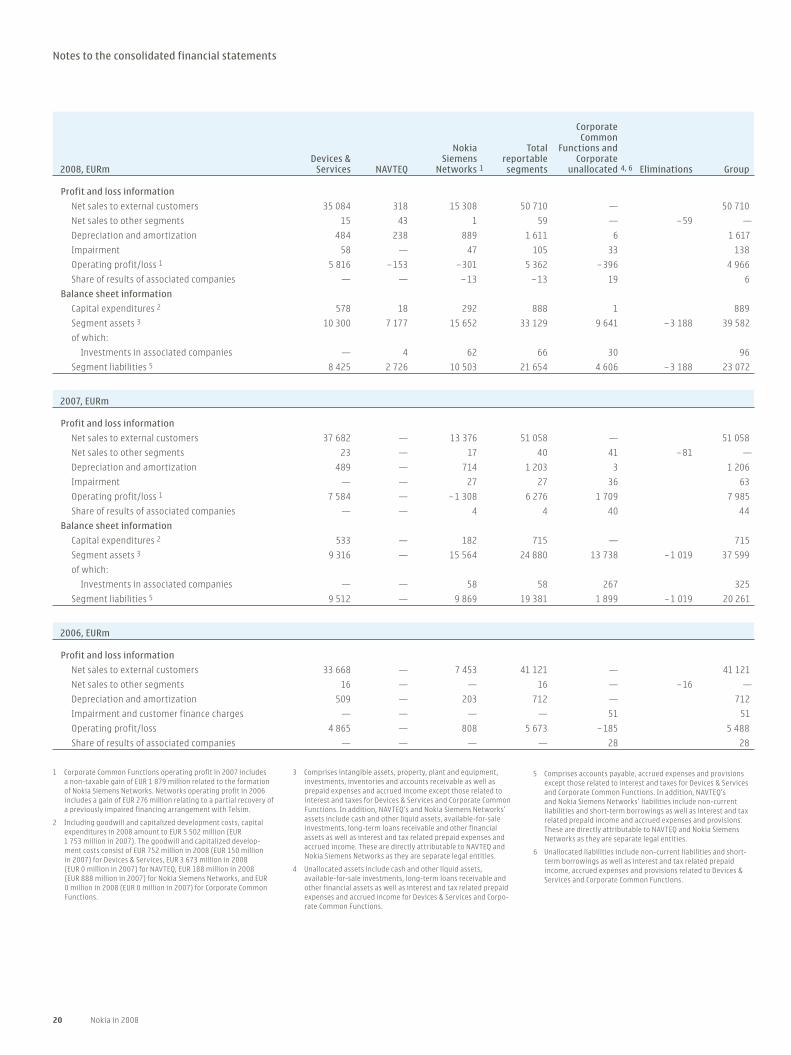
20 Nokia in 2008
Notes to the consolidated financial statements
Corporate Common Nokia Total Functions and Devices & Siemens reportable Corporate2008, EURm Services NAVTEQ Networks 1 segments unallocated 4, 6 Eliminations Group
Profit and loss information
Net sales to external customers 35 084 318 15 308 50 710 — 50 710
Net sales to other segments 15 43 1 59 — – 59 —
Depreciation and amortization 484 238 889 1 611 6 1 617
Impairment 58 — 47 105 33 138
Operating profit/loss 1 5 816 – 153 – 301 5 362 – 396 4 966
Share of results of associated companies — — – 13 – 13 19 6
Balance sheet information
Capital expenditures 2 578 18 292 888 1 889
Segment assets 3 10 300 7 177 15 652 33 129 9 641 – 3 188 39 582
of which:
Investments in associated companies — 4 62 66 30 96
Segment liabilities 5 8 425 2 726 10 503 21 654 4 606 – 3 188 23 072
2007, EURm
Profit and loss information
Net sales to external customers 37 682 — 13 376 51 058 — 51 058
Net sales to other segments 23 — 17 40 41 – 81 —
Depreciation and amortization 489 — 714 1 203 3 1 206
Impairment — — 27 27 36 63
Operating profit/loss 1 7 584 — – 1 308 6 276 1 709 7 985
Share of results of associated companies — — 4 4 40 44
Balance sheet information
Capital expenditures 2 533 — 182 715 — 715
Segment assets 3 9 316 — 15 564 24 880 13 738 – 1 019 37 599
of which:
Investments in associated companies — — 58 58 267 325
Segment liabilities 5 9 512 — 9 869 19 381 1 899 – 1 019 20 261
2006, EURm
Profit and loss information
Net sales to external customers 33 668 — 7 453 41 121 — 41 121
Net sales to other segments 16 — — 16 — – 16 —
Depreciation and amortization 509 — 203 712 — 712
Impairment and customer finance charges — — — — 51 51
Operating profit/loss 4 865 — 808 5 673 – 185 5 488
Share of results of associated companies — — — — 28 28
1 Corporate Common Functions operating profit in 2007 includes a non-taxable gain of EUR 1 879 million related to the formation of Nokia Siemens Networks. Networks operating profit in 2006 includes a gain of EUR 276 million relating to a partial recovery of a previously impaired financing arrangement with Telsim.
2 Including goodwill and capitalized development costs, capital expenditures in 2008 amount to EUR 5 502 million (EUR 1 753 million in 2007). The goodwill and capitalized develop-ment costs consist of EUR 752 million in 2008 (EUR 150 million in 2007) for Devices & Services, EUR 3 673 million in 2008 (EUR 0 million in 2007) for NAVTEQ, EUR 188 million in 2008 (EUR 888 million in 2007) for Nokia Siemens Networks, and EUR 0 million in 2008 (EUR 0 million in 2007) for Corporate Common Functions.
3 Comprises intangible assets, property, plant and equipment, investments, inventories and accounts receivable as well as prepaid expenses and accrued income except those related to interest and taxes for Devices & Services and Corporate Common Functions. In addition, NAVTEQ’s and Nokia Siemens Networks’ assets include cash and other liquid assets, available-for-sale investments, long-term loans receivable and other financial assets as well as interest and tax related prepaid expenses and accrued income. These are directly attributable to NAVTEQ and Nokia Siemens Networks as they are separate legal entities.
4 Unallocated assets include cash and other liquid assets, available-for-sale investments, long-term loans receivable and other financial assets as well as interest and tax related prepaid expenses and accrued income for Devices & Services and Corpo-rate Common Functions.
5 Comprises accounts payable, accrued expenses and provisions except those related to interest and taxes for Devices & Services and Corporate Common Functions. In addition, NAVTEQ’s and Nokia Siemens Networks’ liabilities include non-current liabilities and short-term borrowings as well as interest and tax related prepaid income and accrued expenses and provisions. These are directly attributable to NAVTEQ and Nokia Siemens Networks as they are separate legal entities.
6 Unallocated liabilities include non-current liabilities and short-term borrowings as well as interest and tax related prepaid income, accrued expenses and provisions related to Devices & Services and Corporate Common Functions.
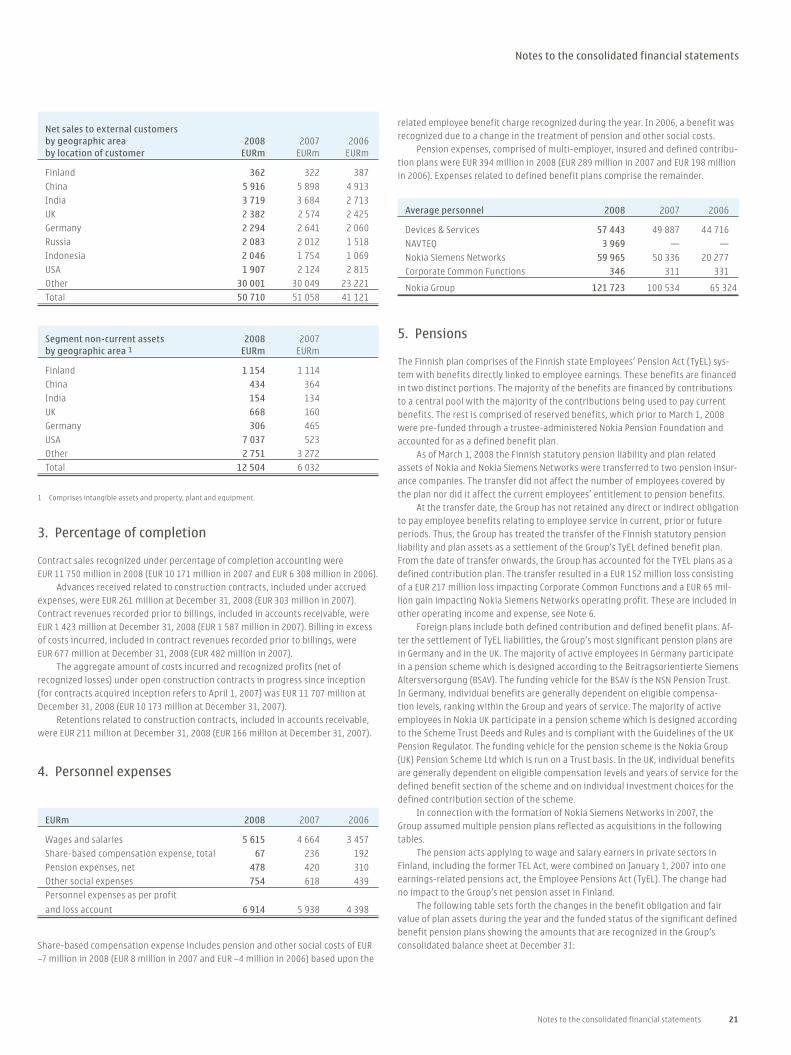
Notes to the consolidated financial statements 21
Notes to the consolidated financial statements
Net sales to external customers by geographic area 2008 2007 2006by location of customer EURm EURm EURm
Finland 362 322 387
China 5 916 5 898 4 913
India 3 719 3 684 2 713
UK 2 382 2 574 2 425
Germany 2 294 2 641 2 060
Russia 2 083 2 012 1 518
Indonesia 2 046 1 754 1 069
USA 1 907 2 124 2 815
Other 30 001 30 049 23 221
Total 50 710 51 058 41 121
Segment non-current assets 2008 2007by geographic area 1 EURm EURm
Finland 1 154 1 114
China 434 364
India 154 134
UK 668 160
Germany 306 465
USA 7 037 523
Other 2 751 3 272
Total 12 504 6 032
1 Comprises intangible assets and property, plant and equipment.
3. Percentage of completion
Contract sales recognized under percentage of completion accounting were EUR 11 750 million in 2008 (EUR 10 171 million in 2007 and EUR 6 308 million in 2006).
Advances received related to construction contracts, included under accrued expenses, were EUR 261 million at December 31, 2008 (EUR 303 million in 2007). Contract revenues recorded prior to billings, included in accounts receivable, were EUR 1 423 million at December 31, 2008 (EUR 1 587 million in 2007). Billing in excess of costs incurred, included in contract revenues recorded prior to billings, were EUR 677 million at December 31, 2008 (EUR 482 million in 2007).
The aggregate amount of costs incurred and recognized profits (net of recognized losses) under open construction contracts in progress since inception (for contracts acquired inception refers to April 1, 2007) was EUR 11 707 million at December 31, 2008 (EUR 10 173 million at December 31, 2007).
Retentions related to construction contracts, included in accounts receivable, were EUR 211 million at December 31, 2008 (EUR 166 million at December 31, 2007).
4. Personnel expenses
EURm 2008 2007 2006
Wages and salaries 5 615 4 664 3 457
Share-based compensation expense, total 67 236 192
Pension expenses, net 478 420 310
Other social expenses 754 618 439
Personnel expenses as per profit
and loss account 6 914 5 938 4 398
Share-based compensation expense includes pension and other social costs of EUR
–7 million in 2008 (EUR 8 million in 2007 and EUR –4 million in 2006) based upon the
related employee benefit charge recognized during the year. In 2006, a benefit was recognized due to a change in the treatment of pension and other social costs.
Pension expenses, comprised of multi-employer, insured and defined contribu-tion plans were EUR 394 million in 2008 (EUR 289 million in 2007 and EUR 198 million in 2006). Expenses related to defined benefit plans comprise the remainder.
Average personnel 2008 2007 2006
Devices & Services 57 443 49 887 44 716
NAVTEQ 3 969 — —
Nokia Siemens Networks 59 965 50 336 20 277
Corporate Common Functions 346 311 331
Nokia Group 121 723 100 534 65 324
5. Pensions
The Finnish plan comprises of the Finnish state Employees’ Pension Act (TyEL) sys-tem with benefits directly linked to employee earnings. These benefits are financed in two distinct portions. The majority of the benefits are financed by contributions to a central pool with the majority of the contributions being used to pay current benefits. The rest is comprised of reserved benefits, which prior to March 1, 2008 were pre-funded through a trustee-administered Nokia Pension Foundation and accounted for as a defined benefit plan.
As of March 1, 2008 the Finnish statutory pension liability and plan related assets of Nokia and Nokia Siemens Networks were transferred to two pension insur-ance companies. The transfer did not affect the number of employees covered by the plan nor did it affect the current employees’ entitlement to pension benefits.
At the transfer date, the Group has not retained any direct or indirect obligation to pay employee benefits relating to employee service in current, prior or future periods. Thus, the Group has treated the transfer of the Finnish statutory pension liability and plan assets as a settlement of the Group’s TyEL defined benefit plan. From the date of transfer onwards, the Group has accounted for the TYEL plans as a defined contribution plan. The transfer resulted in a EUR 152 million loss consisting of a EUR 217 million loss impacting Corporate Common Functions and a EUR 65 mil-lion gain impacting Nokia Siemens Networks operating profit. These are included in other operating income and expense, see Note 6.
Foreign plans include both defined contribution and defined benefit plans. Af-ter the settlement of TyEL liabilities, the Group’s most significant pension plans are in Germany and in the UK. The majority of active employees in Germany participate in a pension scheme which is designed according to the Beitragsorientierte Siemens Altersversorgung (BSAV). The funding vehicle for the BSAV is the NSN Pension Trust. In Germany, individual benefits are generally dependent on eligible compensa-tion levels, ranking within the Group and years of service. The majority of active employees in Nokia UK participate in a pension scheme which is designed according to the Scheme Trust Deeds and Rules and is compliant with the Guidelines of the UK Pension Regulator. The funding vehicle for the pension scheme is the Nokia Group (UK) Pension Scheme Ltd which is run on a Trust basis. In the UK, individual benefits are generally dependent on eligible compensation levels and years of service for the defined benefit section of the scheme and on individual investment choices for the defined contribution section of the scheme.
In connection with the formation of Nokia Siemens Networks in 2007, the Group assumed multiple pension plans reflected as acquisitions in the following tables.
The pension acts applying to wage and salary earners in private sectors in Finland, including the former TEL Act, were combined on January 1, 2007 into one earnings-related pensions act, the Employee Pensions Act (TyEL). The change had no impact to the Group’s net pension asset in Finland.
The following table sets forth the changes in the benefit obligation and fair value of plan assets during the year and the funded status of the significant defined benefit pension plans showing the amounts that are recognized in the Group’s consolidated balance sheet at December 31:

22 Nokia in 2008
Notes to the consolidated financial statements
2008 2007
Domestic Foreign Domestic ForeignEURm plans plans plans plans
Present value of defined benefit obligations at beginning of year – 1 011 – 1 255 – 1 031 – 546
Foreign exchange — 56 — 27
Current service cost – 10 – 69 – 59 – 66
Interest cost – 9 – 69 – 50 – 54
Plan participants’ contributions — – 10 — – 8
Past service cost — – 2 — —
Actuarial gain (+)/loss (–) 3 102 115 126
Acquisitions — – 2 — – 780
Curtailment — 10 3 1
Settlements 1 018 7 — 15
Benefits paid 2 34 11 30
Present value of defined benefit obligations at end of year – 7 – 1 198 – 1 011 – 1 255
Plan assets at fair value at beginning of year 1 063 1 111 985 424
Foreign exchange — – 58 — – 27
Expected return on plan assets 9 62 49 46
Actuarial gain (+)/loss (–) on plan assets – 1 – 38 – 33 – 2
Employer contribution 7 134 73 90
Plan participants’ contributions — 10 — 8
Benefits paid – 2 – 22 – 11 – 30
Curtailments — – 5 — —
Settlements – 1 076 – 2 — – 3
Acquisitions — 5 — 605
Plan assets at fair value at end of year — 1 197 1 063 1 111
Surplus (+)/deficit (–) – 7 – 1 52 – 144
Unrecognized net actuarial gains (–)/losses (+) – 2 – 111 97 – 41
Unrecognized past service cost — 1 — —
Prepaid (+)/accrued (–) pension cost in balance sheet – 9 – 111 149 – 185
Present value of obligations include EUR 707 million (EUR 1 799 million in 2007) of wholly funded obligations, EUR 416 million of partly funded obligations (EUR 333 million in 2007) and EUR 82 million (EUR 134 million in 2007) of unfunded obligations.
The amounts recognized in the profit and loss account are as follows:
EURm 2008 2007 2006
Current service cost 79 125 101
Interest cost 78 104 66
Expected return on plan assets – 71 – 95 – 62
Net actuarial losses recognized in year — 10 8
Past service cost gain (–)/loss (+) 2 — 3
Curtailment – 12 – 1 – 4
Settlement 152 – 12 —
Total, included in personnel expenses 228 131 112
Movements in prepaid/accrued pension costs recognized in the balance sheet are as follows:
EURm 2008 2007
Prepaid (+)/accrued ( –) pension costs at beginning of year – 36 108
Net income (+)/expense (–) recognized in the profit and loss account – 228 – 131
Contributions paid 141 163
Benefits paid 12 —
Acquisitions 3 – 175
Foreign exchange – 12 – 1
Prepaid (+)/accrued ( –) pension costs at end of year 1 – 120 – 36
1 Included within prepaid expenses and accrued income/accrued expenses.
The prepaid/accrued pension cost above is made up of a prepayment of EUR 55 mil-lion (EUR 218 million in 2007) and an accrual of EUR 175 million (EUR 254 million in 2007).
EURm 2008 2007 2006 2005 2004
Present value of defined benefit obligation – 1 205 – 2 266 – 1 577 – 1 385 – 1 125
Plan assets at fair value 1 197 2 174 1 409 1 276 1 071
Surplus (+)/Deficit ( –) – 8 – 92 – 168 – 109 – 54
Experience adjustments arising on plan obligations amount to a gain of EUR 50 million in 2008 (a loss of EUR 31 million in 2007 and EUR 25 million in 2006). Experi-ence adjustments arising on plan assets amount to a loss of EUR 22 million in 2008 (EUR 3 million in 2007 and EUR 11 million in 2006).
The principal actuarial weighted average assumptions used were as follows:
2008 2007
% Domestic Foreign Domestic Foreign
Discount rate for determining present values 5.90 5.80 5.50 5.40
Expected long-term rate of returnon plan assets — 5.70 5.30 5.10
Annual rate of increase in future compensation levels 4.00 2.70 3.00 3.30
Pension increases 2.10 1.90 2.70 2.30
The expected long-term rate of return on plan assets is based on the expected return multiplied with the respective percentage weight of the market-related value of plan assets. The expected return is defined on a uniform basis, reflecting long-term historical returns, current market conditions and strategic asset allocation.
The Groups’s pension plan weighted average asset allocation as a percentage of Plan Assets at December 31, 2008, and 2007, by asset category are as follows:
2008 2007
% Domestic Foreign Domestic Foreign
Asset category:
Equity securities — 12 12 11
Debt securities — 72 78 85
Insurance contracts — 8 — 3
Real estate — 1 1 1
Short-term investments — 7 9 —
Total — 100 100 100
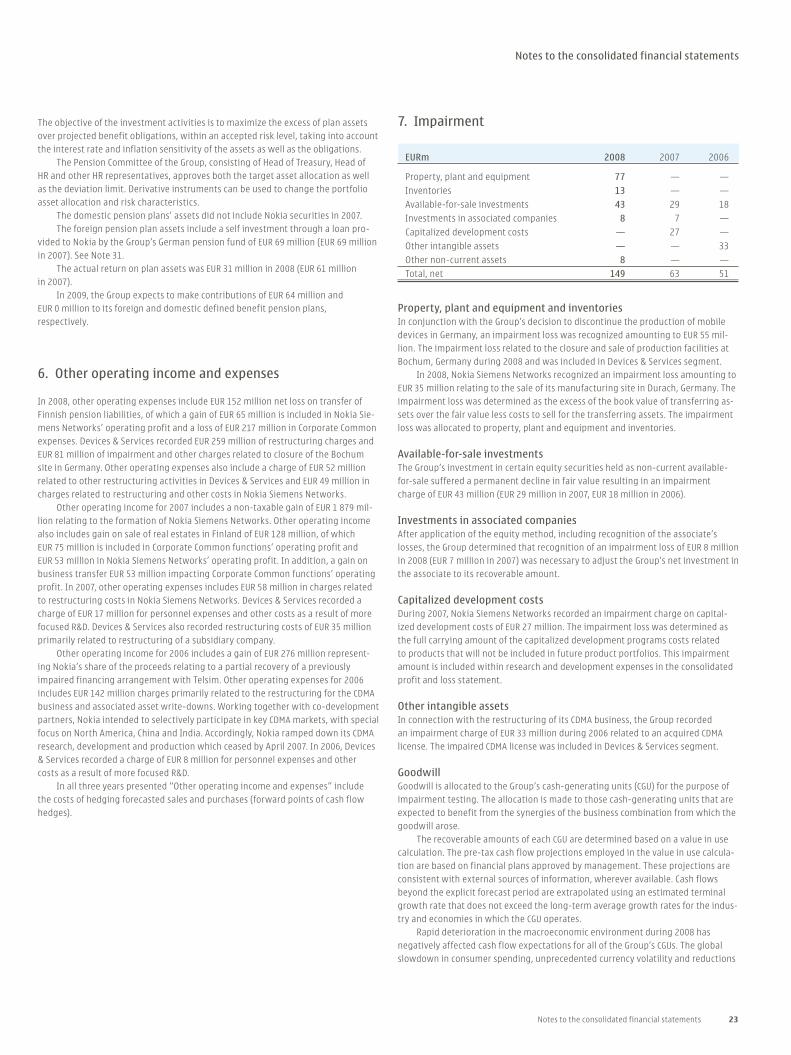
Notes to the consolidated financial statements 23
Notes to the consolidated financial statements
The objective of the investment activities is to maximize the excess of plan assets over projected benefit obligations, within an accepted risk level, taking into account the interest rate and inflation sensitivity of the assets as well as the obligations.
The Pension Committee of the Group, consisting of Head of Treasury, Head of HR and other HR representatives, approves both the target asset allocation as well as the deviation limit. Derivative instruments can be used to change the portfolio asset allocation and risk characteristics.
The domestic pension plans’ assets did not include Nokia securities in 2007. The foreign pension plan assets include a self investment through a loan pro-
vided to Nokia by the Group’s German pension fund of EUR 69 million (EUR 69 million in 2007). See Note 31.
The actual return on plan assets was EUR 31 million in 2008 (EUR 61 million in 2007).
In 2009, the Group expects to make contributions of EUR 64 million and EUR 0 million to its foreign and domestic defined benefit pension plans, respectively.
6. Other operating income and expenses
In 2008, other operating expenses include EUR 152 million net loss on transfer of Finnish pension liabilities, of which a gain of EUR 65 million is included in Nokia Sie-mens Networks’ operating profit and a loss of EUR 217 million in Corporate Common expenses. Devices & Services recorded EUR 259 million of restructuring charges and EUR 81 million of impairment and other charges related to closure of the Bochum site in Germany. Other operating expenses also include a charge of EUR 52 million related to other restructuring activities in Devices & Services and EUR 49 million in charges related to restructuring and other costs in Nokia Siemens Networks.
Other operating income for 2007 includes a non-taxable gain of EUR 1 879 mil-lion relating to the formation of Nokia Siemens Networks. Other operating income also includes gain on sale of real estates in Finland of EUR 128 million, of which EUR 75 million is included in Corporate Common functions’ operating profit and EUR 53 million in Nokia Siemens Networks’ operating profit. In addition, a gain on business transfer EUR 53 million impacting Corporate Common functions’ operating profit. In 2007, other operating expenses includes EUR 58 million in charges related to restructuring costs in Nokia Siemens Networks. Devices & Services recorded a charge of EUR 17 million for personnel expenses and other costs as a result of more focused R&D. Devices & Services also recorded restructuring costs of EUR 35 million primarily related to restructuring of a subsidiary company.
Other operating income for 2006 includes a gain of EUR 276 million represent-ing Nokia’s share of the proceeds relating to a partial recovery of a previously impaired financing arrangement with Telsim. Other operating expenses for 2006 includes EUR 142 million charges primarily related to the restructuring for the CDMA business and associated asset write-downs. Working together with co-development partners, Nokia intended to selectively participate in key CDMA markets, with special focus on North America, China and India. Accordingly, Nokia ramped down its CDMA research, development and production which ceased by April 2007. In 2006, Devices & Services recorded a charge of EUR 8 million for personnel expenses and other costs as a result of more focused R&D.
In all three years presented “Other operating income and expenses” include the costs of hedging forecasted sales and purchases (forward points of cash flow hedges).
7. Impairment
EURm 2008 2007 2006
Property, plant and equipment 77 — —
Inventories 13 — —
Available-for-sale investments 43 29 18
Investments in associated companies 8 7 —
Capitalized development costs — 27 —
Other intangible assets — — 33
Other non-current assets 8 — —
Total, net 149 63 51
Property, plant and equipment and inventoriesIn conjunction with the Group’s decision to discontinue the production of mobile devices in Germany, an impairment loss was recognized amounting to EUR 55 mil-lion. The impairment loss related to the closure and sale of production facilities at Bochum, Germany during 2008 and was included in Devices & Services segment.
In 2008, Nokia Siemens Networks recognized an impairment loss amounting to EUR 35 million relating to the sale of its manufacturing site in Durach, Germany. The impairment loss was determined as the excess of the book value of transferring as-sets over the fair value less costs to sell for the transferring assets. The impairment loss was allocated to property, plant and equipment and inventories.
Available-for-sale investmentsThe Group’s investment in certain equity securities held as non-current available-for-sale suffered a permanent decline in fair value resulting in an impairment charge of EUR 43 million (EUR 29 million in 2007, EUR 18 million in 2006).
Investments in associated companiesAfter application of the equity method, including recognition of the associate’s losses, the Group determined that recognition of an impairment loss of EUR 8 million in 2008 (EUR 7 million in 2007) was necessary to adjust the Group’s net investment in the associate to its recoverable amount.
Capitalized development costsDuring 2007, Nokia Siemens Networks recorded an impairment charge on capital-ized development costs of EUR 27 million. The impairment loss was determined as the full carrying amount of the capitalized development programs costs related to products that will not be included in future product portfolios. This impairment amount is included within research and development expenses in the consolidated profit and loss statement.
Other intangible assetsIn connection with the restructuring of its CDMA business, the Group recorded an impairment charge of EUR 33 million during 2006 related to an acquired CDMA license. The impaired CDMA license was included in Devices & Services segment.
GoodwillGoodwill is allocated to the Group’s cash-generating units (CGU) for the purpose of impairment testing. The allocation is made to those cash-generating units that are expected to benefit from the synergies of the business combination from which the goodwill arose.
The recoverable amounts of each CGU are determined based on a value in use calculation. The pre-tax cash flow projections employed in the value in use calcula-tion are based on financial plans approved by management. These projections are consistent with external sources of information, wherever available. Cash flows beyond the explicit forecast period are extrapolated using an estimated terminal growth rate that does not exceed the long-term average growth rates for the indus-try and economies in which the CGU operates.
Rapid deterioration in the macroeconomic environment during 2008 has negatively affected cash flow expectations for all of the Group’s CGUs. The global slowdown in consumer spending, unprecedented currency volatility and reductions

24 Nokia in 2008
Notes to the consolidated financial statements
in the availability of credit have dampened growth and profitability expectations during the short to medium term.
Goodwill of EUR 1 106 million has been allocated to the Devices & Services CGU for the purpose of impairment testing. The impairment testing has been carried out based on Management’s expectation of moderate market share growth and stable profit margins in the medium to long term.
Goodwill amounting to EUR 905 million has been allocated to the NSN CGU. The impairment testing has been carried out based on Management’s expectation of a constant market share, and a declining total market value in the shorter term, stabi-lizing on the longer term. Tight focus on profitability and cash collection is expected to improve operating cash flow.
Goodwill amounting to EUR 4 119 million has been allocated to the NAVTEQ CGU. The impairment testing has been carried out based on Management’s expectation of longer term strong growth in mobile device navigation services with increased volumes driving profitability. The recoverable amount of the NAVTEQ CGU is less than 1% higher than its carrying amount. A reasonably possible change of 1% in the valu-ation assumptions for long-term growth rate and pre-tax discount rate would give rise to an impairment loss.
The aggregate carrying amount of goodwill allocated across multiple CGUs amounts to EUR 127 million and the amount allocated to each individual CGU is not individually significant.
The key assumptions applied in the value-in-use calculation for each CGU are presented in the table below:
Cash-generating unit
Devices &% Services NSN NAVTEQ
Terminal growth rate 2.28 1.00 5.00
Pre-tax discount rate 12.35 14.86 10.92
The goodwill impairment testing analyses conducted for each of the Group’s CGUs for the years ended December 31, 2008, 2007 and 2006 have not resulted in any impairment charges.
8. Acquisitions
Acquisitions completed in 2008
NAVTEQOn July 10, 2008, the Group completed its acquisition of all of the outstanding com-mon stock of NAVTEQ. Based in Chicago, NAVTEQ is a leading provider of comprehen-sive digital map information for automotive systems, mobile navigation devices, Internet-based mapping applications, and government and business solutions. The Group will use NAVTEQ’s industry leading maps data, to add context–time, place, people–to web services optimized for mobility.
The total cost of the acquisition was EUR 5 342 million and consisted of cash paid of EUR 2 772 million, debt issued of EUR 2 539 million, costs directly attributable to the acquisition of EUR 12 million and consideration attributable to the vested portion of replacement share-based payment awards of EUR 19 million.
The following table summarizes the estimated fair values of the assets ac-quired and liabilities assumed at the date of acquisition.
Carrying Fair Useful amount value lives EURm EURm Years
Goodwill 114 3 673
Intangible assets subject to amortization:
Map database 5 1 389 5
Customer relationships 22 388 4
Developed technology 8 110 4
License to use trade name and trademark 7 57 6
Capitalized development costs 22 —
Other intangible assets 4 7
68 1 951
Property, plant & equipment 84 83
Deferred tax assets 262 148
Available-for-sale investments 36 36
Other non-current assets 6 6
Non-current assets 456 2 224
Inventories 3 3
Accounts receivable 94 94
Prepaid expenses and accrued income 36 36
Available-for-sale investments, liquid assets 140 140
Available-for-sale investments, cash equivalents 97 97
Bank and cash 57 57
Current assets 427 427
Total assets acquired 997 6 324
Deferred tax liabilities 46 786
Other long-term liabilities 54 39
Non-current liabilities 100 825
Accounts payable 29 29
Accrued expenses 96 120
Provisions 5 8
Current liabilities 130 157
Total liabilities assumed 230 982
Net assets acquired 767 5 342
The goodwill of EUR 3 673 million has been allocated to the NAVTEQ segment. The goodwill is attributable to assembled workforce and the synergies expected to arise subsequent to the acquisition including acceleration of the Group’s Internet services strategy. None of the goodwill acquired is expected to be deductible for income tax purposes.
SymbianOn December 2, 2008, the Group completed its acquisition of 52.1% of the outstand-ing common stock of Symbian Ltd. As a result of this acquisition, the Group’s total ownership interest has increased from 47.9% to 100% of the outstanding common stock of Symbian. A UK-based software licensing company, Symbian developed and licensed Symbian OS, the market-leading open operating system for mobile phones. The acquisition of Symbian is a fundamental step in the establishment of the Symbian Foundation.
The Group will contribute the Symbian OS and S60 software to the Symbian Foundation for the purpose of creating a unified mobile software platform with a common UI framework. The goal of Symbian Foundation will be to extend the appeal of the platform among all partners, including developers, mobile operators, content and service providers and device manufacturers. The unified platform will promote innovation and accelerate the availability of new services and experiences for consumers and business users around the world. A full platform will be available for all Foundation members under a royalty-free license, from the Foundation’s first day of operations.

Notes to the consolidated financial statements 25
Notes to the consolidated financial statements
The acquisition of Symbian was achieved in stages through successive share purchases at various times from the formation of the company. Thus, the amount of goodwill arising from the acquisition has been determined via a step-by-step comparison of the cost of the individual investments in Symbian with the acquired interest in the fair values of Symbian’s identifiable net assets at each stage. Revalu-ation of the Group’s previously held interests in Symbian’s identifiable net assets is recognized as a revaluation surplus in equity. Application of the equity method has been reversed such that the carrying amount of the Group’s previously held interests in Symbian have been adjusted to cost. The Group’s share of changes in Symbian’s equity balances after each stage is included in equity.
The total cost of the acquisition was EUR 641 million consisting of cash paid of EUR 435 million, costs directly attributable to the acquisition of EUR 6 million and investments in Symbian from previous share purchases of EUR 200 million.
The following table summarizes the estimated fair values of the assets ac-quired and liabilities assumed at the date of acquisition.
Carrying FairEURm amount value
Goodwill — 470
Intangible assets subject to amortization:
Developed technology 5 41
Customer relationships — 11
License to use trade name and trademark — 3
5 55
Property, plant & equipment 33 31
Deferred tax assets 7 19
Non-current assets 45 105
Accounts receivable 20 20
Prepaid expenses and accrued income 43 43
Bank and cash 147 147
Current assets 210 210
Total assets acquired 255 785
Deferred tax liabilities — 17
Financial liabilities — 20
Accounts payable 5 5
Accrued expenses 48 53
Total liabilities assumed 53 95
Net assets acquired 202 690
Revaluation of previously held interests in Symbian 22
Nokia share of changes in Symbian’s equity after each stage of the acquisition 27
Cost of the business combination 641
The goodwill of EUR 470 million has been allocated to the Devices & Services seg-ment. The goodwill is attributable to assembled workforce and the significant benefits that the Group expects to realise from the Symbian Foundation. None of the goodwill acquired is expected to be deductible for income tax purposes.
The contribution of the Symbian OS and S60 software to the Symbian Founda-tion has been accounted for as a retirement. Thus, the Group has recognized a loss on retirement of EUR 165 million consisting of EUR 55 million of Symbian identifiable intangible assets and EUR 110 million value of capitalized S60 development costs.
For NAVTEQ and Symbian, the Group has included net losses of EUR 155 million and EUR 52 million, respectively, in the consolidated profit and loss. The following table depicts pro forma net sales and net profit of the combined entity as though the acquisition of NAVTEQ and Symbian had occurred on January 1, 2008:
Pro forma (unaudited), EURm 2008
Net sales 51 063
Net profit 4 080
During 2008, the Group completed five additional acquisitions. The total purchase consideration paid and goodwill arising from the acquisitions amounted to EUR 514 million and EUR 339 million, respectively:
» Trolltech ASA, based in Oslo, Norway, is a recognized software provider with world-class software development platforms and frameworks. The Group acquired a 100% ownership interest in Trolltech ASA on June 6, 2008.
» Oz Communications Inc., headquartered in Monteal, Canada, is a leading con-sumer mobile messaging solution provider delivering access to popular instant messaging and email services on consumer mobile devices. The Group acquired a 100% ownership interest in Oz Communications Inc. on November 4, 2008.
» Atrica, based in Santa Clara, California, is one of the leading providers of Carrier Ethernet solutions for Metropolitan Area Networks. Nokia Siemens Networks acquired a 100% ownership interest in Atrica on January 7, 2008.
» Apertio Ltd, based in Bristol, England is the leading independent provider of subscriber-centric networks for mobile, fixed and converged telecommunica-tions operators. Nokia Siemens Networks acquired a 100% ownership interest in Apertio Ltd on February 11, 2008.
» On January 1, 2008, Nokia Siemens Networks assumed control of Vivento Tech-nical Services from Deutsche Telekom.
Acquisitions completed in 2007
The Group and Siemens AG (“Siemens”) completed a transaction to form Nokia Sie-mens Networks on April 1, 2007. Nokia and Siemens contributed to Nokia Siemens Networks certain tangible and intangible assets and certain business interests that comprised Nokia’s networks business and Siemens’ carrier-related operations. This transaction combined the worldwide mobile and fixed-line telecommunications network equipment businesses of Nokia and Siemens. Nokia and Siemens each own approximately 50% of Nokia Siemens Networks. Nokia has the ability to appoint key officers and the majority of the members of the Board of Directors. Accordingly, for accounting purposes, Nokia is deemed to have control and thus consolidates the results of Nokia Siemens Networks in its financial statements.
The transfer of Nokia’s networks business was treated as a partial sale to the minority shareholders of Nokia Siemens Networks. Accordingly, the Group recog-nized a non-taxable gain on the partial sale amounting to EUR 1 879 million. The gain was determined as the Group’s ownership interest relinquished for the differ-ence between the fair value contributed, representing the consideration received, and book value of the net assets contributed by the Group to Nokia Siemens Net-works. Upon closing of the transaction, Nokia and Siemens contributed net assets with book values amounting to EUR 1 742 million and EUR 2 385 million, respectively. The Group’s contributed networks business was valued at EUR 5 500 million. In addi-tion, the Group incurred costs directly attributable to the acquisition of EUR 51 mil-lion.

26 Nokia in 2008
Notes to the consolidated financial statements
The table below presents the reported results of Nokia Networks prior to the formation of Nokia Siemens Networks and the reported results of Nokia Siemens Networks since inception.
2007 2006
EURm January–March April–December Total January–March April–December Total
Net sales
Nokia Networks 1 697 * 1 697 1 699 5 754 7 453
Nokia Siemens Networks * 11 696 11 696 N/A N/A N/A
Total 1 697 11 696 13 393 1 699 5 754 7 453
Operating profit
Nokia Networks 78 * 78 149 659 808
Nokia Siemens Networks * – 1 386 – 1 386 N/A N/A N/A
Total 78 – 1 386 – 1 308 149 659 808
* No results presented as Nokia Siemens Networks began operations on April 1, 2007.
It is not practicable to determine the results of the Siemens’ carrier-related opera-tions for the three month period of January 1, 2007 through March 31, 2007 as Siemens did not report those operations separately. As a result pro forma revenues and operating profit as if the acquisition had occurred as of January 1, 2007 have not been presented.
The following table summarizes the estimated fair values of the assets ac-quired and liabilities assumed at the date of acquisition.
Carrying Fair Useful amount value lives EURm EURm Years
Intangible assets subject to amortization:
Customer relationships — 1 290 6
Developed technology — 710 4
License to use trade name and trademark — 350 5
Capitalized development costs 143 154 3
Other intangible assets 47 47 3–5
190 2 551
Property, plant & equipment 371 344
Deferred tax assets 111 181
Other non-current assets 153 153
Non-current assets 825 3 229
Inventories 1 010 1 138
Accounts receivable 3 135 3 087
Prepaid expenses and accrued income 870 846
Other financial assets 55 55
Bank and cash 382 382
Current assets 5 452 5 508
Total assets acquired 6 277 8 737
Deferred tax liabilities 171 997
Long-term interest-bearing liabilities 34 34
Non-current liabilities 205 1 031
Short-term borrowings 231 213
Accounts payable 1 539 1 491
Accrued expenses 1 344 1 502
Provisions 463 397
Current liabilities 3 577 3 603
Total liabilities assumed 3 782 4 634
Minority interest 110 108
Net assets acquired 2 385 3 995
Cost of acquisition 5 500
Goodwill 1 505
Less non-controlling interest in goodwill 753
Plus costs directly attributable to the acquisition 51
Goodwill arising on formation of Nokia Siemens Networks 803
The goodwill of EUR 803 million has been allocated to the Nokia Siemens Networks segment. The goodwill is attributable to assembled workforce and the synergies expected to arise subsequent to the acquisition. None of the goodwill acquired is expected to be deductible for income tax purposes.
The amount of the loss specifically attributable to the business acquired from Siemens since the acquisition date included in the Group’s profit for the period has not been disclosed as it is not practicable to do so. This is due to the ongoing inte-gration of the acquired Siemens’ carrier-related operations and Nokia’s networks business, and management’s focus on the operations and results of the combined entity, Nokia Siemens Networks.
During 2007, the Group completed the acquisitions of the following three companies. The purchase consideration paid and goodwill arising from these acqui-sitions was not material to the Group.
» Enpocket Inc., based in Boston, USA, a global leader in mobile advertising providing technology and services that allow brands to plan, create, execute, measure and optimise mobile advertising campaigns around the world. The Group acquired 100% ownership interest in Enpocket Inc. on October 5, 2007.
» Avvenu Inc., based in Palo Alto, USA, provides internet services that allow anyone to use their mobile devices to securely access, use and share personal computer files. The Group acquired 100% ownership interest in Avvenu Inc. on December 5, 2007.
» Twango, provides a comprehensive media sharing solution for organising and sharing photos, videos and other personal media. The Group acquired substan-tially all assets of Twango on July 25, 2007.
Acquisitions completed in 2006
On February 10, 2006, the Group completed its acquisition of all of the outstanding common stock of Intellisync Corporation. Intellisync is a leader in synchronization technology for platform-independent wireless messaging and other business ap-plications for mobile devices. The acquisition of Intellisync was to enhance Nokia’s ability to respond to its customers and effectively put Nokia at the core of any mobility solution for businesses of all sizes.
The total cost of the acquisition was EUR 325 million consisting of EUR 319 mil-lion of cash and EUR 6 million of costs directly attributable to the acquisition.
The following table summarises the estimated fair values of the assets acquired and liabilities assumed at the date of acquisition. The carrying amount of Intellisync net assets immediately before the acquisition amounted to EUR 50 million.

Notes to the consolidated financial statements 27
Notes to the consolidated financial statements
February 10, 2006, EURm
Intangible assets subject to amortization:
Technology related intangible assets 38
Other intangible assets 22
60
Deferred tax assets 45
Other non-current assets 16
Non-current assets 121
Goodwill 290
Current assets 42
Total assets acquired 453
Deferred tax liabilities 23
Other non-current liabilities 1
Non-current liabilities 24
Current liabilities 104
Total liabilities assumed 128
Net assets acquired 325
The goodwill of EUR 290 million has been allocated to the Device & Services seg-ment. The goodwill is attributable to assembled workforce and the significant synergies expected to arise subsequent to the acquisition. None of the goodwill acquired is expected to be deductible for tax purposes.
In 2006, the Group acquired ownership interests or increased its existing ownership interests in the following three entities for total consideration of EUR 366
million, of which EUR 347 million was in cash, EUR 5 million in directly attributable costs and EUR 14 million in deferred cash consideration:
» Nokia Telecommunications Ltd, based in BDA, Beijing, a leading mobile com-munications manufacturer in China. The Group acquired an additional 22% ownership interest in Nokia Telecommunications Ltd on June 30, 2006.
» Loudeye Corporation, based in Bristol, England a global leader of digital music platforms and digital media distribution services. The Group acquired a 100% ownership interest in Loudeye Corporation on October 16, 2006.
» gate5 AG, based in Berlin, Germany, a leading supplier of mapping, routing and navigation software and services. The Group acquired a 100% ownership inter-est in gate5 AG on October 15, 2006.
Goodwill and aggregate net assets acquired in these three transactions amounted to EUR 198 million and EUR 168 million, respectively. Goodwill has been allocated to the Devices & Services segment. The goodwill arising from these acquisitions is attributable to assembled workforce and post acquisition synergies. None of the goodwill recognized in these transactions is expected to be tax deductible.
9. Depreciation and amortization
EURm 2008 2007 2006
Depreciation and amortization by function
Cost of sales 297 303 279
Research and development 1 778 523 312
Selling and marketing 2 368 232 9
Administrative and general 174 148 111
Other operating expenses — — 1
Total 1 617 1 206 712
1 In 2008, depreciation and amortization allocated to research and development included amortization of acquired intangible assets of EUR 351 million (EUR 136 million in 2007).
2 In 2008, depreciation and amortization allocated to selling and marketing included amortization of acquired intangible assets of EUR 343 million (EUR 214 million in 2007).
10. Financial income and expenses
EURm 2008 2007 2006
Dividend income on available-for-sale financial investments 1 — —
Interest income on available-for-sale financial investments 353 338 225
Interest income on loans receivables carried at amortized cost — 1 —
Interest expense on financial liabilities carried at amortized cost – 185 – 43 – 22
Other financial income 17 43 55
Other financial expenses – 31 – 24 – 18
Net foreign exchange gains (or losses)
From foreign exchange derivatives designated at fair value through profit and loss account 432 37 75
From balance sheet items revaluation – 595 – 118 – 106
Net gains (net losses) on other derivatives designated at fair value through profit and loss account 6 5 – 2
Total – 2 239 207
During 2008, Nokia’s interest expense increased significantly due to an increase in interest-bearing liabilities mainly related to financing of the NAVTEQ acquisition. Foreign exchange gains (or losses) increased due to a higher cost of hedging and increased volatility on the foreign exchange market.
11. Income taxes
EURm 2008 2007 2006
Income tax expense
Current tax – 1 514 – 2 209 – 1 303
Deferred tax 433 687 – 54
Total – 1 081 – 1 522 – 1 357
Finland – 604 – 1 323 – 941
Other countries – 477 – 199 – 416
Total – 1 081 – 1 522 – 1 357
The differences between income tax expense computed at the statutory rate in Finland of 26% and income taxes recognized in the consolidated income statement is reconciled as follows at December 31, 2008:
EURm 2008 2007 2006
Income tax expense at statutory rate 1 292 2 150 1 488
Items without tax benefit/expense – 65 61 12
Non-taxable gain on formation of Nokia Siemens Networks 1 — – 489 —
Taxes for prior years – 128 20 – 24
Taxes on foreign subsidiaries’ profits in excess of (lower than) income taxes at statutory rates – 181 – 138 – 73
Operating losses with no current tax benefit — 15 —
Net increase in tax provisions 2 50 – 12
Change in income tax rate 2 – 22 – 114 —
Deferred tax liability on undistributed earnings 3 220 – 37 – 3
Other – 37 4 – 31
Income tax expense 1 081 1 522 1 357
1 See Note 8.
2 In 2007, the change in income tax rate decreased Group tax expense primarily due to the impact of a decrease in the German statutory tax rate on deferred tax asset balances.
3 The change in deferred tax liability on undistributed earnings mainly relates to changes to tax rates applicable to profit distributions.

28 Nokia in 2008
Notes to the consolidated financial statements
Certain of the Group companies’ income tax returns for periods ranging from 2002 through 2008 are under examination by tax authorities. The Group does not believe that any significant additional taxes in excess of those already provided for will arise as a result of the examinations.
12. Intangible assets
EURm 2008 2007
Capitalized development costs
Acquisition cost January 1 1 817 1 533
Additions during the period 131 157
Acquisitions — 154
Impairment losses — – 27
Retirements – 124 —
Disposals during the period – 13 —
Accumulated acquisition cost December 31 1 811 1 817
Accumulated amortization January 1 – 1 439 – 1 282
Retirements during the period 14 —
Disposals during the period 11 —
Amortization for the period – 153 – 157
Accumulated amortization December 31 – 1 567 – 1 439
Net book value January 1 378 251
Net book value December 31 244 378
Goodwill
Acquisition cost January 1 1 384 532
Translation differences 431 – 30
Acquisitions 4 482 882
Disposals during the period – 35 —
Other changes – 5 —
Accumulated acquisition cost December 31 6 257 1 384
Net book value January 1 1 384 532
Net book value December 31 6 257 1 384
Other intangible assets
Acquisition cost January 1 3 218 772
Translation differences 265 – 20
Additions during the period 95 102
Acquisitions 2 189 2 437
Retirements during the period – 55 —
Disposals during the period – 214 – 73
Accumulated acquisition cost December 31 5 498 3 218
Accumulated amortization January 1 – 860 – 474
Translation differences – 32 11
Disposals during the period 48 73
Amortization for the period – 741 – 470
Accumulated amortization December 31 – 1 585 – 860
Net book value January 1 2 358 298
Net book value December 31 3 913 2 358
13. Property, plant and equipment
EURm 2008 2007
Land and water areas
Acquisition cost January 1 73 78
Translation differences – 4 – 2
Additions during the period 3 4
Acquisitions — 5
Impairments during the period – 4 —
Disposals during the period – 8 – 12
Accumulated acquisition cost December 31 60 73
Net book value January 1 73 78
Net book value December 31 60 73
Buildings and constructions
Acquisition cost January 1 1 008 925
Translation differences – 9 – 15
Additions during the period 382 97
Acquisitions 28 58
Impairments during the period – 90 —
Disposals during the period – 45 – 57
Accumulated acquisition cost December 31 1 274 1 008
Accumulated depreciation January 1 – 239 – 230
Translation differences 1 3
Impairments during the period 30 —
Disposals during the period 17 25
Depreciation for the period – 159 – 37
Accumulated depreciation December 31 – 350 – 239
Net book value January 1 769 695
Net book value December 31 924 769
Machinery and equipment
Acquisition cost January 1 4 012 3 707
Translation differences 10 -42
Additions during the period 613 448
Acquisitions 68 264
Impairments during the period – 21 —
Disposals during the period – 499 – 365
Accumulated acquisition cost December 31 4 183 4 012
Accumulated depreciation January 1 – 3 107 -2 966
Translation differences – 8 34
Impairments during the period 8 —
Disposals during the period 466 364
Depreciation for the period – 556 – 539
Accumulated depreciation December 31 – 3 197 – 3 107
Net book value January 1 905 741
Net book value December 31 986 905
Other tangible assets
Acquisition cost January 1 20 22
Translation differences 2 – 1
Additions during the period 8 2
Disposals during the period — – 3
Accumulated acquisition cost December 31 30 20
Accumulated depreciation January 1 – 9 – 7
Translation differences — —
Disposals during the period — 1
Depreciation for the period – 6 – 3
Accumulated depreciation December 31 – 15 – 9
Net book value January 1 11 15
Net book value December 31 15 11
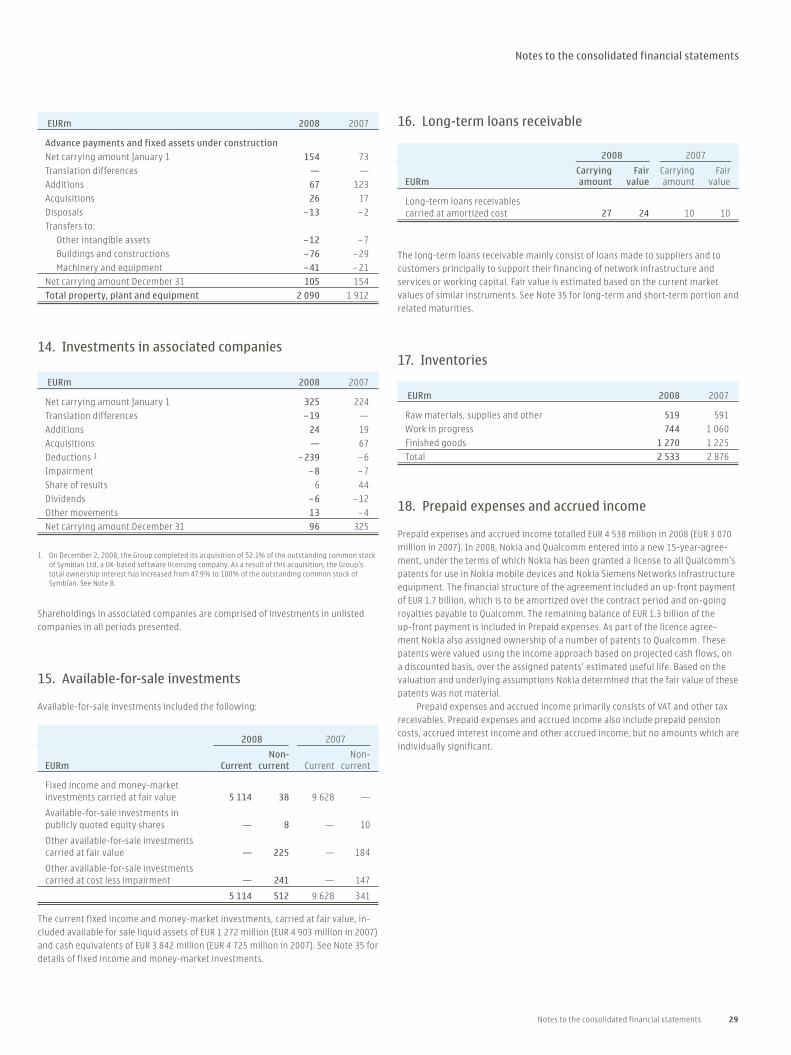
Notes to the consolidated financial statements 29
Notes to the consolidated financial statements
EURm 2008 2007
Advance payments and fixed assets under construction
Net carrying amount January 1 154 73
Translation differences — —
Additions 67 123
Acquisitions 26 17
Disposals – 13 – 2
Transfers to:
Other intangible assets – 12 – 7
Buildings and constructions – 76 – 29
Machinery and equipment – 41 – 21
Net carrying amount December 31 105 154
Total property, plant and equipment 2 090 1 912
14. Investments in associated companies
EURm 2008 2007
Net carrying amount January 1 325 224
Translation differences – 19 —
Additions 24 19
Acquisitions — 67
Deductions 1 – 239 – 6
Impairment – 8 – 7
Share of results 6 44
Dividends – 6 – 12
Other movements 13 – 4
Net carrying amount December 31 96 325
1 On December 2, 2008, the Group completed its acquisition of 52.1% of the outstanding common stock of Symbian Ltd, a UK-based software licensing company. As a result of this acquisition, the Group’s total ownership interest has increased from 47.9% to 100% of the outstanding common stock of Symbian. See Note 8.
Shareholdings in associated companies are comprised of investments in unlisted companies in all periods presented.
15. Available-for-sale investments
Available-for-sale investments included the following:
2008 2007
Non- Non-EURm Current current Current current
Fixed income and money-market investments carried at fair value 5 114 38 9 628 —
Available-for-sale investments in publicly quoted equity shares — 8 — 10
Other available-for-sale investments carried at fair value — 225 — 184
Other available-for-sale investments carried at cost less impairment — 241 — 147
5 114 512 9 628 341
The current fixed income and money-market investments, carried at fair value, in-cluded available for sale liquid assets of EUR 1 272 million (EUR 4 903 million in 2007) and cash equivalents of EUR 3 842 million (EUR 4 725 million in 2007). See Note 35 for details of fixed income and money-market investments.
16. Long-term loans receivable
2008 2007
Carrying Fair Carrying FairEURm amount value amount value
Long-term loans receivables carried at amortized cost 27 24 10 10
The long-term loans receivable mainly consist of loans made to suppliers and to customers principally to support their financing of network infrastructure and services or working capital. Fair value is estimated based on the current market values of similar instruments. See Note 35 for long-term and short-term portion and related maturities.
17. Inventories
EURm 2008 2007
Raw materials, supplies and other 519 591
Work in progress 744 1 060
Finished goods 1 270 1 225
Total 2 533 2 876
18. Prepaid expenses and accrued income
Prepaid expenses and accrued income totalled EUR 4 538 million in 2008 (EUR 3 070
million in 2007). In 2008, Nokia and Qualcomm entered into a new 15-year-agree-ment, under the terms of which Nokia has been granted a license to all Qualcomm’s patents for use in Nokia mobile devices and Nokia Siemens Networks infrastructure equipment. The financial structure of the agreement included an up-front payment of EUR 1.7 billion, which is to be amortized over the contract period and on-going royalties payable to Qualcomm. The remaining balance of EUR 1.3 billion of the up-front payment is included in Prepaid expenses. As part of the licence agree-ment Nokia also assigned ownership of a number of patents to Qualcomm. These patents were valued using the income approach based on projected cash flows, on a discounted basis, over the assigned patents’ estimated useful life. Based on the valuation and underlying assumptions Nokia determined that the fair value of these patents was not material.
Prepaid expenses and accrued income primarily consists of VAT and other tax receivables. Prepaid expenses and accrued income also include prepaid pension costs, accrued interest income and other accrued income, but no amounts which are individually significant.

30 Nokia in 2008
Notes to the consolidated financial statements
19. Valuation and qualifying accounts
Balance at Charged to Balance beginning cost and at end of year expenses Deductions 1 Acquisitions of yearAllowances on assets to which they apply: EURm EURm EURm EURm EURm
2008
Allowance for doubtful accounts 332 224 – 141 415
Excess and obsolete inventory 417 151 – 221 1 348
2007
Allowance for doubtful accounts 212 38 – 72 154 332
Excess and obsolete inventory 218 145 – 202 256 417
2006
Allowance for doubtful accounts 281 70 – 139 212
Excess and obsolete inventory 176 353 – 311 218
1 Deductions include utilization and releases of the allowances.
20. Fair value and other reserves
Available-for-sale Hedging reserve, EURm investments, EURm Total, EURm
Gross Tax Net Gross Tax Net Gross Tax Net
Balance at December 31, 2005 – 163 42 – 121 – 56 1 – 55 – 219 43 – 176
Cash flow hedges:
Net fair value gains (+)/losses (–) 61 – 16 45 — — — 61 – 16 45
Transfer of gains (–)/losses (+) to profit and loss account as adjustment to net sales – 243 68 – 175 — — — – 243 68 – 175
Transfer gains (–)/losses (+) to profit and loss account as adjustment to cost of sales 414 – 113 301 — — — 414 – 113 301
Available-for-sale Investments:
Net fair value gains (+)/losses (–) — — — – 42 1 – 41 – 42 1 – 41
Transfer to profit and loss account on impairment — — — 18 — 18 18 — 18
Transfer of net fair value gains (–)/losses (+) to profit and loss account on disposal — — — 14 — 14 14 — 14
Balance at December 31, 2006 69 – 19 50 – 66 2 – 64 3 – 17 – 14
Cash flow hedges:
Net fair value gains (+)/losses (–) 29 – 7 22 — — — 29 – 7 22
Transfer of gains (–)/losses (+) to profit and loss account as adjustment to net sales – 687 186 – 501 — — — – 687 186 – 501
Transfer of gains (–)/losses (+) to profit and loss account as adjustment to cost of sales 643 – 175 468 — — — 643 – 175 468
Available-for-sale Investments:
Net fair value gains (+)/losses (–) — — — 32 – 1 31 32 – 1 31
Transfer to profit and loss account on impairment — — — 29 — 29 29 — 29
Transfer of net fair value gains (–)/losses (+) to profit and loss account on disposal — — — – 12 — – 12 – 12 — – 12
Balance at December 31, 2007 54 – 15 39 – 17 1 – 16 37 – 14 23
Cash flow hedges:
Net fair value gains (+)/losses (–) 312 – 73 239 — — — 312 – 73 239
Transfer of gains (–)/losses (+) to profit and loss account as adjustment to net sales – 507 144 – 363 — — — -507 144 – 363
Transfer of gains (–)/losses (+) to profit and loss account as adjustment to cost of sales 118 – 44 74 — — — 118 – 44 74
Transfer of gains (–)/losses (+) as a basis adjustment to assets and liabilities 124 – 32 92 — — — 124 – 32 92
Available-for-sale investments:
Net fair value gains (+)/losses (–) — — — – 26 8 – 18 – 26 8 – 18
Transfer to profit and loss account on impairment — — — 1 — 1 1 — 1
Transfer of net fair value gains (–)/losses (+) to profit and loss account on disposal — — — 13 1 14 13 1 14
Balance at December 31, 2008 101 – 20 81 – 29 10 – 19 72 – 10 62

Notes to the consolidated financial statements 31
Notes to the consolidated financial statements
In order to ensure that amounts deferred in the cash flow hedging reserve repre-sent only the effective portion of gains and losses on properly designated hedges of future transactions that remain highly probable at the balance sheet date, Nokia has adopted a process under which all derivative gains and losses are initially rec-ognized in the profit and loss account. The appropriate reserve balance is calculated at the end of each period and posted to the fair value and other reserves.
The Group continuously reviews the underlying cash flows and the hedges to ensure that the amounts transferred to the fair value reserves during the year end-ed December 31, 2008 and 2007 do not include gains/losses on forward exchange contracts that have been designated to hedge forecasted sales or purchases that are no longer expected to occur.
All of the net fair value gains or losses recorded in the fair value and other reserve at December 31, 2008 on open forward foreign exchange contracts which hedge anticipated future foreign currency sales or purchases are transferred from the Hedging Reserve to the profit and loss account when the forecasted foreign cur-rency cash flows occur, at various dates up to approximately 1 year from the balance sheet date.
21. The shares of the Parent Company
See note 14 to the financial statements of the Parent Company.
22. Share-based payment
The Group has several equity-based incentive programs for employees. The pro-grams include performance share plans, stock option plans and restricted share plans. Both executives and employees participate in these programs.
The equity-based incentive grants are generally conditional upon continued employment as well as fulfillment of such performance, service and other condi-tions, as determined in the relevant plan rules.
The share-based compensation expense for all equity-based incentive awards amounted to EUR 74 million in 2008 (EUR 228 million in 2007 and EUR 196 million in 2006).
Stock options
Nokia’s global stock option plans in effect for 2008, including their terms and condi-tions, were approved by the Annual General Meeting in the year when each plan was launched, i.e. in 2003, 2005 and 2007.
Each stock option entitles the holder to subscribe for one new Nokia share. The stock options are non-transferable. All of the stock options have a vesting schedule with 25% of the options vesting one year after grant and 6.25% each quarter there-after. The stock options granted under the plans generally have a term of five years.
The exercise price of the stock options is determined at the time of grant on a quarterly basis. The exercise prices are determined in accordance with a pre-agreed schedule quarterly after the release of Nokia’s periodic financial results and are based on the trade volume weighted average price of a Nokia share on NASDAQ OMX Helsinki during the trading days of the first whole week of the second month of the respective calendar quarter (i.e., February, May, August or November). Exercise prices are determined on a one-week weighted average to mitigate any short term fluctuations in Nokia’s share price. The determination of exercise price is defined in the terms and conditions of the stock option plan, which are approved by the shareholders at the respective Annual General Meeting. The Board of Directors does not have right to amend the above-described determination of the exercise price.
The stock option exercises are settled with newly issued Nokia shares which entitle the holder to a dividend for the financial year in which the subscription occurs. Other shareholder rights commence on the date on which the shares sub-scribed for are registered with the Finnish Trade Register.
Pursuant to the stock options issued, an aggregate maximum number of 23 113 218 new Nokia shares may be subscribed for, representing 0.6% of the total number of votes at December 31, 2008. During 2008 exercise of 3 546 508 options resulted in issuance of 3 546 508 new shares. The exercises of stock options have resulted in an increase of the share capital of the parent company until May 3, 2007. After that date the exercises of stock options have no longer resulted in an increase of the share capital as thereafter all share subsctiption prices are recorded in the fund for invested non-restricted equity as per a resolution by the Annual General Meeting.
There were no stock options outstanding as of December 31, 2008, which upon exercise would result in an increase of the share capital of the parent company.
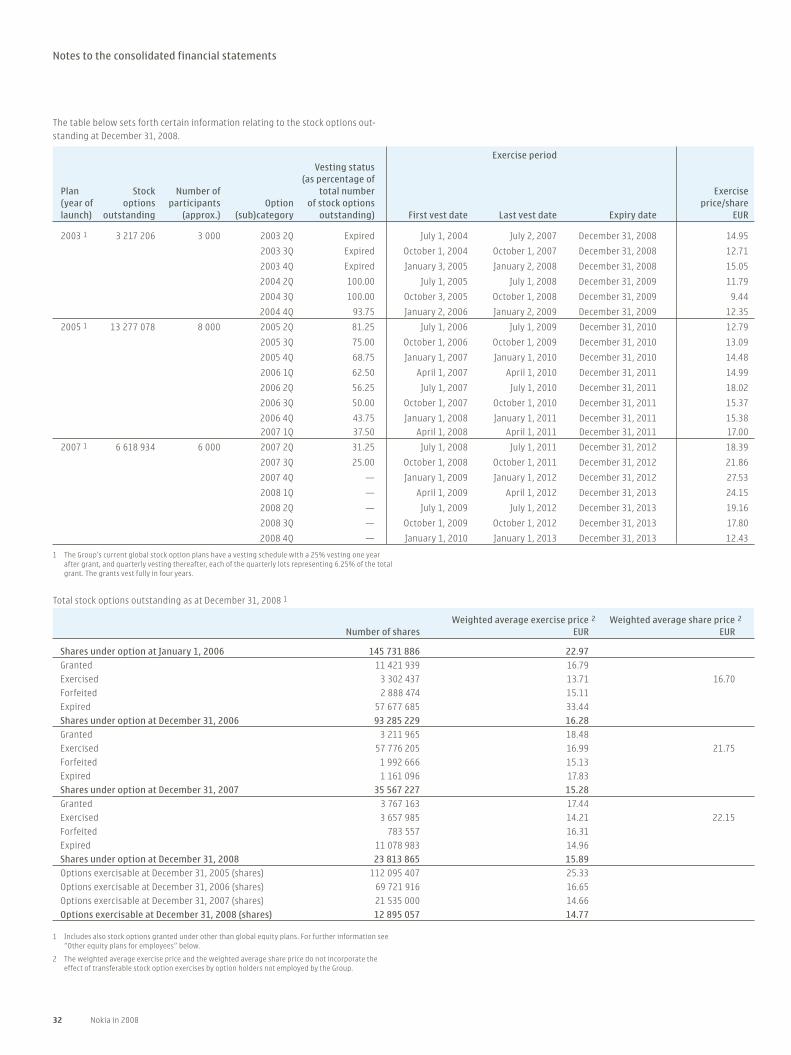
32 Nokia in 2008
Notes to the consolidated financial statements
Exercise period Vesting status (as percentage ofPlan Stock Number of total number Exercise(year of options participants Option of stock options price/sharelaunch) outstanding (approx.) (sub)category outstanding) First vest date Last vest date Expiry date EUR
2003 1 3 217 206 3 000 2003 2Q Expired July 1, 2004 July 2, 2007 December 31, 2008 14.95
2003 3Q Expired October 1, 2004 October 1, 2007 December 31, 2008 12.71
2003 4Q Expired January 3, 2005 January 2, 2008 December 31, 2008 15.05
2004 2Q 100.00 July 1, 2005 July 1, 2008 December 31, 2009 11.79
2004 3Q 100.00 October 3, 2005 October 1, 2008 December 31, 2009 9.44
2004 4Q 93.75 January 2, 2006 January 2, 2009 December 31, 2009 12.35
2005 1 13 277 078 8 000 2005 2Q 81.25 July 1, 2006 July 1, 2009 December 31, 2010 12.79
2005 3Q 75.00 October 1, 2006 October 1, 2009 December 31, 2010 13.09
2005 4Q 68.75 January 1, 2007 January 1, 2010 December 31, 2010 14.48
2006 1Q 62.50 April 1, 2007 April 1, 2010 December 31, 2011 14.99
2006 2Q 56.25 July 1, 2007 July 1, 2010 December 31, 2011 18.02
2006 3Q 50.00 October 1, 2007 October 1, 2010 December 31, 2011 15.37
2006 4Q 43.75 January 1, 2008 January 1, 2011 December 31, 2011 15.38
2007 1Q 37.50 April 1, 2008 April 1, 2011 December 31, 2011 17.00
2007 1 6 618 934 6 000 2007 2Q 31.25 July 1, 2008 July 1, 2011 December 31, 2012 18.39
2007 3Q 25.00 October 1, 2008 October 1, 2011 December 31, 2012 21.86
2007 4Q — January 1, 2009 January 1, 2012 December 31, 2012 27.53
2008 1Q — April 1, 2009 April 1, 2012 December 31, 2013 24.15
2008 2Q — July 1, 2009 July 1, 2012 December 31, 2013 19.16
2008 3Q — October 1, 2009 October 1, 2012 December 31, 2013 17.80
2008 4Q — January 1, 2010 January 1, 2013 December 31, 2013 12.43
1 Includes also stock options granted under other than global equity plans. For further information see “Other equity plans for employees” below.
2 The weighted average exercise price and the weighted average share price do not incorporate the effect of transferable stock option exercises by option holders not employed by the Group.
The table below sets forth certain information relating to the stock options out-standing at December 31, 2008.
1 The Group’s current global stock option plans have a vesting schedule with a 25% vesting one year after grant, and quarterly vesting thereafter, each of the quarterly lots representing 6.25% of the total grant. The grants vest fully in four years.
Total stock options outstanding as at December 31, 2008 1
Weighted average exercise price 2 Weighted average share price 2
Number of shares EUR EUR
Shares under option at January 1, 2006 145 731 886 22.97
Granted 11 421 939 16.79
Exercised 3 302 437 13.71 16.70
Forfeited 2 888 474 15.11
Expired 57 677 685 33.44
Shares under option at December 31, 2006 93 285 229 16.28
Granted 3 211 965 18.48
Exercised 57 776 205 16.99 21.75
Forfeited 1 992 666 15.13
Expired 1 161 096 17.83
Shares under option at December 31, 2007 35 567 227 15.28
Granted 3 767 163 17.44
Exercised 3 657 985 14.21 22.15
Forfeited 783 557 16.31
Expired 11 078 983 14.96
Shares under option at December 31, 2008 23 813 865 15.89
Options exercisable at December 31, 2005 (shares) 112 095 407 25.33
Options exercisable at December 31, 2006 (shares) 69 721 916 16.65
Options exercisable at December 31, 2007 (shares) 21 535 000 14.66
Options exercisable at December 31, 2008 (shares) 12 895 057 14.77

Notes to the consolidated financial statements 33
Notes to the consolidated financial statements
Options outstanding
Weighted average remaining contractual Weighted averageExercise prices , EUR Number of shares life in years exercise price, EUR
2.15–12.43 4 555 378 1.78 11.50
12.79–15.38 5 556 538 2.06 13.00
17.00–18.39 10 605 500 3.28 18.11
19.16–31.03 3 096 449 4.43 19.93
23 813 865
Nokia calculates the fair value of stock options using the Black Scholes model. The fair value of the stock options is estimated at the grant date using the following assumptions:
2008 2007 2006
Weighted average expected dividend yield 3.20% 2.30% 2.08%
Weighted average expected volatility 39.92% 25.24% 24.09%
Risk-free interest rate 3.15%–4.58% 3.79%–4.19% 2.86%–3.75%
Weighted average risk-free interest rate 3.65% 4.09% 3.62%
Expected life (years) 3.55 3.59 3.60
Weighted average share price, EUR 16.97 18.49 17.84
Expected term of stock options is estimated by observing general option holder behavior and actual historical terms of Nokia stock option plans.
Expected volatility has been set by reference to the implied volatility of options available on Nokia shares in the open market and in light of historical patterns of volatility.
Performance shares
The Group has granted performance shares under the global 2004, 2005, 2006, 2007 and 2008 plans, each of which, including its terms and conditions, has been approved by the Board of Directors. A valid authorization from the Annual General Meeting is re-quired, when the plans are settled by using the Nokia newly issued shares or treasury shares. The Group may also settle the plans by using cash instead of shares.
The performance shares represent a commitment by the Group to deliver Nokia shares to employees at a future point in time, subject to Nokia’s fulfillment of pre-defined performance criteria. No performance shares will vest unless the Group’s performance reaches at least one of the threshold levels measured by two independent, pre-defined performance criteria: the Group’s average annual net
The weighted average grant date fair value of stock options granted was EUR 3.92 in 2008, EUR 3.24 in 2007, and EUR 3.31 in 2006.
sales growth for the performance period of the plan and earnings per share (EPS) at the end of the performance period.
The 2004 and 2005 plans have a four-year performance period with a two-year interim measurement period. The 2006, 2007 and 2008 plans have a three-year performance period with no interim payout. The shares vest after the respective interim measurement period and/or the performance period. The shares will be delivered to the participants as soon as practicable after they vest. Until the Nokia shares are delivered, the participants will not have any shareholder rights, such as voting or dividend rights associated with the performance shares.
The following table summarizes our global performance share plans.
Performance Number of Interim shares outstanding participants measurement Performance 1st (interim) 2nd (final)Plan at threshold 1, 2 (approx.) period period settlement settlement
2004 — 10 000 2004–2005 2004–2007 2006 2008
2005 3 604 623 11 000 2005–2006 2005–2008 2007 2009
2006 — 12 000 N/A 2006–2008 N/A 2009
2007 1 997 416 5 000 N/A 2007–2009 N/A 2010
2008 2 431 132 6 000 N/A 2008–2010 N/A 2011
1 Shares under performance share plan 2006 vested on December 31, 2008 and are therefore not included in the outstanding numbers.
2 Does not include 2 048 outstanding performance shares with deferred delivery due to leave of absence.
The options outstanding by range of exercise price at December 31, 2008 are as follows:
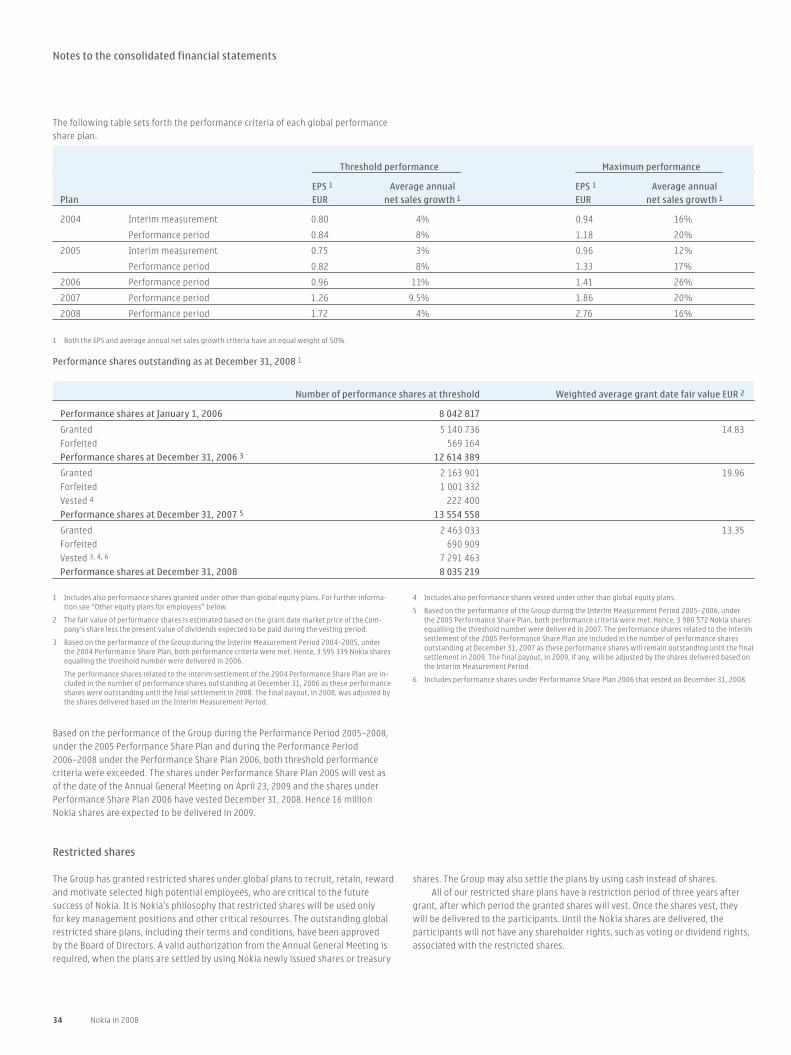
34 Nokia in 2008
Notes to the consolidated financial statements
Threshold performance Maximum performance
EPS 1 Average annual EPS 1 Average annualPlan EUR net sales growth 1 EUR net sales growth 1
2004 Interim measurement 0.80 4% 0.94 16%
Performance period 0.84 8% 1.18 20%
2005 Interim measurement 0.75 3% 0.96 12%
Performance period 0.82 8% 1.33 17%
2006 Performance period 0.96 11% 1.41 26%
2007 Performance period 1.26 9.5% 1.86 20%
2008 Performance period 1.72 4% 2.76 16%
1 Both the EPS and average annual net sales growth criteria have an equal weight of 50%.
The following table sets forth the performance criteria of each global performance share plan.
1 Includes also performance shares granted under other than global equity plans. For further informa-tion see “Other equity plans for employees” below.
2 The fair value of performance shares is estimated based on the grant date market price of the Com-pany’s share less the present value of dividends expected to be paid during the vesting period.
3 Based on the performance of the Group during the Interim Measurement Period 2004–2005, under the 2004 Performance Share Plan, both performance criteria were met. Hence, 3 595 339 Nokia shares equalling the threshold number were delivered in 2006.
The performance shares related to the interim settlement of the 2004 Performance Share Plan are in-cluded in the number of performance shares outstanding at December 31, 2006 as these performance shares were outstanding until the final settlement in 2008. The final payout, in 2008, was adjusted by the shares delivered based on the Interim Measurement Period.
4 Includes also performance shares vested under other than global equity plans.
5 Based on the performance of the Group during the Interim Measurement Period 2005–2006, under the 2005 Performance Share Plan, both performance criteria were met. Hence, 3 980 572 Nokia shares equalling the threshold number were delivered in 2007. The performance shares related to the interim settlement of the 2005 Performance Share Plan are included in the number of performance shares outstanding at December 31, 2007 as these performance shares will remain outstanding until the final settlement in 2009. The final payout, in 2009, if any, will be adjusted by the shares delivered based on the Interim Measurement Period.
6 Includes performance shares under Performance Share Plan 2006 that vested on December 31, 2008.
Performance shares outstanding as at December 31, 2008 1
Number of performance shares at threshold Weighted average grant date fair value EUR 2
Performance shares at January 1, 2006 8 042 817
Granted 5 140 736 14.83
Forfeited 569 164
Performance shares at December 31, 2006 3 12 614 389
Granted 2 163 901 19.96
Forfeited 1 001 332
Vested 4 222 400
Performance shares at December 31, 2007 5 13 554 558
Granted 2 463 033 13.35
Forfeited 690 909
Vested 3, 4, 6 7 291 463
Performance shares at December 31, 2008 8 035 219
Based on the performance of the Group during the Performance Period 2005–2008, under the 2005 Performance Share Plan and during the Performance Period 2006–2008 under the Performance Share Plan 2006, both threshold performance criteria were exceeded. The shares under Performance Share Plan 2005 will vest as of the date of the Annual General Meeting on April 23, 2009 and the shares under Performance Share Plan 2006 have vested December 31, 2008. Hence 16 million Nokia shares are expected to be delivered in 2009.
Restricted shares
The Group has granted restricted shares under global plans to recruit, retain, reward and motivate selected high potential employees, who are critical to the future success of Nokia. It is Nokia’s philosophy that restricted shares will be used only for key management positions and other critical resources. The outstanding global restricted share plans, including their terms and conditions, have been approved by the Board of Directors. A valid authorization from the Annual General Meeting is required, when the plans are settled by using Nokia newly issued shares or treasury
shares. The Group may also settle the plans by using cash instead of shares.All of our restricted share plans have a restriction period of three years after
grant, after which period the granted shares will vest. Once the shares vest, they will be delivered to the participants. Until the Nokia shares are delivered, the participants will not have any shareholder rights, such as voting or dividend rights, associated with the restricted shares.
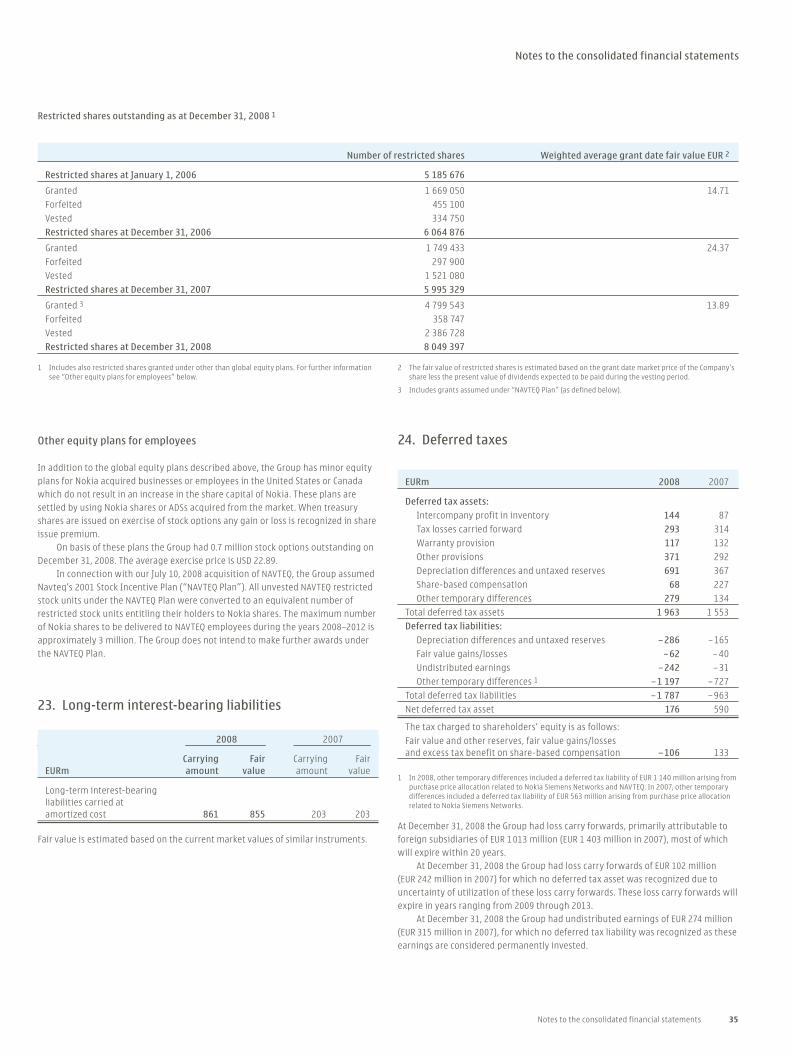
Notes to the consolidated financial statements 35
Notes to the consolidated financial statements
Restricted shares outstanding as at December 31, 2008 1
Number of restricted shares Weighted average grant date fair value EUR 2
Restricted shares at January 1, 2006 5 185 676
Granted 1 669 050 14.71
Forfeited 455 100
Vested 334 750
Restricted shares at December 31, 2006 6 064 876
Granted 1 749 433 24.37
Forfeited 297 900
Vested 1 521 080
Restricted shares at December 31, 2007 5 995 329
Granted 3 4 799 543 13.89
Forfeited 358 747
Vested 2 386 728
Restricted shares at December 31, 2008 8 049 397
1 Includes also restricted shares granted under other than global equity plans. For further information see “Other equity plans for employees” below.
2 The fair value of restricted shares is estimated based on the grant date market price of the Company’s share less the present value of dividends expected to be paid during the vesting period.
3 Includes grants assumed under “NAVTEQ Plan” (as defined below).
Other equity plans for employees
In addition to the global equity plans described above, the Group has minor equity plans for Nokia acquired businesses or employees in the United States or Canada which do not result in an increase in the share capital of Nokia. These plans are settled by using Nokia shares or ADSs acquired from the market. When treasury shares are issued on exercise of stock options any gain or loss is recognized in share issue premium.
On basis of these plans the Group had 0.7 million stock options outstanding on December 31, 2008. The average exercise price is USD 22.89.
In connection with our July 10, 2008 acquisition of NAVTEQ, the Group assumed Navteq’s 2001 Stock Incentive Plan (“NAVTEQ Plan”). All unvested NAVTEQ restricted stock units under the NAVTEQ Plan were converted to an equivalent number of restricted stock units entitling their holders to Nokia shares. The maximum number of Nokia shares to be delivered to NAVTEQ employees during the years 2008–2012 is approximately 3 million. The Group does not intend to make further awards under the NAVTEQ Plan.
23. Long-term interest-bearing liabilities
2008 2007
Carrying Fair Carrying FairEURm amount value amount value
Long-term interest-bearing liabilities carried at amortized cost 861 855 203 203
Fair value is estimated based on the current market values of similar instruments.
24. Deferred taxes
EURm 2008 2007
Deferred tax assets:
Intercompany profit in inventory 144 87
Tax losses carried forward 293 314
Warranty provision 117 132
Other provisions 371 292
Depreciation differences and untaxed reserves 691 367
Share-based compensation 68 227
Other temporary differences 279 134
Total deferred tax assets 1 963 1 553
Deferred tax liabilities:
Depreciation differences and untaxed reserves – 286 – 165
Fair value gains/losses – 62 – 40
Undistributed earnings – 242 – 31
Other temporary differences 1 – 1 197 – 727
Total deferred tax liabilities – 1 787 – 963
Net deferred tax asset 176 590
The tax charged to shareholders’ equity is as follows:
Fair value and other reserves, fair value gains/losses and excess tax benefit on share-based compensation – 106 133
1 In 2008, other temporary differences included a deferred tax liability of EUR 1 140 million arising from purchase price allocation related to Nokia Siemens Networks and NAVTEQ. In 2007, other temporary differences included a deferred tax liability of EUR 563 million arising from purchase price allocation related to Nokia Siemens Networks.
At December 31, 2008 the Group had loss carry forwards, primarily attributable to foreign subsidiaries of EUR 1 013 million (EUR 1 403 million in 2007), most of which will expire within 20 years.
At December 31, 2008 the Group had loss carry forwards of EUR 102 million (EUR 242 million in 2007) for which no deferred tax asset was recognized due to uncertainty of utilization of these loss carry forwards. These loss carry forwards will expire in years ranging from 2009 through 2013.
At December 31, 2008 the Group had undistributed earnings of EUR 274 million (EUR 315 million in 2007), for which no deferred tax liability was recognized as these earnings are considered permanently invested.

36 Nokia in 2008
Notes to the consolidated financial statements
25. Accrued expenses
EURm 2008 2007
Social security, VAT and other taxes 1 700 2 024
Wages and salaries 665 865
Advance payments 532 503
Other 4 126 3 722
Total 7 023 7 114
Other operating expense accruals include dererred service revenue, accrued discounts, royalties and marketing expenses as well as various amounts which are individually insignificant.
26. Derivative financial instruments
2007 2007 Assets Liabilities
Fair Fair EURm value 1 Notional 2 value 1 Notional 2
Hedges of net investment in foreign subsidiaries:
Forward foreign exchange contracts 22 1 264 – 6 393
Currency options bought — 51 — —
Currency options sold — — — —
Cash flow hedges:
Forward foreign exchange contracts 89 15 718 – 64 12 062
Currency options bought 20 7 618 — —
Currency options sold — — – 25 6 872
Derivatives not designated in hedge accounting relationships carried at fair value through profit and loss:
Forward foreign exchange contracts 22 2 831 – 49 4 456
Currency options bought 4 1 530 — —
Currency options sold — — — —
Interest rate futures 6 39 — —
Interest rate swaps — 43 — —
Cash settled equity options bought 3 41 63 — —
Cash settled equity options sold 3 — — – 23 40
204 29 157 – 167 23 823
1 The fair value of derivative financial instruments is included on the asset side under heading Other financial assets and on the liability side under Other financial liabilities.
2 Includes the gross amount of all notional values for contracts that have not yet been settled or can-celled. The amount of notional value outstanding is not necessarily a measure or indication of market risk, as the exposure of certain contracts may be offset by that of other contracts.
3 Cash settled equity options are used to hedge risk relating to employee incentive programs and invest-ment activities.
2008 2008 Assets Liabilities
Fair Fair EURm value 1 Notional 2 value 1 Notional 2
Hedges of net investment in foreign subsidiaries:
Forward foreign exchange contracts 80 1 045 – 14 472
Currency options bought 30 724 — —
Currency options sold — — – 44 768
Cash flow hedges:
Forward foreign exchange contracts 562 14 577 – 445 11 792
Currency options bought — — — —
Currency options sold — — — —
Derivatives not designated in hedge accounting relationships carried at fair value through profit and loss:
Forward foreign exchange contracts 322 7 817 – 416 7 370
Currency options bought 6 201 — —
Currency options sold — — – 5 186
Interest rate futures 6 21 — —
Interest rate swaps 7 618 — —
Cash settled equity options bought 3 1 25 — —
Cash settled equity options sold 3 — — — – 13
1 014 25 028 – 924 20 575

Notes to the consolidated financial statements 37
Notes to the consolidated financial statements
27. Provisions
IPR EURm Warranty Restructuring infringements Tax Other Total
At January 1, 2007 1 198 65 284 402 437 2 386
Exchange differences – 10 — — — — – 10
Acquisitions 263 — — — 134 397
Additional provisions 1 127 744 345 59 548 2 823
Change in fair value — — — — 16 16
Changes in estimates – 126 – 53 – 47 – 9 – 216 – 451
Charged to profit and loss account 1 001 691 298 50 348 2 388
Utilized during year – 963 – 139 – 37 — – 305 – 1 444
At December 31, 2007 1 489 617 545 452 614 3 717
At January 1, 2008 1 489 617 545 452 614 3 717
Exchange differences – 16 — — — — – 16
Acquisitions 1 — 3 6 2 12
Additional provisions 1 211 533 266 47 1 136 3 193
Change in fair value — — — — – 7 – 7
Changes in estimates – 240 – 211 – 92 – 45 – 185 – 773
Charged to profit and loss account 971 322 174 2 944 2 413
Utilized during year – 1 070 – 583 – 379 — – 502 – 2 534
At December 31, 2008 1 375 356 343 460 1 058 3 592
EURm 2008 2007
Analysis of total provisions at December 31:
Non-current 978 1 323
Current 2 614 2 394
Outflows for the warranty provision are generally expected to occur within the next 18 months. Timing of outflows related to tax provisions is inherently uncertain.
The restructuring provision is mainly related to restructuring activities in Devices & Services and Nokia Siemens Networks segments. The majority of outflows related to the restructuring is expected to occur during 2009.
In conjunction with the Group’s decision to discontinue the production of mobile devices in Germany, a restructuring provision of EUR 259 million was recog-nized. Devices & Services also recognized EUR 52 million charges related to other restructuring activities.
Restructuring and other associated expenses incurred in Nokia Siemens Networks in 2008 totaled EUR 646 million (EUR 1 110 million in 2007) including
mainly personnel related expenses as well as expenses arising from the elimina-tion of overlapping functions, and the realignment of product portfolio and related replacement of discontinued products in customer sites. These expenses included EUR 402 million (EUR 318 million in 2007) impacting gross profit, EUR 46 million (EUR
439 million in 2007) research and development expenses, EUR 14 million of reversal of provision (EUR 149 million expenses in 2007) in selling and marketing expenses, EUR 163 million (EUR 146 million in 2007) administrative expenses and EUR 49 million (EUR 58 million in 2007) other operating expenses. EUR 790 million was paid during 2008 (EUR 254 million during 2007).
The IPR provision is based on estimated future settlements for asserted and unasserted past IPR infringements. Final resolution of IPR claims generally occurs over several periods. In 2008, EUR 379 million usage of the provisions mainly relates to the settlements with Qualcomm, Eastman Kodak, Intertrust Technologies and ContentGuard.
Other provisions include provisions for non-cancelable purchase commitments, provision for pension and other social costs on share-based awards and provision for losses on projects in progress.
28. Earnings per share
2008 2007 2006
Numerator/EURm
Basic/Diluted:
Profit attributable to equity holders of the parent 3 988 7 205 4 306
Denominator/1 000 shares
Basic:
Weighted average shares 3 743 622 3 885 408 4 062 833
Effect of dilutive securities:
Performance shares 25 997 26 304 17 264
Restricted shares 6 543 3 693 3 601
Stock options 4 201 16 603 2 831
36 741 46 600 23 696
Diluted:
Adjusted weighted average shares and assumed conversions 3 780 363 3 932 008 4 086 529
Under IAS 33, basic earnings per share is computed using the weighted average number of shares outstanding during the period. Diluted earnings per share is com-puted using the weighted average number of shares outstanding during the period plus the dilutive effect of stock options, restricted shares and performance shares outstanding during the period.
Performance shares, restricted shares and stock options equivalent to 11 mil-lion shares were excluded from the calculation of diluted earnings per share in 2008 as they were determined to be anti-dilutive. In 2007 and 2006, no shares were considered anti-dilutive.

38 Nokia in 2008
Notes to the consolidated financial statements
29. Commitments and contingencies
EURm 2008 2007
Collateral for our own commitments
Property under mortgages 18 18
Assets pledged 11 29
Contingent liabilities on behalf of Group companies
Other guarantees 2 896 2 563
Contingent liabilities on behalf of other companies
Financial guarantees on behalf of third parties 2 130
Other guarantees 1 1
Financing commitments
Customer finance commitments 1 197 270
Venture fund commitments 2 467 251
1 See also note 35 b).
2 See also note 35 a).
The amounts above represent the maximum principal amount of commitments and contingencies.
Property under mortgages given as collateral for our own commitments include mortgages given to the Finnish National Board of Customs as a general indemnity of EUR 18 million in 2008 (EUR 18 million in 2007).
Assets pledged for the Group’s own commitments include available-for-sale investments of EUR 10 million in 2008 (EUR 10 million in 2007).
Other guarantees include guarantees of EUR 2 682 million in 2008 (EUR 2 429 million in 2007) provided to certain Nokia Siemens Networks’ customers in the form of bank guarantees, standby letters of credit and other similar instruments. These instruments entitle the customer to claim payment as compensation for non-performance by Nokia of its obligations under network infrastructure supply agreements. Depending on the nature of the instrument, compensation is payable either immediately upon request, or subject to independent verification of non-performance by Nokia.
Guarantees for loans and other financial commitments on behalf of other companies were EUR 2 million in 2008 (EUR 130 million in 2007). The amount of 2007 represents guarantees relating to payment by certain Nokia Siemens Networks’ customers and other third parties under specified loan facilities between such a customer and other third parties and their creditors. Nokia’s obligations under such guarantees are released upon the earlier of expiration of the guarantee or early payment by the customer.
Financing commitments of EUR 197 million in 2008 (EUR 270 million in 2007) are available under loan facilities negotiated mainly with Nokia Siemens Networks’ cus-tomers. Availability of the amounts is dependent upon the borrower’s continuing compliance with stated financial and operational covenants and compliance with other administrative terms of the facility. The loan facilities are primarily available to fund capital expenditure relating to purchases of network infrastructure equip-ment and services.
Venture fund commitments of EUR 467 million in 2008 (EUR 251 million in 2007) are financing commitments to a number of funds making technology related invest-ments. As a limited partner in these funds Nokia is committed to capital contribu-tions and also entitled to cash distributions according to respective partnership agreements.
The Group is party to routine litigation incidental to the normal conduct of business, including, but not limited to, several claims, suits and actions both initi-ated by third parties and initiated by Nokia relating to infringements of patents, violations of licensing arrangements and other intellectual property related mat-ters, as well as actions with respect to products, contracts and securities. In the opinion of the management the outcome of and liabilities in excess of what has been provided for relating to these or other proceedings, in aggregate, are not likely to be material to the financial condition or result of operations.
Nokia’s payment obligations under the subscriber unit cross-license agree-ments signed in 1992 and 2001 with Qualcomm Incorporated (Qualcomm) expired on April 9, 2007. The parties entered into negotiations for a new license agreement with the intention of reaching a mutually acceptable agreement on a timely basis. Prior to the commencement of negotiations and as negotiations proceeded, Nokia and Qualcomm were engaged in numerous legal disputes in the United States, Europe and China. On July 24, 2008, Nokia and Qualcomm entered into a new license agreement covering various current and future standards and other technologies, and resulting in a settlement of all litigation between the companies. Under the terms of the 15 year agreement covering various standards and other technologies, Nokia has been granted a license under all Qualcomm’s patents for use in Nokia’s mobile devices and Nokia Siemens Networks infrastructure equipment, and Nokia has agreed not to use any of its patents directly against Qualcomm. The financial terms included a one-time lump-sum cash payment of EUR 1.7 billion made by Nokia to Qualcomm in the fourth quarter of 2008 and on-going royalty payments to Qualcomm. The lump-sum payment made to Qualcomm will be expensed over the term of the agreement. Nokia also agreed to assign ownership of a number of patents to Qualcomm.
As of December 31, 2008, the Group had purchase commitments of EUR 2 351 million (EUR 2 610 million in 2007) relating to inventory purchase obligations, ser-vice agreements and outsourcing arrangements, primarily for purchases in 2009.
30. Leasing contracts
The Group leases office, manufacturing and warehouse space under various non-cancellable operating leases. Certain contracts contain renewal options for various periods of time.
The future costs for non-cancellable leasing contracts are as follows:
Leasing payments, EURm Operating leases
2009 3152010 2432011 1792012 1272013 98Thereafter 194
Total 1 156
Rental expense amounted to EUR 418 million in 2008 (EUR 328 million in 2007 and EUR 285 million in 2006).
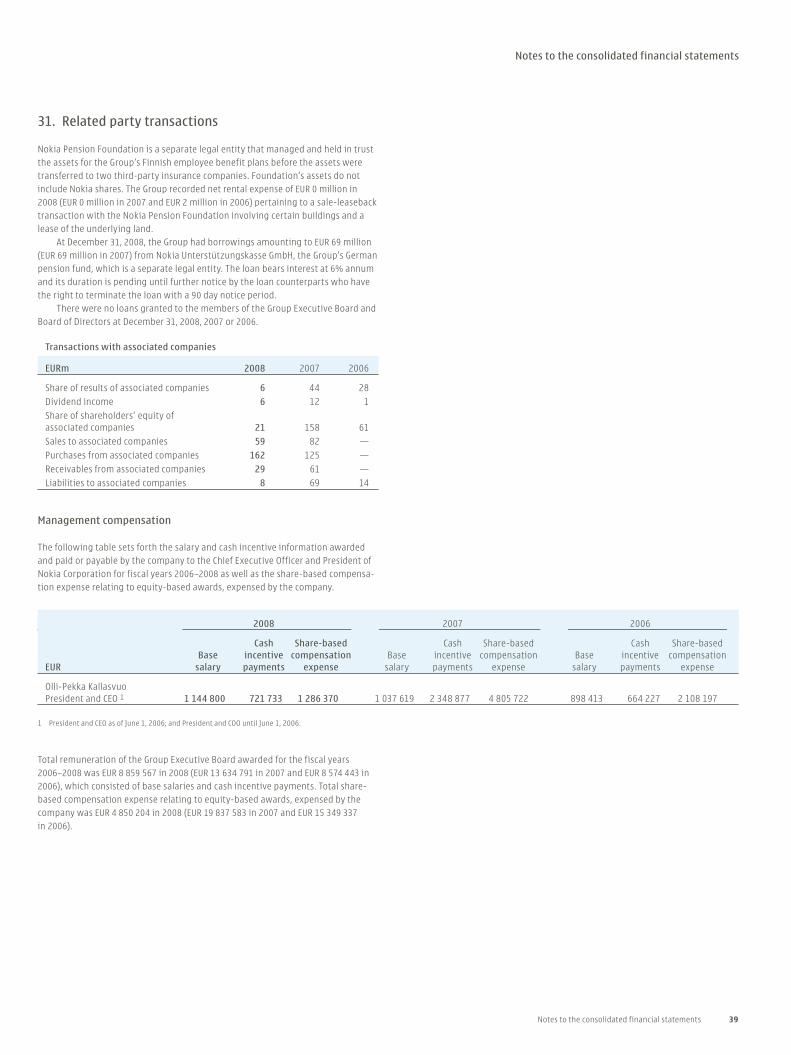
Notes to the consolidated financial statements 39
Notes to the consolidated financial statements
31. Related party transactions
Nokia Pension Foundation is a separate legal entity that managed and held in trust the assets for the Group’s Finnish employee benefit plans before the assets were transferred to two third-party insurance companies. Foundation’s assets do not include Nokia shares. The Group recorded net rental expense of EUR 0 million in 2008 (EUR 0 million in 2007 and EUR 2 million in 2006) pertaining to a sale-leaseback transaction with the Nokia Pension Foundation involving certain buildings and a lease of the underlying land.
At December 31, 2008, the Group had borrowings amounting to EUR 69 million (EUR 69 million in 2007) from Nokia Unterstützungskasse GmbH, the Group’s German pension fund, which is a separate legal entity. The loan bears interest at 6% annum and its duration is pending until further notice by the loan counterparts who have the right to terminate the loan with a 90 day notice period.
There were no loans granted to the members of the Group Executive Board and Board of Directors at December 31, 2008, 2007 or 2006.
Transactions with associated companies
EURm 2008 2007 2006
Share of results of associated companies 6 44 28
Dividend income 6 12 1
Share of shareholders’ equity of associated companies 21 158 61
Sales to associated companies 59 82 —
Purchases from associated companies 162 125 —
Receivables from associated companies 29 61 —
Liabilities to associated companies 8 69 14
Management compensation
The following table sets forth the salary and cash incentive information awarded and paid or payable by the company to the Chief Executive Officer and President of Nokia Corporation for fiscal years 2006–2008 as well as the share-based compensa-tion expense relating to equity-based awards, expensed by the company.
2008 2007 2006
Cash Share-based Cash Share-based Cash Share-based Base incentive compensation Base incentive compensation Base incentive compensationEUR salary payments expense salary payments expense salary payments expense
Olli-Pekka Kallasvuo President and CEO 1 1 144 800 721 733 1 286 370 1 037 619 2 348 877 4 805 722 898 413 664 227 2 108 197
1 President and CEO as of June 1, 2006; and President and COO until June 1, 2006.
Total remuneration of the Group Executive Board awarded for the fiscal years 2006 –2008 was EUR 8 859 567 in 2008 (EUR 13 634 791 in 2007 and EUR 8 574 443 in 2006), which consisted of base salaries and cash incentive payments. Total share-based compensation expense relating to equity-based awards, expensed by the company was EUR 4 850 204 in 2008 (EUR 19 837 583 in 2007 and EUR 15 349 337 in 2006).

40 Nokia in 2008
Notes to the consolidated financial statements
Board of Directors
The following table depicts the annual remuneration structure paid to the members of our Board of Directors, as resolved by the Annual General Meetings in the respec-tive years.
2008 2007 2006
Gross Shares Gross Shares Gross Shares annual fee received annual fee received annual fee receivedBoard of Directors EUR 1 EUR 1 EUR 1
ChairmanJorma Ollila 2 440 000 9 499 375 000 8 110 375 000 8 035
Vice ChairmanDame Marjorie Scardino 3 150 000 3 238 150 000 3 245 110 000 2 356
Georg Ehrnrooth 4 155 000 3 346 155 000 3 351 120 000 2 570
Lalita D. Gupte 5 140 000 3 022 140 000 3 027 — —
Dr. Bengt Holmström 130 000 2 806 130 000 2 810 110 000 2 356
Dr. Henning Kagermann 130 000 2 806 130 000 2 810 — —
Olli-Pekka Kallasvuo 6 130 000 2 806 130 000 2 810 — —
Per Karlsson 7 155 000 3 346 155 000 3 351 135 000 2 892
Risto Siilasmaa 8 140 000 3 022 — — — —
Keijo Suila 9 140 000 3 022 140 000 3 027 120 000 2 570
Vesa Vainio 10 — — 140 000 3 027 120 000 2 570
1 Approximately 60% of the gross annual fee is paid in cash and the remaining 40% in Nokia shares purchased from the market and included in the table under “Shares Received.”
2 This table includes fees paid for Mr. Ollila, Chairman, for his services as Chairman of the Board, only.
3 The 2008 and 2007 fees of Ms. Scardino amounted to EUR 150 000 for services as Vice Chairman. The 2006 fee amounted to EUR 110 000 for services as a member of the Board.
4 The 2008 and 2007 fees of Mr. Ehrnrooth amounted to a total of EUR 155 000, consisting of a fee of EUR 130 000 for services as a member of the Board and EUR 25 000 for services as Chairman of the Audit Committee. The 2006 fee of Mr. Ehrnrooth consisted of a fee of EUR 110 000 for services as a member of the Board and EUR 10 000 for services as a member of the Audit Committee.
5 The 2008 and 2007 fees of Ms. Gupte amounted to a total of EUR 140 000, consisting of fee of 130 000 for services as a member of the Board and EUR 10 000 for services as a member of the Audit Commit-tee.
6 This table includes fees paid to Mr. Kallasvuo, President and CEO, for his services as a member of the Board, only.
7 The 2008 and 2007 fees of Mr. Karlsson amounted to a total of EUR 155 000, consisting of a fee of EUR 130 000 for services as a member of the Board and EUR 25 000 for services as Chairman of the Person-nel Committee. The 2006 fee of Mr. Karlsson amounted to a total of EUR 135 000, consisting of a fee of EUR 110 000 for services as a member of the Board and EUR 25 000 for services as Chairman of the Audit Committee.
8 The 2008 fee of Mr. Siilasmaa amounted to a total of EUR 140 000, consisting of fee of 130 000 for services as a member of the Board and EUR 10 000 for services as a member of the Audit Committee.
9 The 2008 and 2007 fees of Mr. Suila amounted to a total of EUR 140 000, consisting of a fee of EUR 130 000 for services as a member of the Board and EUR 10 000 for services as a member of the Audit Committee. The 2006 fee of Mr. Suila amounted to a total of EUR 120 000, consisting of a fee of EUR 110 000 for services as a member of the Board and EUR 10 000 for services as a member of the Audit Committee.
10 Mr. Vainio was a member of the Board of Directors and the Audit Committee until the end of the Annual General Meeting on May 8, 2008. Mr. Vainio received his fees for services as a member of the Board and as a member of the Audit Committee, as resolved by the shareholders at the Annual General Meeting on May 3, 2007, already in 2007 and thus no fees were paid to him for the services rendered during 2008. The 2007 fee of Mr.Vainio amounted to a total of EUR 140 000 consisting of a fee of EUR 130 000 for services as a member of the Board and EUR 10 000 for services as a member of the Audit Committee. The 2006 fee of Mr. Vainio amounted to a total of EUR 120 000, consisting of a fee of EUR 110 000 for services as a member of the Board and EUR 10 000 for services as a member of the Audit Committee.
Pension arrangements of certain Group Executive Board Members
Olli-Pekka Kallasvuo can, as part of his service contract, retire at the age of 60 with full retirement benefit should he be employed by Nokia at the time. The full retire-ment benefit is calculated as if Mr. Kallasvuo had continued his service with Nokia through the retirement age of 65. Hallstein Moerk, following his arrangement with a previous employer, has also in his current position at Nokia a retirement benefit of 65% of his pensionable salary beginning at the age of 62. Early retirement is possible at the age of 55 with reduced benefits. Simon Beresford-Wylie participates in the Nokia International Employee Benefit Plan (NIEBP). The NIEBP is a defined contribution retirement arrangement provided to some Nokia employees on inter-national assignments. The contributions to NIEBP are funded two-thirds by Nokia and one-third by the employee. Because Mr. Beresford-Wylie also participates in the Finnish TEL system, the company contribution to NIEBP is 1.3% of annual earnings.

Notes to the consolidated financial statements 41
Notes to the consolidated financial statements
32. Notes to cash flow statement
EURm 2008 2007 2006
Adjustments for:
Depreciation and amortization (Note 9) 1 617 1 206 712
(Profit)/loss on sale of property, plant and equipment and available-for-sale investments – 11 – 1 864 – 4
Income taxes (Note 11) 1 081 1 522 1 357
Share of results of associated companies (Note 14) – 6 – 44 – 28
Minority interest – 99 – 459 60
Financial income and expenses (Note 10) 2 – 239 – 207
Impairment charges (Note 7) 149 63 51
Retirements (Note 8, 12) 186 — —
Share-based compensation (Note 22) 74 228 192
Restructuring charges 448 856 —
Customer financing impairment charges and reversals — — – 276
Finnish pension settlement (Note 5) 152 — —
Other income and expenses – 124 — —
Adjustments, total 3 469 1 269 1 857
Change in net working capital
Increase in short-term receivables – 534 – 2 146 – 1 770
Decrease (+)/increase (–) in inventories 321 – 245 84
Decrease (–)/increase (+) in interest-free short-term liabilities – 2 333 2 996 893
Change in net working capital – 2 546 605 – 793
The Group did not engage in any material non-cash investing activities in 2008 and 2006. In 2007 the formation of Nokia Siemens Networks was completed through the contribution of certain tangible and intangible assets and certain business interests that comprised Nokia’s networks business and Siemens’ carrier-related operations. See Note 8.
33. Subsequent events
Eurobond issuance under Euro Medium Term Note program and European Investment Bank loan
In February 2009, the Group issued EUR 1 750 million of Eurobonds with maturities of five and ten years under its EUR 3 000 million Euro Medium Term Note, or EMTN program, to repay part of the Group’s existing short-term borrowings. The Group voluntarily cancelled its USD 2 000 million committed credit facility maturing in 2009 due to this repayment. In February, the Group also signed and fully drew down a EUR 500 million loan from the European Investment Bank to finance part of its smartphone research and development expenses.
34. Principal Nokia Group companies at December 31, 2008
Parent Group% holding majority
US Nokia Inc. — 100.0
DE Nokia GmbH 100.0 100.0
GB Nokia UK Limited — 100.0
KR Nokia TMC Limited 100.0 100.0
CN Nokia Telecommunications Ltd — 83.9
NL Nokia Finance International B.V. 100.0 100.0
HU Nokia Komárom Kft 100.0 100.0
IN Nokia India Pvt Ltd 100.0 100.0
IT Nokia Italia S.p.A 100.0 100.0
ES Nokia Spain S.A.U 100.0 100.0
RO Nokia Romania SRL 100.0 100.0
BR Nokia do Brasil Tecnologia Ltda 100.0 100.0
US NAVTEQ Corporation — 100.0
NL Nokia Siemens Networks B.V. — 50.0 1
FI Nokia Siemens Networks Oy — 50.0
DE Nokia Siemens Networks GmbH & Co KG — 50.0
IN Nokia Siemens Networks Pvt. Ltd. — 50.0
1 Nokia Siemens Networks B.V., the ultimate parent of the Nokia Siemens Network group, is owned ap-proximately 50% by each of Nokia and Siemens and consolidated by Nokia. Nokia effectively controls Nokia Siemens Networks as it has the ability to appoint key officers and the majority of the members of its Board of Directors, and accordingly, Nokia consolidated Nokia Siemens Networks.
35. Risk management
General risk management principles
Nokia’s overall risk management concept is based on visibility of the key risks preventing Nokia from reaching its business objectives. This covers all risk areas; strategic, operational, financial and hazard risks. Risk management at Nokia refers to systematic and pro-active way to analyze, review and manage opportunities, threats and risks related to Nokia’s objectives rather than being solely focused on eliminating risks.
The principles documented in Nokia’s Risk Policy and accepted by the Audit Committee of the Board of Directors require risk management and its elements to be integrated into business processes. One of the main principles is that the busi-ness or function owner is also the risk owner, however, it is everyone’s responsibility at Nokia to identify risks preventing us from reaching our objectives.
Key risks are reported to the Group level management to create assurance on business risks and to enable prioritization of risk management implementation at Nokia. In addition to general principles there are specific risk management policies covering, for example, treasury and customer business related credit risks.
Financial risks
The objective for Treasury activities in Nokia is twofold: to guarantee cost-efficient funding for the Group at all times, and to identify, evaluate and hedge financial risks. There is a strong focus in Nokia on creating shareholder value. Treasury activi-ties support this aim by: i) minimizing the adverse effects caused by fluctuations in the financial markets on the profitability of the underlying businesses; and ii) managing the capital structure of the Group by prudently balancing the levels of liquid assets and financial borrowings.
Treasury activities are governed by policies approved by the CEO. Treasury Policy provides principles for overall financial risk management and determines

42 Nokia in 2008
Notes to the consolidated financial statements
the allocation of responsibilities for financial risk management in Nokia. Operating Procedures cover specific areas such as foreign exchange risk, interest rate risk, use of derivative financial instruments, as well as liquidity and credit risk. Nokia is risk averse in its Treasury activities.
a) Market risk
Foreign exchange risk
Nokia operates globally and is thus exposed to foreign exchange risk arising from various currencies. Foreign currency denominated assets and liabilities together with expected cash flows from highly probable purchases and sales contribute to foreign exchange exposure. These transaction exposures are managed against various local currencies because of Nokia’s substantial production and sales outside the Eurozone.
According to the foreign exchange policy guidelines of the Group, which remain the same as in the previous year, material transaction foreign exchange exposures are hedged. Exposures are mainly hedged with derivative financial instruments such as forward foreign exchange contracts and foreign exchange options. The majority of financial instruments hedging foreign exchange risk have duration of less than a year. The Group does not hedge forecasted foreign currency cash flows beyond two years.
Since Nokia has subsidiaries outside the Euro zone, the euro-denominated value of the shareholders’ equity of Nokia is also exposed to fluctuations in ex-change rates. Equity changes resulting from movements in foreign exchange rates are shown as a translation difference in the Group consolidation.
Nokia uses, from time to time, foreign exchange contracts and foreign currency denominated loans to hedge its equity exposure arising from foreign net invest-ments.
At the end of year 2008 and 2007, following currencies represent significant portion of the currency mix in the outstanding financial instruments:
2008, EURm USD JPY CNY INR
FX derivatives used as cashflow hedges (net amount) 1 – 3 359 2 674 — – 122
FX derivatives used as net investment hedges (net amount) 2 – 232 — – 699 – 179
FX exposure from balance sheet items (net amount) 3 729 – 494 – 579 236
FX derivatives not designated in a hedge relationship and carried at fair value through the profit and loss statement (net amount) 3 – 615 480 527 – 443
2007, EURm USD JPY GBP INR 4
FX derivatives used as cashflow hedges (net amount) 1 803 1 274 – 656 – 83
FX derivatives used as net investment hedges (net amount) 2 — — — – 216
FX exposure from balance sheetitems (net amount) 3 2 204 – 739 89 320
FX derivatives not designatedin a hedge relationship and carried at fair value through the profit and loss statement (net amount) 3 – 2 361 847 – 127 – 399
1 The FX derivatives are used to hedge the foreign exchange risk from forecasted highly probably cashflows related to sales, purchases and business acquisition activities. In some of the currencies, especially in US Dollar, Nokia has substantial foreign exchange risks in both estimated cash inflows and outflows, which have been netted in the table. See Note 20 for more details on hedge accounting. The underlying exposures for which these hedges are entered into are not presented in the table, as they are not financial instruments as defined under IFRS 7.
2 The FX derivatives are used to hedge the Group’s net investment exposure. The underlying exposures for which these hedges are entered into are not presented in the table, as they are not financial instru-ments as defined under IFRS 7.
3 The balance sheet items which are denominated in the foreign currencies are hedged by a portion of FX derivatives not designated in a hedge relationship and carried at fair value through the profit and loss statement, resulting in offsetting FX gains or losses in the financial income and expenses.
4 The INR amounts for 2007 have been revised as compared to previously published financial state-ments due to a change in the way Nokia defines foreign exchange exposures.
Interest rate risk
The Group is exposed to interest rate risk either through market value fluctuations of balance sheet items (i.e. price risk) or through changes in interest income or expenses (i.e. re-investment risk). Interest rate risk mainly arises through interest bearing liabilities and assets. Estimated future changes in cash flows and balance sheet structure also expose the Group to interest rate risk.
The objective of interest rate risk management is to optimize the balance between minimizing uncertainty caused by fluctuations in interest rates and maxi-mizing the consolidated net interest income and expense.
The interest rate exposure of the Group is monitored and managed centrally. Nokia uses the Value-at-Risk (VaR) methodology to assess and measure the interest rate risk of the net investments (cash and investments less outstanding debt) and related derivatives.
As at the reporting date, the interest rate profile of the Group’s interest-bearing assets and liabilities is presented in the table below:
EURm 2008 2007
Fixed rate assets 2 946 7 750
Floating rate assets 4 007 4 205
Fixed rate liabilities 3 604 712
Floating rate liabilities 785 375
Equity price risk
Nokia is exposed to equity price risk as the result of market price fluctuations in the listed equity instruments held mainly for strategic business reasons.
Nokia has certain strategic minority investments in publicly listed equity shares. The fair value of the equity investments which are subject to equity price risk at December 31, 2008 was EUR 8 million (EUR 10 million in 2007). In addition, Nokia invests in private equity through venture funds, which, from time to time, may have holdings in equity instruments which are listed in stock exchanges. These investments are classified as available-for-sale carried at fair value. See Note 15 for more details on available for sale investments.
Due to the insignificant amount of exposure to equity price risk, there are currently no outstanding derivative financial instruments designated as hedges for these equity investments.
Nokia is exposed to equity price risk on social security costs relating to its equity compensation plans. Nokia mitigates this risk by entering into cash settled equity option contracts.
Value-at-Risk
Nokia uses the Value-at-Risk (VaR) methodology to assess the Group exposures to foreign exchange (FX), interest rate, and equity risks. The VaR gives estimates of potential fair value losses in market risk sensitive instruments as a result of adverse changes in specified market factors, at a specified confidence level over a defined holding period.

Notes to the consolidated financial statements 43
Notes to the consolidated financial statements
In Nokia the FX VaR is calculated with the Monte Carlo method which simulates random values for exchange rates in which the Group has exposures and takes the non-linear price function of certain FX derivative instruments into account. The variance-covariance methodology is used to assess and measure the interest rate risk and equity price risk.
The VaR is determined by using volatilities and correlations of rates and prices estimated from a one-year sample of historical market data, at 95% confidence level, using a one-month holding period. To put more weight on recent market conditions, an exponentially weighted moving average is performed on the data with an appropriate decay factor.
This model implies that within a one-month period, the potential loss will not exceed the VaR estimate in 95% of possible outcomes. In the remaining 5% of pos-sible outcomes, the potential loss will be at minimum equal to the VaR figure, and on average substantially higher.
The VaR methodology relies on a number of assumptions, such as, a) risks are measured under average market conditions, assuming that market risk factors follow normal distributions; b) future movements in market risk factors follow estimated historical movements; c) the assessed exposures do not change during the holding period. Thus it is possible that, for any given month, the potential losses at 95% confidence level are different and could be substantially higher than the estimated VaR.
FX risk
The VaR figures for the Group’s financial instruments which are sensitive to foreign exchange risks are presented in Table 1 below. As defined under IFRS 7, the financial instruments included in the VaR calculation are:
» FX exposures from outstanding balance sheet items and other FX derivatives carried at fair value through profit and loss which are not in a hedge relation-ship and are mostly used for hedging balance sheet FX exposure.
» FX derivatives designated as forecasted cashflow hedges and net investment hedges. Most of the VaR is caused by these derivatives as forecasted cashflow and net investment exposures are not financial instruments as defined under IFRS 7 and thus not included in the VaR calculation.
Table 1 Foreign exchange position Value-at-Risk
VaR from financial instruments
2008 2007
At December 31 442 246
Average for the year 337 96
Range for the year 191–730 57–246
Interest rate risk
The VaR for the Group interest rate exposure in the investment and debt portfolios is presented in Table 2 below. Sensitivities to credit spreads are not reflected in the below numbers.
Table 2 Fixed income investment and debt portfolios Value-at-Risk
2008 2007
At December 31 6 8
Average for the year 10 12
Range for the year 4–25 5–27
Equity price risk
The VaR for the Group equity investment in publicly traded companies is insignifi-cant.
b) Credit risk
Credit risk refers to the risk that a counterparty will default on its contractual obli-gations resulting in financial loss to the Group. Credit risk arises from bank and cash, fixed income and money-market investments, derivative financial instruments, loans receivable as well as credit exposures to customers, including outstanding re-ceivables, financial guarantees and committed transactions. Credit risk is managed separately for business related- and financial-credit exposures.
Except as detailed in the following table, the maximum exposure to credit risk is limited to the book value of the financial assets as included in Group’s balance sheet:
EURm 2008 2007
Financial guarantees given on behalf of customers and other third parties 2 130
Loan commitments given but not used 197 270
199 400
Business related credit risk
The Company aims to ensure highest possible quality in accounts receivable and loans due from customers and other third parties. The Group Credit Policy, approved by the Group Executive Board, lays out the framework for the management of the business related credit risks in all Nokia group companies.
Credit exposure is measured as the total of accounts receivable and loans out-standing due from customers and other third parties, plus committed credits.
The Group Credit Policy provides that credit decisions are based on credit evaluation of third parties including credit rating for our customers. The Group Rat-ing Policy defines the rating principles. Ratings are approved by the Group Rating Committee. Credit risks are approved and monitored according to the credit policy of each business segment. These policies are based on the Group Credit Policy. Concentrations of customer or country risks are monitored at the Nokia Group level. When appropriate, assumed credit risks are mitigated with the use of approved instruments, such as collateral or insurance and sale of selected receivables.
The Group has provided impairment allowances as needed including on ac-counts receivable and loans due from customers and other third parties not past due, based on the analysis of debtors’ credit quality and credit history. The Group establishes an allowance for impairment that represents an estimate of incurred losses. All receivables and loans due from customers and other third parties are considered on an individual basis for impairment testing.
Top three customers account for approximately 4.0%, 3.8% and 3.5% (2007: 4.9%, 2.9% and 2.5%) of Group accounts receivable and loans due from customers and other third parties as at December 31, 2008 while the top three credit exposures by country amounted to 8.5%, 7.2% and 7.2% (2007: 8.7%, 6.9% and 6.5%) respec-tively.
As at December 31, 2008, the carrying amount before deducting any impair-ment allowance of accounts receivable relating to customers for which an impair-ment was provided amounted to EUR 3 042 million (2007: EUR 3 011 million). The amount of provision taken against that portion of these receivables considered to be impaired was EUR 415 million (2007: EUR 332 million) (see also note 19 Valuation and qualifying accounts).
An amount of EUR 729 million (2007: EUR 478 million) relates to past due receiv-ables from customers for which no impairment loss was recognized. The aging of these receivables is as follows:

44 Nokia in 2008
Notes to the consolidated financial statements
0
1 000
2 000
3 000
4 000
5 000
6 000
7 000
8 000
Baa1–Baa3
P-1
A1–A3
Aa1–Aa3
Aaa
EURm 2008 2007
Past due 1–30 days 453 411
Past due 31–180 days 240 66
More than 180 days 36 1
729 478
As at December 31, 2008, the carrying amount before deducting any impairment allowance of loans due from customers and other third parties for which impair-ment was provided amounted to EUR 4 million (2007: EUR 161 million). The amount of provision taken for these loans was EUR 4 million (2007: EUR 19 million).
There were no past due loans due from customers and other third parties.
Financial credit risk
Financial instruments contain an element of risk of loss resulting from counterpar-ties being unable to meet their obligations. This risk is measured and monitored centrally. Nokia manages financial credit risk actively by limiting its counterparties to a sufficient number of major banks and financial institutions and monitoring the credit worthiness and exposure sizes continuously as well as through entering into netting arrangements (which gives Nokia the right to offset in the event that the counterparty would not be able to fulfill the obligations) with all major counter-parties and collateral agreements (which require counterparties to post collateral against derivative receivables) with certain counterparties.
Nokia’s investment decisions are based on strict creditworthiness and maturity criteria as defined in the Treasury Policy and Operating Procedure. Due to global
1 Fixed income and money-market investments include term deposits, investments in liquidity funds and invest-ments in fixed income instruments classified as Available-for-sale. Available-for-sale investments are carried at fair value in 2008 and 2007. Liquidity funds invested solely in government securities are included under Govern-ments. Other liquidity funds are included under Banks.
2 Included within fixed income and money-market investments is EUR 114 million of restricted investment at December 31, 2008 (EUR 169 million at December 31, 2007). They are restricted financial assets under various contractual or legal obligations.
78% of Nokia’s bank and cash is held with banks of credit rating A2 or above (76% for 2007).
banking crisis and the freezing of the credit markets in 2008, Nokia applied an even more defensive approach than usual within Treasury Policy towards investments and counterparty quality and maturities, focusing on capital preservation and liquidity. As result of this investment policy approach and active management of outstanding investments exposures, Nokia has not been subject to any material credit losses in its financial investments.
The table below presents the breakdown of the outstanding available-for-sale fixed income and money-market investments by sector and credit rating grades ranked as per Moody’s rating categories.
Fixed income and money-market investments 1, 2
EURm
2007 2008 2007 2008 2007 2008 2007 2008
Banks Corporates Governments ABS
Notes to the consolidated financial statements 45
Notes to the consolidated financial statements
c) Liquidity risk
Liquidity risk is defined as financial distress or extraordinary high financing costs arising due to a shortage of liquid funds in a situation where business conditions unexpectedly deteriorate and require financing. Transactional liquidity risk is de-fined as the risk of executing a financial transaction below fair market value, or not being able to execute the transaction at all, within a specific period of time.
The objective of liquidity risk management is to maintain sufficient liquidity, and to ensure that it is available fast enough without endangering its value, in order to avoid uncertainty related to financial distress at all times.
Nokia guarantees a sufficient liquidity at all times by efficient cash manage-ment and by investing in liquid interest bearing securities. The transactional liquid-ity risk is minimized by only entering transactions where proper two-way quotes can be obtained from the market. Due to the dynamic nature of the underlying busi-ness, Nokia also aims at maintaining flexibility in funding by keeping committed and uncommitted credit lines available. At the end of December 31, 2008 the com-mitted facilities totaled EUR 3 369 million. The committed revolving credit facilities are used primarily for US and Euro Commercial Paper Programs back-up purposes. The credit facility of EUR 500 million has been utilized for general funding purposes. The average commitment fee on the facilities is 0.082% per annum.
The most significant existing Committed Facilities include:
» Revolving Credit Facility of USD 2 000 million, maturing in 2009
» Credit Facility of EUR 500 million, maturing in 2011
» Revolving Credit Facility of USD 1 923 million, maturing in 2012
The most significant existing funding programs include:
» Euro Medium Term Note (EMTN) program, totaling EUR 3 000 million
» Shelf registration statement for an indeterminate amount of debt securities on file with the US Securities and Exchange Commission
» Local commercial paper program in Finland, totaling EUR 750 million
» Euro Commercial Paper (ECP) program, totaling USD 4 000 million
» US Commercial Paper (USCP) program, totaling USD 4 000 million
Of the above funding programs, only the US Commercial Paper program has been utilized to a significant degree in 2008. On December 31, 2008 a total of USD 3 419
million was outstanding under this program. The remaining four funding programs have not been used to a significant degree in 2008.
Nokia’s international creditworthiness facilitates the efficient use of interna-tional capital and loan markets. The ratings of Nokia from credit rating agencies have not changed during the year. The ratings as of December 31, 2008 were:
Short-term Standard & Poor’s A-1
Moody’s P-1
Long-term Standard & Poor’s A
Moody’s A1
The following table below is an undiscounted cashflow analysis for both financial liabilities and financial assets that are presented on the balance sheet, and off-balance sheet instruments such as loan commitments according to their remain-ing contractual maturity. Line-by-line reconciliation with the balance sheet is not possible.

46 Nokia in 2008
Notes to the consolidated financial statements
Due within Due between Due between Due between Due beyond 3 3 and 12 1 and 3 3 and 5 5At December 31, 2008, EURm months months years years years
Non-current financial assets
Long-term loans receivable — — 19 6 8
Other non-current assets 1 1 3 — 1
Loan commitments obtained undrawn — — 50 362 —
Current financial assets
Current portion of long-term loans receivable 5 101 — — —
Short-term loans receivable 8 2 — — —
Available-for-sale investment 3 932 483 583 120 254
Cash 1 706 — — — —
Cash flows related to derivative financial assets net settled:
Derivative contracts-receipts 5 3 1 — —
Cash flows related to derivative financial assets gross settled:
Derivative contracts-receipts 19 180 5 184 — — —
Derivative contracts-payments – 18 322 – 5 090 — — —
Accounts receivable 1, 2 6 702 1 144 70 — —
Non-current financial liabilities
Long-term liabilities – 1 – 46 – 741 – 64 – 159
Loan commitments given undrawn – 16 – 151 — – 30 —
Current financial liabilities
Currrent portion of long-term loans — – 14 — — —
Short-term liabilities – 3 207 – 388 — — —
Cash flows related to derivative financial liabilities net settled:
Derivative contracts-payments — — — — —
Cash flows related to derivative financial liabilities gross settled:
Derivative contracts-receipts 15 729 4 859 — — —
Derivative contracts-payments – 16 599 – 4 931 — — —
Accounts payable 1 – 5 152 – 67 – 5 — —

Notes to the consolidated financial statements 47
Notes to the consolidated financial statements
Due within Due between Due between Due between Due beyond 3 3 and 12 1 and 3 3 and 5 5At December 31, 2007, EURm months months years years years
Non-current financial assets
Long-term loans receivable — — 7 3 1
Other non-current assets — — 6 — —
Loan commitments obtained undrawn — 1 385 500 1 385 —
Current financial assets
Current portion of long-term loans receivable 5 165 — — —
Short-term loans receivable 16 8 — — —
Available-for-sale investment 6 543 1 012 2 003 343 355
Cash 2 125 — — — —
Cash flows related to derivative financial assets net settled:
Derivative contracts–receipts 24 15 8 1 1
Cash flows related to derivative financial assets gross settled:
Derivative contracts–receipts 19 459 394 65 — —
Derivative contracts–payments – 19 331 – 384 – 69 — —
Accounts receivable 1, 2 7 398 1 720 381 — —
Non-current financial liabilities
Long-term liabilities – 10 – 3 – 53 – 130 – 70
Loan commitments given – 178 – 39 – 21 – 18 – 14
Current financial liabilities
Currrent portion of long-term loans – 115 – 61 — — —
Short-term liabilities – 617 – 105 — — —
Cash flows related to derivative financial liabilities net settled:
Derivative contracts–payments – 13 – 10 — — —
Cash flows related to derivative financial liabilities gross settled:
Derivative contracts–receipts 16 207 635 70 — —
Derivative contracts –payments – 16 317 – 633 – 65 — —
Accounts payable 1 – 6 986 – 88 — — —
1 The fair values of trade receivables and payables are assumed to approximate their carrying values due to their short term nature.
2 Accounts receivable maturity analysis does not include accrued receivables and receivables accounted based on the percentage of completion method of EUR 1 528 million (2007: EUR 1 700 million).
Hazard risk
Nokia strives to ensure that all financial, reputation and other losses to the Group and our customers are minimized through preventive risk management measures or purchase of insurance. Insurance is purchased for risks, which cannot be inter-nally managed. The objective is to ensure that Group’s hazard risks, whether related to physical assets (e.g. buildings) or intellectual assets (e.g. Nokia) or potential liabilities (e.g. product liability) are optimally insured taking into account both cost and retention levels.
Nokia purchases both annual insurance policies for specific risks as well as multi-line and/or multi-year insurance policies, where available.

48 Nokia in 2008
2008 2007Financial year ended December 31 Notes EURm EURm
Net sales 26 940 30 907
Cost of sales – 18 712 – 20 995
Gross margin 8 228 9 912
Selling and marketing expenses – 1 393 – 1 328
Research and development expenses – 3 147 – 2 894
Administrative expenses – 769 – 566
Other operating expenses – 340 – 195
Other operating income 120 139
Operating profit 2, 3 2 699 5 068
Financial income and expenses
Income from long-term investments
Dividend income from Group companies 31 2 585
Dividend income from other companies 3 3
Interest income from Group companies 4 3
Other interest and financial income
Interest income from Group companies 398 250
Interest income from other companies 12 7
Other financial income from other companies — 1
Exchange gains and losses – 478 – 22
Interest expenses and other financial expenses
Interest expenses to Group companies – 338 – 168
Interest expenses to other companies – 63 – 19
Other financial expenses – 6 – 2
Financial income and expenses, total – 437 2 638
Profit before extraordinary items and taxes 2 262 7 706
Extraordinary items
Group contributions 40 —
Extraordinary items, total 40 —
Profit before taxes 2 302 7 706
Income taxes
for the year – 539 – 1 314
from previous years – 14 – 34Net profit 1 749 6 358
See Notes to the financial statements of the parent company.
2008 2007December 31 Notes EURm EURm
A S S E T S
Fixed assets and other non-current assets
Intangible assets 4
Capitalized development costs 21 106
Intangible rights 52 48
Other long-term expenses 155 4
228 158
Tangible assets 5 — —
Investments
Investments in subsidiaries 6 12 084 6 564
Investments in associated companies 6 10 9
Long-term loan receivables from Group companies 8 9
Other non-current assets 6 41 4
12 143 6 586
Current assets
Inventories and work in progress
Raw materials and supplies 84 72
Work in progress 100 294
Finished goods 70 72
254 438
Receivables
Trade debtors from Group companies 899 958
Trade debtors from other companies 913 1 405
Short-term loan receivables from Group companies 12 039 8 219
Short-term loan receivables from other companies 1 40
Prepaid expenses and accrued income from Group companies 65 1 942
Prepaid expenses and accrued income from other companies 2 181 1 372
16 098 13 936
Bank and cash 197 212Total 28 920 21 330
See Notes to the financial statements of the parent company.
Profit and loss accounts, parent company, FAS
Parent company financial statementsaccording to Finnish Accounting Standards
Balance sheets, parent company, FAS
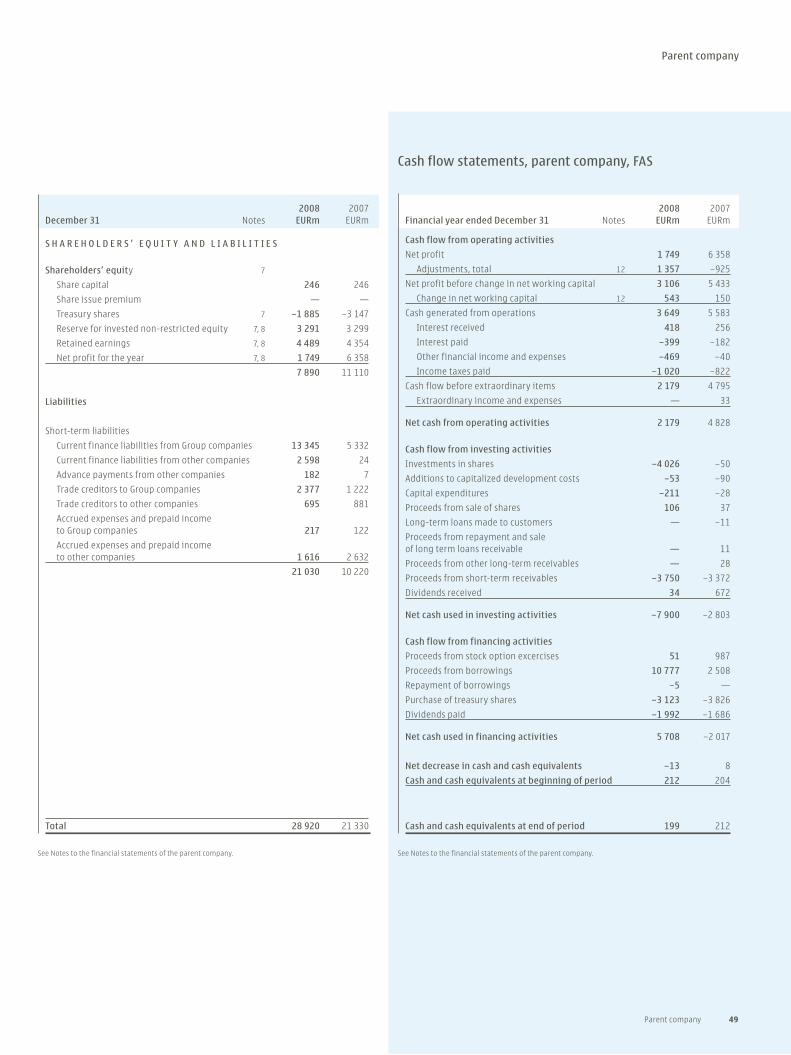
Parent company 49
Parent company
2008 2007December 31 Notes EURm EURm
S H A R E H O L D E R S ’ E Q U I T Y A N D L I A B I L I T I E S
Shareholders’ equity 7
Share capital 246 246
Share issue premium — —
Treasury shares 7 – 1 885 – 3 147
Reserve for invested non-restricted equity 7, 8 3 291 3 299
Retained earnings 7, 8 4 489 4 354
Net profit for the year 7, 8 1 749 6 358
7 890 11 110
Liabilities
Short-term liabilities
Current finance liabilities from Group companies 13 345 5 332
Current finance liabilities from other companies 2 598 24
Advance payments from other companies 182 7
Trade creditors to Group companies 2 377 1 222
Trade creditors to other companies 695 881
Accrued expenses and prepaid income to Group companies 217 122
Accrued expenses and prepaid income to other companies 1 616 2 632
21 030 10 220
Total 28 920 21 330
See Notes to the financial statements of the parent company.
2008 2007Financial year ended December 31 Notes EURm EURm
Cash flow from operating activities
Net profit 1 749 6 358
Adjustments, total 12 1 357 – 925
Net profit before change in net working capital 3 106 5 433
Change in net working capital 12 543 150
Cash generated from operations 3 649 5 583
Interest received 418 256
Interest paid – 399 – 182
Other financial income and expenses – 469 – 40
Income taxes paid – 1 020 – 822
Cash flow before extraordinary items 2 179 4 795
Extraordinary income and expenses — 33
Net cash from operating activities 2 179 4 828
Cash flow from investing activities
Investments in shares – 4 026 – 50
Additions to capitalized development costs – 53 – 90
Capital expenditures – 211 – 28
Proceeds from sale of shares 106 37
Long-term loans made to customers — – 11
Proceeds from repayment and sale of long term loans receivable — 11
Proceeds from other long-term receivables — 28
Proceeds from short-term receivables – 3 750 – 3 372
Dividends received 34 672
Net cash used in investing activities – 7 900 – 2 803
Cash flow from financing activities
Proceeds from stock option excercises 51 987
Proceeds from borrowings 10 777 2 508
Repayment of borrowings – 5 —
Purchase of treasury shares – 3 123 – 3 826
Dividends paid – 1 992 – 1 686
Net cash used in financing activities 5 708 – 2 017
Net decrease in cash and cash equivalents – 13 8
Cash and cash equivalents at beginning of period 212 204
Cash and cash equivalents at end of period 199 212
See Notes to the financial statements of the parent company.
Cash flow statements, parent company, FAS
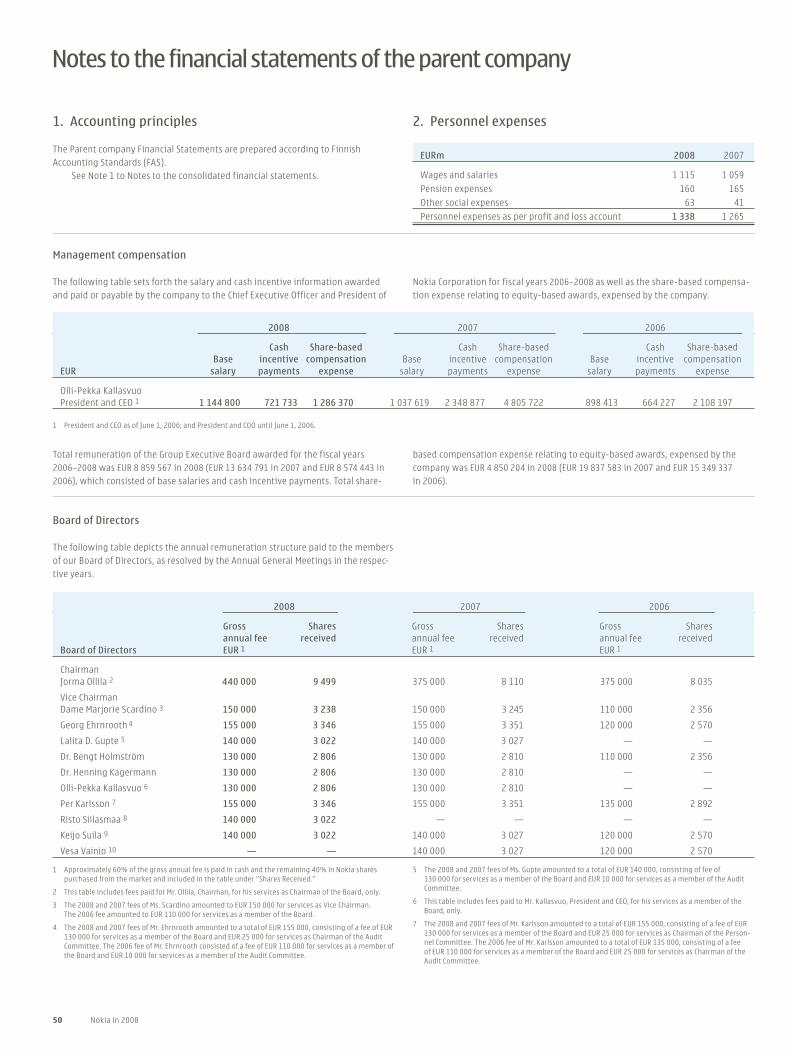
50 Nokia in 2008
1. Accounting principles
The Parent company Financial Statements are prepared according to Finnish Accounting Standards (FAS).
See Note 1 to Notes to the consolidated financial statements.
Management compensation
The following table sets forth the salary and cash incentive information awarded and paid or payable by the company to the Chief Executive Officer and President of
2008 2007 2006
Cash Share-based Cash Share-based Cash Share-based Base incentive compensation Base incentive compensation Base incentive compensationEUR salary payments expense salary payments expense salary payments expense
Olli-Pekka KallasvuoPresident and CEO 1 1 144 800 721 733 1 286 370 1 037 619 2 348 877 4 805 722 898 413 664 227 2 108 197
1 President and CEO as of June 1, 2006; and President and COO until June 1, 2006.
Total remuneration of the Group Executive Board awarded for the fiscal years 2006 –2008 was EUR 8 859 567 in 2008 (EUR 13 634 791 in 2007 and EUR 8 574 443 in 2006), which consisted of base salaries and cash incentive payments. Total share-
based compensation expense relating to equity-based awards, expensed by the company was EUR 4 850 204 in 2008 (EUR 19 837 583 in 2007 and EUR 15 349 337 in 2006).
Notes to the financial statements of the parent company
Board of Directors
The following table depicts the annual remuneration structure paid to the members of our Board of Directors, as resolved by the Annual General Meetings in the respec-tive years.
2008 2007 2006
Gross Shares Gross Shares Gross Shares annual fee received annual fee received annual fee receivedBoard of Directors EUR 1 EUR 1 EUR 1
ChairmanJorma Ollila 2 440 000 9 499 375 000 8 110 375 000 8 035
Vice ChairmanDame Marjorie Scardino 3 150 000 3 238 150 000 3 245 110 000 2 356
Georg Ehrnrooth 4 155 000 3 346 155 000 3 351 120 000 2 570
Lalita D. Gupte 5 140 000 3 022 140 000 3 027 — —
Dr. Bengt Holmström 130 000 2 806 130 000 2 810 110 000 2 356
Dr. Henning Kagermann 130 000 2 806 130 000 2 810 — —
Olli-Pekka Kallasvuo 6 130 000 2 806 130 000 2 810 — —
Per Karlsson 7 155 000 3 346 155 000 3 351 135 000 2 892
Risto Siilasmaa 8 140 000 3 022 — — — —
Keijo Suila 9 140 000 3 022 140 000 3 027 120 000 2 570
Vesa Vainio 10 — — 140 000 3 027 120 000 2 570
1 Approximately 60% of the gross annual fee is paid in cash and the remaining 40% in Nokia shares purchased from the market and included in the table under “Shares Received.”
2 This table includes fees paid for Mr. Ollila, Chairman, for his services as Chairman of the Board, only.
3 The 2008 and 2007 fees of Ms. Scardino amounted to EUR 150 000 for services as Vice Chairman. The 2006 fee amounted to EUR 110 000 for services as a member of the Board.
4 The 2008 and 2007 fees of Mr. Ehrnrooth amounted to a total of EUR 155 000, consisting of a fee of EUR 130 000 for services as a member of the Board and EUR 25 000 for services as Chairman of the Audit Committee. The 2006 fee of Mr. Ehrnrooth consisted of a fee of EUR 110 000 for services as a member of the Board and EUR 10 000 for services as a member of the Audit Committee.
5 The 2008 and 2007 fees of Ms. Gupte amounted to a total of EUR 140 000, consisting of fee of 130 000 for services as a member of the Board and EUR 10 000 for services as a member of the Audit Committee.
6 This table includes fees paid to Mr. Kallasvuo, President and CEO, for his services as a member of the Board, only.
7 The 2008 and 2007 fees of Mr. Karlsson amounted to a total of EUR 155 000, consisting of a fee of EUR 130 000 for services as a member of the Board and EUR 25 000 for services as Chairman of the Person-nel Committee. The 2006 fee of Mr. Karlsson amounted to a total of EUR 135 000, consisting of a fee of EUR 110 000 for services as a member of the Board and EUR 25 000 for services as Chairman of the Audit Committee.
Nokia Corporation for fiscal years 2006–2008 as well as the share-based compensa-tion expense relating to equity-based awards, expensed by the company.
2. Personnel expenses
EURm 2008 2007
Wages and salaries 1 115 1 059
Pension expenses 160 165
Other social expenses 63 41
Personnel expenses as per profit and loss account 1 338 1 265

Notes to the financial statements of the parent company 51
Notes to the financial statements of the parent company
8 The 2008 fee of Mr. Siilasmaa amounted to a total of EUR 140 000, consisting of fee of 130 000 for services as a member of the Board and EUR 10 000 for services as a member of the Audit Committee.
9 The 2008 and 2007 fees of Mr. Suila amounted to a total of EUR 140 000, consisting of a fee of EUR 130 000 for services as a member of the Board and EUR 10 000 for services as a member of the Audit Committee. The 2006 fee of Mr. Suila amounted to a total of EUR 120 000, consisting of a fee of EUR 110 000 for services as a member of the Board and EUR 10 000 for services as a member of the Audit Committee.
10 Mr. Vainio was a member of the Board of Directors and the Audit Committee until the end of the Annual General Meeting on May 8, 2008. Mr. Vainio received his fees for services as a member of the Board and as a member of the Audit Committee, as resolved by the shareholders at the Annual General Meeting on May 3, 2007, already in 2007 and thus no fees were paid to him for the services rendered during 2008. The 2007 fee of Mr.Vainio amounted to a total of EUR 140 000 consisting of a fee of EUR 130 000 for services as a member of the Board and EUR 10 000 for services as a member of the Audit Committee. The 2006 fee of Mr. Vainio amounted to a total of EUR 120 000, consisting of a fee of EUR 110 000 for services as a member of the Board and EUR 10 000 for services as a member of the Audit Committee.
Pension arrangements of certain Group Executive Board Members
Olli-Pekka Kallasvuo can, as part of his service contract, retire at the age of 60 with full retirement benefit should he be employed by Nokia at the time. The full retire-ment benefit is calculated as if Mr. Kallasvuo had continued his service with Nokia through the retirement age of 65. Hallstein Moerk, following his arrangement with a previous employer, has also in his current position at Nokia a retirement benefit of 65% of his pensionable salary beginning at the age of 62. Early retirement is possible at the age of 55 with reduced benefits. Simon Beresford-Wylie participates in the Nokia International Employee Benefit Plan (NIEBP). The NIEBP is a defined contribution retirement arrangement provided to some Nokia employees on inter-national assignments. The contributions to NIEBP are funded two-thirds by Nokia and one-third by the employee. Because Mr. Beresford-Wylie also participates in the Finnish TEL system, the company contribution to NIEBP is 1.3% of annual earnings.
Personnel average 2008 2007
Production 3 481 3 965
Marketing 1 226 1 187
R&D 8 717 9 732
Administration 2 552 2 580
15 976 17 464
Personnel, December 31 16 262 15 070
3. Depreciation and amortization
EURm 2008 2007
Depreciation and amortization by asset class category
Intangible assets
Capitalized development costs 28 55
Intangible rights 28 28
Tangible assets 28 2
Total 84 85
Depreciation and amortization by function
R&D 54 67
Production 1 1
Selling, marketing and administration 29 17
Total 84 85
4. Intangible assets
EURm 2008 2007
Capitalized development costs
Acquisition cost January 1 358 1 605
Additions during the period 53 90
Disposals during the period – 124 – 1 337
Accumulated acquisition cost December 31 287 358
Accumulated amortization January 1 – 252 – 1 355
Disposals during the period 14 1 158
Amortization during the period – 28 – 55
Accumulated amortization December 31 – 266 – 252
Net book value January 1 106 250
Net book value December 31 21 106
Intangible rights
Acquisition cost January 1 259 310
Additions during the period 32 25
Disposals during the period – 5 – 76
Accumulated acquisition cost December 31 286 259
Accumulated amortization January 1 – 211 – 249
Disposals during the period 5 67
Amortization during the period – 28 – 29
Accumulated amortization December 31 – 234 – 211
Net book value January 1 48 61
Net book value December 31 52 48
Other intangible assets
Acquisition cost January 1 6 8
Additions during the period 179 4
Disposals during the period — – 6
Accumulated acquisition cost December 31 185 6
Accumulated amortization January 1 – 2 – 3
Disposals during the period — 3
Amortization during the period – 28 – 2
Accumulated amortization December 31 – 30 – 2
Net book value January 1 4 5
Net book value December 31 155 4
5. Tangible assets
At the end of 2008 and 2007 the parent company had no tangible assets. These assets were leased from Nokia Asset Management Oy, a company wholly owned by Nokia Corporation.

52 Nokia in 2008
Notes to the financial statements of the parent company
7. Shareholders' equity
Reserve for invested Share non- Share issue Treasury restricted RetainedParent company, EURm capital premium shares equity earnings Total
Balance at January 1, 2006 266 2 246 – 3 614 — 8 529 7 427
Share issue 46 46
Cancellation of treasury shares – 20 20 4 927 – 4 927 —
Acquisitions of treasury shares – 3 404 – 3 404
Settlement of performance shares 37 37
Dividend – 1 512 – 1 512
Net profit 6 683 6 683
Balance at December 31, 2006 246 2 312 – 2 054 — 8 773 9 277
Share issue 46 46
Cancellation of treasury shares 2 733 – 2 733 —
Acquisitions of treasury shares – 3 884 – 3 884
Settlement of performance shares 58 58
Reserve for invested non-restricted equity – 2 358 3 299 941
Dividend – 1 686 – 1 686
Net profit 6 358 6 358
Balance at December 31, 2007 246 — – 3 147 3 299 10 712 11 110
Stock options exersiced 51 51
Cancellation of treasury shares 4 231 – 4 231 —
Acquisitions of treasury shares – 3 123 – 3 123
Settlement of performance shares 154 – 59 95
Dividend – 1 992 – 1 992
Net profit 1 749 1 749
Balance at December 31, 2008 246 — – 1 885 3 291 6 238 7 890
6. Investments
EURm 2008 2007
Investments in subsidiaries
Acquisition cost January 1 6 564 3 682
Additions 5 624 5 454
Disposals – 104 – 2 572
Net carrying amount December 31 12 084 6 564
Investments in associated companies
Acquisition cost January 1 9 6
Additions 1 3
Disposals — —
Net carrying amount December 31 10 9
Investments in other shares
Acquisition cost January 1 4 5
Additions 37 —
Disposals — – 1
Net carrying amount December 31 41 4

8. Distributable earnings
EURm 2008 2007
Reserve for invested non-restricted equity 3 291 3 299
Retained earnings from previous years 4 489 4 354
Net profit for the year 1 749 6 358
Retained earnings, total 9 529 14 011
Treasury shares – 1 885 – 3 147
Distributable earnings, December 31 7 644 10 864
9. Commitments and contingencies
EURm 2008 2007
Contingent liabilities on behalf of Group companies
Guarantees for loans 8 104
Leasing guarantees 171 213
Other guarantees 128 89
Contingent liabilities on behalf of other companies
Guarantees for loans 2 3
10. Leasing contracts
At December 31, 2008 the leasing contracts of the Parent Company amounted to EUR 106 million (EUR 25 million in 2007). EUR 29 million will expire in 2009 (EUR 12 million in 2008).
11. Loans granted to the management of the company
There were no loans granted to the members of the Group Executive Board and Board of Directors at December 31, 2008.
12. Notes to cash flow statements
EURm 2008 2007
Adjustments for:
Depreciation 84 85
Income taxes 553 1 348
Financial income and expenses 437 – 2 638
Impairment of intangible assets 109 177
Impairment of non-current available-for-sale investments — 1
Other operating income and expenses 174 102
Adjustments, total 1 357 –925
Change in net working capital
Short-term trade receivables, increase (–), decrease (+) 1 402 2 856
Inventories, increase (–), decrease (+) 184 102
Interest-free short-term liabilities, increase (+), decrease (–) – 1 043 – 2 808
Change in net working capital 543 150
Notes to the financial statements of the parent company
13. Principal Nokia Group companies on December 31, 2008
See note 34 to Notes to the consolidated financial statements.
14. Nokia shares and shareholders
See Nokia shares and shareholders p. 54– 57.
15. Accrued income
EURm 2008 2007
Taxes 129 —
Other 2 117 3 314
Total 2 246 3 314
16. Accrued expenses
EURm 2008 2007
Personnel expenses 236 207
Taxes — 338
Other 1 597 2 209
Total 1 833 2 754
17. Income tax
EURm 2008 2007
Income tax from operations 528 1 314
Other income tax 11 —
Total 539 1 314
Income taxes are shown separately in the Notes to the financial statements as they have been shown as a one-line item on the face of the profit and loss statement.
Notes to the financial statements of the parent company 53
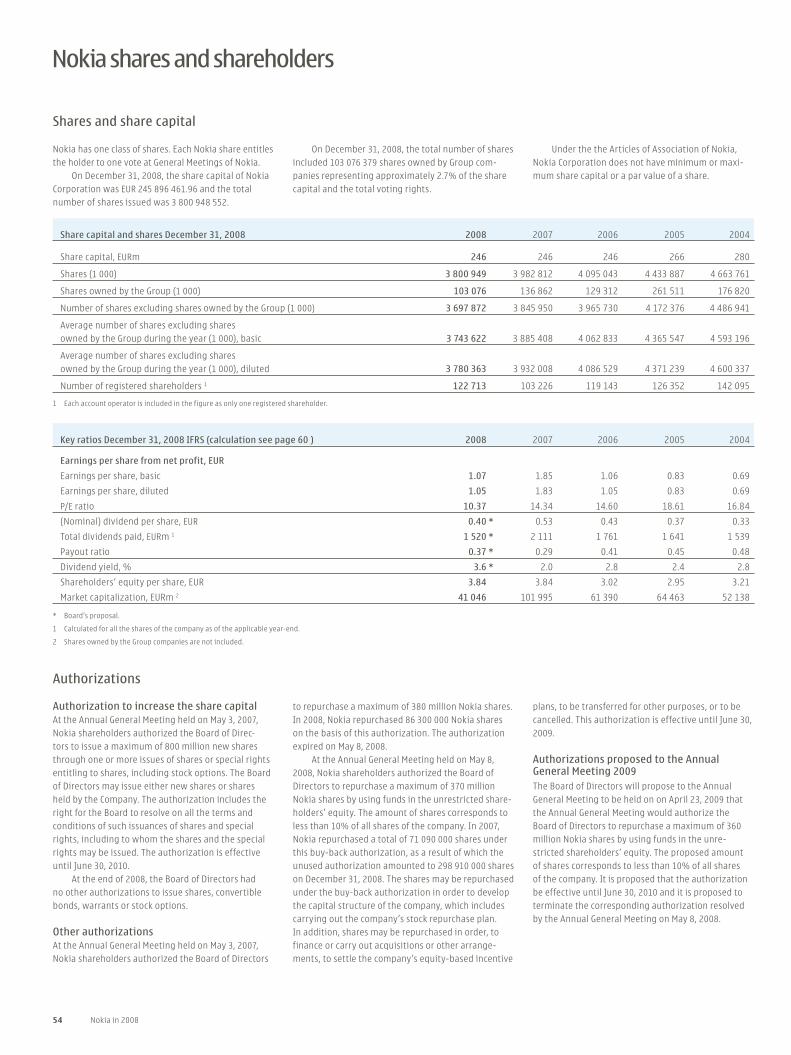
54 Nokia in 2008
Share capital and shares December 31, 2008 2008 2007 2006 2005 2004
Share capital, EURm 246 246 246 266 280
Shares (1 000) 3 800 949 3 982 812 4 095 043 4 433 887 4 663 761
Shares owned by the Group (1 000) 103 076 136 862 129 312 261 511 176 820
Number of shares excluding shares owned by the Group (1 000) 3 697 872 3 845 950 3 965 730 4 172 376 4 486 941
Average number of shares excluding sharesowned by the Group during the year (1 000), basic 3 743 622 3 885 408 4 062 833 4 365 547 4 593 196
Average number of shares excluding sharesowned by the Group during the year (1 000), diluted 3 780 363 3 932 008 4 086 529 4 371 239 4 600 337
Number of registered shareholders 1 122 713 103 226 119 143 126 352 142 095
1 Each account operator is included in the figure as only one registered shareholder.
Key ratios December 31, 2008 IFRS (calculation see page 60 ) 2008 2007 2006 2005 2004
Earnings per share from net profit, EUR
Earnings per share, basic 1.07 1.85 1.06 0.83 0.69
Earnings per share, diluted 1.05 1.83 1.05 0.83 0.69
P/E ratio 10.37 14.34 14.60 18.61 16.84
(Nominal) dividend per share, EUR 0.40 * 0.53 0.43 0.37 0.33
Total dividends paid, EURm 1 1 520 * 2 111 1 761 1 641 1 539
Payout ratio 0.37 * 0.29 0.41 0.45 0.48
Dividend yield, % 3.6 * 2.0 2.8 2.4 2.8
Shareholders’ equity per share, EUR 3.84 3.84 3.02 2.95 3.21
Market capitalization, EURm 2 41 046 101 995 61 390 64 463 52 138
* Board’s proposal.
1 Calculated for all the shares of the company as of the applicable year-end.
2 Shares owned by the Group companies are not included.
Shares and share capital
Nokia has one class of shares. Each Nokia share entitles the holder to one vote at General Meetings of Nokia.
On December 31, 2008, the share capital of Nokia Corporation was EUR 245 896 461.96 and the total number of shares issued was 3 800 948 552.
On December 31, 2008, the total number of shares included 103 076 379 shares owned by Group com-panies representing approximately 2.7% of the share capital and the total voting rights.
Nokia shares and shareholders
Under the the Articles of Association of Nokia, Nokia Corporation does not have minimum or maxi-mum share capital or a par value of a share.
Authorizations
Authorization to increase the share capitalAt the Annual General Meeting held on May 3, 2007, Nokia shareholders authorized the Board of Direc-tors to issue a maximum of 800 million new shares through one or more issues of shares or special rights entitling to shares, including stock options. The Board of Directors may issue either new shares or shares held by the Company. The authorization includes the right for the Board to resolve on all the terms and conditions of such issuances of shares and special rights, including to whom the shares and the special rights may be issued. The authorization is effective until June 30, 2010.
At the end of 2008, the Board of Directors had no other authorizations to issue shares, convertible bonds, warrants or stock options.
Other authorizationsAt the Annual General Meeting held on May 3, 2007, Nokia shareholders authorized the Board of Directors
to repurchase a maximum of 380 million Nokia shares. In 2008, Nokia repurchased 86 300 000 Nokia shares on the basis of this authorization. The authorization expired on May 8, 2008.
At the Annual General Meeting held on May 8, 2008, Nokia shareholders authorized the Board of Directors to repurchase a maximum of 370 million Nokia shares by using funds in the unrestricted share-holders’ equity. The amount of shares corresponds to less than 10% of all shares of the company. In 2007, Nokia repurchased a total of 71 090 000 shares under this buy-back authorization, as a result of which the unused authorization amounted to 298 910 000 shares on December 31, 2008. The shares may be repurchased under the buy-back authorization in order to develop the capital structure of the company, which includes carrying out the company’s stock repurchase plan. In addition, shares may be repurchased in order, to finance or carry out acquisitions or other arrange-ments, to settle the company’s equity-based incentive
plans, to be transferred for other purposes, or to be cancelled. This authorization is effective until June 30, 2009.
Authorizations proposed to the Annual General Meeting 2009The Board of Directors will propose to the Annual General Meeting to be held on on April 23, 2009 that the Annual General Meeting would authorize the Board of Directors to repurchase a maximum of 360 million Nokia shares by using funds in the unre-stricted shareholders’ equity. The proposed amount of shares corresponds to less than 10% of all shares of the company. It is proposed that the authorization be effective until June 30, 2010 and it is proposed to terminate the corresponding authorization resolved by the Annual General Meeting on May 8, 2008.

Nokia shares and shareholders 55
Nokia shares and shareholders
Share and bonus issues 2004–2008
Subscription price or Number of Net New share amount of bonus issue new shares Date of proceeds capitalYear Type of Issue EUR (1 000) payment EURm EURm
2004 Nokia Stock Option Plan 1999 (A) 16.89 5 2004 0.09 0.00
Total 5 0.09 0.00
2005 Nokia Stock Option Plan 2003 2Q 14.95 61 2005 0.91 0.00
Nokia Stock Option Plan 2003 3Q 12.71 6 2005 0.08 0.00
Nokia Stock Option Plan 2004 2Q 11.79 55 2005 0.65 0.00
Nokia Stock Option Plan 2004 3Q 9.44 3 2005 0.02 0.00
Total 125 1.66 0.01
2006 Nokia Stock Option Plan 2003 2Q 14.95 2 287 2006 34.19 0.14
Nokia Stock Option Plan 2003 3Q 12.71 32 2006 0.41 0.00
Nokia Stock Option Plan 2003 4Q 15.05 3 2006 0.05 0.00
Nokia Stock Option Plan 2004 2Q 11.79 523 2006 6.16 0.03
Nokia Stock Option Plan 2004 3Q 9.44 9 2006 0.08 0.00
Nokia Stock Option Plan 2004 4Q 12.35 17 2006 0.21 0.00
Nokia Stock Option Plan 2005 2Q 12.79 174 2006 2.22 0.01
Nokia Stock Option Plan 2005 3Q 13.09 2 2006 0.03 0.00
Total 3 047 43.34 0.18
2007 Nokia Stock Option Plan 2002 A/B 17.89 43 513 2007 778.00
Nokia Stock Option Plan 2001C 1Q/02 26.06 17 2007 0.44
Nokia Stock Option Plan 2001C 3Q/02 12.99 243 2007 3.00
Nokia Stock Option Plan 2001C 4Q/02 16.86 49 2007 0.83
Nokia Stock Option Plan 2003 2Q 14.95 9 683 2007 145.00 0.15
Nokia Stock Option Plan 2003 3Q 12.71 53 2007 0.67
Nokia Stock Option Plan 2003 4Q 15.05 48 2007 0.72
Nokia Stock Option Plan 2004 2Q 11.79 1 569 2007 18.00 0.03
Nokia Stock Option Plan 2004 3Q 9.44 30 2007 0.29
Nokia Stock Option Plan 2004 4Q 12.35 25 2007 0.30
Nokia Stock Option Plan 2005 2Q 12.79 1 350 2007 17.00 0.02
Nokia Stock Option Plan 2005 3Q 13.09 4 2007 0.06
Nokia Stock Option Plan 2005 4Q 14.48 13 2007 0.19
Nokia Stock Option Plan 2006 1Q 14.99 13 2007 0.19
Nokia Stock Option Plan 2006 2Q 18.02 631 2007 11.00
Nokia Stock Option Plan 2006 3Q 15.37 7 2007 0.12
Total 57 248 975.81 0.20
2008 Nokia Stock Option Plan 2003 2Q 14.95 2 444 2008 36.53
Nokia Stock Option Plan 2003 3Q 12.71 11 2008 0.15
Nokia Stock Option Plan 2003 4Q 15.05 82 2008 1.24
Nokia Stock Option Plan 2004 2Q 11.79 415 2008 4.90
Nokia Stock Option Plan 2004 3Q 9.44 5 2008 0.05
Nokia Stock Option Plan 2004 4Q 12.35 13 2008 0.16
Nokia Stock Option Plan 2005 2Q 12.79 361 2008 4.62
Nokia Stock Option Plan 2005 3Q 13.09 5 2008 0.07
Nokia Stock Option Plan 2005 4Q 14.48 0 2008 0.00
Nokia Stock Option Plan 2006 1Q 14.99 1 2008 0.01
Nokia Stock Option Plan 2006 2Q 18.02 192 2008 3.46
Nokia Stock Option Plan 2006 3Q 15.37 11 2008 0.17
Nokia Stock Option Plan 2006 4Q 15.38 6 2008 0.09
Nokia Stock Option Plan 2007 1Q 17.00 0 2008 0.00
Nokia Stock Option Plan 2007 2Q 18.39 0 2008 0.00
Nokia Stock Option Plan 2007 3Q 21.86 0 2008 0.00
Total 3 546 51.45

56 Nokia in 2008
Nokia shares and shareholders
Reductions of share capital
Amount of Amount of Amount of Number of reduction of the reduction of the reduction of the shares share capital restricted capital retained earningsType of reduction Year (1 000) EURm EURm EURm
Cancellation of shares 2004 132 536 7.95 — —
Cancellation of shares 2005 230 000 13.80 — —
Cancellation of shares 2006 341 890 20.51 — —
Cancellation of shares 2007 169 500 — — —
Cancellation of shares 2008 185 410 — — —
Share turnover (all stock exchanges)
2008 2007 2006 2005 2004
Share turnover (1 000) 12 962 489 12 695 999 12 480 730 12 977 232 14 091 430
Total number of shares (1 000) 3 800 949 3 982 812 4 095 043 4 433 887 4 663 761
% of total number of shares 341 319 305 293 302
Share prices, EUR (NASDAQ OMX Helsinki)
2008 2007 2006 2005 2004
Low/high 9.95/25.78 14.63/28.60 14.61/18.65 10.75/15.75 8.97/18.79
Average 1 17.35 20.82 15.97 13.20 12.84
Year-end 11.10 26.52 15.48 15.45 11.62
1 Calculated by weighting average price with daily volumes.
Share prices, USD (New York Stock Exchange)
ADS 2008 2007 2006 2005 2004
Low/high 12.35/38.25 19.08/41.10 17.72/23.10 13.92/18.62 11.03/23.22
Average 1 24.88 29.28 19.98 16.39 15.96
Year-end 15.60 38.39 20.32 18.30 15.67
1 Calculated by weighting average price with daily volumes.
Nokia share prices on NASDAQ OMX Helsinki(EUR)
Nokia ADS prices on the New York Stock Exchange(USD)
0
5
10
15
20
25
30
35
0
5
10
15
20
25
30
35
40
45
| | | | | |
01/04 01/05 01/06 01/07 01/08
| | | | | |
01/04 01/05 01/06 01/07 01/08

Nokia shares and shareholders 57
Nokia shares and shareholders
Largest shareholders registered in Finland, December 31, 2008
(excluding nominee registered shares Total number of shares % of all % of alland shares owned by Nokia Corporation) 1 (1 000) shares voting rights 2
Svenska Litteratursällskapet i Finland rf 14 226 0.37 0.38
Ilmarinen Mutual Pension Insurance Company 13 298 0.35 0.36
Folketrygfondet 10 684 0.28 0.29
Sigrid Jusélius Foundation 10 000 0.26 0.27
Varma Mutual Pension Insurance Company 9 500 0.25 0.26
The State Pension Fund 6 200 0.16 0.17
BNP Arbitrage 4 926 0.13 0.13
The Social Insurance Institution of Finland 4 289 0.11 0.12
Kuntien Eläkevakuutus 3 413 0.09 0.09
The Finnish Cultural Foundation 3 364 0.09 0.09
1 Nokia Corporation owned 103 045 440 shares as at December 31, 2008.
2 30 939 shares owned by the Group companies as at December 31, 2008 do not carry voting rights.
Breakdown of share ownership, December 31, 2008 1
Number of % of Total number % of By number of shares owned shareholders shareholders of shares share capital
1–100 42 115 34.32 2 513 857 0.07
101–1 000 58 674 47.82 23 354 049 0.61
1 001–10 000 18 528 15.10 57 062 564 1.50
10 001–100 000 3 102 2.53 79 866 469 2.10
100 001–500 000 224 0.18 45 950 766 1.21
500 001–1 000 000 30 0.02 20 574 575 0.54
1 000 001–5 000 000 27 0.02 56 183 828 1.48
Over 5 000 000 13 0.01 3 515 442 444 92.49
Total 122 713 100 3 800 948 552 100.00
By nationality, % Shares
Non-Finnish shareholders 89.02
Finnish shareholders 10.98
Total 100.00
By shareholder category(Finnish shareholders), % Shares
Corporations 3.17
Households 4.18
Financial and insurance institutions 0.75
Non-profit organizations 1.64
General government 1.25
Total 10.98
Shares and stock options owned by the members of the Board of Directors and the Group Executive Board
Members of the Board of Directors and the Group Executive Board owned on December 31, 2008 an aggregate of 1 929 451 shares which represented ap-proximately 0.05% of the aggregate number of shares and voting rights. They also owned stock options which, if exercised in full, including both exercisable and unexercisable stock options, would be exercisable for additional 4 651 337 shares representing approxi-mately 0.13% of the total number of shares and voting rights on December 31, 2008.
1 Please note that the breakdown covers only shareholders registered in Finland, and each account operator (26) is included in the number of shareholders as only one registered share-holder. Due to this, the breakdown is not illustrative to the entire shareholder base of Nokia.
Shareholders, December 31, 2008
Shareholders registered in Finland represented 10.98% and shareholders registered in the name of a nominee represented 89.02% of the total number of shares of Nokia Corporation. The number of registered shareholders was 122 713 on December 31, 2008. Each account operator (26) is included in this figure as only one registered shareholder.
Nominee registered shareholders include holders of American Depositary Receipts (ADR). As at Decem-ber 31, 2008, ADRs represented 26.41% of the total number of shares in Nokia.

58 Nokia in 2008
2008 2007 2006 2005 2004
Profit and loss account, EURm
Net sales 50 710 51 058 41 121 34 191 29 371
Cost and expenses – 45 744 – 43 073 – 35 633 – 29 552 – 25 045
Operating profit 4 966 7 985 5 488 4 639 4 326
Share of results of associated companies 6 44 28 10 – 26
Financial income and expenses – 2 239 207 322 405
Profit before tax 4 970 8 268 5 723 4 971 4 705
Tax – 1 081 – 1 522 – 1 357 – 1 281 – 1 446
Profit before minority interests 3 889 6 746 4 366 3 690 3 259
Minority interests 99 459 – 60 – 74 – 67
Profit attributable to equity holders of the parent 3 988 7 205 4 306 3 616 3 192
Balance sheet items, EURm
Fixed assets and other non-current assets 15 112 8 305 4 031 3 501 3 315
Current assets 24 470 29 294 18 586 18 951 19 508
Inventories 2 533 2 876 1 554 1 668 1 305
Accounts receivable and prepaid expenses 15 117 14 665 8 495 7 373 6 406
Available-for-sale investments — — — — 255
Total cash and other liquid assets 6 820 11 753 8 537 9 910 11 542
Total equity 16 510 17 338 12 060 12 514 14 553
Capital and reserves attributable to the Company’s equity holders 14 208 14 773 11 968 12 309 14 385
Minority interests 2 302 2 565 92 205 168
Long-term liabilities 2 717 1 285 396 268 294
Long-term interest-bearing liabilities 861 203 69 21 19
Deferred tax liabilities 1 787 963 205 151 179
Other long-term liabilities 69 119 122 96 96
Current liabilities 20 355 18 976 10 161 9 670 7 976
Current portion of long-term loans 13 173 — — —
Short-term borrowings 3 578 714 180 279 113
Other financial liabilities 924 184 67 98 102
Accounts payable 5 225 7 074 3 732 3 494 2 669
Accrued expenses 7 023 7 114 3 796 3 320 2 604
Provisions 3 592 3 717 2 386 2 479 2 488
Total assets 39 582 37 599 22 617 22 452 22 823
Nokia Group 2004 – 2008, IFRS *
* As of April 1, 2007, Nokia results include those of Nokia Siemens Networks on a fully consolidated basis. Nokia Siemens Networks, a company jointly owned by Nokia and Siemens, is comprised of Nokia’s former Networks business group and Siemens’ carrier-related operations for fixed and mobile networks. Accordingly, the results of the Nokia Group and Nokia Siemens Networks for the full year 2008 are not directly comparable to the results for the full years 2004 –2007. Nokia’s first quarter 2007 and full years 2004–2006 results included Nokia’s former Networks business group only.
On July 10, 2008, Nokia completed the acquisition of NAVTEQ Corporation. NAVTEQ is a separate report-able segment of Nokia starting from the third quarter 2008. Accordingly, the results of NAVTEQ are not available for the prior periods.

Nokia Group 2004 – 2008, IFRS 59
Nokia Group 2004 – 2008, IFRS
Key ratios and economic indicators 1 2008 2007 2006 2005 2004
Net sales, EURm 50 710 51 058 41 121 34 191 29 371
Change, % – 0.7 24.2 20.3 16.4 – 0.5
Exports and foreign subsidiaries, EURm 50 348 50 736 40 734 33 860 29 020
Salaries and social expenses, EURm 6 847 5 702 4 206 3 773 3 430
Operating profit, EURm 4 966 7 985 5 488 4 639 4 326
% of net sales 9.8 15.6 13.3 13.6 14.7
Financial income and expenses, EURm – 2 239 207 322 405
% of net sales — 0.5 0.5 0.9 1.4
Profit before tax, EURm 4 970 8 268 5 723 4 971 4 705
% of net sales 9.8 16.2 13.9 14.5 16.0
Profit from continuing operations, EURm 3 988 7 205 4 306 3 616 3 192
% of net sales 7.9 14.1 10.5 10.6 10.9
Taxes, EURm 1 081 1 522 1 357 1 281 1 446
Dividends, EURm 1 520 2 2 111 1 761 1 641 1 539
Capital expenditure, EURm 889 715 650 607 548
% of net sales 1.8 1.4 1.6 1.8 1.9
Gross investments 3, EURm 1 166 1 017 897 870 1 197
% of net sales 2.3 2.0 2.2 3.1 4.1
R&D expenditure, EURm 5 968 5 647 3 897 3 825 3 776
% of net sales 11.8 11.1 9.5 11.2 12.9
Average personnel 121 723 100 534 65 324 56 896 53 511
Non-interest bearing liabilities, EURm 16 833 18 208 10 103 9 487 7 959
Interest-bearing liabilities, EURm 4 452 1 090 249 300 132
Return on capital employed, % 27.2 54.8 46.1 36.5 31.5
Return on equity, % 27.5 53.9 35.5 27.1 21.5
Equity ratio, % 41.2 45.5 52.6 56.4 64.6
Net debt to equity, % – 14 – 62 – 69 – 77 – 78
1 As of April 1, 2007, Nokia results include those of Nokia Siemens Networks on a fully consolidated basis. Nokia Siemens Networks, a company jointly owned by Nokia and Siemens, is comprised of Nokia’s former Networks business group and Siemens’ carrier-related operations for fixed and mobile networks. Accordingly, the results of the Nokia Group and Nokia Siemens Networks for the full year 2008 are not directly comparable to the results for the full years 2004 –2007. Nokia’s first quarter 2007 and full years 2004–2006 results included Nokia’s former Networks business group only.
On July 10, 2008, Nokia completed the acquisition of NAVTEQ Corporation. NAVTEQ is a separate report-able segment of Nokia starting from the third quarter 2008. Accordingly, the results of NAVTEQ are not available for the prior periods.
2 Board’s proposal.
3 Includes acquisitions, investments in shares and capitalized development costs.
Calculation of key ratios, see page 60.

60 Nokia in 2008
Operating profit Profit after depreciation
Shareholders’ equity Share capital + reserves attributable to the Company’s equity holders
Earnings per share (basic) Profit attributable to equity holders of the parent
Average of adjusted number of shares during the year
P/E ratio Adjusted share price, December 31
Earnings per share
Dividend per share Nominal dividend per share
The adjustment coefficients of the share issues that havetaken place during or after the year in question
Payout ratio Dividend per share
Earnings per share
Dividend yield, % Nominal dividend per share
Share price
Shareholders’ equity per share Capital and reserves attributable to the Company’s equity holders
Adjusted number of shares at year end
Market capitalization Number of shares x share price per share class
Adjusted average share price Amount traded, in EUR, during the period
Adjusted number of shares traded during the period
Share turnover, % Number of shares traded during the period
Average number of shares during the period
Return on capital employed, % Profit before taxes + interest and other net financial expenses
Average capital and reserves attributable to the Company’s equity holders+ short-term borrowings + long-term interest-bearing liabilities (including the current portion thereof) + minority shareholders’ interests
Return on shareholders’ equity, % Profit attributable to the equity holders of the parent
Average capital and reserves attributable to the Company’s equity holders during the year
Key ratios under IFRS
Calculation of key ratios
Equity ratio, % Capital and reserves attributable to the Company’s equity holders + minority shareholders’ interests
Total assets – advance payments received
Net debt to equity (gearing), % Long-term interest-bearing liabilities (including the current portion thereof)+ short-term borrowings – cash and other liquid assets
Capital and reserves attributable to the equity holders of the parent + minority shareholders’ interests
Year-end exchange rates 2008
1 EUR =
USD 1.3917
GBP 0.9525
JPY 126.14
CNY 9.4956
INR 67.066

Proposal by the Board of Directors for distribution of profit 61
Proposal by the Board of Directors for distribution of profit
The distributable funds in the balance sheet of the Company as per December 31, 2008 amount
to EUR 7 644 million.
The Board proposes that from the retained earnings a dividend of EUR 0.40 per share is to be
paid out on the shares of the Company. As per December 31, 2008, the number of shares of the
Company amounted to 3 800 948 552, based on which the maximum amount to be distributed
as dividend is EUR 1 520 million.
The proposed dividend is in line with the Company’s distribution policy and it significantly
exceeds the minority dividend required by law.
Espoo, March 5, 2009
Jorma Ollila Marjorie Scardino Georg Ehrnrooth Chairman
Lalita D. Gupte Bengt Holmström Henning Kagermann
Per Karlsson Risto Siilasmaa Keijo Suila
Olli-Pekka Kallasvuo President and CEO

62 Nokia in 2008
Auditors’ report
To the Annual General Meeting of Nokia Corporation
We have audited the accounting records, the financial statements, the review by the Board of Directors and the administration of Nokia Corporation for the year ended 31 December 2008. The financial statements comprise the consolidated balance sheet, profit and loss accounts, cash flow statement, statement of changes in shareholders’ equity and notes to the consolidated financial statements, as well as the parent company’s balance sheet, profit and loss accounts, cash flow statement and notes to the financial statements.
Responsibility of the Board of Directors and the Managing DirectorThe Board of Directors and the Managing Director are responsible for the preparation of the financial statements and the review by the Board of Directors and for the fair presentation of the consolidated financial statements in accor-dance with International Financial Reporting Standards (IFRS) as adopted by the EU, as well as for the fair presenta-tion of the financial statements and the review by the Board of Directors in accordance with laws and regulations governing the preparation of the financial statements and the review by the Board of Directors in Finland. The Board of Directors is responsible for the appropriate arrangement of the control of the company’s accounts and finances, and the Managing Director shall see to it that the accounts of the company are in compliance with the law and that its financial affairs have been arranged in a reliable manner.
Auditor’s responsibilityOur responsibility is to perform an audit in accordance with good auditing practice in Finland, and to express an opin-ion on the parent company’s financial statements, on the consolidated financial statements and on the review by the Board of Directors based on our audit. Good auditing practice requires that we comply with ethical requirements and plan and perform the audit to obtain reasonable assurance about whether the financial statements and the review by the Board of Directors are free from material misstatement and whether the members of the Board of Directors of the parent company and the Managing Director have complied with the Limited Liability Companies Act.
An audit involves performing procedures to obtain audit evidence about the amounts and disclosures in the financial statements and the review by the Board of Directors. The procedures selected depend on the auditor’s judgment, including the assessment of the risks of material misstatement of the financial statements, whether due to fraud or error. In making those risk assessments, the auditor considers internal control relevant to the entity’s prepara-tion and fair presentation of the financial statements in order to design audit procedures that are appropriate in the circumstances. An audit also includes evaluating the appropriateness of accounting policies used and the reasonable-ness of accounting estimates made by management, as well as evaluating the overall presentation of the financial statements and the review by the Board of Directors.
The audit was performed in accordance with good auditing practice in Finland. We believe that the audit evidence we have obtained is sufficient and appropriate to provide a basis for our audit opinion.
Opinion on the consolidated financial statementsIn our opinion, the consolidated financial statements give a true and fair view of the financial position, financial performance, and cash flows of the group in accordance with International Financial Reporting Standards (IFRS) as adopted by the EU.
Opinions on the company’s financial statements, the review by the Board of Directors and administrationIn our opinion, the financial statements and the review by the Board of Directors give a true and fair view of both the consolidated and the parent company’s financial performance and financial position in accordance with the laws and regulations governing the preparation of the financial statements and the review by the Board of Directors in Finland. The information in the review by the Board of Directors is consistent with the information in the financial statements.
We support that the financial statements should be adopted. The proposal by the Board of Directors regarding the distribution of the profit shown in the balance sheet is in compliance with the Limited Liability Companies Act. We support that the Members of the Board of Directors and the Managing Director should be discharged from liability for the financial period audited by us.
Helsinki, March 5, 2009
PricewaterhouseCoopers OyAuthorised Public Accountants
Merja LindhAuthorised Public Account

Critical accounting policies ................................................................................................................ 64
Group Executive Board ........................................................................................................................ 68
Board of Directors ................................................................................................................................. 70
Corporate governance ......................................................................................................................... 72
Investor information ............................................................................................................................ 88
Contact information ............................................................................................................................. 89
Additional information
64 Nokia in 2008
Critical accounting policies
Our accounting policies affecting our financial condi-tion and results of operations are more fully described in Note 1 to our consolidated financial statements. Certain of our accounting policies require the applica-tion of judgment by management in selecting appro-priate assumptions for calculating financial estimates, which inherently contain some degree of uncertainty. Management bases its estimates on historical experi-ence and various other assumptions that are believed to be reasonable under the circumstances, the results of which form the basis for making judgments about the reported carrying values of assets and liabilities and the reported amounts of revenues and expenses that may not be readily apparent from other sources. Actual results may differ from these estimates under different assumptions or conditions.
We believe the following are the critical account-ing policies and related judgments and estimates used in the preparation of our consolidated financial statements. We have discussed the application of these critical accounting estimates with our Board of Directors and Audit Committee.
Revenue recognition
Sales from the majority of the Group are recognized when the significant risks and rewards of ownership have transferred to the buyer, continuing managerial involvement usually associated with ownership and effective control have ceased, the amount of revenue can be measured reliably, it is probable that economic benefits associated with the transaction will flow to the Group, and the costs incurred or to be incurred in respect of the transaction can be measured reliably. The remainder of revenue is recorded under the percentage of completion method.
Devices & Services and certain NAVTEQ and Nokia Siemens Networks revenues are generally recognized when the significant risks and rewards of ownership have transferred to the buyer, continuing managerial involvement usually associated with ownership and effective control have ceased, the amount of revenue can be measured reliably, it is probable that economic benefits associated with the transaction will flow to the Group and the costs incurred or to be incurred in respect of the transaction can be measured reliably.
This requires us to assess at the point of delivery whether these criteria have been met. When man-agement determines that such criteria have been met, revenue is recognized. We record estimated reductions to revenue for special pricing agreements, price protection and other volume based discounts at the time of sale, mainly in the mobile device busi-ness. Sales adjustments for volume based discount programs are estimated based largely on historical activity under similar programs. Price protection adjustments are based on estimates of future price reductions and certain agreed customer inventories at the date of the price adjustment. An immaterial part of the revenue from products sold through distribu-tion channels is recognized when the reseller or distributor sells the product to the end-user. Devices & Services and certain Nokia Siemens Networks service revenue is generally recognized on a straight line basis over the service period unless there is evidence that some other method better represents the stage of completion. Devices & Services and NAVTEQ license fees from usage are recognized in the period in which the customer reports them to the Group.
Devices & Services, NAVTEQ and Nokia Siemens Networks may enter into multiple component transac-tions consisting of any combination of hardware, services and software. The commercial effect of each separately identifiable element of the transaction is evaluated in order to reflect the substance of the transaction. The consideration from these transac-tions is allocated to each separately identifiable component based on the relative fair value of each component. The consideration allocated to each com-ponent is recognized as revenue when the revenue recognition criteria for that element have been met. If the Group is unable to reliably determine the fair value attributable to the separately identifiable compo-nents, the Group defers revenue until all components are delivered and services have been performed. The Group determines the fair value of each component by taking into consideration factors such as the price when the component is sold separately by the Group, the price when a similar component is sold separately by the Group or a third party and cost plus a reason-able margin.
Nokia Siemens Networks revenue and cost of sales from contracts involving solutions achieved through
modification of complex telecommunications equip-ment is recognized on the percentage of completion basis when the outcome of the contract can be esti-mated reliably. This occurs when total contract revenue and the cost to complete the contract can be estimated reliably, it is probable that economic benefits associ-ated with the contract will flow to the Group, and the stage of contract completion can be measured. When we are not able to meet those conditions, the policy is to recognize revenues only equal to costs incurred to date, to the extent that such costs are expected to be recovered. Completion is measured by reference to costs incurred to date as a percentage of estimated total project costs using the cost-to-cost method.
The percentage of completion method relies on estimates of total expected contract revenue and costs, as well as the dependable measurement of the progress made towards completing the particular project. Recognized revenues and profit are subject to revisions during the project in the event that the assumptions regarding the overall project outcome are revised. The cumulative impact of a revision in estimates is recorded in the period such revisions become likely and estimable. Losses on projects in progress are recognized in the period they become likely and estimable.
Nokia Siemens Networks’ current sales and profit estimates for projects may change due to the early stage of a long-term project, new technology, changes in the project scope, changes in costs, changes in timing, changes in customers’ plans, realization of penalties, and other corresponding factors.
Customer financing
We have provided a limited amount of customer fi-nancing and agreed extended payment terms with se-lected customers. In establishing credit arrangements, management must assess the creditworthiness of the customer and the timing of cash flows expected to be received under the arrangement. However, should the actual financial position of our customers or general economic conditions differ from our assumptions, we may be required to re-assess the ultimate collectabil-ity of such financings and trade credits, which could result in a write-off of these balances in future periods

Critical accounting policies 65
Critical accounting policies
and thus negatively impact our profits in future periods. Our assessment of the net recoverable value considers the collateral and security arrangements of the receivable as well as the likelihood and timing of estimated collections. The Group endeavors to mitigate this risk through the transfer of its rights to the cash collected from these arrangements to third-party financial institutions on a non-recourse basis in exchange for an upfront cash payment. See also Note 35(b) to our consolidated financial statements for a further discussion of long-term loans to customers and other parties.
Allowances for doubtful accounts
We maintain allowances for doubtful accounts for estimated losses resulting from the subsequent in-ability of our customers to make required payments. If the financial conditions of our customers were to deteriorate, resulting in an impairment of their ability to make payments, additional allowances may be required in future periods. Management specifically analyzes accounts receivables and historical bad debt, customer concentrations, customer creditworthiness, current economic trends and changes in our customer payment terms when evaluating the adequacy of the allowance for doubtful accounts.
Inventory-related allowances
We periodically review our inventory for excess, obso-lescence and declines in market value below cost and record an allowance against the inventory balance for any such declines. These reviews require management to estimate future demand for our products. Possible changes in these estimates could result in revisions to the valuation of inventory in future periods.
Warranty provisions
We provide for the estimated cost of product warran-ties at the time revenue is recognized. Our products are covered by product warranty plans of varying periods, depending on local practices and regula-
tions. While we engage in extensive product quality programs and processes, including actively monitor-ing and evaluating the quality of our component suppliers, our warranty obligations are affected by actual product failure rates (field failure rates) and by material usage and service delivery costs incurred in correcting a product failure. Our warranty provi-sion is established based upon our best estimates of the amounts necessary to settle future and existing claims on products sold as of the balance sheet date. As we continuously introduce new products which incorporate complex technology, and as local laws, regulations and practices may change, it will be in-creasingly difficult to anticipate our failure rates, the length of warranty periods and repair costs. While we believe that our warranty provisions are adequate and that the judgments applied are appropriate, the ulti-mate cost of product warranty could differ materially from our estimates. When the actual cost of quality of our products is lower than we originally anticipated, we release an appropriate proportion of the provision, and if the cost of quality is higher than anticipated, we increase the provision.
Provision for intellectual property rights, or IPR, infringements
We provide for the estimated future settlements related to asserted and unasserted past alleged IPR infringements based on the probable outcome of each potential infringement.
Our products and solutions include increasingly complex technologies involving numerous patented and other proprietary technologies. Although we proactively try to ensure that we are aware of any patents and other intellectual property rights related to our products and solutions under development and thereby avoid inadvertent infringement of proprietary technologies, the nature of our business is such that patent and other intellectual property right infringe-ments may and do occur. Through contact with parties claiming infringement of their patented or otherwise exclusive technology, or through our own monitoring of developments in patent and other intel-lectual property right cases involving our competitors, we identify potential IPR infringements.
We estimate the outcome of all potential IPR infringements made known to us through assertion by third parties, or through our own monitoring of patent- and other IPR-related cases in the relevant legal systems. To the extent that we determine that an identified potential infringement will result in a prob-able outflow of resources, we record a liability based on our best estimate of the expenditure required to settle infringement proceedings.
Our experience with claims of IPR infringement is that there is typically a discussion period with the accusing party, which can last from several months to years. In cases where a settlement is not reached, the discovery and ensuing legal process typically lasts a minimum of one year. For this reason, IPR infringe-ment claims can last for varying periods of time, resulting in irregular movements in the IPR infringe-ment provision. In addition, the ultimate outcome or actual cost of settling an individual infringement may materially vary from our estimates.
Legal contingencies
As discussed in Note 29 to the consolidated financial statements, legal proceedings covering a wide range of matters are pending or threatened in various jurisdictions against the Group. We record provisions for pending litigation when we determine that an unfavorable outcome is probable and the amount of loss can be reasonably estimated. Due to the inherent uncertain nature of litigation, the ultimate outcome or actual cost of settlement may materially vary from estimates.
Capitalized development costs
We capitalize certain development costs when it is probable that a development project will be a success and certain criteria, including commercial and techni-cal feasibility, have been met. These costs are then amortized on a systematic basis over their expected useful lives, which due to the constant development of new technologies is between two to five years. During the development stage, management must estimate the commercial and technical feasibility of these
66 Nokia in 2008
Critical accounting policies
projects as well as their expected useful lives. Should a product fail to substantiate its estimated feasibility or life cycle, we may be required to write off excess development costs in future periods.
Whenever there is an indicator that develop-ment costs capitalized for a specific project may be impaired, the recoverable amount of the asset is estimated. An asset is impaired when the carrying amount of the asset exceeds its recoverable amount. The recoverable amount is defined as the higher of an asset’s net selling price and value in use. Value in use is the present value of discounted estimated future cash flows expected to arise from the continuing use of an asset and from its disposal at the end of its useful life. For projects still in development, these estimates include the future cash outflows that are expected to occur before the asset is ready for use. See Note 8 to our consolidated financial statements included in Item 18 of this annual report.
Impairment reviews are based upon our projec-tions of anticipated discounted future cash flows. The most significant variables in determining cash flows are discount rates, terminal values, the number of years on which to base the cash flow projections, as well as the assumptions and estimates used to de-termine the cash inflows and outflows. Management determines discount rates to be used based on the risk inherent in the related activity’s current business model and industry comparisons. Terminal values are based on the expected life of products and forecasted life cycle and forecasted cash flows over that period. While we believe that our assumptions are appropri-ate, such amounts estimated could differ materially from what will actually occur in the future.
Business combinations
We apply the purchase method of accounting to account for acquisitions of businesses. The cost of an acquisition is measured as the aggregate of the fair values at the date of exchange of the assets given, liabilities incurred, equity instruments issued, and costs directly attributable to the acquisition. Identifiable assets, liabilities and contingent liabilities acquired or assumed are measured separately at their fair value as of the acquisition date. The excess of the cost of the
acquisition over our interest in the fair value of the identifiable net assets acquired is recorded as goodwill.
The determination and allocation of fair values to the identifiable assets acquired and liabilities as-sumed is based on various assumptions and valuation methodologies requiring considerable management judgment. The most significant variables in these valuations are discount rates, terminal values, the number of years on which to base the cash flow projections, as well as the assumptions and estimates used to determine the cash inflows and outflows. Management determines discount rates to be used based on the risk inherent in the related activity’s current business model and industry comparisons. Terminal values are based on the expected life of products and forecasted life cycle and forecasted cash flows over that period. Although we believe that the assumptions applied in the determination are reason-able based on information available at the date of ac-quisition, actual results may differ from the forecasted amounts and the difference could be material.
Valuation of long-lived and intangible assets and goodwill
We assess the carrying value of identifiable intangible assets, long-lived assets and goodwill annually, or more frequently if events or changes in circumstances indicate that such carrying value may not be recover-able. Factors we consider important, which could trigger an impairment review, include the following:
» significant underperformance relative to historical or projected future results;
» significant changes in the manner of our use of the acquired assets or the strategy for our overall business; and
» significantly negative industry or economic trends.
When we determine that the carrying value of intan-gible assets, long-lived assets or goodwill may not be recoverable based upon the existence of one or more of the above indicators of impairment, we measure any impairment based on discounted projected cash flows.
This review is based upon our projections of anticipated discounted future cash flows. The most significant variables in determining cash flows are discount rates, terminal values, the number of years on which to base the cash flow projections, as well as the assumptions and estimates used to determine the cash inflows and outflows. Management determines discount rates to be used based on the risk inherent in the related activity’s current business model and industry comparisons. Terminal values are based on the expected life of products and forecasted life cycle and forecasted cash flows over that period. While we believe that our assumptions are appropriate, such amounts estimated could differ materially from what will actually occur in the future. In assessing goodwill, these discounted cash flows are prepared at a cash generating unit level. Amounts estimated could differ materially from what will actually occur in the future.
Fair value of derivatives and other financial instruments
The fair value of financial instruments that are not traded in an active market (for example, unlisted equities, currency options and embedded derivatives) are determined using valuation techniques. We use judgment to select an appropriate valuation method-ology and underlying assumptions based principally on existing market conditions. If quoted market prices are not available for unlisted shares, fair value is estimated by using various factors, including, but not limited to: (1) the current market value of similar instruments, (2) prices established from a recent arm’s length financing transaction of the target compa-nies, (3) analysis of market prospects and operating performance of the target companies taking into consideration of public market comparable companies in similar industry sectors. Changes in these assump-tions may cause the Group to recognize impairments or losses in the future periods.
Income taxes
The Group is subject to income taxes both in Finland and in numerous other jurisdictions. Significant

Critical accounting policies 67
Critical accounting policies
judgment is required in determining the provision for income taxes and deferred tax assets and liabilities recognized in the consolidated financial statements. We recognize deferred tax assets to the extent that it is probable that sufficient taxable income will be available in the future against which the temporary differences and unused tax losses can be utilized. We have considered future taxable income and tax planning strategies in making this assessment. We recognize tax provisions based on estimates and assumptions when, despite our belief that tax return positions are supportable, it is more likely than not that certain positions will be challenged and may not be fully sustained upon review by tax authorities.
If the final outcome of these matters differs from the amounts initially recorded, differences may positively or negatively impact the income tax and deferred tax provisions in the period in which such determination is made.
Pensions
The determination of our pension benefit obligation and expense for defined benefit pension plans is dependent on our selection of certain assumptions used by actuaries in calculating such amounts. Those assumptions are described in Note 5 to our consolidat-ed financial statements and include, among others, the discount rate, expected long-term rate of return on plan assets and annual rate of increase in future compensation levels. A portion of our plan assets is invested in equity securities. The equity markets have experienced volatility, which has affected the value of our pension plan assets. This volatility may make it difficult to estimate the long-term rate of return on plan assets. Actual results that differ from our as-sumptions are accumulated and amortized over future periods and therefore generally affect our recognized expense and recorded obligation in such future peri-ods. Our assumptions are based on actual historical experience and external data regarding compensation and discount rate trends. While we believe that our assumptions are appropriate, significant differences in our actual experience or significant changes in our assumptions may materially affect our pension obligation and our future expense.
Share-based compensation
We have various types of equity settled share-based compensation schemes for employees. Employee services received, and the corresponding increase in equity, are measured by reference to the fair value of the equity instruments as at the date of grant, exclud-ing the impact of any non-market vesting conditions. Fair value of stock options is estimated by using the Black Scholes model on the date of grant based on cer-tain assumptions. Those assumptions are described in Note 22 to our consolidated financial statements and include, among others, the dividend yield, expected volatility and expected life of stock options. The ex-pected life of stock options is estimated by observing general option holder behavior and actual historical terms of Nokia stock option programs, whereas the assumption of the expected volatility has been set by reference to the implied volatility of stock options available on Nokia shares in the open market and in light of historical patterns of volatility. These variables make estimation of fair value of stock options difficult.
Non-market vesting conditions attached to the performance shares are included in assumptions about the number of shares that the employee will ultimately receive relating to projections of sales and earnings per share. On a regular basis, we review the assumptions made and revise the estimates of the number of performance shares that are expected to be settled, where necessary. At the date of grant, the number of performance shares granted that are expected to be settled is assumed to be two times the amount at threshold. Any subsequent revisions to the estimates of the number of performance shares expected to be settled may increase or decrease total compensation expense. Such increase or decrease adjusts the prior period compensation expense in the period of the review on a cumulative basis for unvested performance shares for which compensation expense has already been recognized in the profit and loss account, and in subsequent periods for unvested performance shares for which the expense has not yet been recognized in the profit and loss account. Significant differences in employee option activity, equity market performance, and our projected and actual net sales and earnings per share performance may materially affect future expense. In addition, the
value, if any, an employee ultimately receives from share-based payment awards may not correspond to the expense amounts recorded by the Group.

68 Nokia in 2008
The current members of Nokia’s Group Executive Board are set forth below.
According to Nokia’s articles of association, Nokia has a Group Executive Board that is responsible for the operative management of the Group. The Chairman and members of the Group Executive Board are appointed by the Board of Directors. Only the Chairman of the Group Executive Board, the Chief Executive Officer, can be a member of both the Board of Directors and the Group Executive Board. The Chief Executive Officer acts as President, and his rights and responsibilities include those allotted to the President under Finnish law.
Group Executive Board
Chairman Olli-Pekka Kallasvuo, b. 1953
President and CEO of Nokia Corporation.Group Executive Board member since 1990,Chairman since 2006.With Nokia 1980–1981, rejoined 1982.
LL.M. (University of Helsinki).
President and COO of Nokia Corporation 2005–2006, Executive Vice President and General Manager of Nokia Mobile Phones 2004–2005, Executive Vice President, CFO of Nokia 1999–2003, Executive Vice President of Nokia Americas and President of Nokia Inc. 1997–1998, Executive Vice President, CFO of Nokia 1992–1996, Senior Vice President, Finance of Nokia 1990–1991.
Chairman of the Board of Directors of Nokia Siemens Networks B.V. Member of the Board of Directors of Confederation of Finnish Industries EK.
Esko Aho, b. 1954 Executive Vice President, Corporate Relations and Responsibility.Group Executive Board member since January 1, 2009.Joined Nokia November 1, 2008.
Master of Social Sciences (University of Helsinki).
President of the Finnish Innovation Fund, Sitra 2004–
2008. Private consultant 2003–2004. Lecturer, Harvard University 2000–2001. Prime Minister of Finland 1991–1995. Chairman of the Centre Party 1990–2002. Member of the Finnish Parliament 1983–2003. Elector in the presidential elections of 1978, 1982 and 1988.
Member of the Board of Directors of Fortum Corpora-tion. Member of the Board of Directors of Russian Ven-ture Company. Member of the Club de Madrid. Member of the Science and Technology in Society Forum (STS). Member of the InterAction Council. Vice Chairman of the Board, Technology Industries of Finland.
Robert Andersson, b. 1960 Executive Vice President, Devices Finance, Strategy and Strategic Sourcing.Group Executive Board member since 2005. Joined Nokia 1985.
Master of Business Administration (George Washing-ton University, Washington D.C.), Master of Science (Economics and Business Administration) (Swedish School of Economics and Business Administration, Helsinki).
Executive Vice President of Customer and Market Op-erations 2005–2007, Senior Vice President of Customer and Market Operations, Europe, Middle East and Africa 2004–2005, Senior Vice President of Nokia Mobile Phones in Asia-Pacific 2001–2004, Vice President of Sales for Nokia Mobile Phones in Europe and Africa 1998–2001. Various managerial and executive posi-tions within Nokia Mobile Phones, Nokia Consumer Electronics and Nokia Data 1985–1998.
Simon Beresford-Wylie, b. 1958
Chief Executive Officer, Nokia Siemens Networks. Group Executive Board member since 2005. Joined Nokia 1998.
Bachelor of Arts (Economic Geography and History) (Australian National University).
Executive Vice President and General Manager of Net-works 2005–2007. Senior Vice President of Nokia Net-works, Asia-Pacific 2003–2004, Senior Vice President, Customer Operations of Nokia Networks 2002–2003, Vice President, Customer Operations of Nokia Networks 2000–2002, Managing Director of Nokia Networks in India and Area General Manager, South Asia 1999–2000, Regional Director of Business Devel-opment, Project and Trade Finance of Nokia Networks, Asia-Pacific 1998–1999, Chief Executive Officer of Modi Telstra, India 1995–1998, General Manager, Banking and Finance, Corporate and Government business unit of Telstra Corporation 1993–1995, holder of executive positions in the Corporate and Government business units of Telstra Corporation 1989–1993. Holder of executive, managerial and clerical positions in the Australian Commonwealth Public Service 1982–1989.
Member of the Board of Directors of The Vitec Group.
Timo Ihamuotila, b. 1966
Executive Vice President, Sales. Group Executive Board member since 2007. With Nokia 1993–1996, rejoined 1999.
Master of Science (Economics) (Helsinki School of Economics), Licentiate of Science (Finance) (Helsinki School of Economics and Business Administration).
Executive Vice President, Sales and Portfolio Manage-ment, Mobile Phones, 2007. Senior Vice President, CDMA Business Unit, Mobile Phones 2004–2007, Vice President, Finance, Corporate Treasurer of Nokia Corporation 2000–2004, Director of Corporate Finance 1999–2000, Vice President of Nordic Derivates Sales, Citibank plc 1996–1999, Manager of Dealing & Risk Management of Nokia 1993–1996, Analyst, Assets and Liability Management, Kansallis Bank 1990–1993.
Group Executive Board 69
Mary T. McDowell, b. 1964
Executive Vice President, Chief Development Officer.Group Executive Board member since 2004.Joined Nokia 2004.
Bachelor of Science (Computer Science) (College of Engineering at the University of Illinois).
Executive Vice President and General Manager of Enterprise Solutions 2004–2007. Senior Vice President, Strategy and Corporate Development of Hewlett-Pack-ard Company 2003, Senior Vice President & General Manager, Industry-Standard Servers of Hewlett-Packard Company 2002–2003, Senior Vice President & General Manager, Industry-Standard Servers of Compaq Computer Corporation 1998–2002, Vice Presi-dent, Marketing, Server Products Division of Compaq Computer Corporation 1996–1998. Holder of executive, managerial and other positions at Compaq Computer Corporation 1986–1996.
Hallstein Moerk, b. 1953
Executive Vice President, Human Resources.Group Executive Board member since 2004.Joined Nokia 1999.
Diplomøkonom (Econ.) (Norwegian School of Management).
Holder of various positions at Hewlett-Packard Corporation 1977–1999.
Member of the Board of Advisors of Center for HR Strategy, Rutgers University. Fellow of Academy of Human Resources, Class of 2007.
Dr. Tero Ojanperä, b. 1966
Executive Vice President, Services.Group Executive Board member since 2005. Joined Nokia 1990.
Master of Science (University of Oulu), Ph.D. (Delft University of Technology, The Netherlands).
Executive Vice President, Chief Technology Officer 2006–2007. Executive Vice President & Chief Strategy Officer 2005–2006, Senior Vice President, Head of Nokia Research Center 2003–2004. Vice President, Re-search, Standardization and Technology of IP Mobility Networks, Nokia Networks 1999–2002. Vice President, Radio Access Systems Research and General Manager of Nokia Networks in Korea 1999. Head of Radio Access Systems Research, Nokia Networks 1998–1999, Princi-pal Engineer, Nokia Research Center 1997–1998.
Member of Young Global Leaders. Member of the Board of Directors of MusiCares.
Niklas Savander, b. 1962
Executive Vice President, Services.Group Executive Board member since 2006. Joined Nokia 1997.
Master of Science (Eng.) (Helsinki University of Technology), Master of Science (Economics and Business Administration) (Swedish School of Economics and Business Administration, Helsinki).
Executive Vice President, Technology Platforms 2006–2007. Senior Vice President and General Manager of Nokia Enterprise Solutions, Mobile Devices Busi-ness Unit 2003–2006, Senior Vice President, Nokia Mobile Software, Market Operations 2002–2003, Vice President, Nokia Mobile Software, Strategy, Market-ing & Sales 2001–2002, Vice President and General Manager of Nokia Networks, Mobile Internet Applica-tions 2000–2001, Vice President of Nokia Networks, Systems Marketing 1997–1998. Holder of executive and managerial positions at Hewlett-Packard Company 1987–1997.
Member of the Board of Directors of Nokia Siemens Networks B.V. Vice Chairman of the Board of Directors of Tamfelt Corp. Member of the Board of Directors and secretary of Waldemar von Frenckells Stiftelse.
Richard A. Simonson, b. 1958 Executive Vice President, Chief Financial Officer. Group Executive Board member since 2004.Joined Nokia 2001.
Bachelor of Science (Mining Eng.) (Colorado School of Mines), Master of Business Administration (Finance) (Wharton School of Business at University of Pennsylvania).
Vice President & Head of Customer Finance of Nokia Corporation 2001–2003, Managing Director of Telecom & Media Group of Barclays 2001, Head of Global Project Finance and other various positions at Bank of America Securities 1985–2001.
Member of the Board of Directors of Nokia Siemens Networks B.V. Member of the Board of Directors of Electronic Arts, Inc. Member of the Board of Trustees of International House–New York. Member of US Treasury Advisory Committee on the Auditing Profession.
Anssi Vanjoki, b. 1956
Executive Vice President, Markets. Group Executive Board member since 1998.Joined Nokia 1991.
Master of Science (Econ.) (Helsinki School of Economics and Business Administration).
Executive Vice President and General Manager of Multi media 2004–2007. Executive Vice President of Nokia Mobile Phones 1998–2003, Senior Vice President, Europe & Africa of Nokia Mobile Phones 1994–1998, Vice President, Sales of Nokia Mobile Phones 1991–1994, 3M Corporation 1980–1991.
Chairman of the Boards of Directors of Amer Sports Corporation and Koskitukki Oy.
Dr. Kai Öistämö, b. 1964
Executive Vice President, Devices. Group Executive Board member since 2005. Joined Nokia 1991.
Doctor of Technology (Signal Processing), Master of Science (Engineering) (Tampere University of Technology).
Executive Vice President and General Manager of Mo-bile Phones 2005–2007. Senior Vice President, Business Line Management, Mobile Phones 2004–2005, Senior Vice President, Mobile Phones Business Unit, Nokia Mobile Phones 2002–2003, Vice President, TDMA/GSM 1900 Product Line, Nokia Mobile Phones 1999–2002, Vice President, TDMA Product Line 1997–1999, various technical and managerial positions in Nokia Consumer Electronics and Nokia Mobile Phones 1991–1997.
Member of Board of Directors of Nokian Tyres plc. Chairman of the Research and Technology Committee of the Confederation of Finnish Industries EK.
Veli Sundbäck, Executive Vice President, Corporate Relations and Responsibility resigned from the Group Executive Board as of December 31, 2008 and Mr. Sundbäck will continue in Nokia as an executive advisor until his retirement on May 31, 2009. Esko Aho, Executive Vice President, Corporate Relations and Re-sponsibility, was appointed as a member of the Group Executive Board as of January 1, 2009.

70 Nokia in 2008
Board of Directors
The current members of the Board of Directors were elected at the Annual General Meeting on May 8, 2008, based on the proposal of the Cor-porate Governance and Nomination Committee of the Board of Directors. On the same date, the Chairman and Vice Chairman of the Board of Di-rectors, as well as the Chairmen and members of the committees of the Board, were elected among the Board members and among the independent directors of the Board, respectively.
The members of the Board of Directors are an-nually elected by a simple majority of the share-holders’ votes represented at the Annual General Meeting for a one-year term ending at close of the next Annual General Meeting.
The current members of the Board of Directors and its committees are set forth below.
Chairman Jorma Ollila, b. 1950
Chairman of the Board of Directors of Nokia Corporation. Chairman of the Board of Directors of Royal Dutch Shell Plc.Board member since 1995. Chairman since 1999.
Master of Political Science (University of Helsinki), Master of Science (Econ.) (London School of Economics), Master of Science (Eng.) (Helsinki University of Technology).
Chairman and CEO, Chairman of the Group Executive Board of Nokia Corporation 1999–2006, President and CEO, Chairman of the Group Executive Board of Nokia Corporation 1992–1999, President of Nokia Mobile Phones 1990–1992, Senior Vice President, Finance of Nokia 1986–1989. Holder of various managerial posi-tions at Citibank within corporate banking 1978–1985.
Vice Chairman of the Board of Directors of Otava Books and Magazines Group Ltd and member of the Board of Directors of Fruugo Inc. Chairman of the Boards of Directors and the Supervisory Boards of The Research Institute of the Finnish Economy ETLA and Finnish Business and Policy Forum EVA. Chairman of The European Round Table of Industrialists. Vice Chairman of the Independent Reflection Group of the Council of the European Union considering the future of the European Union.
Vice Chairman Dame Marjorie Scardino, b. 1947
Chief Executive and member of the Board of Directors of Pearson plc. Board member since 2001. Vice Chairman since 2007.Chairman of the Corporate Governance and Nomination Committee and member of the Personnel Committee.
Bachelor of Arts (Baylor University), Juris Doctor (University of San Francisco).
Chief Executive of The Economist Group 1993–1997, President of the North American Operations of The Economist Group 1985–1993, lawyer 1976–1985 and publisher of The Georgia Gazette newspaper 1978–1985.
Georg Ehrnrooth, b. 1940Board member since 2000.Chairman of the Audit Committee and member of the Corporate Governance and Nomination Committee.
Master of Science (Eng.) (Helsinki University of Technology).
President and CEO of Metra Corporation 1991–2000, President and CEO of Lohja Corporation 1979–1991. Holder of various executive positions at Wärtsilä Corporation within production and management 1965–1979.
Chairman of the Board of Directors of Sampo plc, mem-ber of the Boards of Directors of Oy Karl Fazer Ab and Sandvik AB (publ). Vice Chairman of the Boards of Direc-tors of The Research Institute of the Finnish Economy ETLA and Finnish Business and Policy Forum EVA.
Lalita D. Gupte, b. 1948Non-executive Chairman of the ICICI Venture Funds Management Co Ltd.Board member since 2007.Member of the Audit Committee.
B.A. in Economics (University of Delhi) and Master of Management Studies (University of Bombay).
Joint Managing Director member of the Board of Directors of ICICI Bank Limited (formerly ICICI Ltd) 1999–2006, Deputy Managing Director of ICICI Ltd 1996–1999, Executive Director on the Board of Direc-tors of ICICI Limited 1994–1996. Various leadership po-sitions in Corporate and Retail Banking, Strategy and Resources, and International Banking in ICICI Limited and subsequently in ICICI Bank Ltd since 1971.
Member of the Boards of Directors of ICICI Venture Funds Management Co Ltd (non-executive Chairman), Bharat Forge Ltd, Kirloskar Brothers Ltd, FirstSource Solutions Ltd, Godrej Properties Ltd, HPCL-Mittal En-ergy Ltd and Swadhaar FinServe Pvt Ltd. Also member of Board of Governors of educational institutions.
Dr. Bengt Holmström, b. 1949
Paul A. Samuelson Professor of Economics at MIT, joint appointment at the MIT Sloan School of Management. Board member since 1999.
Bachelor of Science (Helsinki University), Master of Science (Stanford University), Doctor of Philosophy (Stanford University).
Edwin J. Beinecke Professor of Management Studies at Yale University 1985–1994.
Member of the American Academy of Arts and Sciences and Foreign Member of The Royal Swedish Academy of Sciences. Member of the Boards of Directors of The Research Institute of the Finnish Economy ETLA and Finnish Business and Policy Forum EVA. Member of Aalto University Foundation Board.
Board of Directors 71
Prof. Dr. Henning Kagermann, b. 1947
Co-CEO and Chairman of the Executive Board of SAP AG.Board member since 2007. Member of the Personnel Committee.
Ph.D. in Theoretical Physics (Technical University of Brunswick).
Co-chairman of the Executive Board of SAP
1998–2003. A number of leadership positions in SAP since 1982. Member of SAP Executive Board since 1991. Taught physics and computer science at the Technical University of Brunswick and the University of Mannheim 1980–1992, became professor in 1985.
Member of the Supervisory Boards of Deutsche Bank AG and Münchener Rückversicherungs-Gesells-chaft AG (Munich Re). Member of the Honorary Senate of the Foundation Lindau Nobelprizewinners.
Chairman Olli-Pekka Kallasvuo, b. 1953
President and CEO of Nokia Corporation.Board member since 2007.
LL.M. (University of Helsinki).
President and COO of Nokia Corporation 2005–2006, Executive Vice President and General Manager of Nokia Mobile Phones 2004–2005, Executive Vice President, CFO of Nokia 1999–2003, Executive Vice President of Nokia Americas and President of Nokia Inc. 1997–1998, Executive Vice President, CFO of Nokia 1992–1996, Senior Vice President, Finance of Nokia 1990–1991.
Chairman of the Board of Directors of Nokia Siemens Networks B.V. Member of the Board of Directors of Confederation of Finnish Industries EK.
Per Karlsson, b. 1955
Independent Corporate Advisor.Board member since 2002.Chairman of the Personnel Committee and member of the Corporate Governance and Nomination Committee.
Degree in Economics and Business Administration (Stockholm School of Economics).
Executive Director, with mergers and acquisitions advisory responsibilities, at Enskilda M&A, Enskilda Securities (London) 1986–1992. Corporate strategy consultant at the Boston Consulting Group (London) 1979–1986.
Member of the Board of Directors of IKANO Holdings S.A.
Risto Siilasmaa, b. 1966
Board member since May 8, 2008. Member of the Audit Committee.
Studies at Helsinki University of Technology, Depart-ment of Industrial Engineering and Management.
President and CEO of F-Secure Corporation 1988–2006.
Chairman of the Boards of Directors of F-Secure Cor-poration, Elisa Corporation, and Fruugo Inc. Member of the Boards of Directors of Blyk Ltd, Ekahau Inc., Efecte Corp., Nexit Ventures Oy and Valimo Wire-less Oy. Vice Chairman of the Boards of Directors of The Federation of Finnish Technology Industries and Finnish-American Chamber of Commerce, member of the Board of Directors of Confederation of Finn-ish Industries EK, member of the advisory boards of Communications Administration at Ministry of Transport and Communications in Finland, Helsinki University of Economics and Helsinki University of Technology.
Keijo Suila, b. 1945 Board member since 2006.Member of the Audit Committee.
B.Sc. (Economics and Business Administration) (Helsinki University of Economics and Business Administration).
President and CEO of Finnair Plc 1999–2005. Chair-man of oneworld airline alliance 2003–2004 and member of various international aviation and air transportation associations 1999–2005. Holder of various executive positions, including Vice Chairman and Executive Vice President, at Huhtamäki Oyj, Leaf Group and Leaf Europe 1985–1998.
Chairman of the Boards of Directors of Solidium Oy and The Finnish Fair Corporation. Vice Chairman of the Board of Directors of Kesko Corporation.
Vesa Vainio, member of the Board since 1993, served as a member of the Board of Directors until the Annual General Meeting on May 8, 2008, but did not stand for re-election.
Proposal of the Corporate Governance and Nomination Committee for Composition of the Board of Directors
On January 22, 2009, the Corporate Governance and Nomination Committee announced its proposal to the Annual General Meeting convening on April 23,
2009 regarding the composition of the Board of Directors for a one-year term as from the Annual General Meeting in 2009 until the close of the Annual General Meeting in 2010. The Committee will propose to the Annual General Meeting that the number of Board members be 11 and that all current Board members be re-elected: Georg Ehrnrooth, Lalita D. Gupte, Bengt Holmström, Henning Kagermann, Olli-Pekka Kallasvuo, Per Karlsson, Jorma Ollila, Marjorie Scardino, Risto Siilasmaa and Keijo Suila. Moreover, the Committee will propose that Isabel Marey-Sem-per be elected as a new member of the Board for the same term as from the Annual General Meeting in 2009 until the close of the Annual General Meeting in 2010. Isabel Marey-Semper is Chief Financial Officer, EVP responsible for Strategy at PSA Peugeot Citroën.
Subject to the requirements of Finnish law, the independent directors of the new Board will elect a Chairman and a Vice Chairman from among the Board members upon the recommendation of the Corporate Governance and Nomination Committee. The independent directors of the new Board will also confirm the election of the members and Chairmen for the Board’s Committees from among the Board’s independent directors upon the recommenda-tion of the Corporate Governance and Nomination Committee and based on each committee’s member qualification standards. These elections will take place at the Board’s assembly meeting following the Annual General Meeting.
On January 22, 2009, the Corporate Governance and Nomination Committee announced that it will propose at the assembly meeting of the new Board of Directors after the Annual General Meeting on April 23, 2009 that Jorma Ollila be elected as Chair-man of the Board and Dame Marjorie Scardino as Vice Chairman of the Board.

72 Nokia in 2008
Corporate governance
Pursuant to the provisions of the Finnish Companies Act and Nokia’s Articles of Association, the control and management of Nokia is divided among the share-holders at a general meeting, the Board of Directors (or the “Board”), the President and the Group Execu-tive Board chaired by the Chief Executive Officer.
Under its Articles of Association, in addition to the Board of Directors, Nokia has a Group Executive Board, which is responsible for the operative manage-ment of the Group. The Chairman and members of the Group Executive Board are appointed by the Board of Directors. Only the Chairman of the Group Executive Board can be a member of both the Board of Directors and the Group Executive Board.
The Board of Directors
The operations of the company are managed under the direction of the Board of Directors, within the framework set by the Finnish Companies Act and Nokia’s Articles of Association as well as any comple-mentary rules of procedure as defined by the Board, such as the Corporate Governance Guidelines and related Board Committee charters.
The responsibilities of the Board of Directors
The Board represents and is accountable to the share-holders of the company. The Board’s responsibilities are active, not passive, and include the responsibility regularly to evaluate the strategic direction of the company, management policies and the effective-ness with which management implements them. The Board’s responsibilities further include overseeing the structure and composition of the company’s top management and monitoring legal compliance and the management of risks related to the company’s operations. In doing so the Board may set annual ranges and/or individual limits for capital expendi-tures, investments and divestitures and financial com-mitments not to be exceeded without Board approval.
The Board has the responsibility for appointing and discharging the Chief Executive Officer and the other members of the Group Executive Board. Subject to the requirements of Finnish law, the independent directors of the Board confirm the compensation and the employment conditions of the Chief Executive Officer upon the recommendation of the Personnel Committee. The compensation and employment con-ditions of the other members of the Group Executive Board are approved by the Personnel Committee upon the recommendation of the Chief Executive Officer.
The basic responsibility of the members of the Board is to act in good faith and with due care so as to exercise their business judgment on an informed basis in what they reasonably and honestly believe to be in the best interests of the company and its shareholders. In discharging that obligation, the directors must inform themselves of all relevant
information reasonably available to them. The Board and each Board Committee also have the power to hire independent legal, financial or other advisors as they deem necessary.
The Board conducts annual performance self-evaluations, which also include evaluations of the Board Committees’ work, the results of which are discussed by the Board. In 2008, the self-evaluation process consisted of a questionnaire and a one-to-one discussion between the Chairman and each director, followed by a discussion by the entire Board of the outcome of the evaluation, possible measures to be taken, as well as measures taken based on the Board’s self-evaluation of the previous year.
Election, composition and meetings of the Board of Directors
Pursuant to the Articles of Association, Nokia Corpora-tion has a Board of Directors composed of a minimum of seven and a maximum of 12 members. The mem-bers of the Board are elected for a term of one year at each Annual General Meeting, i.e., as from the close of that Annual General Meeting until the close of the following Annual General Meeting, which convenes each year by June 30. The Annual General Meeting held on May 8, 2008 elected ten members to the Board of Directors. The members of the Board of Directors elected by the Annual General Meeting in 2008 are Georg Ehrnrooth, Lalita D. Gupte, Dr. Bengt Holmström, Dr. Henning Kagermann, Olli-Pekka Kallasvuo, Per Karlsson, Jorma Ollila, Dame Marjorie Scardino, Risto Siilasmaa and Keijo Suila.
Subject to the requirements of Finnish law, the independent directors of the Board elect the Chair-man and the Vice Chairman from among the Board members upon the recommendation of the Corporate Governance and Nomination Committee. On May 8,
2008, the independent directors of the Board elected that Jorma Ollila should continue to act as Chair-man and that Marjorie Scardino should continue to act as Vice Chairman of the Board. The independent directors of the Board also confirm the election of the members and Chairmen for the Board’s Committees from among the Board’s independent directors upon the recommendation of the Corporate Governance and Nomination Committee and based on each commit-tee’s member qualification standards.
The current members of the Board are all non-executive, except the President and CEO who is also a member of the Board. In January 2009, the Board determined that the non-executive Board members are all independent as defined under Finnish rules, ex-cept the Chairman of the Board, Jorma Ollila. Also, the Board determined that seven of the Board’s ten mem-bers are “independent directors”, as defined in the New York Stock Exchange’s Listed Company Manual. In addition to the Chairman of the Board and the Presi-dent and CEO, Bengt Holmström was determined not to be independent under the NYSE standards due to a
family relationship with an executive officer of a Nokia supplier of whose consolidated gross revenue from Nokia accounts for an amount that exceeds the limit provided in the NYSE standards, but that is less than 4%. The executive member of the Board, Olli-Pekka Kallasvuo, President and CEO, was determined not independent under both Finnish rules and the NYSE standards. The Chairman of the Board, Jorma Ollila, who was the Chairman and CEO until June 1, 2006, will be independent as from June 1, 2009, in accordance with both Finnish rules and the NYSE standards.
The Board has determined that the majority of the members of the Audit Committee, including its Chairman, Georg Ehrnrooth, are “audit committee financial experts” as defined in Item 16A of Form 20-F.
The Board held 11 meetings during 2008. The average ratio of attendance at the meetings was 98% and all directors attended more than 90% of the meetings of the Board. The non-executive directors meet without management at regularly scheduled sessions twice a year and at such other times as they deem appropriate, in practice in connection with each regularly scheduled meeting in 2008. Such sessions were chaired by the non-executive Chairman of the Board or, in his absence, the non-executive Vice Chairman of the Board. In addition, the independent directors meet separately at least once annually, and did so in 2008.
The Corporate Governance Guidelines concerning the directors’ responsibilities, the composition and selection of the Board, Board Committees and certain other matters relating to corporate governance are available on Nokia’s website, www.nokia.com.
Committees of the Board of Directors
The Audit Committee consists of a minimum of three members of the Board who meet all applicable inde-pendence, financial literacy and other requirements of Finnish law and the rules of the stock exchanges where Nokia shares are listed, including NASDAQ
OMX Helsinki and the New York Stock Exchange. Since May 8, 2008, the Audit Committee consists of the fol-lowing four members of the Board: Georg Ehrnrooth (Chairman), Lalita D. Gupte, Risto Siilasmaa and Keijo Suila.
The Audit Committee is established by the Board primarily for the purpose of overseeing the account-ing and financial reporting processes of the company and audits of the financial statements of the company. The Committee is responsible for assisting the Board’s oversight of (1) the quality and integrity of the com-pany’s financial statements and related disclosure, (2) the statutory audit of the company’s financial statements, (3) the external auditor’s qualifications and independence, (4) the performance of the exter-nal auditor subject to the requirements of Finnish law, (5) the performance of the company’s internal controls and risk management and assurance function, (6) the performance of the internal audit function, and (7) the
Corporate governance 73
Corporate governance
company’s compliance with legal and regulatory requirements. The Committee also maintains proce-dures for the receipt, retention and treatment of com-plaints received by the company regarding account-ing, internal controls, or auditing matters and for the confidential, anonymous submission by employees of the company of concerns regarding accounting or auditing matters. Nokia’s disclosure controls and pro-cedures, which are reviewed by the Audit Committee and approved by the Chief Executive Officer and the Chief Financial Officer, as well as Nokia’s internal con-trols over financial reporting, are designed to provide reasonable assurance regarding the quality and integ-rity of the company’s financial statements and related disclosures. The Disclosure Committee chaired by Chief Financial Officer is responsible for preparation of the quarterly and annual results announcements, and the process includes involvement by business managers, business controllers and other functions, like internal audit, as well as a final review and confirmation by the Audit Committee and the Board.
Under Finnish law, Nokia’s external auditor is elected by its shareholders by a simple majority vote at the Annual General Meeting for one fiscal year at a time. The Audit Committee makes a proposal to the shareholders in respect of the appointment of the external auditor based upon its evaluation of the qualifications and independence of the auditor to be proposed for election or re-election. Also under Finn-ish law, the fees of the external auditor are approved by Nokia’s shareholders by a simple majority vote at the Annual General Meeting. The Committee makes a proposal to the shareholders in respect of the fees of the external auditor, and approves the external audi-tor’s annual audit fees under the guidance given by the shareholders at the Annual General Meeting. For information about the fees paid to Nokia’s external auditor, PricewaterhouseCoopers, during 2008 see “Auditor fees and services” on page 87.
The Audit Committee meets at least four times a year based upon a schedule established at the first meeting following the appointment of the Committee. The Committee meets separately with the representa-tives of Nokia’s management, head of the internal audit function, and the external auditor in connection with each regularly scheduled meeting. The head of the internal audit function has at all time direct ac-cess to the Audit Committee, without involvement of management.
The Audit Committee had seven meetings in 2008. The average ratio of attendance at the meetings was 96%. Three members of the Committee attended 100% of the Committee meetings and one member attended 85% of the meetings.
The Personnel Committee consists of a minimum of three members of the Board who meet all applicable independence requirements of Finnish law and the rules of the stock exchanges where Nokia shares are listed, including NASDAQ OMX Helsinki and the New York Stock Exchange. Since May 8, 2008, the Personnel
Committee consists of the following three members of the Board: Per Karlsson (Chairman), Henning Kager-mann and Marjorie Scardino.
The primary purpose of the Personnel Commit-tee is to oversee the personnel policies and practices of the company. It assists the Board in discharging its responsibilities relating to all compensation, including equity compensation, of the company’s executives and the terms of employment of the same. The Committee has overall responsibility for evaluat-ing, resolving and making recommendations to the Board regarding (1) compensation of the company’s top executives and their employment conditions, (2) all equity-based plans, (3) incentive compensa-tion plans, policies and programs of the company affecting executives and (4) other significant incentive plans. The Committee is responsible for overseeing compensation philosophy and principles and ensuring the above compensation programs are performance-based, properly motivate management, support overall corporate strategies and are aligned with shareholders’ interests. The Committee is responsible for the review of senior management development and succession plans.
The Personnel Committee had three meetings in 2008. The attendance ratio at the meetings was 100%. For further information on the activities of the Personnel Committee, see “Executive compensation philosophy, programs and decision-making process” on page 75.
The Corporate Governance and Nomination Com-mittee consists of three to five members of the Board who meet all applicable independence requirements of Finnish law and the rules of the stock exchanges where Nokia shares are listed, including NASDAQ OMX Helsinki and the New York Stock Exchange. Since May 8, 2008, the Corporate Governance and Nomination Committee consists of the following three members of the Board: Marjorie Scardino (Chairman), Georg Ehrnrooth and Per Karlsson.
The Corporate Governance and Nomination Com-mittee’s purpose is (1) to prepare the proposals for the general meetings in respect of the composition of the Board and the director remuneration to be ap-proved by the shareholders and (2) to monitor issues and practices related to corporate governance and to propose necessary actions in respect thereof.
The Committee fulfills its responsibilities by (i) actively identifying individuals qualified to become members of the Board, (ii) proposing to the share-holders the director nominees for election at the Annual General Meetings, (iii) monitoring significant developments in the law and practice of corporate governance and of the duties and responsibilities of directors of public companies, (iv) assisting the Board and each Committee of the Board in its annual perfor-mance self-evaluations, including establishing criteria to be used in connection with such evaluations, (v) developing and recommending to the Board and ad-ministering Nokia’s Corporate Governance Guidelines,
and (vi) reviewing the company’s disclosure in the Corporate Governance Statement.
The Corporate Governance and Nomination Com-mittee had four meetings in 2008. The attendance ratio at the meetings was 100%.
The charters of each of the committees are available on Nokia’s website, www.nokia.com.
Management and corporate governance practices
Nokia has a Code of Conduct which is equally ap-plicable to all of Nokia’s employees, directors and management and is accessible on Nokia’s website, www.nokia.com. In addition, Nokia has a Code of Ethics for the Principal Executive Officers and the Senior Financial Officers. For more information about Nokia’s Code of Ethics, please see www.nokia.com.
Nokia’s corporate governance practices comply with the Finnish Corporate Governance Code approved by the boards of the Finnish Securities Market Associa-tion and NASDAQ OMX Helsinki effective as of Janu-ary 1, 2009. The Finnish Corporate Governance Code is accessible, among others, at www.cgfinland.fi.
Internal audit function
Nokia has an internal audit function that acts as an independent appraisal function by examining and evaluating the adequacy and effectiveness of the company’s system of internal control.
Internal audit resides within the CFO’s organiza-tion and also reports to the Audit Committee of the Board of Directors. The head of internal audit function has at all times direct access to the Audit Committee, without involvement of the management.

74 Nokia in 2008
Corporate governance
Compensation of the members of the Board of Directors and the Group Executive Board
Board of Directors
The following table sets forth the annual remunera-tion of the members of the Board of Directors based on their positions on the Board and its committees, including the remuneration paid to the President and CEO for his duties as a member of the Board of Direc-tors only, as resolved at the respective Annual General Meetings in 2008, 2007 and 2006.
Position, EUR 2008 2007 2006
Chairman 440 000 375 000 375 000
Vice Chairman 150 000 150 000 137 500
Member 130 000 130 000 110 000
Chairman of Audit Committee 25 000 25 000 25 000
Member of Audit Committee 10 000 10 000 10 000
Chairman of Personnel Committee 25 000 25 000 25 000
Remuneration total 1 710 000 1 775 000 1 472 500
Non-executive members of the Board of Directors do not receive stock options, performance shares, restricted shares or other variable compensation for their duties as Board members. In addition, no meet-ing fees are payable. However, it is Nokia policy that a significant portion of director remuneration is paid in the form of Nokia shares, and in alignment therewith, approximately 40% of the annual remuneration pay-able to the members of Board of Directors has been paid in Nokia shares purchased from the market. The President and CEO receives variable compensation for his executive duties, but not for his duties as a member of the Board of Directors. Total compensation of the President and CEO is described in “Summary compensation table 2008” on page 77.
When preparing the Board of Directors’ remu-neration proposal, it is the policy of the Corporate
Governance and Nomination Committee of the Board to review and compare the remuneration levels and their criteria paid in other global companies with net sales and business complexity comparable to that of Nokia. The Committee’s aim is to ensure that Nokia has an efficient Board of world-class professionals representing an appropriate and diverse mix of skills and experience. A competitive Board remuneration contributes to Nokia’s achievement of this target.
The remuneration of the Board of Directors is resolved annually by Nokia’s Annual General Meet-ing by a simple majority of the shareholders’ votes represented at the meeting, upon proposal by the Corporate Governance and Nomination Committee. The remuneration is resolved for the period as from the respective Annual General Meeting until the close of the next Annual General Meeting.
Remuneration of the Board of Directors in 2008For the year ended December 31, 2008, the aggregate remuneration paid to the members of the Board of Directors for their services as members of the Board and its committees, was EUR 1 710 000.
The following table sets forth the total annual remuneration paid to the members of the Board of Directors in 2008, as resolved by the shareholders at the Annual General Meeting on May 8, 2008. For infor-mation with respect to the Nokia shares and equity awards held by the members of the Board of Directors, please see “Share ownership” on page 80.
Change in pension Non-equity value and Fees incentive non-qualified earned plan deferred All other or paid Stock Option compen- compensation compen- in cash 1 awards 2 awards 2 sation 2 earnings 2 sation 2 Total Year EUR EUR EUR EUR EUR EUR EUR
Jorma Ollila, Chairman 3 2008 440 000 — — — — — 440 000
Marjorie Scardino, Vice Chairman 4 2008 150 000 — — — — — 150 000
Georg Ehrnrooth 5 2008 155 000 — — — — — 155 000
Lalita D. Gupte 6 2008 140 000 — — — — — 140 000
Bengt Holmström 2008 130 000 — — — — — 130 000
Olli-Pekka Kallasvuo 7 2008 130 000 — — — — — 130 000
Henning Kagermann 2008 130 000 — — — — — 130 000
Per Karlsson 8 2008 155 000 — — — — — 155 000
Risto Siilasmaa 9 2008 140 000 — — — — — 140 000
Keijo Suila 10 2008 140 000 — — — — — 140 000
1 Approximately 60% of each Board member’s annual remunera-tion is paid in cash and the remaining 40% in Nokia shares purchased from the market.
2 Not applicable to any non-executive member of the Board of Directors.
3 The 2008 fee of Mr. Ollila was paid for his services as Chairman of the Board.
4 The 2008 fee of Ms. Scardino was paid for her services as Vice Chairman of the Board.
5 The 2008 fee paid to Mr. Ehrnrooth amounted to a total of EUR 155 000, consisting of a fee of EUR 130 000 for services as a member of the Board and EUR 25 000 for services as Chairman of the Audit Committee.
6 The 2008 fee paid to Ms. Gupte amounted to a total of EUR 140 000, consisting of a fee of EUR 130 000 for services as a member of the Board and EUR 10 000 for services as a member of the Audit Committee.
7 This table includes remuneration paid to Mr. Kallasvuo, President and CEO, for his services as a member of the Board only. For the compensation paid for his services as the President and CEO, see “Summary compensation table 2008” on page 77.
8 The 2008 fee paid to Mr. Karlsson amounted to a total of EUR 155 000, consisting of a fee of EUR 130 000 for services as a member of the Board and EUR 25 000 for services as Chairman of the Personnel Committee.
9 The 2008 fee paid to Mr. Siilasmaa amounted to a total of EUR 140 000, consisting of a fee of EUR 130 000 for services as a member of the Board and EUR 10 000 for services as a member of the Audit Committee.
10 The 2008 fee paid to Mr. Suila amounted to a total of EUR 140 000, consisting of a fee of EUR 130 000 for services as a member of the Board and EUR 10 000 for services as a member of the Audit Committee.
Corporate governance 75
Corporate governance
Proposal of the Corporate Governance and Nomination Committee for remuneration to the Board of Directors
On January 22, 2009, the Corporate Governance and Nomination Committee of the Board announced that it will propose to the Annual General Meeting to be held on April 23, 2009 that the annual remuneration pay-able to the Board members elected at the same meet-ing for the term until the close of the Annual General Meeting in 2010 be unchanged from 2008 as follows: EUR 440 000 for the Chairman, EUR 150 000 for the Vice Chairman and EUR 130 000 for each member; for the Chairman of the Audit Committee and the Chairman of the Personnel Committee an additional annual fee of EUR 25 000; and for each member of the Audit Commit-tee an additional annual fee of EUR 10 000. Further, the Committee will propose that approximately 40% of the remuneration be paid in Nokia shares purchased from the market.
Executive compensation
Executive compensation philosophy, programs and decision-making process
Our executive compensation philosophy and programs have been developed to enable Nokia to effec-tively compete in an extremely complex and rapidly evolving mobile communications industry. Nokia is a leading company in its industry and conducts business globally. Nokia’s executive compensation programs have been designed to attract, retain and motivate talented executive officers that drive Nokia’s success and industry leadership worldwide.
Nokia’s compensation program for executive officers includes:
» competitive base pay rates; and
» short- and long-term incentives that are intended to result in a competitive total compensation package.
The objectives of Nokia’s executive compensation programs are to:
» attract and retain outstanding executive talent;
» deliver a significant amount of performance- related variable compensation for the achieve-ment of both short- and long-term stretch goals;
» appropriately balance rewards between both Nokia’s and an individual’s performance; and
» align the interests of the executive officers with those of the shareholders through long-term incentives in the form of equity-based awards.
The competitiveness of Nokia’s executive compensa-tion levels and practices is one of several key factors the Personnel Committee of the Board (the “Person-nel Committee”) considers in its determination of
compensation for Nokia executives. The Personnel Committee compares, on an annual basis, Nokia’s compensation practices, base salaries and total compensation, including short- and long-term incen-tives against those of other relevant companies with the same or similar revenue size, global reach and complexity that Nokia believes it competes against for executive talent. The relevant companies include high technology telecommunications companies, Internet services companies, and companies from other industries that are headquartered in Europe and the United States.
The Personnel Committee retains and uses an external consultant from Mercer Human Resources to obtain benchmark data and information on current market trends. The consultant works directly for the Chairman of the Personnel Committee and meets annually with the Personnel Committee, without management present, to provide an assessment of the competitiveness and appropriateness of Nokia’s execu-tive pay levels and programs. Management provides the consultant with information with regard to Nokia’s programs and compensation levels for preparation in meeting with the Committee. The consultant of Mercer Human Resources that works for the Personnel Com-mittee is independent of Nokia and does not have any other business relationships with Nokia.
The Personnel Committee reviews the executive officers’ compensation on an annual basis and from time to time during the year, when special needs arise. Without management present, the Personnel Committee reviews and recommends to the Board the corporate goals and objectives relevant to the compensation of the President and CEO, evaluates the performance of the President and CEO in light of those goals and objectives, and proposes to the Board the compensation level of the President and CEO, which is confirmed by the independent members of the Board. Management’s role is to provide any information requested by the Personnel Committee to assist in their deliberations.
In addition, upon recommendation of the Presi-dent and CEO, the Personnel Committee approves all compensation for all the members of the Group Execu-tive Board (excluding that of the President and CEO of Nokia and Simon Beresford-Wylie, Chief Executive Officer of Nokia Siemens Networks) and other direct reports to the President and CEO, including long-term equity incentives and goals and objectives relevant to compensation. The Personnel Committee also reviews the results of the evaluation of the performance of the Group Executive Board members (excluding the President and CEO and Mr. Beresford-Wylie) and other direct reports to the President and CEO and approves their incentive compensation based on such evalu-ation. Mr. Beresford-Wylie’s compensation as CEO of Nokia Siemens Networks is evaluated and approved by the Board of Directors of Nokia Siemens Networks. The Personnel Committee is apprised annually on actions taken with respect to Mr. Beresford-Wylie’s compensation.
The Personnel Committee considers the following factors, among others, in its review when determining the compensation of Nokia’s executive officers:
» The compensation levels for similar positions (in terms of scope of position, revenues, number of employees, global responsibility and reporting relationships) in relevant comparison companies;
» The performance demonstrated by the executive officer during the last year;
» The size and impact of the role on Nokia’s overall performance and strategic direction;
» The internal comparison to the compensation levels of the other executive officers of Nokia; and
» Past experience and tenure in role.
The above factors are assessed by the Personnel Com-mittee in totality.
The compensation for Mr. Beresford-Wylie is de-termined by the Board of Directors of Nokia Siemens Networks based on the same factors as for the other members of the Group Executive Board of Nokia and determined in a similar process.
Components of executive compensationOur compensation program for executive officers includes annual cash compensation in the form of a base salary, short-term cash incentives and long-term equity-based incentive awards in the form of perfor-mance shares, stock options and restricted shares.
Annual cash compensationBase salaries are targeted at globally competitive market levels.
Short-term cash incentives are tied directly to performance and represent a significant portion of an executive officer’s total annual cash compensation. The short-term cash incentive opportunity is expressed as a percentage of the executive officer’s annual base salary. These award opportunities and measurement criteria are presented in the table below.
Measurement criteria for the short-term cash incentive plan include those financial objectives that are considered important measures of Nokia’s success in driving increased shareholder value. Financial ob-jectives are established which are based on a number of factors and are intended to be stretch targets that, when achieved, Nokia believes, will result in perfor-mance that will exceed that of Nokia’s key competi-tors in the high technology, telecommunications and Internet services industries. The target setting, as well as the weighting of each measure, also requires the Personnel Committee’s approval. The following table reflects the measurement criteria that are established for the President and CEO and members of the Group Executive Board and the relative weighting of each objective for the year 2008.
76 Nokia in 2008
Corporate governance
Incentive as a % of annual base salary in 2008
Minimum Target MaximumPosition performance, % performance, % performance, % Measurement criteria
President and CEO 0 100 225 (a) Financial Objectives (includes targets for net sales, operating profit and operating cash flow)
0 25 37.5 (c) Total Shareholder Return 1 (comparison made with key competitors in the high technology, telecommunications and Internet services industries over one, three and five year periods)
0 25 37.5 (d) Strategic Objectives
Total 0 150 300
Group Executive Board 0 75 168.75 (a) Financial Objectives (includes targets for net sales, operating profit and operating cash flow); and
(b) Individual Strategic Objectives (as described below)
0 25 37.5 (c) Total Shareholder Return 1, 2 (comparison made with key competitors in the high technology, telecommunications and Internet services industries over one, three and five year periods)
Total 0 100 206.25
1 Total shareholder return reflects the change in Nokia’s share price during a respective time period added with the value of dividends per share paid during the said period, divided by Nokia’s share price at the beginning of the period. The calcula-tion is the same also for each company in the said peer group.
2 Only some members of the Group Executive Board are eligible for the additional 25% total shareholder return element.
The incentive payout is based on performance relative to targets set for each measurement criteria listed in the table above and includes: (1) a comparison of Nokia’s actual performance to pre-established targets for net sales, operating profit and operating cash flow and (2) a comparison of each executive officer’s indi-vidual performance to his/her predefined individual strategic objectives and targets. Individual strategic objectives include market share, quality, technology innovation, new product revenue, customer reten-tion rates, environmental achievements and other objectives of key strategic importance which require a discretionary assessment of performance by the Personnel Committee.
When determining the final incentive payout, the Personnel Committee determines an overall score for each executive based on the degree to which (a) Nokia’s financial objectives have been achieved to-gether with (b) qualitative scores assigned to the indi-vidual strategic objectives. The final incentive payout is determined by multiplying each executive’s eligible salary by: (i) his/her incentive target percent; and (ii) the score resulting from the above-mentioned factors (a) and (b). The resulting score for each executive is then multiplied by an “affordability factor,” which is determined based on overall sales, profita bility and cash flow of Nokia. The Personnel Committee may ap-ply discretion when evaluating actual results against targets and the resulting incentive payouts. In certain exceptional situations, the actual short-term cash in-centive awarded to the executive officer could be zero. The maximum payout is only possible with maximum performance on all measures.
The portion of the short-term cash incentives that is tied to (a) Nokia’s financial objectives and (b) individual strategic objectives and targets is paid twice each year based on the performance for each of
Nokia’s short-term plans that end on June 30 and De-cember 31 of each year. Another portion of the short-term cash incentives is paid annually at the end of the year, based on the Personnel Committee’s assessment of (c) Nokia’s total shareholder return compared to key competitors in the high technology and telecom-munications industries and relevant market indices over one-, three- and five-year periods. In the case of the President and CEO, the annual incentive award is also partly based on his performance compared against (d) strategic leadership objectives, including entry into new markets and services, and executive development.
Instead of Nokia’s short-term cash incentive plan, Simon Beresford-Wylie participates in a short-term cash incentive plan sponsored by Nokia Siemens Networks, which is similar to Nokia’s plan.
For more information on the actual cash compen-sation paid in 2008 to Nokia’s executive officers, see “Summary compensation table 2008” on page 77.
Long-term equity-based incentivesLong-term equity-based incentive awards in the form of performance shares, stock options and restricted shares are used to align executive officers interests with shareholders’ interests, reward performance and encourage retention. These awards are determined on the basis of the factors discussed in “Executive compensation philosophy, programs and decision-making process” on page 75, including a comparison of the executive officer’s overall compensation with that of other executives in the relevant market and the impact on the competitiveness of the executive’s compensation package in that market. Performance shares are Nokia’s main vehicle for long-term equity-based incentives and reward the achievement of both Nokia’s long-term financial results and an increase in
share price. Performance shares vest as shares, if at least one of the pre-determined threshold perfor-mance levels, tied to Nokia’s financial performance, is achieved by the end of the performance period and the value is dependent on Nokia’s share price. Stock options are granted to fewer employees that are in more senior and executive positions. Stock options create value for the executive officer, once vested, if the Nokia share price is higher than the exercise price of the stock option established at grant, thereby align-ing the interests of the executives with those of the shareholders. Restricted shares are used primarily for retention purposes and they vest fully after the close of a pre-determined restriction period. These equity-based incentive awards are generally forfeited if the executive leaves Nokia prior to vesting.
Instead of the long-term equity-based incentive plans of Nokia, Simon Beresford-Wylie participates in a long-term cash incentive plan sponsored by Nokia Siemens Networks. The long-term cash incentive plan of Nokia Siemens Networks is designed to align the interests of Nokia Siemens Networks executives with increased shareholder value of Nokia Siemens Networks and, ultimately, with increased shareholder value for that of its owners, including Nokia and its shareholders. The plan provides Nokia Siemens Networks executives an opportunity to earn cash in-centives based on the achievement of pre-determined financial goals, including net sales and operating margin. These long-term cash incentive awards of Nokia Siemens Networks are generally forfeited if the executive leaves employment prior to the end of the plan period.
Information on the actual equity-based incen-tives granted to the members of Nokia’s Group Executive Board is included in “Share ownership” on page 80.
Corporate governance 77
Corporate governance
Actual executive compensation for 2008
At December 31, 2008, Nokia had a Group Executive Board consisting of 12 members. The only changes in the membership of Nokia’s Group Executive Board during 2008 were due to the retirement of Veli Sund-bäck, Executive Vice President, Corporate Relations and Responsibility, from the Group Executive Board as of December 31, 2008 and the appointment of Esko Aho as a new member of Nokia’s Group Executive Board, effective January 1, 2009.
The following tables summarize the aggregate cash compensation paid and the long-term equity-based incentives granted to the members of the Group Executive Board under Nokia’s equity plans in 2008.
Gains realized upon exercise of stock options and share-based incentive grants vested for the members of the Group Executive Board during 2008 are included in “Stock option exercises and settlement of shares” on page 86.
Aggregate cash compensation to the Group Executive Board for 2008
Number of Cash members Base incentive December 31, salaries payments 1, 2
Year 2008 EUR EUR
2008 12 6 146 393 2 713 174
1 The equity-based incentive grants are generally forfeited if the employment relationship terminates with Nokia prior to vesting. The settlement is conditional upon performance and service con-ditions, as determined in the relevant plan rules. For a description of Nokia’s equity plans, see Note 22 “Share-based payment” to Nokia’s consolidated financial statements on page 31.
2 At maximum performance, the settlement amounts to four times the number at threshold.
1 Includes base salary and cash incentives for the 2008 calendar year paid or payable by Nokia for the respective fiscal year. The cash incentives are paid as a percentage of annual base salary based on Nokia’s short-term cash incentives.
2 Excluding any gains realized upon exercise of stock options, which are described in “Stock option exercises and settlement of shares” on page 86.
Long-term equity-based incentives granted in 2008 1
Group Executive Total number Board Total of participants
Performance shares at threshold 2 173 500 2 463 033 6 300
Stock options 347 000 3 767 163 3 500
Restricted shares 230 000 1 746 500 300
1 The positions set forth in this table are the current positions of the named executive. Mr. Kallasvuo was President and COO until June 1, 2006. Until December 31, 2007, Mr. Vanjoki served as Executive Vice President and General Manager of Multimedia; Ms. McDowell, Executive Vice President and General Manager of Enterprise Solutions. Mr. Beresford-Wylie served as Executive Vice President and General Manager Networks until April 1, 2007.
2 Bonus payments are part of Nokia’s short-term cash incentives. The amount consists of the bonus awarded and paid or payable by Nokia for the respective fiscal year and in the case of Mr. Beresford-Wylie payable by Nokia Siemens Networks on the basis of Nokia Siemens Networks’ short-term cash incentive program.
Summary compensation table 2008
Change in pension Non-equity value and incentive non-qualified plan deferred All otherName and Stock Option compen- compensation compen-principal Salary Bonus 2 awards 3 awards 3 sation earnings sation Totalposition 1 Year ** EUR EUR EUR EUR EUR EUR EUR EUR
Olli-Pekka Kallasvuo 2008 1 144 800 721 733 644 805 641 565 * 469 060 4, 5 175 164 7 3 797 126President and CEO 2007 1 037 619 2 348 877 4 112 581 693 141 * 956 333 183 603 9 332 153 2006 898 413 664 227 1 529 732 578 465 * 1 496 883 38 960 5 206 680
Richard Simonson 2008 8 630 263 293 477 204 952 204 045 106 632 9 1 439 369EVP and Chief Financial Officer 2007 8 488 422 827 333 1 576 376 234 310 * 46 699 3 173 141 2006 8 460 070 292 673 958 993 194 119 * 84 652 1 990 507
Simon Beresford-WylieCEO, Nokia Siemens Networks 2008 600 000 462 871 221 407 74 500 * 108 658 4 728 778 10 2 196 215
Anssi Vanjoki 2008 615 143 260 314 208 880 204 343 * 6 33 552 11 1 322 232EVP, Head of Markets 2007 556 381 900 499 1 602 605 239 829 * 18 521 49 244 3 367 078 2006 505 343 353 674 938 582 222 213 * 215 143 29 394 2 264 349
Mary McDowell 2008 8 493 798 196 138 203 123 197 726 * 33 462 12 1 124 247EVP, Chief Development Officer 2007 8 444 139 769 773 1 551 482 396 169 * 32 463 3 194 027 2006 8 466 676 249 625 786 783 213 412 * 45 806 1 762 302
3 Amounts shown represent share-based compensation expense recognized in the respective fiscal year for all outstanding equity grants in accordance with IFRS 2, Share-based payment.
4 The change in pension value represents the proportionate change in the liability related to the individual executive. These executives are covered by the Finnish State employees’ pen-sion act (“TyEL”) that provides for a retirement benefit based on years of service and earnings according to the prescribed statutory system. The TyEL system is a partly funded and a partly pooled “pay as you go” system. Effective March 1, 2008, Nokia transferred its TyEL pension liability and assets to an external Finnish insurance company and no longer carries the liability on its financial statements. The figures shown represent only the
change in liability for the funded portion. The method used to derive the actuarial IFRS valuation is based upon salary informa-tion at the respective year-end. Actuarial assumptions including salary increases and inflation have been determined to arrive at the valuation at the respective year-end.
5 The change in pension value for Mr. Kallasvuo includes EUR 4 811 for the proportionate change in the liability related to the individual under the funded part of the Finnish TyEL pension (see footnote 4 above). In addition, it includes EUR 464 249 for the change in liability in the early retirement benefit at the age of 60 provided under his service contract. Nokia still carries the liability on its books for the early retirement benefit.

78 Nokia in 2008
6 Mr. Vanjoki’s proportionate change in the liability related to the individual under the funded part of the Finnish TyEL pension (see footnote 4) was negative.
7 All other compensation for Mr. Kallasvuo in 2008 includes: EUR 130 000 for his services as member of the Board or Directors, see “Remuneration of the Board of Directors in 2008” on page 74; EUR 20 645 for car allowance, EUR 10 000 for financial counsel-ing, EUR 11 103 for taxable benefit for premiums paid under supplemental medical and disability insurance, EUR 3 416 for driver and for mobile phone.
8 Salaries, benefits and perquisites of Ms. McDowell and Mr. Simon-son are paid and denominated in USD. Amounts were converted to euro using year-end 2008 USD/EUR exchange rate of 1.40. For year 2007 disclosure, amounts were converted to euro using year-end 2007 USD/EUR exchange rate of 1.47.
Corporate governance
9 All other compensation for Mr. Simonson in 2008 includes: EUR 64 405 company contributions to the Restoration & Deferral plan, EUR 11 083 company contributions to the 401(k) plan, EUR 12 156 for car allowance, EUR 11 621 for financial counseling, EUR 7 365 imputed income under the Employee Stock Purchase Plan.
10 All other compensation for Mr. Beresford-Wylie in 2008 includes: EUR 600 000 for a special one-time bonus for the successful re-tention and integration of Nokia Siemens Networks, EUR 105 158 provided as a benefit under Nokia Siemens Networks relocation policy, EUR 13 380 for car allowance, EUR 10 000 for financial counseling, and the remainder for mobile phone.
11 All other compensation for Mr. Vanjoki in 2008 includes: EUR 22 200 for car allowance, EUR 10 000 for financial counsel-ing, EUR 1 112 taxable benefit for premiums paid under supple-mental medical and disability insurance and the remainder for mobile phone.
12 All other compensation for Ms. McDowell in 2008 includes: EUR 12 156 for car allowance, EUR 11 438 for financial counseling and EUR 9 868 company contributions to the 401(k) plan.
* None of the named executive officers participated in a for-mulated, non-discretionary, incentive plan. Annual incentive payments are included under the “Bonus” column.
** History has been provided for those data elements previously disclosed.
1 Including all equity awards made during 2008. Awards were made under the Nokia Stock Option Plan 2007, the Nokia Per-formance Share Plan 2008 and the Nokia Restricted Share Plan 2008, respectively.
2 The fair values of stock options equal the estimated fair value on the grant date, calculated using the Black Scholes model. The stock option exercise price is EUR 19.16. NASDAQ OMX Helsinki closing market price at the grant date was EUR 18.69.
Equity grants in 2008 1
Option awards Stock awards
Number of Performance Performance shares Grant Grant date shares at shares at Restricted Grant date Grant underlying price fair value 2 threshold maximum shares fair value 3
Name and principal position Year date options (EUR) (EUR) (number) (number) (number) (EUR)
Olli-Pekka KallasvuoPresident and CEO 2008 May 9 115 000 19.16 548 153 57 500 230 000 75 000 2 470 858
Richard SimonsonEVP and Chief Financial Officer 2008 May 9 32 000 19.16 152 529 16 000 64 000 22 000 699 952
Simon Beresford-Wylie 4
CEO, Nokia Siemens Networks 2008 — — — — — — — —
Anssi Vanjoki EVP, Head of Markets 2008 May 9 32 000 19.16 152 529 16 000 64 000 22 000 699 952
Mary McDowellEVP, Chief Development Officer 2008 May 9 28 000 19.16 133 463 14 000 56 000 20 000 620 690
3 The fair value of performance shares and restricted shares equals the estimated fair value on grant date. The estimated fair value is based on the grant date market price of the Nokia share less the present value of dividends expected to be paid during the vesting period. The value of performance shares is presented on the basis of a number of shares, which is two times the number at threshold.
4 Mr. Beresford-Wylie does not participate in the equity plans of Nokia. Mr. Beresford-Wylie participates in a long-term cash incentive plan sponsored by Nokia Siemens Networks. His target incentive covering 2008–2010 is EUR 1.5 million.
For information with respect to the Nokia shares and equity awards held by the members of the Group Executive Board, please see “Share ownership” on page 80.
Pension arrangements for the members of the Group Executive Board
The members of the Group Executive Board partici-pate in the local retirement programs applicable to employees in the country where they reside. Execu-tives in Finland participate in the Finnish TyEL pension system, which provides for a retirement benefit based on years of service and earnings according to a prescribed statutory system. Under the Finnish TyEL pension system, base pay, incentives and other tax-able fringe benefits are included in the definition of earnings, although gains realized from equity are not. The Finnish TyEL pension scheme provides for early retirement benefits at age 62 with a reduction in the amount of retirement benefits. Standard retirement benefits are available from age 63 to 68, according to an increasing scale.
Executives in the United States participate in Nokia’s Retirement Savings and Investment Plan.
Under this 401(k) plan, participants elect to make vol-untary pre-tax contributions that are 100% matched by Nokia up to 8% of eligible earnings. 25% of the em-ployer match vests for the participants for each year of their employment. Participants earning in excess of the Internal Revenue Service (IRS) eligible earning limits may participate in the Nokia Restoration and Deferral Plan which allows employees to defer up to 50% of their salary and 100% of their bonus into this non-qualified plan. Contributions to the Restoration and Deferral Plan in excess of IRS deferral limits will be matched 100% up to 8% of eligible earnings less contributions made to the 401(k) plan.
Olli-Pekka Kallasvuo can, as part of his service contract, retire at the age of 60 with full retirement benefits should he be employed by Nokia at the time. The full retirement benefit is calculated as if Mr. Kallas-vuo had continued his service with Nokia through the retirement age of 65.
Simon Beresford-Wylie participates in the Nokia International Employee Benefit Plan (NIEBP). The NIEBP is a defined contribution retirement arrange-ment provided to some Nokia and Nokia Siemens Networks employees on international assignments.
The contributions to NIEBP are funded two-thirds by Nokia and one-third by the employee. Because Mr. Beresford-Wylie also participates in the Finnish TyEL system, the company contribution to NIEBP is 1.3% of annual earnings.
Hallstein Moerk, following his arrangement with a previous employer, has also in his current position at Nokia a retirement benefit of 65% of his pensionable salary beginning at the age of 62. Early retirement is possible at the age of 55 with reduced benefits.
Service contractsOlli-Pekka Kallasvuo’s service contract covers his current position as President and CEO and Chairman of the Group Executive Board. As at December 31, 2008, Mr. Kallasvuo’s annual total gross base salary, which is subject to an annual review by the Board of Directors and confirmation by the independent members of the Board, is EUR 1 176 000. His incentive targets under the Nokia short-term cash incentive plan are 150% of an-nual gross base salary. In case of termination by Nokia for reasons other than cause, including a change of control, Mr. Kallasvuo is entitled to a severance payment of up to 18 months of compensation (both
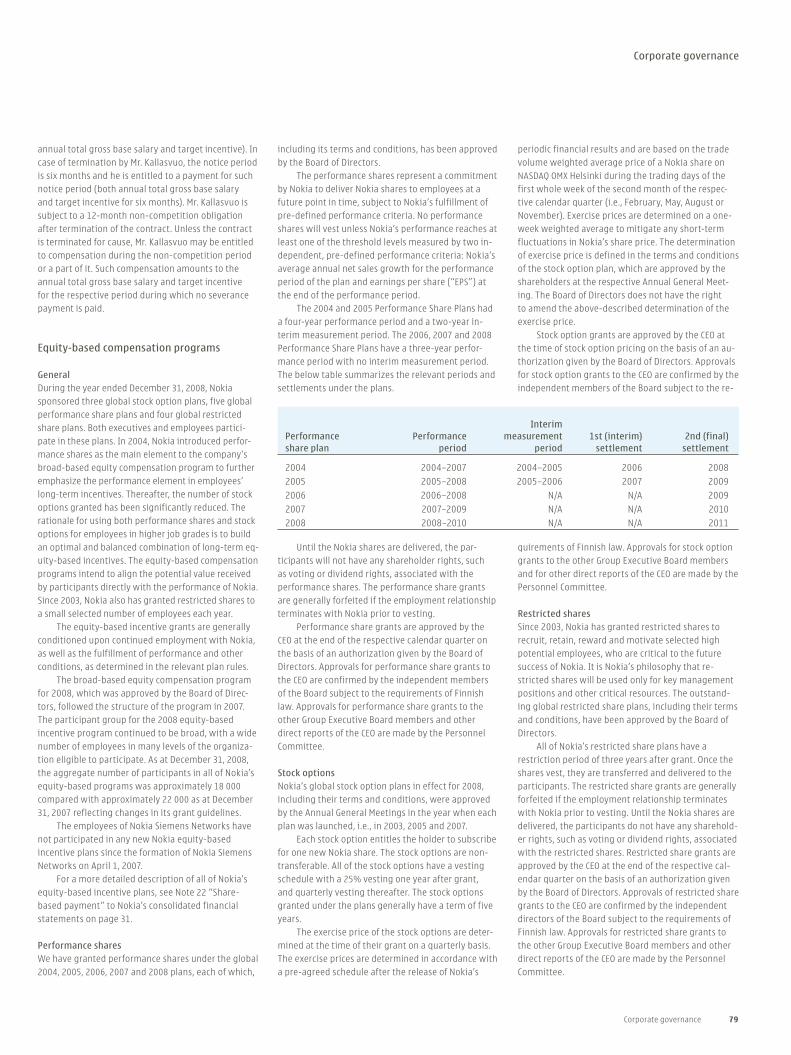
Corporate governance 79
Corporate governance
annual total gross base salary and target incentive). In case of termination by Mr. Kallasvuo, the notice period is six months and he is entitled to a payment for such notice period (both annual total gross base salary and target incentive for six months). Mr. Kallasvuo is subject to a 12-month non-competition obligation after termination of the contract. Unless the contract is terminated for cause, Mr. Kallasvuo may be entitled to compensation during the non-competition period or a part of it. Such compensation amounts to the annual total gross base salary and target incentive for the respective period during which no severance payment is paid.
Equity-based compensation programs
GeneralDuring the year ended December 31, 2008, Nokia sponsored three global stock option plans, five global performance share plans and four global restricted share plans. Both executives and employees partici-pate in these plans. In 2004, Nokia introduced perfor-mance shares as the main element to the company’s broad-based equity compensation program to further emphasize the performance element in employees’ long-term incentives. Thereafter, the number of stock options granted has been significantly reduced. The rationale for using both performance shares and stock options for employees in higher job grades is to build an optimal and balanced combination of long-term eq-uity-based incentives. The equity-based compensation programs intend to align the potential value received by participants directly with the performance of Nokia. Since 2003, Nokia also has granted restricted shares to a small selected number of employees each year.
The equity-based incentive grants are generally conditioned upon continued employment with Nokia, as well as the fulfillment of performance and other conditions, as determined in the relevant plan rules.
The broad-based equity compensation program for 2008, which was approved by the Board of Direc-tors, followed the structure of the program in 2007. The participant group for the 2008 equity-based incentive program continued to be broad, with a wide number of employees in many levels of the organiza-tion eligible to participate. As at December 31, 2008, the aggregate number of participants in all of Nokia’s equity-based programs was approximately 18 000 compared with approximately 22 000 as at December 31, 2007 reflecting changes in its grant guidelines.
The employees of Nokia Siemens Networks have not participated in any new Nokia equity-based incentive plans since the formation of Nokia Siemens Networks on April 1, 2007.
For a more detailed description of all of Nokia’s equity-based incentive plans, see Note 22 “Share-based payment” to Nokia’s consolidated financial statements on page 31.
Performance sharesWe have granted performance shares under the global 2004, 2005, 2006, 2007 and 2008 plans, each of which,
including its terms and conditions, has been approved by the Board of Directors.
The performance shares represent a commitment by Nokia to deliver Nokia shares to employees at a future point in time, subject to Nokia’s fulfillment of pre-defined performance criteria. No performance shares will vest unless Nokia’s performance reaches at least one of the threshold levels measured by two in-dependent, pre-defined performance criteria: Nokia’s average annual net sales growth for the performance period of the plan and earnings per share (“EPS”) at the end of the performance period.
The 2004 and 2005 Performance Share Plans had a four-year performance period and a two-year in-terim measurement period. The 2006, 2007 and 2008 Performance Share Plans have a three-year perfor-mance period with no interim measurement period. The below table summarizes the relevant periods and settlements under the plans.
Interim Performance Performance measurement 1st (interim) 2nd (final)share plan period period settlement settlement
2004 2004–2007 2004–2005 2006 2008
2005 2005–2008 2005–2006 2007 2009
2006 2006–2008 N/A N/A 2009
2007 2007–2009 N/A N/A 2010
2008 2008–2010 N/A N/A 2011
Until the Nokia shares are delivered, the par-ticipants will not have any shareholder rights, such as voting or dividend rights, associated with the performance shares. The performance share grants are generally forfeited if the employment relationship terminates with Nokia prior to vesting.
Performance share grants are approved by the CEO at the end of the respective calendar quarter on the basis of an authorization given by the Board of Directors. Approvals for performance share grants to the CEO are confirmed by the independent members of the Board subject to the requirements of Finnish law. Approvals for performance share grants to the other Group Executive Board members and other direct reports of the CEO are made by the Personnel Committee.
Stock optionsNokia’s global stock option plans in effect for 2008, including their terms and conditions, were approved by the Annual General Meetings in the year when each plan was launched, i.e., in 2003, 2005 and 2007.
Each stock option entitles the holder to subscribe for one new Nokia share. The stock options are non-transferable. All of the stock options have a vesting schedule with a 25% vesting one year after grant, and quarterly vesting thereafter. The stock options granted under the plans generally have a term of five years.
The exercise price of the stock options are deter-mined at the time of their grant on a quarterly basis. The exercise prices are determined in accordance with a pre-agreed schedule after the release of Nokia’s
periodic financial results and are based on the trade volume weighted average price of a Nokia share on NASDAQ OMX Helsinki during the trading days of the first whole week of the second month of the respec-tive calendar quarter (i.e., February, May, August or November). Exercise prices are determined on a one-week weighted average to mitigate any short-term fluctuations in Nokia’s share price. The determination of exercise price is defined in the terms and conditions of the stock option plan, which are approved by the shareholders at the respective Annual General Meet-ing. The Board of Directors does not have the right to amend the above-described determination of the exercise price.
Stock option grants are approved by the CEO at the time of stock option pricing on the basis of an au-thorization given by the Board of Directors. Approvals for stock option grants to the CEO are confirmed by the independent members of the Board subject to the re-
quirements of Finnish law. Approvals for stock option grants to the other Group Executive Board members and for other direct reports of the CEO are made by the Personnel Committee.
Restricted sharesSince 2003, Nokia has granted restricted shares to recruit, retain, reward and motivate selected high potential employees, who are critical to the future success of Nokia. It is Nokia’s philosophy that re-stricted shares will be used only for key management positions and other critical resources. The outstand-ing global restricted share plans, including their terms and conditions, have been approved by the Board of Directors.
All of Nokia’s restricted share plans have a restriction period of three years after grant. Once the shares vest, they are transferred and delivered to the participants. The restricted share grants are generally forfeited if the employment relationship terminates with Nokia prior to vesting. Until the Nokia shares are delivered, the participants do not have any sharehold-er rights, such as voting or dividend rights, associated with the restricted shares. Restricted share grants are approved by the CEO at the end of the respective cal-endar quarter on the basis of an authorization given by the Board of Directors. Approvals of restricted share grants to the CEO are confirmed by the independent directors of the Board subject to the requirements of Finnish law. Approvals for restricted share grants to the other Group Executive Board members and other direct reports of the CEO are made by the Personnel Committee.

80 Nokia in 2008
Corporate governance
Other equity plans for employeesIn addition to Nokia’s global equity plans described above, Nokia has equity plans for Nokia-acquired busi-nesses or employees in the United States and Canada under which participants can receive Nokia ADSs or ordinary shares. These equity plans do not result in an increase in the share capital of Nokia.
In connection with Nokia’s July 10, 2008 acquisi-tion of NAVTEQ, Nokia assumed NAVTEQ’s 2001 Stock Incentive Plan (“NAVTEQ Plan”). All unvested NAVTEQ restricted stock units under the NAVTEQ Plan were converted to an equivalent number of restricted stock units entitling their holders to Nokia shares. The maximum number of Nokia shares to be delivered to NAVTEQ employees during the years 2008–2012 in connection with the NAVTEQ restricted stock units that were converted into Nokia restricted stock units upon closing of the acquisition is approximately 3 million. Nokia does not intend to make further awards under the NAVTEQ Plan.
We have also an Employee Share Purchase Plan in the United States, which permits all full-time Nokia employees located in the United States to acquire Nokia ADSs at a 15% discount. The purchase of the ADSs is funded through monthly payroll deductions from the salary of the participants, and the ADSs are purchased on a monthly basis. As at December 31,
2008, a total of 11 700 044 ADSs had been purchased under this plan since its inception, and there were a total of approximately 1 000 participants.
For more information on these plans, see Note 22 “Share-based payment” to Nokia’s consolidated financial statements on page 31.
Equity-based compensation program 2009
The Board of Directors announced the proposed scope and design for the Equity Program 2009 on January 22,
2009. The main equity instrument continues to be performance shares. In addition, stock options will be used on a limited basis for senior managers, and restricted shares will be used for a small number of high potential and critical employees. These equity-based incentive awards are generally forfeited if the employee leaves Nokia prior to vesting.
Performance sharesThe Performance Share Plan 2009 approved by the Board of Directors will cover a performance period of three years (2009–2011) with no interim measurement period. No performance shares will vest unless Nokia’s performance reaches at least one of the threshold levels measured by two independent, pre-defined performance criteria:
1 Average Annual Net Sales Growth: –5% (thresh-old) and 10% (maximum) during the performance period 2009–2011, and
2 EPS (diluted, non-IFRS): EUR 1.01 (threshold) and EUR 1.53 (maximum) at the end of the perfor-mance period in 2011.
Average Annual Net Sales Growth is calculated as an average of the net sales growth rates for the years 2009 through 2011. EPS is the diluted, non-IFRS
earnings per share in 2011. Both the EPS and Average Annual Net Sales Growth criteria are equally weighted and performance under each of the two performance criteria is calculated independent of each other.
Achievement of the maximum performance for both criteria would result in the vesting of a maximum of 18 million Nokia shares. Performance exceeding the maximum criteria does not increase the number of performance shares that will vest. Achievement of the threshold performance for both criteria will result in the vesting of approximately 4.5 million shares. If only one of the threshold levels of performance is achieved, only approximately 2.25 million of the performance shares will vest. If none of the threshold levels is achieved, then none of the performance shares will vest. For performance between the threshold and max-imum performance levels, the vesting follows a linear scale. If the required performance levels are achieved, the vesting will occur December 31, 2011. Until the Nokia shares are delivered, the participants will not have any shareholder rights, such as voting or dividend rights associated with these performance shares.
Stock optionsThe stock options to be granted in 2009 are out of the Stock Option Plan 2007 approved by the Annual Gen-eral Meeting in 2007. For more information on Stock Option Plan 2007 see “Equity-based compensation programs” on page 79.
Restricted sharesThe restricted shares to be granted under the Restrict-ed Share Plan 2009 will have a three-year restriction period. The restricted shares will vest and the payable Nokia shares be delivered mainly in 2012, subject to fulfillment of the service period criteria. Participants will not have any shareholder rights or voting rights during the restriction period, until the Nokia shares are transferred and delivered to plan participants at the end of the restriction period.
Maximum planned grants in 2009
The maximum number of planned grants under the 2009 Equity Program (i.e., performance shares, stock options and restricted shares) in 2009 are set forth in the table below.
Maximum number of planned grants under the 2009 Plan type equity program in 2009
Stock options 7 million
Restricted shares 5 million
Performance shares at threshold 1 4.5 million
1 The maximum number of Nokia shares to be delivered at maxi-mum performance is four times the number at threshold, i.e., a total of 18 million Nokia shares.
As at December 31, 2008, the total dilutive effect of Nokia’s stock options, performance shares and restricted shares outstanding, assuming full dilution, was approximately 2% in the aggregate. The potential maximum effect of the proposed equity program 2009 would be approximately another 0.6%.
Share ownership
General
The following section describes the ownership or potential ownership interest in the company of the members of Nokia’s Board of Directors and the Group Executive Board, either through share ownership or through holding of equity-based incentives, which may lead to share ownership in the future.
In line with the Company policy, approximately 40% of the remuneration paid to the Board of Directors has been paid in Nokia shares purchased from the market. Non-executive members of the Board of Direc-tors do not receive stock options, performance shares, restricted shares or other variable compensation.
For a description of Nokia’s equity-based com-pensation programs for employees and executives, see “Equity-based compensation programs” on page 79.
Share ownership of the Board of Directors
At December 31, 2008, the members of Nokia’s Board of Directors held the aggregate of 1 235 024 shares and ADSs in Nokia (not including stock options or other equity awards that are deemed as being beneficially owned under applicable SEC rules), which represented 0.03% of Nokia’s outstanding share capital and total voting rights excluding shares held by Nokia Group at that date.
The following table sets forth the number of shares and ADSs held by members of the Board of Directors as at December 31, 2008.
Shares 1 ADSs
Jorma Ollila 2 558 043 —
Marjorie Scardino — 20 501
Georg Ehrnrooth 3 321 693 —
Lalita D. Gupte — 6 049
Bengt Holmström 22 222 —
Henning Kagermann 5 616 —
Olli-Pekka Kallasvuo 4 223 024 —
Per Karlsson 3 26 235 —
Risto Siilasmaa 43 022 —
Keijo Suila 8 619 —
1 The number of shares includes not only shares acquired as compensation for services rendered as a member of the Board of Directors, but also shares acquired by any other means.
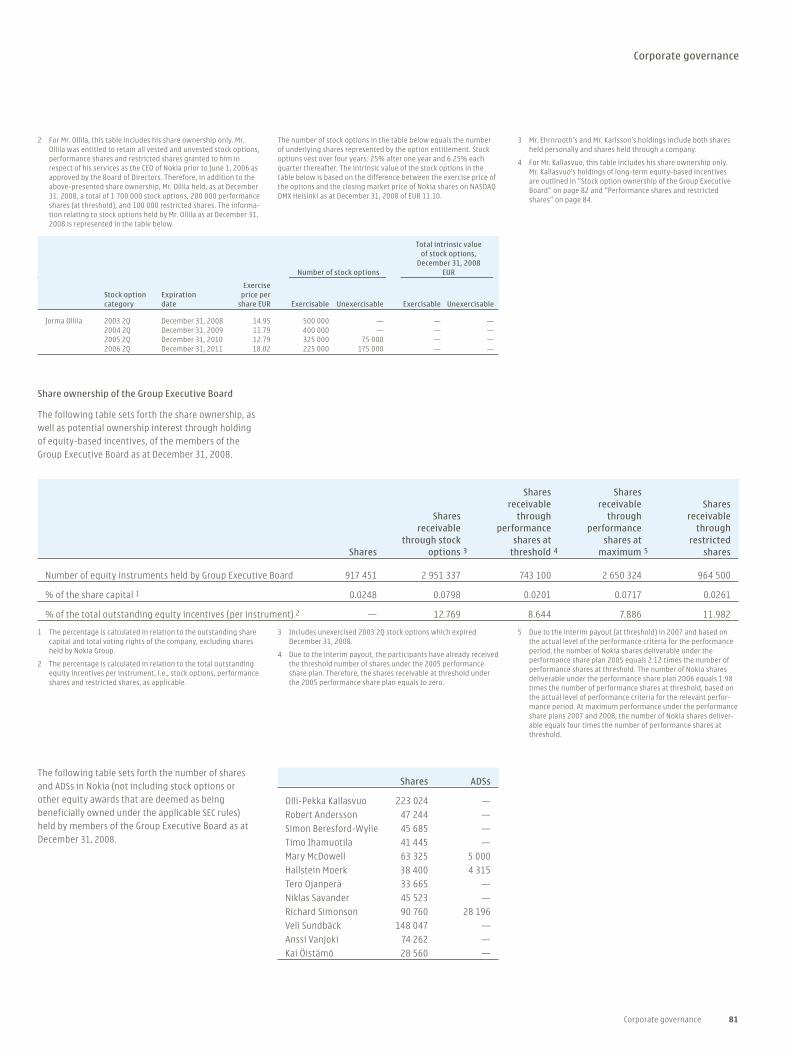
Corporate governance 81
Corporate governance
Total intrinsic value of stock options, December 31, 2008 Number of stock options EUR
Exercise Stock option Expiration price per category date share EUR Exercisable Unexercisable Exercisable Unexercisable
Jorma Ollila 2003 2Q December 31, 2008 14.95 500 000 — — — 2004 2Q December 31, 2009 11.79 400 000 — — — 2005 2Q December 31, 2010 12.79 325 000 75 000 — — 2006 2Q December 31, 2011 18.02 225 000 175 000 — —
Shares Shares receivable receivable Shares Shares through through receivable receivable performance performance through through stock shares at shares at restricted Shares options 3 threshold 4 maximum 5 shares
Number of equity instruments held by Group Executive Board 917 451 2 951 337 743 100 2 650 324 964 500
% of the share capital 1 0.0248 0.0798 0.0201 0.0717 0.0261
% of the total outstanding equity incentives (per instrument) 2 — 12.769 8.644 7.886 11.982
1 The percentage is calculated in relation to the outstanding share capital and total voting rights of the company, excluding shares held by Nokia Group.
2 The percentage is calculated in relation to the total outstanding equity incentives per instrument, i.e., stock options, performance shares and restricted shares, as applicable.
2 For Mr. Ollila, this table includes his share ownership only. Mr. Ollila was entitled to retain all vested and unvested stock options, performance shares and restricted shares granted to him in respect of his services as the CEO of Nokia prior to June 1, 2006 as approved by the Board of Directors. Therefore, in addition to the above-presented share ownership, Mr. Ollila held, as at December 31, 2008, a total of 1 700 000 stock options, 200 000 performance shares (at threshold), and 100 000 restricted shares. The informa-tion relating to stock options held by Mr. Ollila as at December 31, 2008 is represented in the table below.
3 Includes unexercised 2003 2Q stock options which expired December 31, 2008.
4 Due to the interim payout, the participants have already received the threshold number of shares under the 2005 performance share plan. Therefore, the shares receivable at threshold under the 2005 performance share plan equals to zero.
Shares ADSs
Olli-Pekka Kallasvuo 223 024 —
Robert Andersson 47 244 —
Simon Beresford-Wylie 45 685 —
Timo Ihamuotila 41 445 —
Mary McDowell 63 325 5 000
Hallstein Moerk 38 400 4 315
Tero Ojanperä 33 665 —
Niklas Savander 45 523 —
Richard Simonson 90 760 28 196
Veli Sundbäck 148 047 —
Anssi Vanjoki 74 262 —
Kai Öistämö 28 560 —
5 Due to the interim payout (at threshold) in 2007 and based on the actual level of the performance criteria for the performance period, the number of Nokia shares deliverable under the performance share plan 2005 equals 2.12 times the number of performance shares at threshold. The number of Nokia shares deliverable under the performance share plan 2006 equals 1.98 times the number of performance shares at threshold, based on the actual level of performance criteria for the relevant perfor-mance period. At maximum performance under the performance share plans 2007 and 2008, the number of Nokia shares deliver-able equals four times the number of performance shares at threshold.
The number of stock options in the table below equals the number of underlying shares represented by the option entitlement. Stock options vest over four years: 25% after one year and 6.25% each quarter thereafter. The intrinsic value of the stock options in the table below is based on the difference between the exercise price of the options and the closing market price of Nokia shares on NASDAQ OMX Helsinki as at December 31, 2008 of EUR 11.10.
3 Mr. Ehrnrooth’s and Mr. Karlsson’s holdings include both shares held personally and shares held through a company.
4 For Mr. Kallasvuo, this table includes his share ownership only. Mr. Kallasvuo’s holdings of long-term equity-based incentives are outlined in “Stock option ownership of the Group Executive Board” on page 82 and “Performance shares and restricted shares” on page 84.
Share ownership of the Group Executive Board
The following table sets forth the share ownership, as well as potential ownership interest through holding of equity-based incentives, of the members of the Group Executive Board as at December 31, 2008.
The following table sets forth the number of shares and ADSs in Nokia (not including stock options or other equity awards that are deemed as being beneficially owned under the applicable SEC rules) held by members of the Group Executive Board as at December 31, 2008.

82 Nokia in 2008
Total intrinsic value of stock options, December 31, 2008 Number of stock options 1 EUR 2
Exercise Stock option Expiration price per category date share EUR Exercisable Unexercisable Exercisable 3 Unexercisable
Olli-Pekka Kallasvuo 2003 2Q December 31, 2008 14.95 120 000 — — —
2004 2Q December 31, 2009 11.79 60 000 — — —
2005 2Q December 31, 2010 12.79 48 750 11 250 — —
2005 4Q December 31, 2010 14.48 68 750 31 250 — —
2006 2Q December 31, 2011 18.02 168 750 131 250 — —
2007 2Q December 31, 2012 18.39 50 000 110 000 — —
2008 2Q December 31, 2013 19.16 — 115 000 — —
Robert Andersson 2004 2Q December 31, 2009 11.79 10 400 — — —
2005 2Q December 31, 2010 12.79 9 750 2 250 — —
2005 4Q December 31, 2010 14.48 19 250 8 750 — —
2006 2Q December 31, 2011 18.02 20 000 35 000 — —
2007 2Q December 31, 2012 18.39 10 000 22 000 — —
2008 2Q December 31, 2013 19.16 — 20 000 — —
Simon Beresford-Wylie 4 2003 2Q December 31, 2008 14.95 13 000 — — —
2004 2Q December 31, 2009 11.79 10 000 — — —
2005 2Q December 31, 2010 12.79 42 750 11 250 — —
2006 2Q December 31, 2011 18.02 56 250 43 750 — —
Timo Ihamuotila 2004 2Q December 31, 2009 11.79 1 500 — — —
2005 2Q December 31, 2010 12.79 3 600 2 700 — —
2006 2Q December 31, 2011 18.02 3 600 6 300 — —
2007 2Q December 31, 2012 18.39 10 000 22 000 — —
2008 2Q December 31, 2013 19.16 — 20 000 — —
Mary McDowell 2004 2Q December 31, 2009 11.79 50 000 — — —
2005 2Q December 31, 2010 12.79 48 750 11 250 — —
2006 2Q December 31, 2011 18.02 56 250 43 750 — —
2007 2Q December 31, 2012 18.39 17 187 37 813 — —
2008 2Q December 31, 2013 19.16 — 28 000 — —
Hallstein Moerk 2004 2Q December 31, 2009 11.79 5 625 — — —
2005 2Q December 31, 2010 12.79 10 000 7 500 — —
2006 2Q December 31, 2011 18.02 33 750 26 250 — —
2007 2Q December 31, 2012 18.39 10 000 22 000 — —
2008 2Q December 31, 2013 19.16 — 20 000 — —
Corporate governance
Stock option ownership of the Group Executive Board
The following table provides certain information re-lating to stock options held by members of the Group Executive Board as at December 31, 2008. These stock options were issued pursuant to Nokia Stock Option Plans 2003, 2005 and 2007. For a description of Nokia’s stock option plans, see Note 22 “Share-based pay-ment” to Nokia’s consolidated financial statements on page 31.

Corporate governance 83
Total intrinsic value of stock options, December 31, 2008 Number of stock options 1 EUR 2
Exercise Stock option Expiration price per category date share EUR Exercisable Unexercisable Exercisable 3 Unexercisable
Tero Ojanperä 2003 2Q December 31, 2008 14.95 8 000 — — —
2004 2Q December 31, 2009 11.79 10 000 — — —
2005 2Q December 31, 2010 12.79 32 500 7 500 — —
2006 2Q December 31, 2011 18.02 33 750 26 250 — —
2007 2Q December 31, 2012 18.39 10 000 22 000 — —
2008 2Q December 31, 2013 19.16 — 20 000 — —
Niklas Savander 2004 2Q December 31, 2009 11.79 2 560 — — —
2005 2Q December 31, 2010 12.79 4 375 2 625 — —
2006 2Q December 31, 2011 18.02 18 750 26 250 — —
2007 2Q December 31, 2012 18.39 10 000 22 000 — —
2008 2Q December 31, 2013 19.16 — 28 000 — —
Richard Simonson 2004 2Q December 31, 2009 11.79 50 000 — — —
2005 2Q December 31, 2010 12.79 48 750 11 250 — —
2006 2Q December 31, 2011 18.02 56 250 43 750 — —
2007 2Q December 31, 2012 18.39 17 187 37 813 — —
2008 2Q December 31, 2013 19.16 — 32 000 — —
Veli Sundbäck 2003 2Q December 31, 2008 14.95 50 000 — — —
2004 2Q December 31, 2009 11.79 30 000 — — —
2005 2Q December 31, 2010 12.79 32 500 7 500 — —
2006 2Q December 31, 2011 18.02 33 750 26 250 — —
2007 2Q December 31, 2012 18.39 10 000 22 000 — —
Anssi Vanjoki 2004 2Q December 31, 2009 11.79 11 250 — — —
2005 2Q December 31, 2010 12.79 15 000 11 250 — —
2006 2Q December 31, 2011 18.02 25 000 43 750 — —
2007 2Q December 31, 2012 18.39 17 187 37 813 — —
2008 2Q December 31, 2013 19.16 — 32 000 — —
Kai Öistämö 2003 2Q December 31, 2008 14.95 727 — — —
2004 2Q December 31, 2009 11.79 3 125 — — —
2005 2Q December 31, 2010 12.79 4 800 2 400 — —
2005 4Q December 31, 2010 14.48 10 500 8 750 — —
2006 2Q December 31, 2011 18.02 56 250 43 750 — —
2007 2Q December 31, 2012 18.39 17 187 37 813 — —
2008 2Q December 31, 2013 19.16 — 32 000 — —
Stock options held by the membersof the Group Executive Board onDecember 31, 2008, Total 1 577 310 1 374 027 — —
All outstanding stock option plans(global plans), Total 12 244 569 10 868 649 66 760 4 851
1 Number of stock options equals the number of underlying shares represented by the option entitlement. Stock options vest over four years: 25% after one year and 6.25% each quarter there-after.
2 The intrinsic value of the stock options is based on the difference between the exercise price of the options and the closing market price of Nokia shares on NASDAQ OMX Helsinki as at December 31, 2008 of EUR 11.10.
3 For gains realized upon exercise of stock options for the mem-bers of the Group Executive Board, see the table in “Stock option exercises and settlement of shares” on page 86.
4 From April 1, 2007, Mr. Beresford-Wylie has participated in a long-term cash incentive plan sponsored by Nokia Siemens Networks, instead of the long-term equity-based plans of Nokia.
Corporate governance
Stock option ownership of the Group Executive Board, continued
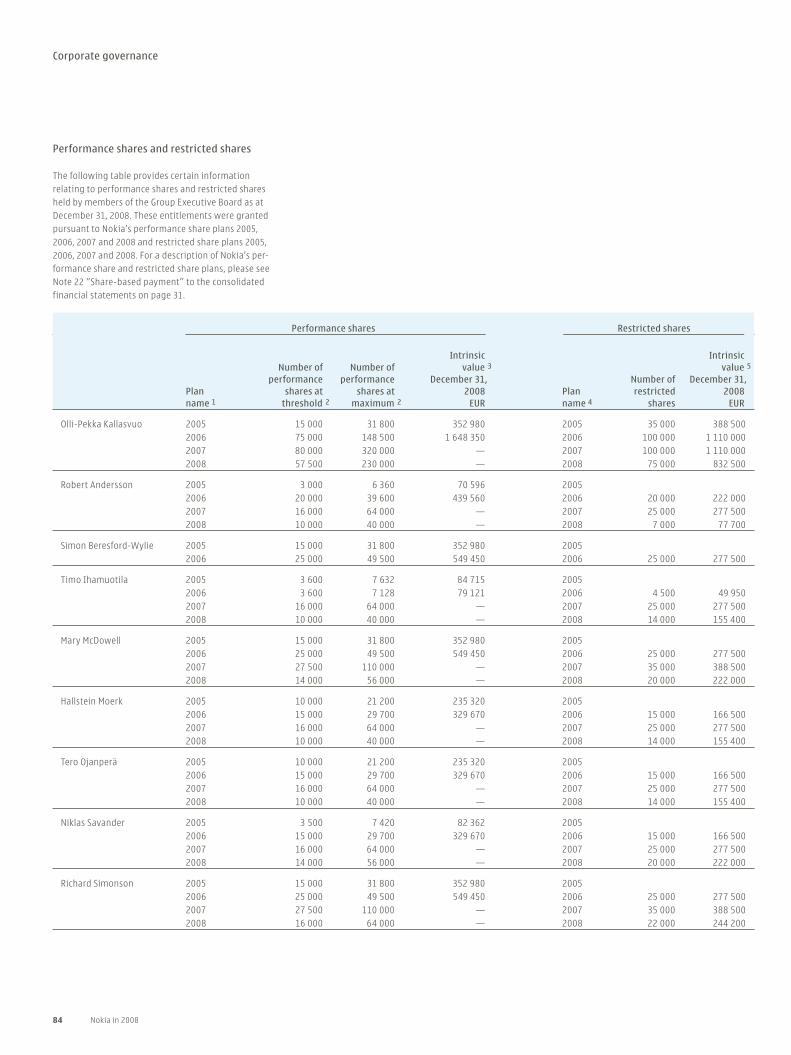
84 Nokia in 2008
Performance shares and restricted shares
The following table provides certain information relating to performance shares and restricted shares held by members of the Group Executive Board as at December 31, 2008. These entitlements were granted pursuant to Nokia’s performance share plans 2005,
2006, 2007 and 2008 and restricted share plans 2005, 2006, 2007 and 2008. For a description of Nokia’s per-formance share and restricted share plans, please see Note 22 “Share-based payment” to the consolidated financial statements on page 31.
Performance shares Restricted shares
Intrinsic Intrinsic Number of Number of value 3 value 5
performance performance December 31, Number of December 31, Plan shares at shares at 2008 Plan restricted 2008 name 1 threshold 2 maximum 2 EUR name 4 shares EUR
Olli-Pekka Kallasvuo 2005 15 000 31 800 352 980 2005 35 000 388 500 2006 75 000 148 500 1 648 350 2006 100 000 1 110 000 2007 80 000 320 000 — 2007 100 000 1 110 000 2008 57 500 230 000 — 2008 75 000 832 500
Robert Andersson 2005 3 000 6 360 70 596 2005 2006 20 000 39 600 439 560 2006 20 000 222 000 2007 16 000 64 000 — 2007 25 000 277 500 2008 10 000 40 000 — 2008 7 000 77 700
Simon Beresford-Wylie 2005 15 000 31 800 352 980 2005 2006 25 000 49 500 549 450 2006 25 000 277 500
Timo Ihamuotila 2005 3 600 7 632 84 715 2005 2006 3 600 7 128 79 121 2006 4 500 49 950 2007 16 000 64 000 — 2007 25 000 277 500 2008 10 000 40 000 — 2008 14 000 155 400
Mary McDowell 2005 15 000 31 800 352 980 2005 2006 25 000 49 500 549 450 2006 25 000 277 500 2007 27 500 110 000 — 2007 35 000 388 500 2008 14 000 56 000 — 2008 20 000 222 000
Hallstein Moerk 2005 10 000 21 200 235 320 2005 2006 15 000 29 700 329 670 2006 15 000 166 500 2007 16 000 64 000 — 2007 25 000 277 500 2008 10 000 40 000 — 2008 14 000 155 400
Tero Ojanperä 2005 10 000 21 200 235 320 2005 2006 15 000 29 700 329 670 2006 15 000 166 500 2007 16 000 64 000 — 2007 25 000 277 500 2008 10 000 40 000 — 2008 14 000 155 400
Niklas Savander 2005 3 500 7 420 82 362 2005 2006 15 000 29 700 329 670 2006 15 000 166 500 2007 16 000 64 000 — 2007 25 000 277 500 2008 14 000 56 000 — 2008 20 000 222 000
Richard Simonson 2005 15 000 31 800 352 980 2005 2006 25 000 49 500 549 450 2006 25 000 277 500 2007 27 500 110 000 — 2007 35 000 388 500 2008 16 000 64 000 — 2008 22 000 244 200
Corporate governance

Corporate governance 85
Performance shares Restricted shares
Intrinsic Intrinsic Number of Number of value 3 value 5
performance performance December 31, Number of December 31, Plan shares at shares at 2008 Plan restricted 2008 name 1 threshold 2 maximum 2 EUR name 4 shares EUR
Veli Sundbäck 2005 10 000 21 200 235 320 2005 2006 15 000 29 700 329 670 2006 15 000 166 500 2007 16 000 64 000 — 2007 25 000 277 500
Anssi Vanjoki 2005 15 000 31 800 352 980 2005 2006 25 000 49 500 549 450 2006 25 000 277 500 2007 27 500 110 000 — 2007 35 000 388 500 2008 16 000 64 000 — 2008 22 000 244 200
Kai Öistämö 2005 3 200 6 784 75 302 2005 2006 25 000 49 500 549 450 2006 25 000 277 500 2007 27 500 110 000 — 2007 35 000 388 500 2008 16 000 64 000 — 2008 22 000 244 200
Performance shares andrestricted shares held by the Group Executive Board,Total 6 861 400 2 650 324 9 016 796 964 500 10 705 950
All outstandingperformance shares and restricted shares (global plans), Total 8 596 496 33 607 752 176 418 521 8 049 397 89 348 307
1 The performance period for the 2005 plan is 2005–2008, with one interim measurement period for fiscal years 2005–2006. The performance period for the 2006 plan is 2006–2008, 2007 plan 2007–2009 and 2008 plan 2008–2010, respectively.
2 The threshold number will vest as Nokia shares should the pre-determined threshold performance levels of Nokia be met. Under the 2005 performance share plan, the participants have already received the threshold number of Nokia shares in connection with the interim payout. The maximum number of Nokia shares will vest should the pre-determined maximum performance lev-els be met. The maximum number of performance shares equals four times the number at threshold. The number of Nokia shares deliverable under the performance share plan 2005 equals 2.12
times the number of performance shares at threshold due to the interim payout (at threshold) in 2007 and based on the actual level of the performance criteria for the performance period. Under the performance share plan 2006 the maximum number of Nokia shares deliverable equals 1.98 times the number of performance shares at threshold.
3 The intrinsic value is based on the closing market price of a Nokia share on NASDAQ OMX Helsinki as at December 31, 2008 of EUR 11.10. For performance share plans 2007 and 2008, the value of performance shares is presented on the basis of Nokia’s estima-tion of the number of shares expected to vest. For performance share plans 2005 and 2006, the value of performance shares is presented on the basis of actual number of shares to vest.
Corporate governance
4 Under the restricted share plans 2005, 2006, 2007 and 2008, awards have been granted quarterly. For the major part of the awards made under these plans, the restriction period ended for the 2005 plan on October 1, 2008; and will end for the 2006 plan on October 1, 2009; for the 2007 plan, on October 1, 2010; and for the 2008 plan, on October 1, 2011.
5 The intrinsic value is based on the closing market price of a Nokia share on NASDAQ OMX Helsinki as at December 31, 2008 of EUR 11.10.
6 From April 1, 2007, Mr. Beresford-Wylie has participated in a long-term cash incentive plan sponsored by Nokia Siemens Networks instead of the long-term equity-based plans of Nokia.
For gains realized upon exercise of stock options or delivery of Nokia shares on the basis of performance shares and restricted shares granted to the members of the Group Executive Board, see the table in “Stock option exercises and settlement of shares” on page 86.
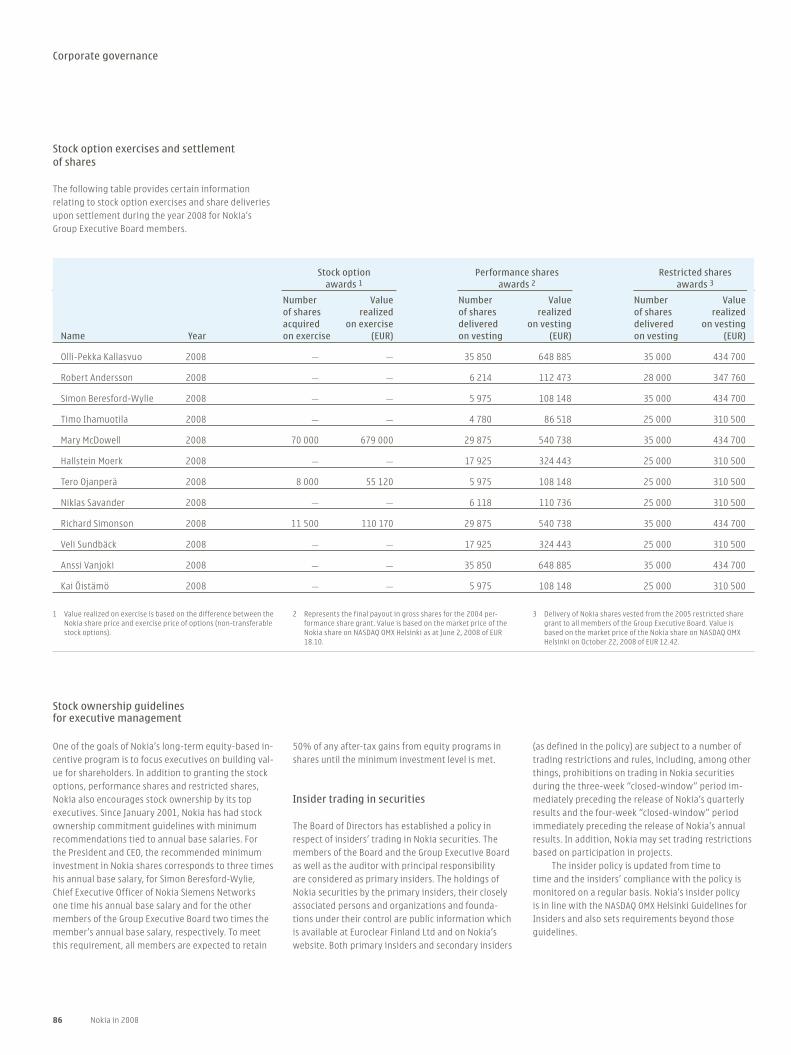
86 Nokia in 2008
Stock option exercises and settlement of shares
The following table provides certain information relating to stock option exercises and share deliveries upon settlement during the year 2008 for Nokia’s Group Executive Board members.
Stock option Performance shares Restricted shares awards 1 awards 2 awards 3
Number Value Number Value Number Value of shares realized of shares realized of shares realized acquired on exercise delivered on vesting delivered on vestingName Year on exercise (EUR) on vesting (EUR) on vesting (EUR)
Olli-Pekka Kallasvuo 2008 — — 35 850 648 885 35 000 434 700
Robert Andersson 2008 — — 6 214 112 473 28 000 347 760
Simon Beresford-Wylie 2008 — — 5 975 108 148 35 000 434 700
Timo Ihamuotila 2008 — — 4 780 86 518 25 000 310 500
Mary McDowell 2008 70 000 679 000 29 875 540 738 35 000 434 700
Hallstein Moerk 2008 — — 17 925 324 443 25 000 310 500
Tero Ojanperä 2008 8 000 55 120 5 975 108 148 25 000 310 500
Niklas Savander 2008 — — 6 118 110 736 25 000 310 500
Richard Simonson 2008 11 500 110 170 29 875 540 738 35 000 434 700
Veli Sundbäck 2008 — — 17 925 324 443 25 000 310 500
Anssi Vanjoki 2008 — — 35 850 648 885 35 000 434 700
Kai Öistämö 2008 — — 5 975 108 148 25 000 310 500
1 Value realized on exercise is based on the difference between the Nokia share price and exercise price of options (non-transferable stock options).
2 Represents the final payout in gross shares for the 2004 per-formance share grant. Value is based on the market price of the Nokia share on NASDAQ OMX Helsinki as at June 2, 2008 of EUR 18.10.
3 Delivery of Nokia shares vested from the 2005 restricted share grant to all members of the Group Executive Board. Value is based on the market price of the Nokia share on NASDAQ OMX Helsinki on October 22, 2008 of EUR 12.42.
Stock ownership guidelines for executive management
One of the goals of Nokia’s long-term equity-based in-centive program is to focus executives on building val-ue for shareholders. In addition to granting the stock options, performance shares and restricted shares, Nokia also encourages stock ownership by its top executives. Since January 2001, Nokia has had stock ownership commitment guidelines with minimum recommendations tied to annual base salaries. For the President and CEO, the recommended minimum investment in Nokia shares corresponds to three times his annual base salary, for Simon Beresford-Wylie, Chief Executive Officer of Nokia Siemens Networks one time his annual base salary and for the other members of the Group Executive Board two times the member’s annual base salary, respectively. To meet this requirement, all members are expected to retain
50% of any after-tax gains from equity programs in shares until the minimum investment level is met.
Insider trading in securities
The Board of Directors has established a policy in respect of insiders’ trading in Nokia securities. The members of the Board and the Group Executive Board as well as the auditor with principal responsibility are considered as primary insiders. The holdings of Nokia securities by the primary insiders, their closely associated persons and organizations and founda-tions under their control are public information which is available at Euroclear Finland Ltd and on Nokia’s website. Both primary insiders and secondary insiders
(as defined in the policy) are subject to a number of trading restrictions and rules, including, among other things, prohibitions on trading in Nokia securities during the three-week “closed-window” period im-mediately preceding the release of Nokia’s quarterly results and the four-week “closed-window” period immediately preceding the release of Nokia’s annual results. In addition, Nokia may set trading restrictions based on participation in projects.
The insider policy is updated from time to time and the insiders’ compliance with the policy is monitored on a regular basis. Nokia’s insider policy is in line with the NASDAQ OMX Helsinki Guidelines for Insiders and also sets requirements beyond those guidelines.
Corporate governance
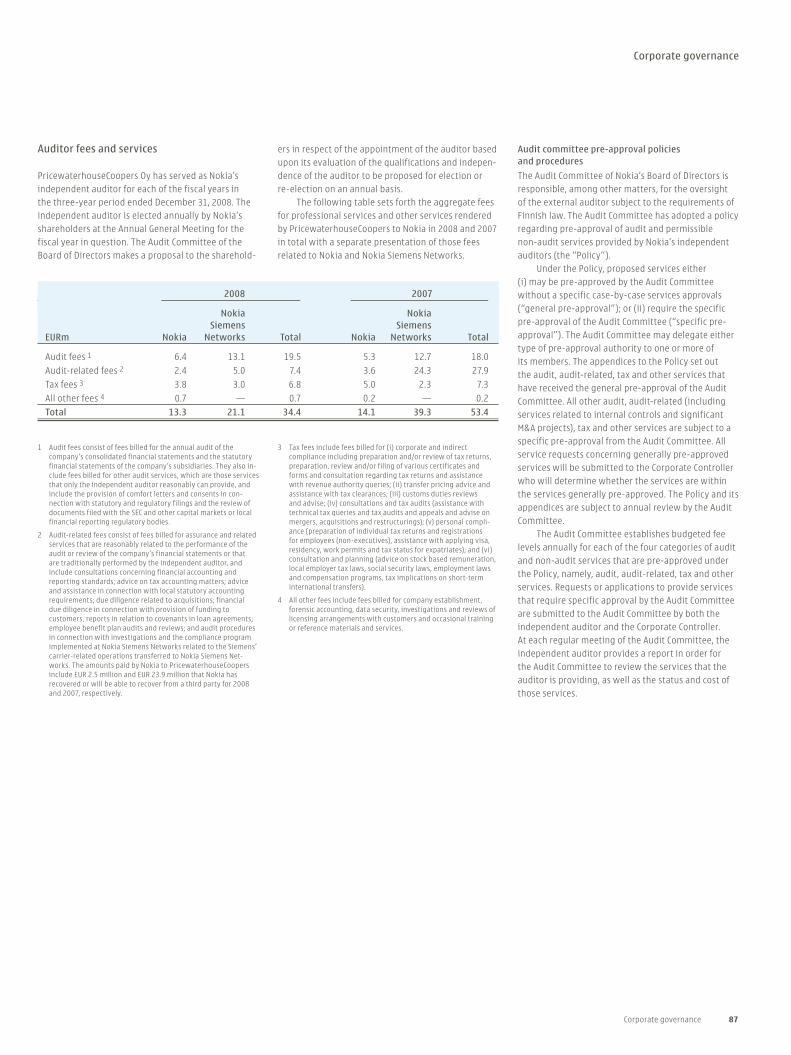
Corporate governance 87
Audit committee pre-approval policies and procedures
The Audit Committee of Nokia’s Board of Directors is responsible, among other matters, for the oversight of the external auditor subject to the requirements of Finnish law. The Audit Committee has adopted a policy regarding pre-approval of audit and permissible non-audit services provided by Nokia’s independent auditors (the “Policy”).
Under the Policy, proposed services either (i) may be pre-approved by the Audit Committee without a specific case-by-case services approvals (“general pre-approval”); or (ii) require the specific pre-approval of the Audit Committee (“specific pre-approval”). The Audit Committee may delegate either type of pre-approval authority to one or more of its members. The appendices to the Policy set out the audit, audit-related, tax and other services that have received the general pre-approval of the Audit Committee. All other audit, audit-related (including services related to internal controls and significant M&A projects), tax and other services are subject to a specific pre-approval from the Audit Committee. All service requests concerning generally pre-approved services will be submitted to the Corporate Controller who will determine whether the services are within the services generally pre-approved. The Policy and its appendices are subject to annual review by the Audit Committee.
The Audit Committee establishes budgeted fee levels annually for each of the four categories of audit and non-audit services that are pre-approved under the Policy, namely, audit, audit-related, tax and other services. Requests or applications to provide services that require specific approval by the Audit Committee are submitted to the Audit Committee by both the independent auditor and the Corporate Controller. At each regular meeting of the Audit Committee, the independent auditor provides a report in order for the Audit Committee to review the services that the auditor is providing, as well as the status and cost of those services.
1 Audit fees consist of fees billed for the annual audit of the company’s consolidated financial statements and the statutory financial statements of the company’s subsidiaries. They also in-clude fees billed for other audit services, which are those services that only the independent auditor reasonably can provide, and include the provision of comfort letters and consents in con-nection with statutory and regulatory filings and the review of documents filed with the SEC and other capital markets or local financial reporting regulatory bodies.
2 Audit-related fees consist of fees billed for assurance and related services that are reasonably related to the performance of the audit or review of the company’s financial statements or that are traditionally performed by the independent auditor, and include consultations concerning financial accounting and reporting standards; advice on tax accounting matters; advice and assistance in connection with local statutory accounting requirements; due diligence related to acquisitions; financial due diligence in connection with provision of funding to customers, reports in relation to covenants in loan agreements; employee benefit plan audits and reviews; and audit procedures in connection with investigations and the compliance program implemented at Nokia Siemens Networks related to the Siemens’ carrier-related operations transferred to Nokia Siemens Net-works. The amounts paid by Nokia to PricewaterhouseCoopers include EUR 2.5 million and EUR 23.9 million that Nokia has recovered or will be able to recover from a third party for 2008 and 2007, respectively.
3 Tax fees include fees billed for (i) corporate and indirect compliance including preparation and/or review of tax returns, preparation, review and/or filing of various certificates and forms and consultation regarding tax returns and assistance with revenue authority queries; (ii) transfer pricing advice and assistance with tax clearances; (iii) customs duties reviews and advise; (iv) consultations and tax audits (assistance with technical tax queries and tax audits and appeals and advise on mergers, acquisitions and restructurings); (v) personal compli-ance (preparation of individual tax returns and registrations for employees (non-executives), assistance with applying visa, residency, work permits and tax status for expatriates); and (vi) consultation and planning (advice on stock based remuneration, local employer tax laws, social security laws, employment laws and compensation programs, tax implications on short-term international transfers).
4 All other fees include fees billed for company establishment, forensic accounting, data security, investigations and reviews of licensing arrangements with customers and occasional training or reference materials and services.
Corporate governance
Auditor fees and services
PricewaterhouseCoopers Oy has served as Nokia’s independent auditor for each of the fiscal years in the three-year period ended December 31, 2008. The independent auditor is elected annually by Nokia’s shareholders at the Annual General Meeting for the fiscal year in question. The Audit Committee of the Board of Directors makes a proposal to the sharehold-
ers in respect of the appointment of the auditor based upon its evaluation of the qualifications and indepen-dence of the auditor to be proposed for election or re-election on an annual basis.
The following table sets forth the aggregate fees for professional services and other services rendered by PricewaterhouseCoopers to Nokia in 2008 and 2007 in total with a separate presentation of those fees related to Nokia and Nokia Siemens Networks.
2008 2007
Nokia Nokia Siemens SiemensEURm Nokia Networks Total Nokia Networks Total
Audit fees 1 6.4 13.1 19.5 5.3 12.7 18.0
Audit-related fees 2 2.4 5.0 7.4 3.6 24.3 27.9
Tax fees 3 3.8 3.0 6.8 5.0 2.3 7.3
All other fees 4 0.7 — 0.7 0.2 — 0.2
Total 13.3 21.1 34.4 14.1 39.3 53.4

88 Nokia in 2008
Investor information
It should be noted that certain statements herein which are not his-torical facts, including, without limitation, those regarding: A) the timing of product, services and solution deliveries; B) our ability to develop, implement and commercialize new products, services, solu-tions and technologies; C) our ability to develop and grow our con-sumer Internet services business; D) expectations regarding market developments and structural changes; E) expectations regarding our mobile device volumes, market share, prices and margins; F) expec-tations and targets for our results of operations; G) the outcome of pending and threatened litigation; H) expectations regarding the successful completion of contemplated acquisitions on a timely basis and our ability to achieve the set targets upon the completion of such acquisitions; and I) statements preceded by “believe,” “expect,” “an-ticipate,” “foresee,” “target,” “estimate,” “designed,” “plans,” “will” or similar expressions are forward-looking statements. These state-ments are based on management’s best assumptions and beliefs in light of the information currently available to it. Because they involve risks and uncertainties, actual results may differ materially from the results that we currently expect. Factors that could cause these dif-ferences include, but are not limited to: 1) the deteriorating global economic conditions and related financial crisis and their impact on us, our customers and end-users of our products, services and solu-tions, our suppliers and collaborative partners; 2) the development of the mobile and fixed communications industry, as well as the growth and profitability of the new market segments that we target and our ability to successfully develop or acquire and market products, ser-vices and solutions in those segments; 3) the intensity of competi-tion in the mobile and fixed communications industry and our ability to maintain or improve our market position or respond successfully
to changes in the competitive landscape; 4) competitiveness of our product, services and solutions portfolio; 5) our ability to successfully manage costs; 6) exchange rate fluctuations, including, in particular, fluctuations between the euro, which is our reporting currency, and the US dollar, the Japanese yen, the Chinese yuan and the UK pound sterling, as well as certain other currencies; 7) the success, financial condition and performance of our suppliers, collaboration partners and customers; 8) our ability to source sufficient amounts of fully functional components, sub-assemblies, software and content with-out interruption and at acceptable prices; 9) the impact of changes in technology and our ability to develop or otherwise acquire and timely and successfully commercialize complex technologies as re-quired by the market; 10) the occurrence of any actual or even alleged defects or other quality, safety or security issues in our products, ser-vices and solutions; 11) the impact of changes in government policies, trade policies, laws or regulations or political turmoil in countries where we do business; 12) our success in collaboration arrangements with others relating to development of technologies or new products, services and solutions; 13) our ability to manage efficiently our man-ufacturing and logistics, as well as to ensure the quality, safety, se-curity and timely delivery of our products, services and solutions; 14) inventory management risks resulting from shifts in market demand; 15) our ability to protect the complex technologies, which we or oth-ers develop or that we license, from claims that we have infringed third parties’ intellectual property rights, as well as our unrestricted use on commercially acceptable terms of certain technologies in our products, services and solutions; 16) our ability to protect numerous Nokia, NAVTEQ and Nokia Siemens Networks patented, standardized or proprietary technologies from third-party infringement or actions
to invalidate the intellectual property rights of these technologies; 17) any disruption to information technology systems and networks that our operations rely on; 18) developments under large, multi-year contracts or in relation to major customers; 19) the management of our customer financing exposure; 20) our ability to retain, motivate, develop and recruit appropriately skilled employees; 21) whether, as a result of investigations into alleged violations of law by some for-mer employees of Siemens AG (“Siemens”), government authorities or others take further actions against Siemens and/or its employees that may involve and affect the carrier-related assets and employees transferred by Siemens to Nokia Siemens Networks, or there may be undetected additional violations that may have occurred prior to the transfer, or violations that may have occurred after the transfer, of such assets and employees that could result in additional actions by government authorities; 22) any impairment of Nokia Siemens Networks customer relationships resulting from the ongoing govern-ment investigations involving the Siemens carrier-related operations transferred to Nokia Siemens Networks; 23) unfavorable outcome of litigations; 24) allegations of possible health risks from electromag-netic fields generated by base stations and mobile devices and law-suits related to them, regardless of merit; as well as the risk factors specified on pages 11–28 of Nokia’s annual report on Form 20-F for the year ended December 31, 2008 under Item 3D. “Risk Factors.” Oth-er unknown or unpredictable factors or underlying assumptions sub-sequently proving to be incorrect could cause actual results to differ materially from those in the forward-looking statements. Nokia does not undertake any obligation to publicly update or revise forward-looking statements, whether as a result of new information, future events or otherwise, except to the extent legally required.
Stock exchangesThe shares of Nokia Corporation are quoted on the following stock exchanges:
Symbol Trading currency
NASDAQ OMX Helsinki (quoted since 1915) NOK1V EUR
Frankfurter Wertpapierbörse (1988) NOA3 EUR
New York Stock Exchange (1994) NOK USD
List of indices
NOK1V NOK
OMXN40 OMX Nordic 40 NYA NYSE Composite
OMXH OMX Helsinki NYL.ID NYSE World Leaders
OMXH25 OMX Helsinki 25 NYYID NYSE TMT
HX45 OMX Helsinki Information Technology CTN CSFB Technology
BE500 Bloomberg European 500 MLO Merrill Lynch 10
BETECH Bloomberg Telecommunication Equipment
SX5E DJ Euro STOXX 50
SX5P DJ STOXX 50
E3X FTSE Eurofirst 300
Information on the Internetwww.nokia.com/investors
Available on the Internet: financial reports, Nokia management’s presentations, conference call and other investor related materials, press releases as well as environmental and social information.
Investor relations [email protected]
Nokia Investor Relations102 Corporate Park DriveWhite Plains, NY 10604
USA
Tel. +1 914 368 0555
Fax +1 914 368 0600
Nokia Investor RelationsP.O. Box 226
FI-00045 NOKIA GROUP
FinlandTel. +358 7180 34927
Fax +358 7180 38329
Annual General MeetingDate: Thursday, April 23, 2009 at 3.00 pmAddress: Helsinki Fair Centre, Amfi-hall, Messuaukio 1, Helsinki, Finland
DividendDividend proposed by the Board of Directors for the fiscal year 2008 is EUR 0.40.The dividend record date is proposed to be April 28, 2009 and the pay date on or about May 13, 2009.
Financial reportingNokia’s quarterly reports in 2009 are planned for April 16, July 16, and October 15. The 2009 results are planned to be published in January 2010.
Information published in 2008All Nokia’s press releases published in 2008 are available on the Internet at investors.nokia.com.

Contact information 89
Contact information
Nokia Head OfficeKeilalahdentie 2 – 4
02150 EspooP.O.Box 226, FI-00045 Nokia Group FINLAND
Tel. +358 7180 08000
Fax +358 7180 34003
Nokia Corporate Office –New York 102 Corporate Park Drive White Plains, New York 10604
USA Tel. +1 914 368 0400
Fax +1 914 368 0501
Nokia Latin America703 NW 62nd Av, Suite 100
Miami FL, 33126
USA
Tel. +1 786 388 4002
Fax +1 786 388 4030
Nokia BrazilAv das Nacoes Unidas 12.901 Torre Norte 11o. Andar Cep 04578-910Sao Paulo 04578-910
BRAZIL
Tel. +55 11 5508 6350
Fax + 55 11 5508 0471
Nokia Greater China & KoreaNokia China CampusBeijing Economic and Technological Development AreaNo.5 Donghuan ZhongluBeijing, PRC 100176
Tel. +86 10 8711 8888
Nokia South East Asia & Pacific 438B Alexandra Road #07-00 Alexandra Technopark SINGAPORE 119968
Tel. +65 6723 2323
Fax +65 6723 2324
Nokia India2nd Floor, Commercial PlazaRadisson Complex, National Highway no. 8Mahipalpur, New Delhi – 110037
INDIA
Tel. +91 11 427 99 050
Fax +91 11 427 99 032
Nokia Middle East & AfricaAl Thuraya Tower II, 27th floor, Dubai Internet City Dubai, UAE
Tel. +971 4 3697600 Fax +971 4 3697604
Nokia EurasiaStoleshnikov Per 14
103031 MoscowRUSSIA
Tel. +7495 795 0500
Fax +7495 795 0509

Paper: Galerie One Silk 100 g/m2
Cover: Invercote Creato 240 g/m2
Design: HardWorkingHouse Oy, cover: Louise Boström Oy.F.G. Lönnberg ISO 9001, 2009.

Copy
right
© 20
09. N
okia
Corp
orati
on. A
ll righ
ts res
erved
.No
kia an
d Nok
ia Co
nnec
ting P
eople
are r
egist
ered t
radem
arks
of N
okia
Corp
orati
on.