noise camera: automated detection technology to identify ...€¦ · formation to the camera...
TRANSCRIPT

Proceedings of ACOUSTICS 2006 20-22 November 2006, Christchurch, New Zealand
Acoustics 2006 343
Noise Camera: Automated Detection Technology to Identify Noisy Vehicles
Andrew Klos, Andrew Principal Policy Advisor, Department for Transport, Energy and Infrastructure, South Australia, Australia
ABSTRACT
Higher traffic densities and community expectations for a clean environment have resulted in jurisdictions developing and adopting more stringent standards for motor vehicle emissions. This includes motor vehicle drive-by noise and noise generated by heavy vehicle engine brakes. To date, enforcement of in-service motor vehicle noise standards has been limited to stationary noise testing. This method of enforcement is labour intensive, disruptive to conforming mo-torists and does not correlate well with drive-by noise levels. The South Australian Department for Transport, Energy and Infrastructure has undertaken to develop an automated system called a noise camera to identify noisy vehicles in the traffic stream. The noise camera, believed to be a world first, is capable of recording noisy vehicles based on user programmable sound characteristics. Designed primarily to identify noisy engine brakes in accordance with Engine Brakes Noise Standards, currently being developed by the National Transport Commission, the camera can also iden-tify noise from individual vehicles during acceleration. This paper describes the drivers behind the development of the camera, the design of the technology, its capabilities and data collected to date.
INTRODUCTION
The transport sector is a significant contributor to community noise and transport and environment agencies around Austra-lia receive numerous complaints from individuals about traf-fic noise in general and about individual vehicle noise. Over the last several years the number of these complaints has been gradually increasing particularly in relation to noise generated by heavy vehicle engine brakes.
Indeed, the Australian road freight task is forecast to continue to grow at an average annual rate of around 4.1% (Apelbaum 2006). This increase is expected to be achieved by more heavy vehicles, carrying more weight and travelling in-creased average distances per trip and this is likely to exacer-bate the noise problem.
Anecdotally, in Australia, the expenditure on traffic noise barriers and other noise treatments such as quiet pavements has been increasing over time as a percentage of road project costs.
Noise barriers are also not as effective in mitigating noise generated by individual vehicles as is control of the noise at its source. In its traditional approach however vehicle en-forcement can be resource intensive. The need to pull vehi-cles over to make stationary noise measurements also incon-veniences drivers of compliant vehicles.
Noise generated by heavy vehicle engine brakes is currently unregulated in Australia and its measurement can only be made while the vehicle is in motion. There is also a poor correlation between stationary noise and engine brake noise.
A new approach to enforcement of noise from individual motor vehicles was therefore required to address this growing community concern.
DEVELOPMENT OF THE NOISE CAMERA
The notion of the noise camera technology was conceived within the South Australian Department for Transport, En-
ergy and Infrastructure almost ten years ago and since that time three versions of the system were developed.
The original system was based on “off the shelf” componen-try and allowed triggering on the basis of sound pressure level (SPL) only and its setting was performed through a manual potentiometer adjustment. The early trials and ex-periences proved invaluable in establishing the latest noise camera specification.
The last two versions of the system were developed under a contract by a Sydney based company Acoustic Technologies Pty Ltd (AT) following a tender evaluation that the company won in March 2003. AT’s experience in the provision of acoustical systems and instrumentation to military and com-mercial customers in Australia and around the world contrib-uted in part to their winning formulae.
The first prototype of the camera was delivered in September 2003 and testing and evaluation of the system took place over the next 6 months. The second version of the system was delivered in early 2006 and incorporated improvements relat-ing to the analysis software and night time visibility. Addi-tional features included extra sound analysis functions and a radar input allowing recording and triggering on the basis of vehicle speed and length.
The design of the camera has also been influenced by the development of the National Transport Commission’s Engine Brake Noise Standards (NTC 2006) with a view of poten-tially using the system in the future to enforce the Standards.
MAIN NOISE CAMERA FEATURES
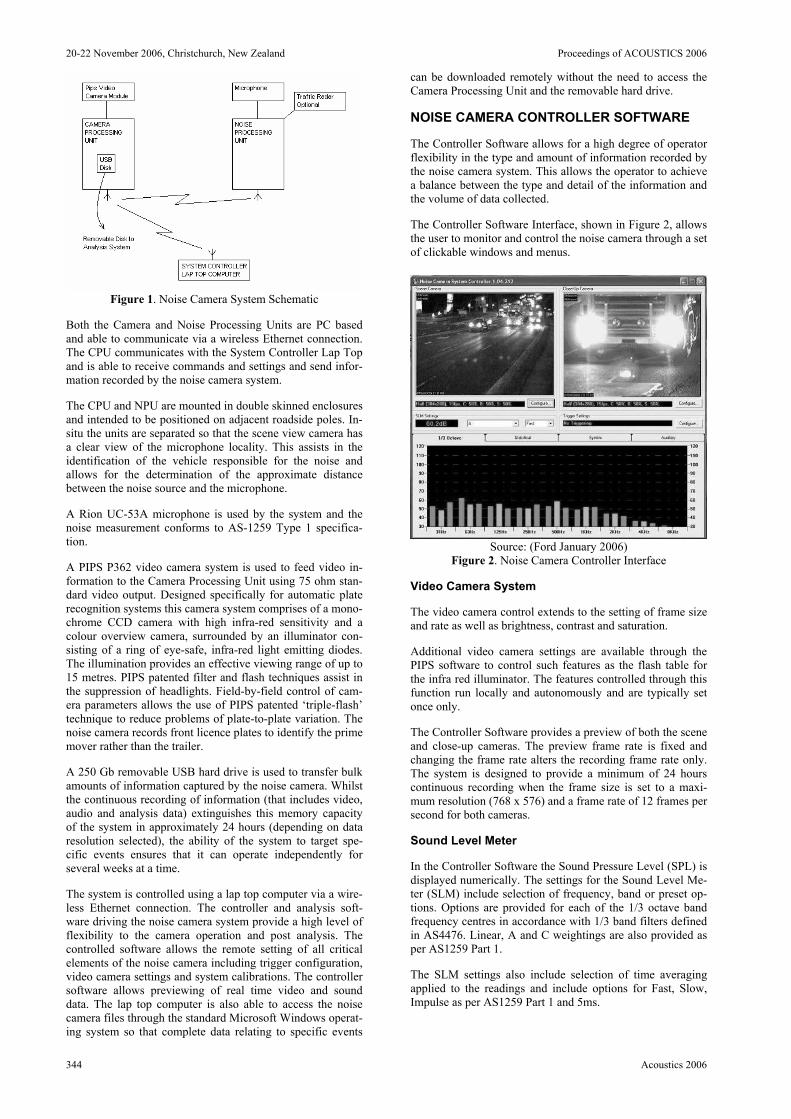
The noise camera system comprises of the three main com-ponents namely (Figure 1, Ford Jan & March 2006): • the Noise Processing Unit (NPU) and microphone • the Camera Processing Unit (CPU) and two video cam-
eras (for scene and close-up views) and • the system controller lap top computer.
The NPU can also be fitted with an optional radar system to allow triggering on the basis of vehicle length and/or speed.
20-22 November 2006, Christchurch, New Zealand Proceedings of ACOUSTICS 2006
344 Acoustics 2006
Figure 1. Noise Camera System Schematic
Both the Camera and Noise Processing Units are PC based and able to communicate via a wireless Ethernet connection. The CPU communicates with the System Controller Lap Top and is able to receive commands and settings and send infor-mation recorded by the noise camera system.
The CPU and NPU are mounted in double skinned enclosures and intended to be positioned on adjacent roadside poles. In- situ the units are separated so that the scene view camera has a clear view of the microphone locality. This assists in the identification of the vehicle responsible for the noise and allows for the determination of the approximate distance between the noise source and the microphone.
A Rion UC-53A microphone is used by the system and the noise measurement conforms to AS-1259 Type 1 specifica-tion.
A PIPS P362 video camera system is used to feed video in-formation to the Camera Processing Unit using 75 ohm stan-dard video output. Designed specifically for automatic plate recognition systems this camera system comprises of a mono-chrome CCD camera with high infra-red sensitivity and a colour overview camera, surrounded by an illuminator con-sisting of a ring of eye-safe, infra-red light emitting diodes. The illumination provides an effective viewing range of up to 15 metres. PIPS patented filter and flash techniques assist in the suppression of headlights. Field-by-field control of cam-era parameters allows the use of PIPS patented ‘triple-flash’ technique to reduce problems of plate-to-plate variation. The noise camera records front licence plates to identify the prime mover rather than the trailer.
A 250 Gb removable USB hard drive is used to transfer bulk amounts of information captured by the noise camera. Whilst the continuous recording of information (that includes video, audio and analysis data) extinguishes this memory capacity of the system in approximately 24 hours (depending on data resolution selected), the ability of the system to target spe-cific events ensures that it can operate independently for several weeks at a time.
The system is controlled using a lap top computer via a wire-less Ethernet connection. The controller and analysis soft-ware driving the noise camera system provide a high level of flexibility to the camera operation and post analysis. The controlled software allows the remote setting of all critical elements of the noise camera including trigger configuration, video camera settings and system calibrations. The controller software allows previewing of real time video and sound data. The lap top computer is also able to access the noise camera files through the standard Microsoft Windows operat-ing system so that complete data relating to specific events
can be downloaded remotely without the need to access the Camera Processing Unit and the removable hard drive.
NOISE CAMERA CONTROLLER SOFTWARE
The Controller Software allows for a high degree of operator flexibility in the type and amount of information recorded by the noise camera system. This allows the operator to achieve a balance between the type and detail of the information and the volume of data collected.
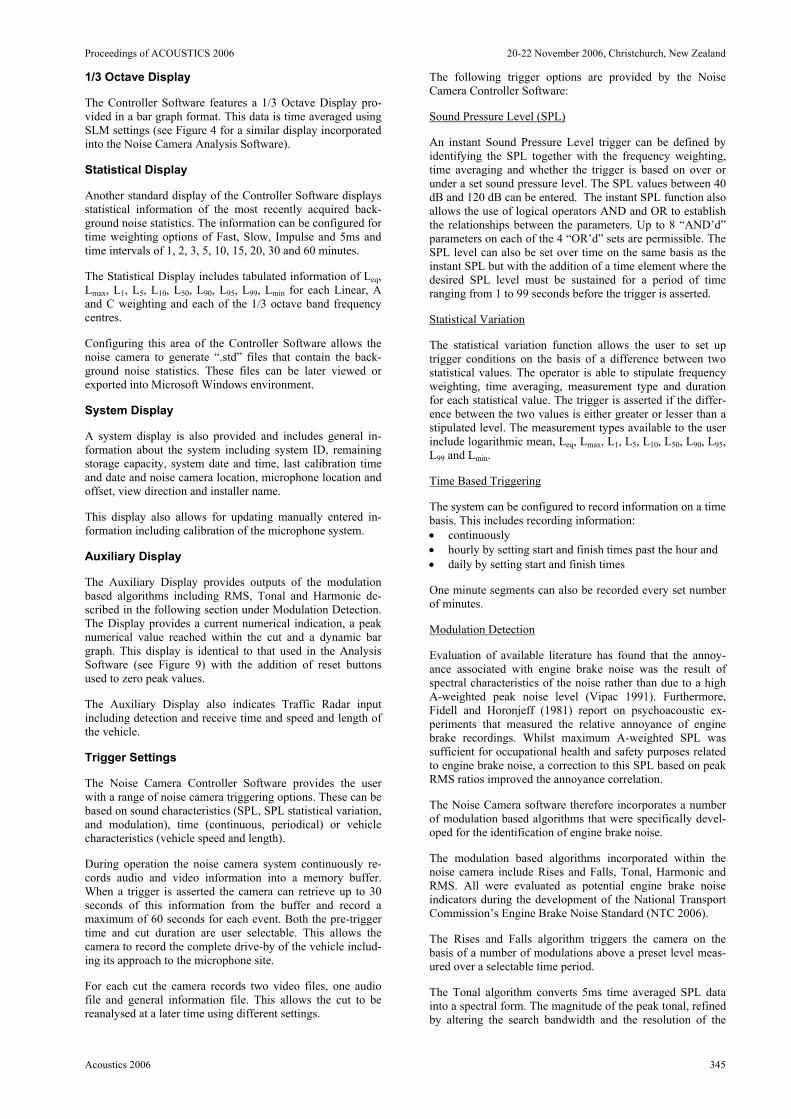
The Controller Software Interface, shown in Figure 2, allows the user to monitor and control the noise camera through a set of clickable windows and menus.
Source: (Ford January 2006)
Figure 2. Noise Camera Controller Interface
Video Camera System
The video camera control extends to the setting of frame size and rate as well as brightness, contrast and saturation.
Additional video camera settings are available through the PIPS software to control such features as the flash table for the infra red illuminator. The features controlled through this function run locally and autonomously and are typically set once only.
The Controller Software provides a preview of both the scene and close-up cameras. The preview frame rate is fixed and changing the frame rate alters the recording frame rate only. The system is designed to provide a minimum of 24 hours continuous recording when the frame size is set to a maxi-mum resolution (768 x 576) and a frame rate of 12 frames per second for both cameras.
Sound Level Meter
In the Controller Software the Sound Pressure Level (SPL) is displayed numerically. The settings for the Sound Level Me-ter (SLM) include selection of frequency, band or preset op-tions. Options are provided for each of the 1/3 octave band frequency centres in accordance with 1/3 band filters defined in AS4476. Linear, A and C weightings are also provided as per AS1259 Part 1.
The SLM settings also include selection of time averaging applied to the readings and include options for Fast, Slow, Impulse as per AS1259 Part 1 and 5ms.
Proceedings of ACOUSTICS 2006 20-22 November 2006, Christchurch, New Zealand
Acoustics 2006 345
1/3 Octave Display
The Controller Software features a 1/3 Octave Display pro-vided in a bar graph format. This data is time averaged using SLM settings (see Figure 4 for a similar display incorporated into the Noise Camera Analysis Software).
Statistical Display
Another standard display of the Controller Software displays statistical information of the most recently acquired back-ground noise statistics. The information can be configured for time weighting options of Fast, Slow, Impulse and 5ms and time intervals of 1, 2, 3, 5, 10, 15, 20, 30 and 60 minutes.
The Statistical Display includes tabulated information of Leq, Lmax, L1, L5, L10, L50, L90, L95, L99, Lmin for each Linear, A and C weighting and each of the 1/3 octave band frequency centres.
Configuring this area of the Controller Software allows the noise camera to generate “.std” files that contain the back-ground noise statistics. These files can be later viewed or exported into Microsoft Windows environment.
System Display
A system display is also provided and includes general in-formation about the system including system ID, remaining storage capacity, system date and time, last calibration time and date and noise camera location, microphone location and offset, view direction and installer name.
This display also allows for updating manually entered in-formation including calibration of the microphone system.
Auxiliary Display
The Auxiliary Display provides outputs of the modulation based algorithms including RMS, Tonal and Harmonic de-scribed in the following section under Modulation Detection. The Display provides a current numerical indication, a peak numerical value reached within the cut and a dynamic bar graph. This display is identical to that used in the Analysis Software (see Figure 9) with the addition of reset buttons used to zero peak values.
The Auxiliary Display also indicates Traffic Radar input including detection and receive time and speed and length of the vehicle.
Trigger Settings
The Noise Camera Controller Software provides the user with a range of noise camera triggering options. These can be based on sound characteristics (SPL, SPL statistical variation, and modulation), time (continuous, periodical) or vehicle characteristics (vehicle speed and length).
During operation the noise camera system continuously re-cords audio and video information into a memory buffer. When a trigger is asserted the camera can retrieve up to 30 seconds of this information from the buffer and record a maximum of 60 seconds for each event. Both the pre-trigger time and cut duration are user selectable. This allows the camera to record the complete drive-by of the vehicle includ-ing its approach to the microphone site.
For each cut the camera records two video files, one audio file and general information file. This allows the cut to be reanalysed at a later time using different settings.
The following trigger options are provided by the Noise Camera Controller Software:
Sound Pressure Level (SPL)
An instant Sound Pressure Level trigger can be defined by identifying the SPL together with the frequency weighting, time averaging and whether the trigger is based on over or under a set sound pressure level. The SPL values between 40 dB and 120 dB can be entered. The instant SPL function also allows the use of logical operators AND and OR to establish the relationships between the parameters. Up to 8 “AND’d” parameters on each of the 4 “OR’d” sets are permissible. The SPL level can also be set over time on the same basis as the instant SPL but with the addition of a time element where the desired SPL level must be sustained for a period of time ranging from 1 to 99 seconds before the trigger is asserted.
Statistical Variation
The statistical variation function allows the user to set up trigger conditions on the basis of a difference between two statistical values. The operator is able to stipulate frequency weighting, time averaging, measurement type and duration for each statistical value. The trigger is asserted if the differ-ence between the two values is either greater or lesser than a stipulated level. The measurement types available to the user include logarithmic mean, Leq, Lmax, L1, L5, L10, L50, L90, L95, L99 and Lmin.
Time Based Triggering
The system can be configured to record information on a time basis. This includes recording information: • continuously • hourly by setting start and finish times past the hour and • daily by setting start and finish times
One minute segments can also be recorded every set number of minutes.
Modulation Detection
Evaluation of available literature has found that the annoy-ance associated with engine brake noise was the result of spectral characteristics of the noise rather than due to a high A-weighted peak noise level (Vipac 1991). Furthermore, Fidell and Horonjeff (1981) report on psychoacoustic ex-periments that measured the relative annoyance of engine brake recordings. Whilst maximum A-weighted SPL was sufficient for occupational health and safety purposes related to engine brake noise, a correction to this SPL based on peak RMS ratios improved the annoyance correlation.
The Noise Camera software therefore incorporates a number of modulation based algorithms that were specifically devel-oped for the identification of engine brake noise.
The modulation based algorithms incorporated within the noise camera include Rises and Falls, Tonal, Harmonic and RMS. All were evaluated as potential engine brake noise indicators during the development of the National Transport Commission’s Engine Brake Noise Standard (NTC 2006).
The Rises and Falls algorithm triggers the camera on the basis of a number of modulations above a preset level meas-ured over a selectable time period.
The Tonal algorithm converts 5ms time averaged SPL data into a spectral form. The magnitude of the peak tonal, refined by altering the search bandwidth and the resolution of the

20-22 November 2006, Christchurch, New Zealand Proceedings of ACOUSTICS 2006
346 Acoustics 2006
spectral data, is used as the basis of the output source (Keeley 2004).
The Harmonic algorithm expands the Tonal algorithm by incorporating the harmonics of the peak tonal into the output score (Keeley 2004).
The RMS algorithm provides a quantitative indication of the intensity of short term variations in the noise signal compared to the long term average.
Radar
Developed for the purpose of collecting complete noise data sets about specific vehicle classes defined on the basis of vehicle length and to allow evaluation of the impact of vehi-cle speed on noise, the Radar information triggers the noise camera on the basis of preset vehicle lengths and speeds or a combination thereof. The lengths and speeds can be defined as a range of acceptable values.
NOISE CAMERA ANALYSIS SOFTWARE
The Noise Camera Analysis Software resembles in appear-ance the Controller Interface and displays scene and close-up camera views in the upper portion of the screen and cut in-formation in the lower portion. Figure 3 shows an example of the Analysis Software displaying a vehicle captured by Vic Roads in Melbourne’s CityLink Domain Tunnel.
0
Figure 3. Noise Camera Analysis Interface
The recorded information (cut information and noise statis-tics) is accessed through the File Menu located on the top left hand corner of the screen.
Once loaded, the recorded events can be replayed using con-trol icons positioned below the scene and close-up camera displays (see Figure 4). These icons allow the operator to play the recording or view it one frame at a time or move between recorded events.
This window also contains SPL meter settings where the operator can set 1/3 octave frequency or linear, A and C weightings as well as time averaging options. These settings are then used to display SPL in a graphical format as de-scribed below.
Another important feature of the analysis software is the Lateral Estimation function. The program assumes a hemi-spherical noise dissipation pattern to arrive at a corrected SPL reading once the system is calibrated and the scene cam-era view used to estimate the distance from the microphone to the noise source.
Figure 4. Camera, SPL and Lateral Estimation Control
The lower portion of the analysis screen provides access to cut information by clicking one of the seven tabs provided including cuts list, general cut information, noise statistics, SPL graph, narrowband, 1/3 octave and auxiliary for RMS, tonal, harmonic and radar data.
SPL Graph and 1/3 Octave
Figure 3 shows SPL graphs over the duration of the cut and 1/3 Octave data in a real time mode.
The SPL graph displays two channels with SPL data based on user selectable weighting and time averaging. As the infor-mation is recorded in an audio file the display of SPL can be recalculated using different weighting and time averaging than used to capture the original data.
Cut List
The Cut List tab provides access to a list of cuts contained in the directory currently loaded into the Analysis Software.
Figure 5. Cut List Display
From this display, cuts can be accessed individually or on a folder basis. The information contained in a folder can also be subjected to a trigger simulation using all trigger settings, except time based, available in the Noise Camera Controller Software. This is particularly useful in analysing the effec-tiveness of a new trigger on data recorded continuously.
This function can also be used to develop a subset of triggers to fine tune the original trigger used to collect the data. In the future both trigger parameters could be used in combination to minimise post analysis of information.
Cut Information
Clicking the cut information tab displays the general informa-tion window related to this particular cut. The information contained in this window is largely manually entered by the operator at the time of configuring the system but also in-cludes file information and cut time and date.
Figure 6. Cut Information Display

Proceedings of ACOUSTICS 2006 20-22 November 2006, Christchurch, New Zealand
Acoustics 2006 347
Cut Statistics
The cut statistics information is accessed by clicking the cut statistics tab. This window displays statistical data associated with this cut and indicates Leq, Lmax, L1, L5, L10, L50, L90, L95, L99, Lmin for each Linear, A and C weighting and each of the 1/3 octave band frequency centres.
Figure 7. Cut Statistics Display
This statistical information can be reconfigured using a dif-ferent time weighting.
Narrowband
The narrowband display provides the operator with a graphi-cal display of frequency against signal amplitude in real time. The frequency scale is linear and continuous, with a display resolution of approximately 23.4 Hz. To assist the operator in estimating frequency and amplitude data from this display a mouse pointer is provided and its position on the screen re-lates to the frequency and amplitude data displayed in the top centre text box.
Figure 8. Narrowband Display
Auxiliary Information
The auxiliary display provides identical information to that of the Noise Camera Controller Software except that the Con-troller Software includes peak values reset function. The reset function is necessary in the Controller Software as the data is analysed on a continuous basis as it is received by the Noise Camera. In the Analysis Software the modulation indexes are recalculated for each cut.
Figure 9. Auxiliary Display
The auxiliary display also includes Traffic Radar information including detection and receive time, vehicle speed and length.
PRELIMINARY DATA
At the time of writing this paper, Vic Roads is in the process of using the Noise Camera system to collect data with the aim of developing a better understanding about engine brake noise. To date, data has been collected at a number of sites and over 20,000 recordings were made over a period of 40 days and this includes approximately 10,000 engine brake events. Ten different noise camera trigger settings were evaluated.
Whilst this work is still in progress, it is included in this pa-per to demonstrate the capability of the noise camera to col-lect large volumes of relevant information relating to individ-ual vehicles. It must be stressed however that this data is not quality controlled and should be treated as preliminary data only.
The following data comes from Melbourne’s CityLink Do-main Tunnel and represents 577 engine brake events. Each event recorded the RMS (as per RMS algorithm described under Trigger Settings – Modulation Detection) and Lmax value emitted by the vehicle driving by.
Figure 10 represents all 577 pairs of RMS and Lmax readings plotted from the lowest RMS value of 0.7 dBA on the left in ascending order to the highest RMS value of 3.1 dBA on the right. This graph indicates that the majority (95%) of trucks recorded in this sample fall below RMS of 1.7 dBA. As the RMS value provides a good measure of modulation intensity and this is closely related to the community annoyance about engine brake noise, the RMS algorithm could be used in set-ting a standard for heavy vehicle engine brake modulation.
This graph also indicates a poor level of correlation between Lmax values and RMS although this is exacerbated by the Lmax values not being corrected for distance.
84
89
94
99
104
109
1 101 201 301 401 501
Ascending RMS Data Set
Lmax
(dB
A)
0.5
1
1.5
2
2.5
3
3.5
RM
S (d
BA
)
RMSLmax
Figure 10. Lmax and RMS data set
This information was collected using an Lmax trigger set at 85 dBA and the highest reading recorded at 104 dBA. Figure 11 indicates the frequency distribution associated with this vari-able. The mean for this distribution was calculated at 88.6 dBA.

20-22 November 2006, Christchurch, New Zealand Proceedings of ACOUSTICS 2006
348 Acoustics 2006
25.5%
21.5%
8.1%
4.7%3.3% 2.6% 1.4% 0.5% 0%
32.2%
0%
5%
10%
15%
20%
25%
30%
35%
84.5 86.5 88.5 90.5 92.5 94.5 96.5 98.5 100.5 102.5 104.5Lmax Bins (dBA)
Freq
uenc
y (%
)
Figure 11. Frequency Distribution Lmax
Figure 12 shows a frequency distribution for the RMS data with a mean calculated at approximately 1.1 dBA.
26.5%
17.9%
5.0%1.9% 0.9% 0.3%
47.1%
0%
5%
10%
15%
20%
25%
30%
35%
40%
45%
50%
0.6 0.9 1.2 1.5 1.8 2.1 2.4 2.7RMS Bins (dBA)
Freq
uenc
y (%
)
Figure 12. Frequency Distribution RMS
CONCLUSIONS
The development of the Noise Camera system has provided an opportunity for legislators and researchers to learn more about the condition of the in-service motor vehicle fleet. This includes information about both the condition of light vehi-cles and heavy vehicles, especially those incorporating en-gine brakes.
The collection of data about individual vehicle performance will inform future policy direction in relation to motor vehi-cle noise enforcement. Indeed, information collected to date, is being used to assist in the development of the National Transport Commission’s Engine Brake Noise Standards.
In the future, the Noise Camera technology may also assist legislators in enforcing the motor vehicle noise standards. The Noise Camera has already proven its ability to effec-tively identified noisy engine brakes and could be used to enforce the proposed Engine Brake Noise Standards if they are accepted and introduced into legislation.
The Camera could also be used to identify excessively noisy vehicles on the basis of Lmax levels for possible follow up by enforcement authorities and testing of vehicles in accordance with established stationary noise standards.
ACKNOWLEDGEMENTS
The author wishes to acknowledge the support of Vic Roads and especially their Senior Environmental Officer, Phil West, in collecting and sharing the Preliminary Data discussed in this paper.
The author also expresses his appreciation to the Director, Sustainable Transport Policy and Planning, Department for Transport, Energy and Infrastructure SA, for permission to publish this paper.
References Apelbaum J. 2006, Australian Transport Facts 2006, Apel-
baum Consulting Group, Melbourne. Fidell, S. and Horonjeff, R. 1981, Measurements of the Im-
pulsiveness and Annoyance of Compression Release En-gine Brake Noise, Report to the Office of Noise Abate-ment and Control – Environmental Protection Agency, EPA Report 550/9-82-100.
Ford W. January 2006, Noise Camera User Guide, Acoustic Research Laboratories Pty Ltd, Sydney.
Ford W. March 2006, Noise Camera Analysis Software User Guide, Acoustic Research Laboratories Pty Ltd, Sydney.
Keeley, D. (2004), Analysis of Recorded Noise Events – Roadside Measurement and Evaluation of Heavy-Vehicle Engine Brake Noise, Acoustic Technologies Pty Ltd for the National Transport Commission, Sydney.
NTC (National Transport Commission), NSW RTA, 2006, Engine Brake Noise – Draft Regulatory Impact State-ment, NTC, Melbourne.
Vipac 1991, Study into Engine Compression-Brake Noise and the Feasibility of a Roadside Test, Vipac report num-ber 34950-2.