nogueira e m 2008 wood density allometry and …philip.inpa.gov.br/publ_livres/teses e dissertacoes...
TRANSCRIPT

NATIONAL INSTITUTE FOR RESEARCH IN THE AMAZON – INPA
Integrated Graduate Program in Tropical Biology and Natural Resources – PBTRN
Graduate Program in Tropical Forest Science - CFT
WOOD DENSITY AND TREE ALLOMETRY IN FORESTS OF
BRAZIL’S ‘ARC OF DEFORESTATION’: IMPLICATIONS FOR
BIOMASS AND EMISSION OF CARBON FROM LAND-USE CHANGE
IN BRAZILIAN AMAZONIA
EULER MELO NOGUEIRA
Manaus, Amazonas
February 2008.
NATIONAL INSTITUTE FOR RESEARCH IN THE AMAZON – INPA
Integrated Graduate Program in Tropical Biology and Natural Resources – PBTRN
Graduate Program in Tropical Forest Science - CFT
WOOD DENSITY AND TREE ALLOMETRY IN FORESTS OF
BRAZIL’S ‘ARC OF DEFORESTATION’: IMPLICATIONS FOR
BIOMASS AND EMISSION OF CARBON FROM LAND-USE CHANGE
IN BRAZILIAN AMAZONIA
EULER MELO NOGUEIRA
Adviser: Dr. PHILIP MARTIN FEARNSIDE
Co-Adviser: Dr. Bruce Walker Nelson
Thesis submitted to the PPG-
BTRN in partial fulfillment of the
requirements for the degree Doctor
in Tropical Forest Science, area of
concentration: Forest Management.
Manaus, Amazonas
February 2008.

ii
Synopsis:
This study presents estimates of wood density, wood moisture content, allometry, and
biomass stock for the southern and southwestern portions of the ‘arc of deforestation',
and adjusts the estimates of biomass and of carbon emission for Brazilian Amazonia.
Keywords: Global Warming, Biomass, Wood density, Allometry, Arc of deforestation,
Amazonian.
N778 Nogueira, Euler Melo Wood density and tree allometry in forests of Brazil's “arc of deforestation” implications for biomass and emission of carbon from land-use change in Brazilian Amazonia / Euler Melo Nogueira .--- Manaus : [s.n.], 2008. xviii, 130 f. : il. Tese (Ph.D) --- INPA/UFAM, Manaus, 2008 Adviser: Philip Martin Fearnside Co-Adviser : Bruce Walker Nelson Área of concentration : Forest Management 1. Forest biomass – Amazon (region). 2. Wood. 3. Global warming. I. Título. CDD 19. ed. 634.9285

iii
Dedication
To the Lord God, creator of heaven and
earth, to my parents José Anísio Nogueira and
Lindaura Martins Melo Nogueira, and to my
siblings: Georgheton and family, Liliane,
Dayana and Maria Adonay.

iv
Acknowledgments
To the Lord God, creator of Heaven and Earth: ‘Those who know your name will trust in You,
for You, oh Lord, have never forsaken those who seek You’ (Psalms 9:10, Holy Bible, New
International Version-NVI).
To the National Institute of Research in the Amazon (INPA) for the educational opportunity,
To the Foundation for the Support of Research of the State of Amazonas (FAPEAM) for a
scholarship,
I thank the National Council for Scientific and Technological Development-CNPq,
I am especially thankful to Dr. Philip Martin Fearnside for the orientation, constant support
and friendship,
I thank Dr. Bruce Walker Nelson, for the friendship, suggestions and revision of the
manuscripts,
It would also like my express my gratitude to Dr. José Francisco, coordinator of the graduate
program in Tropical Forest Science (CFT-INPA), for the constant encouragement, attention
and friendship,
I thank Dr. João B. Ferraz for making a vehicle available for fieldwork,
I thank all of the employees of Fazenda São Nicolau (ONF-Brasil/PEUGEOT) for making
available a collection area, accommodation and food from the ‘Carbon Well’ Project. I am
thankful to Vespaziano, Paulo and Valéria for logistical support,
I thank Rohden Indústria Lígnea Ltda for making an area of forest available and for field
support; I thank Vicente DaRiva and Imbrózio for the access to their lands,
I am very thankful to the Knidel family and to Cecílio and family for accommodation in
Juruena, and to Alzelindo Chave Vieira (Pé-na-cova), Leandro José, Joel Rodrigues do

v
Carmo, José Carlos de Lima for work in the field. I also thank Evandro Selva and Gheorges
W. Rotta for laboratory support,
I thank all of the members of the Presbyterian Church of Juruena for their friendship and
communion, as well as the members of the Baptist Church of Alta Floresta,
To the teachers and class friends in the CFT-INPA program,
To the employees of INPA who directly or indirectly made this study possible,
To my housemates, my gratitude for their friendship and companionship: to Allan, André,
Geraldo, Luciano, Márcio and Ronaldo; and especially to the friend-brother Ulysses and his
wife Kelly. I thank my most recent friends in the residence of SEBRAM. José, Max and
Linelma, and Pr. Idenildo and family,
I am very thankful to members of the Cachoeirinha Baptist Church, my family in Manaus. I
especially thank the youths, who are actors in eternal memories,
To the friends and teachers in the EBD course in SEBRAM
vi
“... because the Lord was with Joseph”
Genesis 39:23
vii
RESUMO
Incertezas nas estimativas de biomassa são a principal causa de incertezas nas estimativas de emissão de gases de efeito estufa na Amazônia. Os resultados apresentados neste estudo reduzem as incertezas nas estimativas de biomassa acima do solo, particularmente no sul e sudoeste da Amazônia brasileira (SSWA), regiões inseridas no ‘arco do desmatamento’. No Capítulo I novos dados de densidade de madeira obtidos nas florestas da região SSWA (403 árvores identificadas em nível de espécie e gênero) foram combinados com os inventários de volume de madeira produzidos pelo Projeto RadamBrasil (1973-1983). A área de cada unidade de vegetação, definidas pela intersecção entre tipos de florestas mapeados e divisão geopolítica dos estados, foi utilizada para obter a densidade de madeira média (0,583 g cm-3) para toda a região SSWA. Esta média é 13,6% menor do que o valor utilizado para esta região em estimativas prévias. A média de 0,642 g cm-3 foi obtida para a Amazônia brasileira como um todo, a partir das novas estimativas para as florestas da porção SSWA juntamente com estimativas para as outras regiões da Amazônia, corrigidas para a variação radial (-5,3%). A nova média de densidade é 7% menor que a média anteriormente estimada para a Amazônia brasileira: 0,69 g cm-3. O impacto sobre as estimativas de biomassa e emissão de carbono é substancial porque a redução é maior em tipos de floresta sob maior desmatamento. Para 1990, com 13,8 × 10³ km2 de desmatamento, as emissões para a Amazônia brasileira seriam reduzidas por 23,4-24,4 × 10⁶ Mg CO2-equivalente C/ano (para cenários de gás-traço alto e baixo), ou 9,4-9,5% da emissão grossa e 10,7% da emissão líquida comprometida, ambas excluindo o solo. No Capítulo II foram avaliadas relações lineares que descrevem a variação radial da densidade para árvores em floresta densa na Amazônia central (CA) e desenvolvidas novas relações para árvores em floresta aberta no sul da Amazônia (SA). A relação linear descrita na CA para a variação da densidade ao longo do fuste é similar para árvores no SA (p = 0,144). Também é demonstrado que as árvores no sul da Amazônia possuem conteúdo de umidade no fuste significativamente maior (0,416 ± 0,068 SD; n = 223) do que em árvores na CA (0,38; n = 50). O conteúdo de umidade tem uma forte relação inversa com a densidade básica da madeira, o que explica o menor conteúdo de umidade nas árvores na CA comparado ao SA. No Capítulo III é demonstrado que na CA as árvores são mais altas para um dado diâmetro que em florestas abertas dominadas por bambu e densas livres de bambu, no sudoeste da Amazônia (SW), bem como em florestas abertas no sul da Amazônia (SA). O impacto sobre as estimativas de biomassa foram respectivamente -11,0%, -6,2% e -3,6%. Isto sugere que a estimativa da Comunicação Nacional Brasileira no âmbito da Convenção Quadro das Nações Unidas para Mudanças Climáticas requer redução. As relações observadas entre diâmetro e altura foram inconsistentes com a suposição da teoria de ecologia metabólica e reforça o argumento que o expoente escalar alométrico varia em florestas sobre diferentes substratos ou com diferentes níveis de distúrbios naturais. No Capítulo IV é apresentada nova equação alométrica para estimativa de biomassa desenvolvida a partir de árvores diretamente pesadas no SA e equações para estimativas do volume do fuste na CA e no SA. Estas equações foram utilizadas para aperfeiçoar o modelo de biomassa historicamente aplicado na Amazônia, que se baseia em inventários de volume de madeira em larga-escala. Nova estimativa de biomassa foi produzida para a Amazônia brasileira incorporando novos valores de densidade de madeira, correções para incertezas em estimativa de volume de madeira e fatores utilizados para adicionar o volume dos fustes de pequenas árvores e biomassa das copas. Considerando todos os ajustes, o mapa indica estoque de 125,4 Pg (=1015 g) de biomassa seca (acima e abaixo do solo) para áreas originalmente florestadas na Amazônia Legal Brazileira (104,2 Pg somente acima do solo) no período dos inventários do RadamBrasil, portanto antes que intensivos desmatamentos tivessem ocorrido na região. Se as áreas desmatadas até 2006 forem eliminadas do cálculo, excluindo agricultura, pastagens e vegetação de floresta secundária, a estimativa de biomassa seca estocada é reduzida para 113,3 e 94,2 Pg (acima e abaixo do solo, e somente acima do solo).

viii
SUMMARY
Uncertainties in biomass estimates are the main source of uncertainty in estimates of greenhouse-gas emissions in Amazonia. The results presented in this study reduce the uncertainties in estimates of above-ground biomass, particularly in the southern and southwestern portions of the Brazilian Amazon (SSWA), which are in the ‘arc of deforestation.’ In Chapter I new data on wood density obtained in the forests of the SSWA area (403 trees identified to species or genus) are combined with the inventories of wood volume produced by Projeto RadamBrasil (1973-1983). The area of each vegetation unit, defined as the intersection among forest types and the boundaries of the nine states in Brazilian Amazonia, was used to calculate a mean wood density of 0.583 g.cm-3 for the SSWA as a whole. This average is 13.6% lower than the value used for this area in previous estimates. An average of 0.642 g.cm-3 was obtained for the Brazilian Amazon as a whole, starting from the new estimates for the forests of the SSWA together with estimates for the other areas of Amazonia, corrected for radial variation (-5.3%). The new density average is 7% lower than the average previously used for the Brazilian Amazon (0.69 g.cm-3). The impact on estimates of biomass and carbon emission is substantial because the reduction is largest in the forest types experiencing the most rapid deforestation. For 1990, with 13.8 × 10³ km2 of deforestation, the estimated emission for the Brazilian Amazon would be reduced by 23.4-24.4 × 10⁶ CO2-equivalent Mg C/year (for high and low trace-gas scenarios), or 9.4-9.5% of the gross emission and 10.7% of the net committed emission, both excluding the soil. In Chapter II linear relationships were appraised that describe the radial variation of density for trees in dense forest in the central Amazon (CA) and new relationships are developed for trees in open forest in the southern Amazon (SA). The linear relationship described in CA for the variation of density along the bole is similar for trees in SA (p = 0.144). It is also demonstrated that the trees in the southern Amazon have significantly higher humidity content in their boles (0.416 ± 0.068 SD; n = 223) than do trees in CA (0.38; n = 50). Moisture content of the bole had a strong inverse relationship with basic wood density and explains the lower moisture content in the trees in CA relative to SA. In Chapter III CA trees are shown to be taller for any given diameter than they are in bamboo-dominated dense forests, bamboo-free dense forests and open forests in the southwestern Amazon (SW), as well as in the open forests of the southern Amazon (SA). The impact on biomass estimates is -11.0%, -6.2% and -3.6%, respectively. This suggests that the estimate of the Brazilian National Communication to the United Nations Framework Convention on Climate Change requires revision. The relationships observed between diameter and height were inconsistent with the assumptions of metabolic ecological theory and the findings reinforce the argument that the scalar allometric exponent varies among forests growing on different substrata or with different levels of natural disturbance. In Chapter IV new allometric equations for biomass are derived starting from trees weighed directly in SA and from equations for estimates of volume of the bole in CA and in SA. These equations were used to improve the biomass model historically applied in Amazonia, which is based on large-scale inventories of wood volume. A new biomass estimate is produced for the Brazilian Amazon incorporating new values of wood density, corrections for uncertainties in estimates of wood volume and new values for factors used to add the volume of the boles of small trees and the biomass of the crowns. Considering all adjustments the biomass map indicates average biomass of 125.4 Pg (=1015 g) dry weight (above-ground + below-ground) for originally forested areas in the Brazilian Legal Amazon as a whole (104.2 Pg for above-ground only) at the time of the RadamBrasil inventories, which was before intensive deforestation had occurred in the region. If areas deforested through 2006 are eliminated, excluding agriculture, pasture and secondary forest vegetation, the estimation of dry biomass storage was reduced to 113.3 and 94.2 Pg (above-ground + below-ground and only above–ground).

ix
LIST OF TABLES
Chapter I: Wood density in forests of Brazil’s ‘arc of deforestation’: Implications for
biomass and flux of carbon from land-use change in Amazonia.
Table 1. Details of the various mean measures for whole disks and for heartwood at two
positions along the bole……………………………………………………………………32
Table 2. Average wood density for each vegetation unit in the SSWA based on wood
volume in three RadamBrasil publications, and the tables of density by taxon in this study
and that of Fearnside (1997)…………………………………………………..………...…37
Table 3. New mean wood density for Brazilian Amazonia (updated from Fearnside, 1997):
volume-weighted means by vegetation zone, vegetation type and state (g cm-3)…………38
Chapter II: Linear regressions for normalization of wood density in biomass estimates of
Amazon forests.
Table 1. Previously published equations relating wood density at different moisture
contents. Equations are only reported if used in previous studies on wood density of
tropical or Amazonian species…………………………………………………….……….47
Table 2. Linear regressions developed in dense forest in central Amazonia (CA) tested in
this study……………………………………………………………………………..….....48
Table 3. New linear regressions developed in open forest in southern Amazonia (SA)
proposed in this study………………………………………………………….………..…52
Table 4. Correlation between pattern of radial variation (%RV) in density with diameter
and total height in trees from two forest types: Dense forest, Central Amazonia and Open
forest, Southern Amazonia………………………………………………………...………55
Chapter III: Tree Height in Brazil’s ‘Arc of Deforestation’: Shorter trees in south and
southwest Amazonia imply lower biomass.
Table 1. Parameters of linear regressions for different Amazonian forest
types…………………………………………………………………...………….………..68
Table 2. Parameters of fitted linear relationships between log10(stem diameter) with
log10(tree total height) for different Amazonian forest types, including trees of all sizes,

x
diameter < 20 cm and trees with stem diameter ≥20 cm. Bold values highlight regression
slopes………………………………………………………………………………………73
Table 3. Wood density at breast height (dry weight at 80 oC/green volume with bark) in the
four Amazonian forest typesa…………………………………………………….…..……75
Table 4. Effect of total-height and wood-density corrections on estimated per-hectare
biomassa…………………………………………………………………………..…….….75
Chapter IV: Estimates of forest biomass in the Brazilian Amazon: New allometric equations
and adjustments to biomass from wood-volume inventories.
Table 1. Measurements of forest biomass and non-tree components from studies conducted
in Brazilian Amazonia (dry weight in Mg/ha-1 and % relative to stand biomass of trees ≥10
cm dbh)………………………………………………………………………………...…..90
Table 2. Parameters of the biomass equations [ln(Dry weight) = a + b ln(Diameter)] in
trees sampled in open forest in the southern Amazonia (SA) (diameter range 5-124 cm).
The diameter measurements were taken at breast height (1.30 m above the ground) or just
above any buttresses. Measurements of diameter are in cm and those of mass are in
Kg………………………………………………………………………………………….93
Table 3. Parameters of bole volume equations [ln(Corrected volume) = a + b ln(Diameter)]
in central (CA) and southern Amazonia (SA). The diameter measurements were taken at
breast height (1.36 m above the ground in CA or 1.30 m in SA) or just above any
buttresses. Measurements of the diameter are in cm and of those of volume are in
m3………………………………………………………………………………………..…98
Table 4. Mean tapering of the bole (form factor) in dense forest in central Amazonia (CA)
and in open forest in the southern Amazonia (SA). The table presents means of trees
sampled and means normalized by the diameter distribution expected per hectare. An
inventory of 72 ha (de Castilho et al., 2006) was used in CA in adjusting the diameter
classes. In SA 11 ha (Feldpausch et al., 2005) were used for trees ≥ 10 cm diameter and 30
ha (Pereira, 2005) for trees 5-10 cm in diameter. The diameter measurements were taken at
breast height (1.36 m above the ground in CA or 1.30 m in SA) or just above any
buttresses…………………………………………………………………………………101
Table 5. Average total biomass (below + above-ground) and above-ground biomass by
forest type (dry weight in Mg ha-1) and total stock by state (×106 Mg) in Brazilian Legal
Amazonia at the time of the RadamBrasil inventory, therefore before intensive

xi
deforestation had occurred. Values in brackets [value] denote only above-ground biomass.
All other values denote below + above-ground biomass. Secondary formations and non-
forest vegetation were not considered………………………………………………..…..105
Table 6. Stock estimate of dry biomass (×106 Mg) by state and forest type in Brazilian
Legal Amazonia, excluding areas deforested through 2006 (Brazil, INPE, 2007). Values in
brackets [value] denote only above-ground biomass. All other values denote below +
above-ground biomass. Secondary formations and non-forest vegetation were not
considered. The forest type is in the column headed “IBGE code” (see Table 5 for
correspondence)………………………………………………………………..…………106
xii
LIST OF FIGURES
Chapter I: Wood density in forests of Brazil’s ‘arc of deforestation’: Implications for
biomass and flux of carbon from land-use change in Amazonia.
Figure 1. Solid circles show collecton sites, from W to E: Sena Madureira, Cotriguaçu,
Juruena and Novo Progresso. States mentioned in text are outlined, from W to E: Acre,
Rondônia, Mato Grosso and Pará. Rectangles are the RadamBrasil inventories, from W to
E: SC.19 Rio Branco, SC.16 Porto Velho and SC.21 Juruena. Dark grey is the extent of
deforestation as of 2004, light grey is remaining forest, white is natural non-forest or
vegetation status undetected due to clouds. Deforestation data from Brazil's National
Insitute for Space Research (INPE)………………………………………..………………26
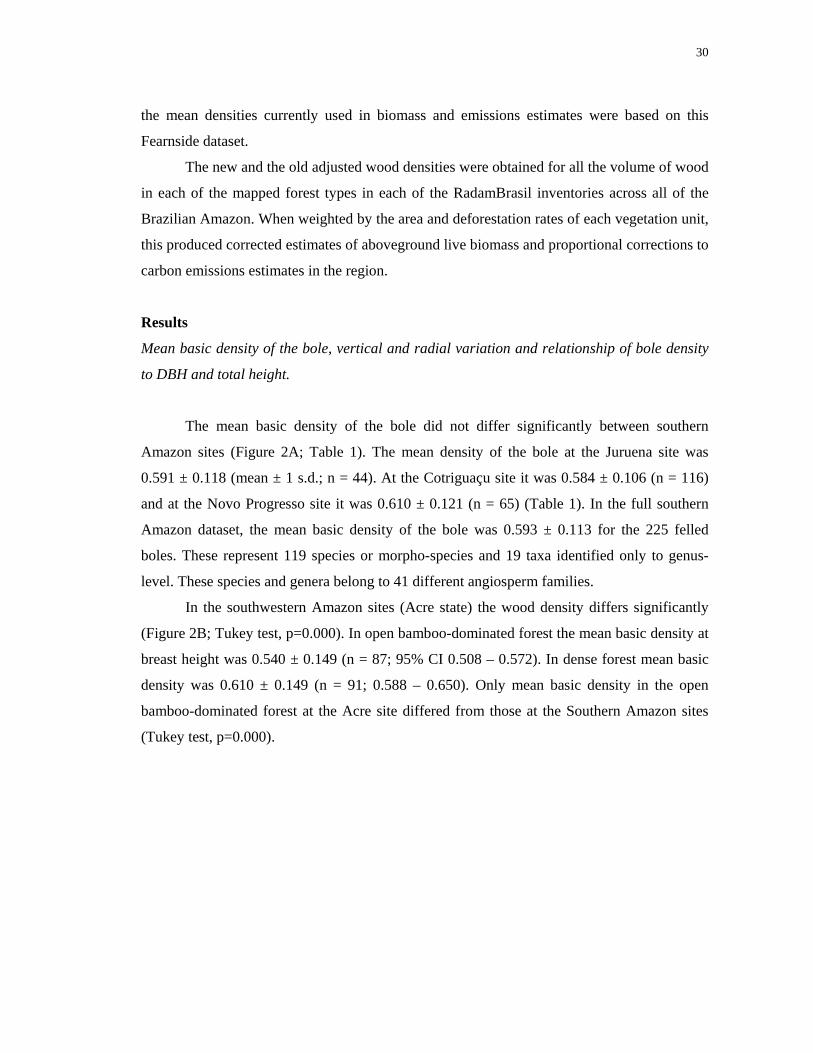
Figure 2. Mean basic density (g cm3) of the bole at the collection sites in southern Amazon,
open forest (A) and basic density at breast height in the southwestern Amazon, Acre state
(B): open bamboo-dominated forest and dense bamboo-free forest. (A) The mean was
obtained from the arithmetic mean of density at the base (height at breast or top of the
stump for Juruena site) and at the top of the bole………………………………………….31
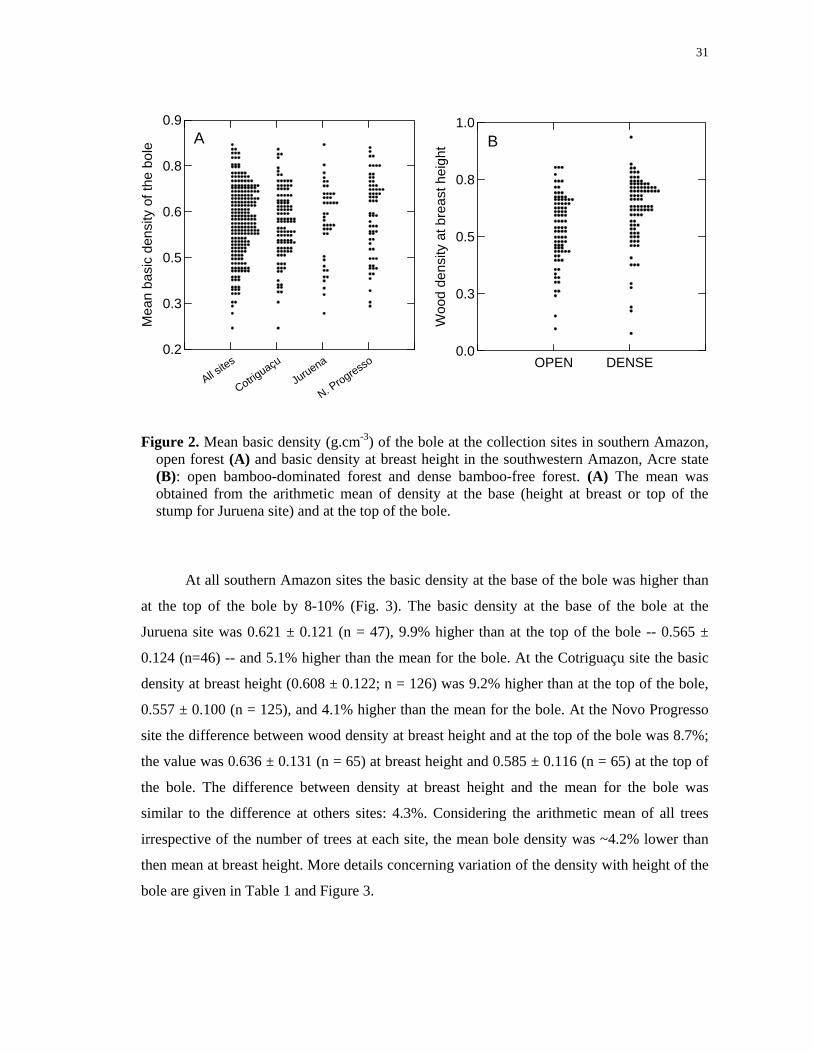
Figure 3. Decrease in the basic wood density (g cm3) from the base to the top of the bole. At
the Juruena site ‘base’ refers to a sample at the top of the stump. At the Cotriguaçu and
Novo Progresso sites ‘base’ refers to a sample at breast height (1.3 m)……………...……33
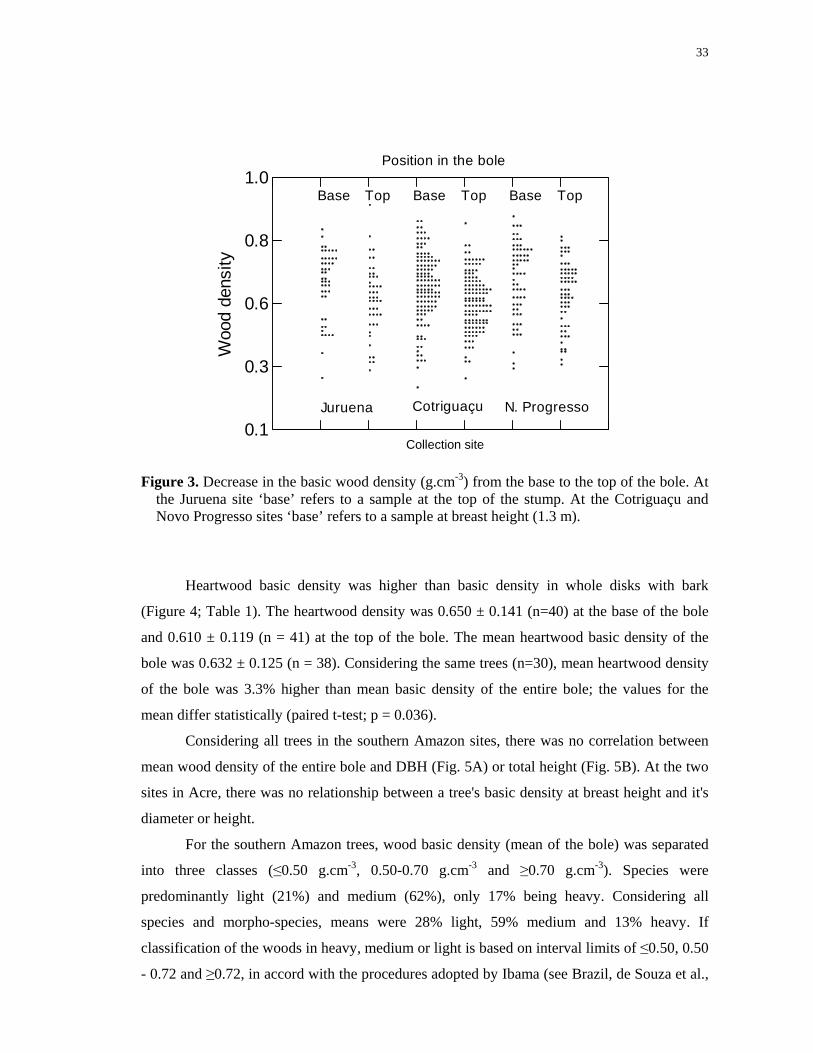
Figure 4. Radial variation between basic density (g cm3) of whole disks with bark and basic
density of heartwood………………………………………………………………….……34
Figure 5. Relationship between mean wood density, (A) DBH (m) and (B) total height
(m)…………………………………………………………………………………………34
Figure 6. Comparison by forest type between the dataset used in Fearnside (1997), the new
dataset obtained in southern Pará and northern Mato Grosso and the França (2002) dataset
obtained in Acre. The values for wood density in the figure represent mean species-level or
genus-level values. (A and B) Dense or open alluvial, submontane and lowland rain forests.
(C) Areas of ecological tension and contact between savanna/rain forest, savanna/seasonal
forest and rain forest/seasonal forest……………………………………………………….35
Chapter II: Linear regressions for normalization of wood density in biomass estimates of
Amazon forests.

xiii
Figure 1. The relationship between basic density of the full disk and basic density of the
heartwood in dense forest in central Amazonia (n = 146 trees) and in open forest in southern
Amazonia (n = 76 trees)……………………………………………………………………..52
Figure 2. Difference between basic density of heartwood and of the full disk (%RV) in dense
and open forest…………………………………………………………………….……….53
Figure 3. Relationship between diameter (at breast height or above buttresses) and total
height of trees with %RV (meaning the difference between basic density of heartwood and
that of the full disk) in open forest in southern Amazonia (A and B) and in dense forest in
central Amazonia (C and D). Positive values of %RV mean that density decreases towards
the outside and negative %RV values mean density increases towards the outside. For the
significance of Pearson correlation and probability values, see Table 4…………….…….54
Figure 4. Relationships between the mean basic wood density of the bole and wood density at
breast height (full disk) in dense forest in central Amazonia (n = 307) and in open forest in
southern Amazonia (n = 235)………………………………………………………………55
Figure 5. Relationship between moisture content (%) with mean basic wood density of the
bole (A) and, mean ‘green density’ of the bole (B). Variation in moisture content (%) along
the length of the bole is also presented (C)…………………………………………...……57
Chapter III: Tree Height in Brazil’s ‘Arc of Deforestation’: Shorter trees in south and
southwest Amazonia imply lower biomass.
Figure 1. Paired regressions of ln(diameter) versus total tree height, compared between
central Amazon dense forest (× symbols, dark), two of the southwest Amazon forests and
southern Amazon forest (solid circles, gray). A: southwest Amazon open, bamboo-
dominated forest, B: southwest Amazon dense forest, C: southern Amazon open forest. D:
ln (Diameter) versus total height (m) for all four forest types…………………...….……71
Figure 2. Biomass correction factor (Cm) for the effect of lower stem height in the three test
forests compared with the central Amazon dense forest. The upper line gives values for
southern Amazon open forest the intermediate line for SW Amazon dense forest and the
lower line for open, bamboo-dominated forest. D = diameter in centimeters…………….72
Figure 3. Stand biomass for trees + palms ≥5 cm dbh (or above buttresses) in the SW
Amazon is adjusted downward by 39% (SW Amazon open, bamboo-dominated forest),
22% (SW Amazon dense forest), and by 16% (southern Amazon open forest) after
xiv
corrections for lower wood density and shorter tree height as compared with these attributes
in central-Amazon dense forest…………………………………………………….............76
Chapter IV: Estimates of forest biomass in the Brazilian Amazon: New allometric equations
and adjustments to biomass from wood-volume inventories.
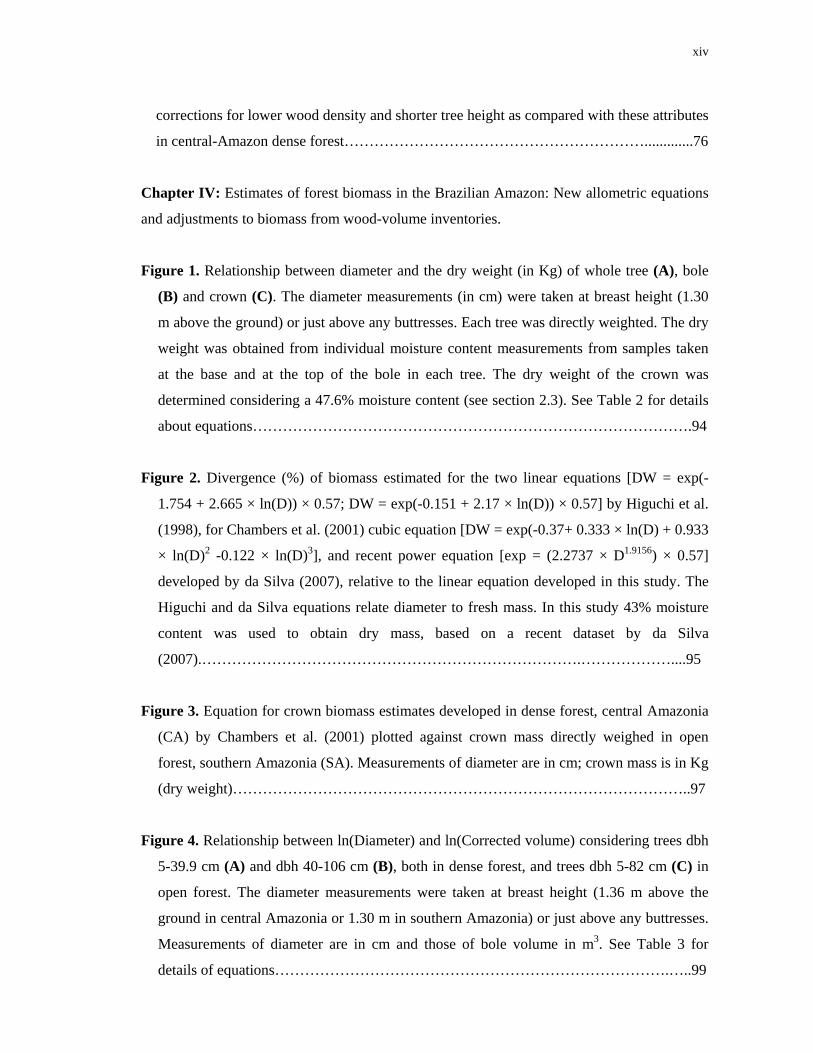
Figure 1. Relationship between diameter and the dry weight (in Kg) of whole tree (A), bole
(B) and crown (C). The diameter measurements (in cm) were taken at breast height (1.30
m above the ground) or just above any buttresses. Each tree was directly weighted. The dry
weight was obtained from individual moisture content measurements from samples taken
at the base and at the top of the bole in each tree. The dry weight of the crown was
determined considering a 47.6% moisture content (see section 2.3). See Table 2 for details
about equations…………………………………………………………………………….94
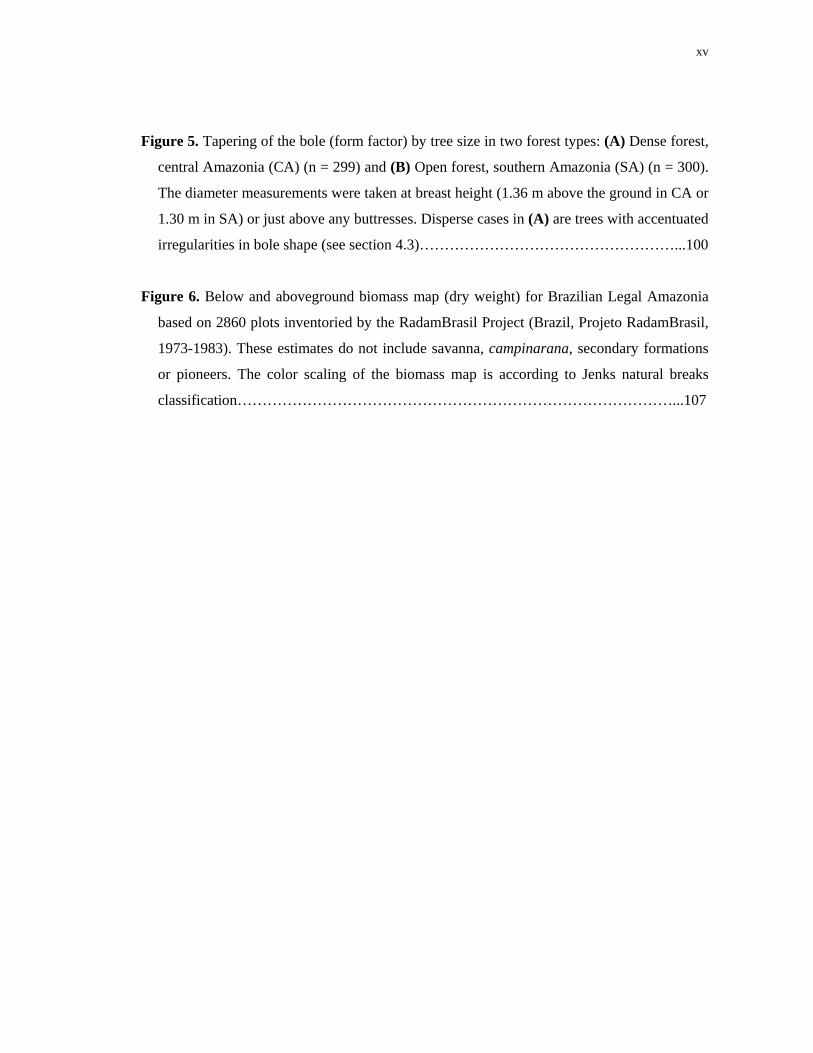
Figure 2. Divergence (%) of biomass estimated for the two linear equations [DW = exp(-
1.754 + 2.665 × ln(D)) × 0.57; DW = exp(-0.151 + 2.17 × ln(D)) × 0.57] by Higuchi et al.
(1998), for Chambers et al. (2001) cubic equation [DW = exp(-0.37+ 0.333 × ln(D) + 0.933
× ln(D)2 -0.122 × ln(D)3], and recent power equation [exp = (2.2737 × D1.9156) × 0.57]
developed by da Silva (2007), relative to the linear equation developed in this study. The
Higuchi and da Silva equations relate diameter to fresh mass. In this study 43% moisture
content was used to obtain dry mass, based on a recent dataset by da Silva
(2007).………………………………………………………………….………………....95
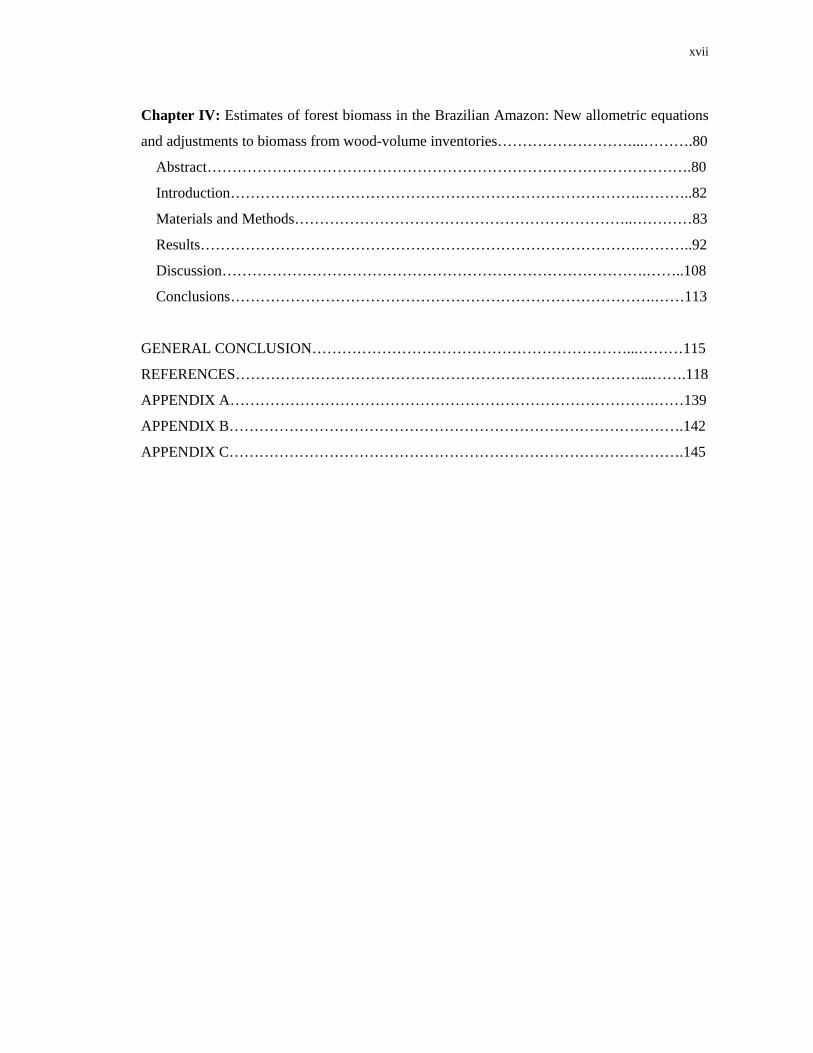
Figure 3. Equation for crown biomass estimates developed in dense forest, central Amazonia
(CA) by Chambers et al. (2001) plotted against crown mass directly weighed in open
forest, southern Amazonia (SA). Measurements of diameter are in cm; crown mass is in Kg
(dry weight)………………………………………………………………………………..97
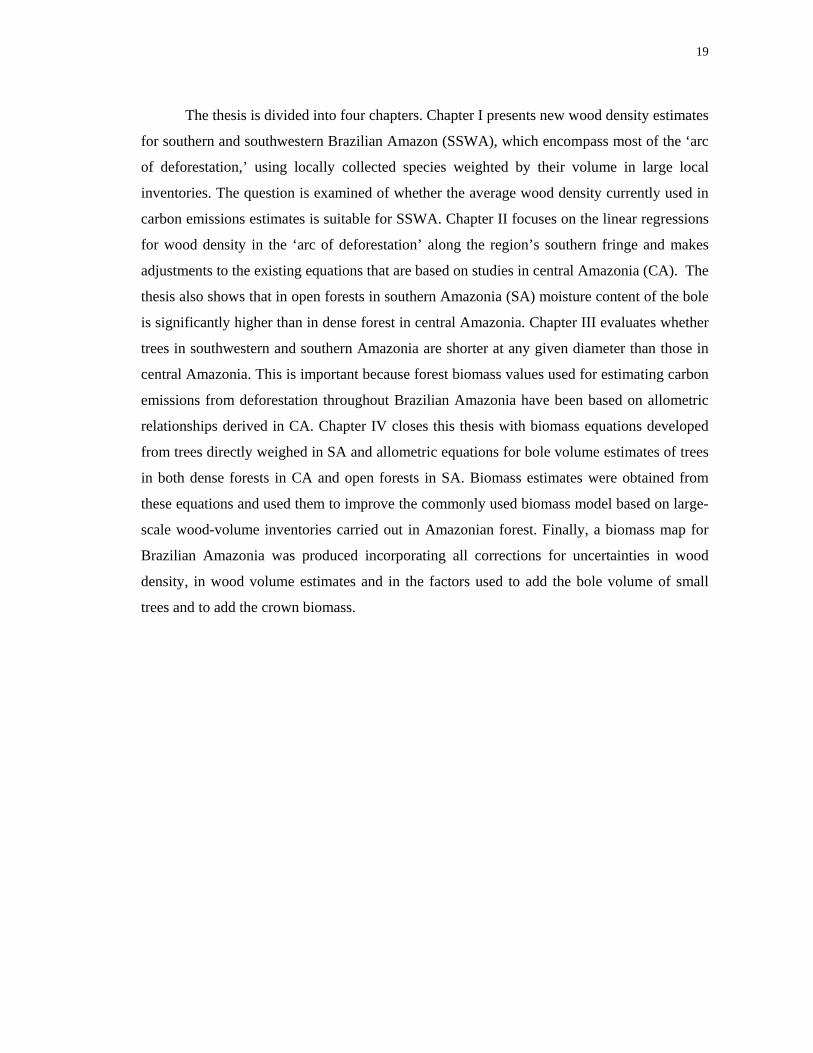
Figure 4. Relationship between ln(Diameter) and ln(Corrected volume) considering trees dbh
5-39.9 cm (A) and dbh 40-106 cm (B), both in dense forest, and trees dbh 5-82 cm (C) in
open forest. The diameter measurements were taken at breast height (1.36 m above the
ground in central Amazonia or 1.30 m in southern Amazonia) or just above any buttresses.
Measurements of diameter are in cm and those of bole volume in m3. See Table 3 for
details of equations…………………………………………………………………….…..99
xv
Figure 5. Tapering of the bole (form factor) by tree size in two forest types: (A) Dense forest,
central Amazonia (CA) (n = 299) and (B) Open forest, southern Amazonia (SA) (n = 300).
The diameter measurements were taken at breast height (1.36 m above the ground in CA or
1.30 m in SA) or just above any buttresses. Disperse cases in (A) are trees with accentuated
irregularities in bole shape (see section 4.3)……………………………………………...100
Figure 6. Below and aboveground biomass map (dry weight) for Brazilian Legal Amazonia
based on 2860 plots inventoried by the RadamBrasil Project (Brazil, Projeto RadamBrasil,
1973-1983). These estimates do not include savanna, campinarana, secondary formations
or pioneers. The color scaling of the biomass map is according to Jenks natural breaks
classification……………………………………………………………………………...107

xvi
TABLE OF CONTENTS
GENERAL INTRODUCTION……………….………………………………………………18
GENERAL OBJECTIVE………………………………………………………….…….……20
SPECIFIC OBJECTIVES………………………………………………………………….…20
MATERIALS AND METHODS……………………………………………………………..22
Chapter I: Wood density in forests of Brazil’s ‘arc of deforestation’: Implications for
biomass and flux of carbon from land-use change in Amazonia…………………………..…23
Abstract…………………………………………………………………………………….23
Introduction……………………………………………………………………………...…24
Materials and Methods………………………………………………………….….………25
Results……………………………………………………………………………………...30
Discussion……………………………………………………………………………….…39
Conclusions…………………………………………………………………………..…….43
Chapter II: Linear regressions for normalization of wood density in biomass estimates of
Amazon forests……………………………………………………………………..…..…….45
Abstract……………………………………………………………………………….……45
Introduction……………………………………………………………………...……..…..46
Materials and Methods………………………………………………………………….….49
Results……………………………………………………………………………………...51
Discussion…………………………………………………………………………….……57
Conclusions………………………………………………………………………….…..…62
Chapter III: Tree Height in Brazil’s ‘Arc of Deforestation’: Shorter trees in south and
southwest Amazonia imply lower biomass…………………………………………...……...63
Abstract…………………………………………………………………………………….63
Introduction……………………………………………………………………….………..64
Materials and Methods…………………………………………………………….……….66
Results……………………………………………………………………………….……..69
Discussion………………………………………………………………………….…..…..76
Conclusions……………………………………………………………………………...…79
xvii
Chapter IV: Estimates of forest biomass in the Brazilian Amazon: New allometric equations
and adjustments to biomass from wood-volume inventories………………………...……….80
Abstract…………………………………………………………………………………….80
Introduction……………………………………………………………………….………..82
Materials and Methods…………………………………………………………..…………83
Results…………………………………………………………………………….………..92
Discussion………………………………………………………………………….……..108
Conclusions………………………………………………………………………….……113
GENERAL CONCLUSION………………………………………………………...………115
REFERENCES………………………………………………………………………...…….118
APPENDIX A………………………………………………………………………….……139
APPENDIX B……………………………………………………………………………….142
APPENDIX C……………………………………………………………………………….145

18
GENERAL INTRODUCTION
Changes in the atmospheric abundance of greenhouse gases and aerosols, in solar
radiation and in land-surface properties alter the energy balance of the climate system. Global
atmospheric concentrations of carbon dioxide, methane and nitrous oxide have increased
markedly as a result of human activities since 1750 and now far exceed pre-industrial values
determined from ice cores spanning many thousands of years (IPCC, 2007). Global surface
temperature has increased ~0.2°C per decade over the past 30 years, similar to the warming
rate predicted in the 1980s in initial global climate model simulations with transient
greenhouse-gas changes (Hansen et al., 2006). The conclusion that global warming is a real
climate change is confirmed by surface temperature change as inferred from borehole
temperature profiles at remote locations, the rate of retreat of alpine glaciers around the world,
and progressively earlier breakup of ice on rivers and lakes (IPCC, 2001).
The primary source of the increased atmospheric concentration of carbon dioxide since
the pre-industrial period results from fossil-fuel use, with land-use change providing another
significant but smaller contribution (IPCC, 2007). Globally, the long-term flux of carbon from
changes in land use (1850–2000) released 156 PgC (1 Pg is 1015 g) to the atmosphere, about
60% of it from the tropics. Average annual fluxes during the 1980s and 1990s were 2.0 and
2.2 PgC yr-1, respectively, dominated by releases of carbon from tropical deforestation
(Houghton, 2003a). Because of this, the biomass of tropical forests plays an important role in
the global carbon cycle both as a dynamic reservoir of carbon and as a source of carbon
dioxide to the atmosphere in areas undergoing deforestation (Malhi et al., 2006; Fearnside,
2000a). Clearly the future state of Brazil’s Amazonian forests is of importance to the carbon
composition of the atmosphere (Brown and Lugo, 1992).
Uncertainty in forest biomass is responsible for much of the uncertainty in current
estimates of the flux of carbon from land-use change (Houghton et al., 2001). Accurate
estimation of biomass in Amazonian forest is an essential step in understanding the
contribution of deforestation to increase of carbon dioxide in the atmosphere (Brown, 1995).
The goal of this thesis is to reduce uncertainties in estimates of above-ground biomass
and of carbon emissions in Brazilian Amazonia, particularly in the ‘arc of deforestation’
where most of the carbon flux from land-use change takes place. This study focuses on
improved estimates of wood density, which is an important variable for conversion of bole
volume to biomass of the bole and in converting bole volume to tree biomass. New allometric
relationships are developed for this purpose.
19
The thesis is divided into four chapters. Chapter I presents new wood density estimates
for southern and southwestern Brazilian Amazon (SSWA), which encompass most of the ‘arc
of deforestation,’ using locally collected species weighted by their volume in large local
inventories. The question is examined of whether the average wood density currently used in
carbon emissions estimates is suitable for SSWA. Chapter II focuses on the linear regressions
for wood density in the ‘arc of deforestation’ along the region’s southern fringe and makes
adjustments to the existing equations that are based on studies in central Amazonia (CA). The
thesis also shows that in open forests in southern Amazonia (SA) moisture content of the bole
is significantly higher than in dense forest in central Amazonia. Chapter III evaluates whether
trees in southwestern and southern Amazonia are shorter at any given diameter than those in
central Amazonia. This is important because forest biomass values used for estimating carbon
emissions from deforestation throughout Brazilian Amazonia have been based on allometric
relationships derived in CA. Chapter IV closes this thesis with biomass equations developed
from trees directly weighed in SA and allometric equations for bole volume estimates of trees
in both dense forests in CA and open forests in SA. Biomass estimates were obtained from
these equations and used them to improve the commonly used biomass model based on large-
scale wood-volume inventories carried out in Amazonian forest. Finally, a biomass map for
Brazilian Amazonia was produced incorporating all corrections for uncertainties in wood
density, in wood volume estimates and in the factors used to add the bole volume of small
trees and to add the crown biomass.

20
GENERAL OBJECTIVE
The present thesis aims to improve the estimates of forest biomass and of carbon
emissions from land-use change in Brazilian Amazonia, particularly in the ‘arc of
deforestation,’ which has historically been the primary source of carbon emissions from
deforestation and burning.
SPECIFIC OBJECTIVES
1.) To estimate the mean basic density of the wood of trees in the southern and southwestern
portions of Brazilian Amazonia, weighted by the floristic composition of these areas based on
existing large-scale inventories (Projeto RadamBrasil), and evaluate the impact of these
improved density values on estimates of biomass and of carbon emissions.
2.) To compare the open forests in southern Amazonia with the dense forests in central
Amazonia for variation in the basic density of wood along the length and the radius of the
bole and compare the moisture content of the wood in these forest types.
3.) To develop linear models that allow correction of available data on wood density in
Amazonia for density values that consider all components of the boles of the trees, thereby
making the corrected values appropriate for biomass calculations.
4.) To determine whether the trees in the southern and southwestern portions of Brazilian
Amazonia are shorter for any given diameter than the trees in central Amazonia and evaluate
the implications of such differences for biomass estimates obtained starting from equations
developed in central Amazonia corrected for the effect of height difference and/or wood
density.
5.) To develop an allometric equation for estimating the biomass of trees in southern
Amazonia using only the diameter at breast height (DBH) as an independent variable.
6.) To estimate, for forests in central and southern Amazonia, the biomass percentage stocked
in trees smaller than 100 cm in circumference (DBH < 31.8 cm) as compared to the biomass
of trees greater than 100 cm in circumference and evaluate the values currently used in
21
biomass models to account for the biomass of the trees not inventoried by Projeto
RadamBrasil (1973-1983).
7.) To determine the percentage of biomass present in the crowns as compared to the biomass
of the boles for trees in central and southern Amazonia and compare these results with the
values currently used in biomass models for adding the biomass of the crowns.
8.) To evaluate the influence of irregular and hollow trunks on the estimates of total wood
volume per hectare that were published by Projeto RadamBrasil (1973-1983).
9.) To develop allometric equations to allow estimation of the volume of the bole corrected
for the effect of irregularities and hollow spaces using only diameter as an independent
variable.
10.) To determine the form factor for trees in open forest for different diameter classes.
11.) To obtain new estimates of total biomass stocks in Amazonia using the Projeto
RadamBrasil inventories after applying corrections to estimates of wood volume, wood
density, the variables used to convert bole biomass to tree biomass and to per-hectare
biomass, as well as using new biomass estimates for non-tree components, both alive and
dead.
12.) To obtain a biomass map for Brazilian Amazonia and new estimates for carbon emissions
from land-use change.

22
MATERIALS AND METHODS
The present study was carried out based on information obtained at 13 sites in
Brazilian Amazonia, distributed in the states of Acre, Amazonas, Mato Grosso and Pará. Of
these, six sites were located near Manaus in central Amazonia (Nogueira et al., 2005) and the
other seven were distributed over the “arc of deforestation,” which comprises the southern
(SA) and southwestern (SW) portions of the Brazilian Amazon: two sites in the state of Acre
(SW open forest dominated by bamboo and SW dense forest without bamboo), four sites were
in the northwestern portion of the state of Mato Grosso and one site in the southern portion of
the state of Pará (all considered together and classified as “open forest of southern
Amazonia,” or SA).
Data collection at all sites was authorized by the Brazilian Institute for the
Environment and Renewable Natural Resources (IBAMA). In the state of Mato Grosso the
collections were also authorized by the State Secretariat for the Environment (SEMA).
In each forest type, trees over 5 cm dbh were chosen at random for cutting, and
measurements were made of diameter (dbh or diameter above any butresses), total height and
wood density: A total of 310 trees were measured in dense forest in central Amazonia, 92
trees in open forest dominated by bamboo in southwestern Amazonia, 97 trees in dense forest
without bamboo in southwestern Amazonia and 320 trees in open forest in southern
Amazonia. In this last forest type, 264 trees (5 to 124 cm dbh or diameter above any
buttresses) were cut into pieces and weighted completely. Botanical samples of each tree were
collected and identified by para-botanical experts at the National Institute for Research in the
Amazon-INPA.
Details of each collection site, such as soils and climate, as well as the details of the
methods, are described in each chapter.
Chapter I - Wood density in forests of Brazil’s ‘arc of
deforestation’: Implications for biomass and flux of carbon from
land-use change in Amazonia1.
Abstract Wood density is an important variable in estimates of forest biomass and greenhouse-gas emissions from land-use change. The mean wood density used in estimates of forest biomass in the Brazilian Amazon has heretofore been based on samples from outside the "arc of deforestation", where most of the carbon flux from land-use change takes place. This chapter presents new wood density estimates for the southern and southwest Brazilian Amazon (SSWA) portions of the arc of deforestation, using locally collected species weighted by their volume in large local inventories. Mean wood density was computed for the entire bole, including the bark, and taking into account radial and longitudinal variation. A total of 403 trees were sampled at six sites. In the southern Brazilian Amazon (SBA), 225 trees (119 species or morpho-species) were sampled at four sites. In eastern Acre state 178 trees (128 species or morpho-species) were sampled at breast height in two forest types. Mean basic density in the SBA sites was 0.593 ± 0.113 (mean ± 1 sd; n = 225; range 0.265-0.825). For the trees sampled in Acre the mean wood density at breast height was 0.540 ± 0.149 (n=87) in open bamboo-dominated forest and 0.619 ± 0.149 (n=91) in dense bamboo-free forest. Mean wood density in the SBA sites was significantly higher than in the bamboo dominated forest but not the dense forest at the Acre site. From commercial wood inventories by the RadamBrasil Project in the SSWA portion of the arc of deforestation, the wood volume and wood density of each species or genus were used to estimate average wood density of all wood volume in each vegetation unit. These units were defined by the intersection of mapped forest types and states. The area of each unit was then used to compute a mean wood density of 0.583 g cm-3 for all wood volume in the SSWA. This is 13.6% lower than the value applied to this region in previous estimates of mean wood density. When combined with the new estimates for the SSWA, this gave an average wood density of 0.642 g cm-3 for all the wood volume in the entire Brazilian Amazon, which is 7% less than a prior estimate of 0.69 g cm-3. These results suggest that current estimates of carbon emissions from land-use change in the Brazilian Amazon are overestimated. The impact on biomass estimates and carbon emissions is substantial because the downward adjustment is greater in forest types undergoing the most deforestation. For 1990, with 13.8 × 10³ km2 of deforestation, emissions for the Brazilian Amazon would be reduced by 23.4-24.4 × 10⁶ Mg CO2-equivalent C/year (for high- and low-trace gas scenarios), or 9.4-9.5% of the gross emission and 10.7% of the net committed emission, both excluding soils.
Keywords: Amazon forest; Carbon flux, Forest biomass, Global warming; Wood density.
1 Nogueira, E.M., Fearnside, P.M., Nelson, B.W., França, M.B., 2007. Wood density in forests of Brazil’s ‘arc of
deforestation’: Implications for biomass and flux of carbon from land-use change in Amazonia. Forest Ecology and Management 248, 119-135.

24
Introduction
The largest error in carbon balance in the tropical region results from uncertainty in
aboveground forest biomass (Houghton, 2003b, 2005; Houghton et al., 2001). Wood density
is an important variable for improving estimates of carbon stocks and of greenhouse-gas
emissions from deforestation or forest converted to other uses (Baker et al., 2004; Chave et
al., 2005; Fearnside, 1997; Malhi et al., 2006; Nogueira et al., 2005). This is because wood
density is used when inventories of bole volume are converted to biomass (Brown et al., 1989;
Brown, 1997; Fearnside, 2000a,b; Houghton et al., 2001). Furthermore, improved estimates of
wood density would enhance understanding of changes in carbon stocks before and after land-
use change.
Emissions of carbon from Amazon deforestation are determined by the biomass of
those forests currently being deforested, not by the average biomass of the region. The portion
of the Brazilian Amazon responsible for most of the emission is the ‘arc of deforestation,’
encompassing the southwestern, southern and eastern edges of the basin (Brazil, INPE, 2002).
Though numerous forest inventories of wood volume of large trees have been conducted in
the southern and southwestern Brazilian Amazon (Brazil, Projeto RadamBrasil, 1980; see
Figure 1), data are scarce for wood density directly measured in the arc of deforestation.
Consequently, recent studies of the stock and emission of carbon for Amazonia (Achard et al.,
2004; Brown, 1997; Fearnside, 2000a,b; Fearnside and Laurance, 2003, 2004; Houghton et
al., 2001) have been based on wood density from published lists that were obtained in parts of
the Amazon region outside of the arc of deforestation (Brown et al., 1989; Fearnside, 1997).
The use of wood-density data obtained outside the arc of deforestation could result in
overestimates because soils are more fertile along the southern and southwestern edges of the
basin (Brazil, Projeto RadamBrasil, 1976, 1978, 1983; Brown and Prance, 1987, Fig. 2.1;
Sombroek, 2000). Wood density has been shown to vary inversely with soil fertility (Baker et
al., 2004; Muller-Landau, 2004; Parolin and Ferreira, 1998; ter Steege et al., 2006). Other
factors, such as natural disturbance frequency, understory light availability, humidity and
climatic life zones, may affect growth strategies and therefore wood density (Chudnoff, 1976;
Wiemann and Williamson, 2002; Woodcock and Shier, 2003). In the southern and southwest
Brazilian Amazon (SSWA), open forests naturally disturbed by abundant climbing bamboos
or lianas tend to have more fast-growing trees with lighter wood (Nelson et al., 2006). These
forests occupied 400,000 km2 of the SSWA prior to their partial deforestation (Brazil, IBGE,
1997; Nelson, 1994). Open forest types also have fewer stems per hectare, more canopy gaps
25
and consequently higher light penetration as compared with dense forest (Veloso et al., 1991).
These forests also have less annual precipitation and a longer dry season than the central and
western portions of the Amazon (Brazil, ANA/SIH, 2006).
Another problem with existing wood-density estimates is that many of the wood-
density values available for Amazonia were not intended for use in biomass estimates.
Methods differ as to the radial and longitudinal position of the sample within the bole and in
the way that mass and volume of the wood sample were determined. Most methods lead to an
overestimate of mean wood density of the whole tree (Fearnside, 1997; Nogueira et al., 2005).
Many of the wood-density datasets used by Fearnside (1997) for biomass estimates lacked a
correction for radial variation. This error was calculated to be -5.3% for dense forest in central
Amazonia (Nogueira et al., 2005). In addition, some wood-density data also do not account
for decreasing density with height along the bole.
The question is examined of whether the average wood density currently used in
carbon-emissions estimates is suitable for the SSWA. This chapter uses two new datasets of
wood density by taxon.
Materials and Methods
Collection sites
The locations of all sites are shown in Figure 1. Felled trees were always from primary
forest, or forests without visible signs of disturbance. It should be noted that, while forests
like those studied are known as “primary forests,” all forests in Amazonia may be affected by
past disturbances from indigenous peoples and extreme climatic events (Clark, 2007). Stands
with any evidence of past logging were avoided. The dataset representing the southwest
Amazon is comprised of 178 trees from open bamboo-dominated and from dense forest in
eastern Acre state (França, 2002). The southern Amazon dataset is from four sites in
northwestern Mato Grosso and southern Pará, totaling 225 trees. These four sites were located
in open rain forest dominated by vines or by large palms. At all sites the altitude is 200 to 300
m above mean sea level. Dense forest and seasonal forest occur in close proximity to the
southern Amazon sites, while savannas occur in more elevated areas (Brazil, Projeto
RadamBrasil, 1980). Species lists for both regions are provided in the Appendix A and B.

26
Figure 1. Solid circles show collecton sites, from W to E: Sena Madureira, Cotriguaçu, Juruena and Novo Progresso. States mentioned in text are outlined, from W to E: Acre, Rondônia, Mato Grosso and Pará. Rectangles are the RadamBrasil inventories, from W to E: SC.19 Rio Branco, SC.16 Porto Velho and SC.21 Juruena. Dark grey is the extent of deforestation as of 2004, light grey is remaining forest, white is natural non-forest or vegetation status undetected due to clouds. Deforestation data from Brazil's National Insitute for Space Research (INPE).
The Acre site is 25 km west of the town of Sena Madureira. Approximately equal
numbers of trees were sampled from dense forest (91 trees) and from open bamboo-
dominated forest (87 trees). Two of the southern Amazon sites were located in the county of
Juruena in northwestern Mato Grosso (44 trees sampled). A third site was in the county of
Cotriguaçu (116 trees) also in northwestern Mato Grosso. The fourth was in the county of
Novo Progresso in southern Pará (65 trees) near the BR-163 Highway.
Soil under both forest types in Acre is relatively fertile vertisol, or vertic latosol with
high concentrations of cations (Vidalenc, 2000). The sites in Mato Grosso state are on xanthic
27
or orthic ferralsols and ferralic arenosols. At the site in southern Pará the soils are orthic
acrisols and ferralsols on granite-shield uplands (FAO, 1988; Sombroek, 2000).
The climate in eastern Acre state is tropical humid with 2250 mm of annual rainfall
and 4 months with less than 100 mm per month. At the Mato Grosso sites the predominant
climate is also tropical humid with 2075 mm average annual precipitation and six-months
with monthly precipitation below 100 mm (Brazil, ANA/SIH, 2006). At the southern Pará site
the average annual precipitation is 2280 mm with three months of precipitation below 100
mm per month (Brazil, ANA/SIH, 2006). At all sites, the mean annual temperature ranges
from 19.5 to 31.5 oC (Brazil, INMET, 2006).
Wood samples and density determination
Samples were taken from trees felled at random within each size class, starting at 5 cm
DBH. However, quotas were established for each size class based on the proportion that class
contributes to basal area in local forest inventories. Measurements of diameter were made of
DBH (1.30 m above the ground or above the buttresses, when present), total height and height
of the commercial bole. Botanical samples were collected for all trees and identified by expert
parabotanists at the herbarium of the National Institute for Research in the Amazon (INPA).
A wood disk of constant thickness (~3 cm) was taken at breast height or from the top
of the stump (at the Juruena site, due to requirements of the logging company), even in the
presence of buttresses. At the two Acre sites (França, 2002) disks were taken only at breast
height. At the four southern Amazon sites a second disk came from the top of the commercial
bole, below the thickening associated with the base of the first large branch. In all cases,
possible radial variation in density was compensated by obtaining a full slice of even
thickness, including the bark. Basic wood density was determined for the entire disk or for a
sector (like a pie slice) obtained from it. If the disk had eccentric growth rings the sector was
obtained from a region midway between the areas with the narrowest and the widest rings. If a
tree had buttresses and channels (flutations) at breast height, the sector included part of a
buttress and part of a channel. The sector was positioned to provide approximate proportional
representation of the cross-sectional areas of buttresses and channels in the disk as a whole.
The same methodology was applied in studies in central Amazonia (Nogueira et al., 2005),
and it is believed to provide an appropriate protocol for future density studies. At the southern
Amazon sites, samples of the heartwood were also taken when present. The heartwood
samples were taken close to the center of the disks.
28
In this study, wood density is defined as "basic density" or "basic specific gravity".
This is the ratio between the oven dry mass and the fresh volume of the green wood
(Fearnside, 1997; Nogueira et al., 2005). To avoid volume shrinkage, fresh disks and sectors
were kept in the shade and the green mass and volume were determined on the day of felling.
Green mass was obtained with a battery-operated scale with 1% accuracy and 2000 g
capacity. The green volume was determined by displacing water in a container placed on the
same scale. The specimen was impaled on a thin needle and forced underwater. The increase
in weight of the container (grams) corresponds to the volume of the immersed specimen in
cm3 (ASTM 2002). Volume was determined after first wetting the specimen to fill exposed
pores. For the dry weight of each sample a vented electric oven was used at 103 oC (ASTM,
2002). The samples were considered completely dry when the weight was stable for three
consecutive days. For all trees mean basic density of the bole was determined as the
arithmetic mean of the density at breast height (or top of the stump for the Juruena site) and at
the top of the bole. A taper-adjusted mean density was not used because it did not differ
significantly from the arithmetic mean (Nogueira et al., 2005).
Average wood density by forest type in the SSWA
Two regional tables of mean wood density by taxon (species or genus) were
developed, one for the southwest and another for the southern Brazilian Amazon. Names were
checked using Ribeiro et al. (1999) and/or the Missouri Botanical Garden Tropicos database
(http://mobot.mobot.org/W3TSearch/vast.html). All values are means of the bole, including
bark, sapwood and heartwood. Because no disk was collected from the top of the bole in
Acre, for that dataset a correction of -4.2% was applied to adjust for decrease in density with
height along the bole. This was the correction found at the Mato Grosso and Pará sites and is
similar to the value of -4.3% reported in Nogueira et al. (2005) for dense forest of the Central
Amazon.
The wood density values from the 119 tree species or morpho-species felled in Mato
Grosso and Pará were applied to the "SC.21 Juruena" and "SC.20 Porto Velho" RadamBrasil
inventory sets (Brazil, Projeto RadamBrasil, 1976, 1978, 1980). The 128 species or morpho-
species felled in Acre were used for the "SC.19 Rio Branco" inventory set. When
correspondence was not possible at the species level, genus-level wood density was used. The
geographic area of these three inventory sets is shown in Figure 1. Each RadamBrasil
publication provides wood volumes by taxon (genus or species) within each forest type within
a 4 × 6 degree area. The volume of each matched species or genus was used to estimate the

29
average wood density of all the wood volume in vegetation units that are defined by the
intersection of forest types and states. These “vegetation units” are similar to the “ecoregions”
defined by Fearnside and Ferraz (1995) using a less-detailed vegetation map, and are useful
for studies in conjunction with Brazil’s deforestation monitoring program, which releases
estimates by state. About 36% of the wood volume reported by RadamBrasil could be
matched to a genus or species collected in this study for the RadamBrasil map sheets in which
the plots were located. If only the vegetation units of our sample plots are considered (i.e.,
dense and open submontane rain forest in Mato Grosso), the percentage of the volume
matched to genus or species increases to 42% (Table 2). The average wood density of each
vegetation unit was based on the local volumes of these matched taxa. This same average was
applied to the unmatched taxa. The mean wood density for the entire SSWA portion of the arc
of deforestation was then calculated by taking an average of the values for all vegetation
units, weighted by the relative geographic area of each vegetation unit.
Adjustments to wood density, biomass and carbon emission estimates for the entire Brazilian
Amazon
A new average wood density was computed for all the wood volume in the entire
Brazilian Amazon using all of the Radam inventory sets. For the three inventories in the
SSWA area, the procedure was as described above. The same procedure was used in the
remainder of the Brazilian Amazon, but based on other wood densities previously reported by
Fearnside (1997). These other density values, applied outside the SSWA, were reduced by
5.3% because, in the majority of these other datasets, samples were taken from or near the
heartwood (as in the samples of Brazil, IBDF, 1981; 1983; 1988). No correction for variation
along the bole was applied because the majority of the samples (i.e., the IBDF data) were
taken at random along the bole with sampling probability at each point on the bole adjusted
for the effect of tapering on wood volume.
Other corrections were not applied, such as those for samples whose green volume
was estimated after soaking in water. This can result in overestimated density when the
samples are re-hydrated after drying and underestimation when hydrated to saturation without
prior drying. The Fearnside (1997) wood densities were originally obtained from Amorim
(1991), Brazil, IBDF (1981, 1983, 1988), Brazil, INPA (1991), Brazil, INPA/CPPF
(unpublished [1981]), Chudnoff (1980), do Nascimento (1993) and Reid, Collins and
Associates (1977). Other more recent datasets available for Amazonia were not used because
30
the mean densities currently used in biomass and emissions estimates were based on this
Fearnside dataset.
The new and the old adjusted wood densities were obtained for all the volume of wood
in each of the mapped forest types in each of the RadamBrasil inventories across all of the
Brazilian Amazon. When weighted by the area and deforestation rates of each vegetation unit,
this produced corrected estimates of aboveground live biomass and proportional corrections to
carbon emissions estimates in the region.
Results
Mean basic density of the bole, vertical and radial variation and relationship of bole density
to DBH and total height.
The mean basic density of the bole did not differ significantly between southern
Amazon sites (Figure 2A; Table 1). The mean density of the bole at the Juruena site was
0.591 ± 0.118 (mean ± 1 s.d.; n = 44). At the Cotriguaçu site it was 0.584 ± 0.106 (n = 116)
and at the Novo Progresso site it was 0.610 ± 0.121 (n = 65) (Table 1). In the full southern
Amazon dataset, the mean basic density of the bole was 0.593 ± 0.113 for the 225 felled
boles. These represent 119 species or morpho-species and 19 taxa identified only to genus-
level. These species and genera belong to 41 different angiosperm families.
In the southwestern Amazon sites (Acre state) the wood density differs significantly
(Figure 2B; Tukey test, p=0.000). In open bamboo-dominated forest the mean basic density at
breast height was 0.540 ± 0.149 (n = 87; 95% CI 0.508 – 0.572). In dense forest mean basic
density was 0.610 ± 0.149 (n = 91; 0.588 – 0.650). Only mean basic density in the open
bamboo-dominated forest at the Acre site differed from those at the Southern Amazon sites
(Tukey test, p=0.000).
31
All sites
Cotriguaçu
Juruena
N. Progresso
0.2
0.3
0.5
0.6
0.8
0.9
Mea
n ba
sic
dens
ity o
f the
bol
e A
Figure 2. Mean basic density (g.cm-3) of the bole at the collection sites in southern Amazon, open forest (A) and basic density at breast height in the southwestern Amazon, Acre state (B): open bamboo-dominated forest and dense bamboo-free forest. (A) The mean was obtained from the arithmetic mean of density at the base (height at breast or top of the stump for Juruena site) and at the top of the bole.
At all southern Amazon sites the basic density at the base of the bole was higher than
at the top of the bole by 8-10% (Fig. 3). The basic density at the base of the bole at the
Juruena site was 0.621 ± 0.121 (n = 47), 9.9% higher than at the top of the bole -- 0.565 ±
0.124 (n=46) -- and 5.1% higher than the mean for the bole. At the Cotriguaçu site the basic
density at breast height (0.608 ± 0.122; n = 126) was 9.2% higher than at the top of the bole,
0.557 ± 0.100 (n = 125), and 4.1% higher than the mean for the bole. At the Novo Progresso
site the difference between wood density at breast height and at the top of the bole was 8.7%;
the value was 0.636 ± 0.131 (n = 65) at breast height and 0.585 ± 0.116 (n = 65) at the top of
the bole. The difference between density at breast height and the mean for the bole was
similar to the difference at others sites: 4.3%. Considering the arithmetic mean of all trees
irrespective of the number of trees at each site, the mean bole density was ~4.2% lower than
then mean at breast height. More details concerning variation of the density with height of the
bole are given in Table 1 and Figure 3.
OPEN DENSE0.0
0.3
0.5
0.8
1.0
Woo
d d e
nsity
at b
reas
t hei
ght B

32
Table 1. Details of the various mean measures for whole disks and for heartwood at two positions along the bole.
Basic density (whole disks and
heartwood)
Juruena Cotriguaçu Novo Progresso All sites together
Mean (±S.D.) n 95% Mean (±S.D.) n 95% Mean (±S.D.) n 95% Mean (±S.D.) n 95%
Aritmethic mean density of the
bole (disks with bark) 0.591 (0.118) 44 0.55-0.63 0.584 (0.106) 116 0.56-0.60 0.610 (0.121) 65 0.58-0.64 0.593 (0.113) 225 0.58-0.61
Density at the base of the bole
(disks with bark)* 0.621 (0.121) 47 0.59-0.66 0.608 (0.122) 126 0.59-0.63 0.636 (0.131) 65 0.60-0.67 0.618 (0.124) 238 0.60-0.63
Density at the top of the bole
(disks with bark) 0.565 (0.124) 46 0.53-0.60 0.557 (0.100) 125 0.54-0.57 0.585 (0.116) 65 0.56-0.61 0.566 (0.109) 236 0.55-0.58
Heartwood density: aritmethic
mean of the bole 0.650 (0.131) 20 0.59-0.71 0.602 (0.119) 16 0.54-0.66 0.689 (0.084) 2 - 0.632 (0.125) 38 0.59-0.67
Heartwood density at the base
of the bole* 0.668 (0.145) 20 0.60-0.73 0.626 (0.143) 18 0.55-0.70 0.701 (0.116) 2 - 0.650 (0.141) 40 0.60-0.70
Heartwood density at the top
of the bole 0.633 (0.139) 20 0.57-0.70 0.578 (0.094) 19 0.53-0.62 0.677 (0.052) 2 - 0.610 (0.119) 41 0.57-0.65
All values shown are basic density.
* At the Juruena site this value denotes density at the top of the stump due to requirements of the logging company. At the other sites density is always at breast height.
33
0.1
0.3
0.6
0.8
1.0
Woo
d de
nsi ty
Position in the bole
Base Base Base TopTop Top
Juruena Cotriguaçu N. Progresso
Figure 3. Decrease in the basic wood density (g.cm-3) from the base to the top of the bole. At the Juruena site ‘base’ refers to a sample at the top of the stump. At the Cotriguaçu and Novo Progresso sites ‘base’ refers to a sample at breast height (1.3 m).
Heartwood basic density was higher than basic density in whole disks with bark
(Figure 4; Table 1). The heartwood density was 0.650 ± 0.141 (n=40) at the base of the bole
and 0.610 ± 0.119 (n = 41) at the top of the bole. The mean heartwood basic density of the
bole was 0.632 ± 0.125 (n = 38). Considering the same trees (n=30), mean heartwood density
of the bole was 3.3% higher than mean basic density of the entire bole; the values for the
mean differ statistically (paired t-test; p = 0.036).
Considering all trees in the southern Amazon sites, there was no correlation between
mean wood density of the entire bole and DBH (Fig. 5A) or total height (Fig. 5B). At the two
sites in Acre, there was no relationship between a tree's basic density at breast height and it's
diameter or height.
For the southern Amazon trees, wood basic density (mean of the bole) was separated
into three classes (≤0.50 g.cm-3, 0.50-0.70 g.cm-3 and ≥0.70 g.cm-3). Species were
predominantly light (21%) and medium (62%), only 17% being heavy. Considering all
species and morpho-species, means were 28% light, 59% medium and 13% heavy. If
classification of the woods in heavy, medium or light is based on interval limits of ≤0.50, 0.50
- 0.72 and ≥0.72, in accord with the procedures adopted by Ibama (see Brazil, de Souza et al.,
Collection site

34
2002; Melo et al., 1990; Nogueira et al., 2005); the distribution across all species and morpho-
species changed to 63% (medium) and 9% (heavy).
0.0
0.2
0.4
0.6
0.8
1.0
Basi
c de
nsit y
Disks atthe base
Heartwoodat the base
Disks at thetop of the bole
Heartwood at the top of the bole
Figure 4. Radial variation between basic density (g cm3) of whole disks with bark and basic density of heartwood.
Figure 5. Relationship between mean wood density, A: DBH (m) and B: total height (m).
0.0 0.5 1.0 1.5DBH (m)
0.2
0.3
0.4
0.5
0.6
0.7
0.8
0.9
Mea
n w
ood
dens
ity o
f the
bol
e
r = -0.028; p = 0.681
A
0 10 20 30 40 50 60Total height (m)
0.2
0.3
0.4
0.5
0.6
0.7
0.8
0.9
r = 0.007; p = 0.920
B

35
Wood basic density by forest type in the SSWA portion of the arc of deforestation
Use of the wood-density data described in Fearnside (1997) for estimating mean wood
density for the entire Amazon region results in overestimates of the mean wood density for
the forest types that occur in the arc of deforestation (Fig. 6 A-C).
0.20 0.50 0.80 1.10Fearnside (1997) dataset
0.20
0.50
0.80
1.10
Woo
d de
nsity
França, 2002 dataset (southwestern AmazoniaNew dataset (southern Amazonia)Fearnside (1997)
Dense Forest
A
Figure 6. Comparison by forest type between the dataset used in Fearnside (1997), the new dataset obtained in southern Pará and northern Mato Grosso and the França (2002) dataset obtained in Acre. The values for wood density in the figure represent mean species-level or genus-level values. (A and B) Dense or open alluvial, submontane and lowland rain forests. (C) Areas of ecological tension and contact between savanna/rain forest, savanna/seasonal forest and rain forest/seasonal forest.
0.10 0.43 0.77 1.10Fearnside (1997) dataset
0.10
0.43
0.77
1.10
Woo
d de
nsity
França, 2002 dataset (southwestern AmazoniaNew dataset (southern Amazonia)Fearnside (1997) dataset
Open Forest
B
0.20 0.50 0.80 1.10Fearnside (1997) dataset
0.20
0.50
0.80
1.10
Woo
d de
nsity
New dataset (southern Amazonia)Fearnside (1997)
Contact zone
C
36
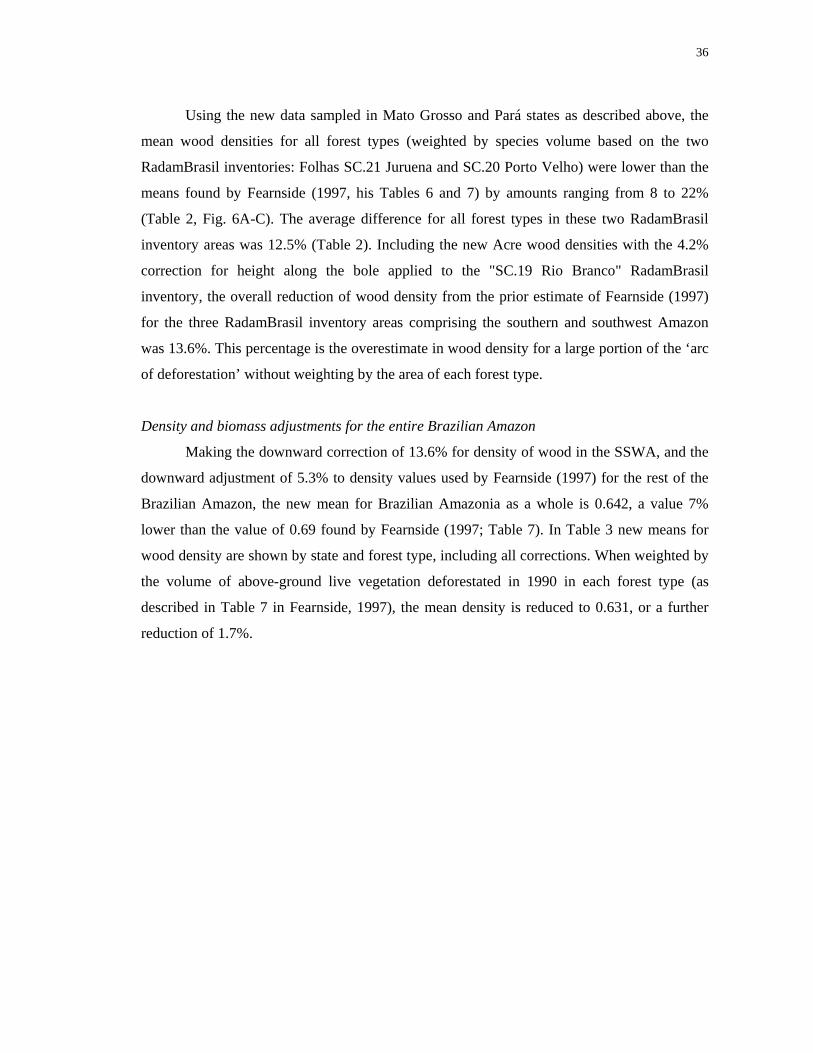
Using the new data sampled in Mato Grosso and Pará states as described above, the
mean wood densities for all forest types (weighted by species volume based on the two
RadamBrasil inventories: Folhas SC.21 Juruena and SC.20 Porto Velho) were lower than the
means found by Fearnside (1997, his Tables 6 and 7) by amounts ranging from 8 to 22%
(Table 2, Fig. 6A-C). The average difference for all forest types in these two RadamBrasil
inventory areas was 12.5% (Table 2). Including the new Acre wood densities with the 4.2%
correction for height along the bole applied to the "SC.19 Rio Branco" RadamBrasil
inventory, the overall reduction of wood density from the prior estimate of Fearnside (1997)
for the three RadamBrasil inventory areas comprising the southern and southwest Amazon
was 13.6%. This percentage is the overestimate in wood density for a large portion of the ‘arc
of deforestation’ without weighting by the area of each forest type.
Density and biomass adjustments for the entire Brazilian Amazon
Making the downward correction of 13.6% for density of wood in the SSWA, and the
downward adjustment of 5.3% to density values used by Fearnside (1997) for the rest of the
Brazilian Amazon, the new mean for Brazilian Amazonia as a whole is 0.642, a value 7%
lower than the value of 0.69 found by Fearnside (1997; Table 7). In Table 3 new means for
wood density are shown by state and forest type, including all corrections. When weighted by
the volume of above-ground live vegetation deforestated in 1990 in each forest type (as
described in Table 7 in Fearnside, 1997), the mean density is reduced to 0.631, or a further
reduction of 1.7%.

37
Table 2. Average wood density for each vegetation unit in the SSWA based on wood volume in three RadamBrasil publications, and the tables of density by taxon in this study and that of Fearnside (1997).
State Vegetation type Fearnside (1997)
% Wood identified to: genus/species in Fearnside
(1997)
New datasets
% Wood identified to: genus/species in New
dataset Testa % Wood identified to:
genus/species in test
% Fearnside (1997)/New
dataset
Rondônia Dense alluvial rain forest 0.653 80.2 / 58.3 0.554 33.5 / 11.9 0.629 30.2 / 14.2 17.87
Amazonas/Rondônia Dense submontane rain forest 0.732 80.1 / 51.8 0.599 32.6 / 7.1 0.672 30.3 / 14.1 22.20
Rondônia/Amazonas Dense submontane rain forest 0.678 72.3 / 45.4 0.604 42.4 / 14.2 0.694 37.2 / 14.2 12.25
Rondônia/Mato Grosso Dense submontane rain forest 0.666 79.5 / 53.7 0.596 25.8 / 6.9 0.654 23.9 / 6.9 11.74
Rondônia/Amazonas Open lowland forest 0.691 81.0 / 50.9 0.607 31.2 / 8.1 0.663 30.3 / 7.9 13.84
Rondônia Open alluvial rain forest 0.637 84.5 / 60.8 0.556 35.6 / 8.7 0.609 32.1 / 8.1 14.57
Rondônia/Mato Grosso/Amazonas Open submontane rain forest 0.66 76.6 / 51.6 0.594 36.0 / 13.7 0.666 32.9 / 12.9 11.11
Mato Grosso/Rondônia/Amazonas Open submontane rain forest 0.705 79.1 / 49.2 0.604 32.9 / 8.7 0.685 30.9 / 8.5 16.72
Rondônia/Amazonas Savanna/rain. forest; Savanna/Dense rain. Forest 0.667 80.4 / 48.7 0.584 35.0 / 12.7 0.646 32.4 / 12.3 14.21
Mato Grosso Dense alluvial rain forest 0.659 86.9 / 63.4 0.609 36.4 / 15.4 0.673 30.7 / 13.6 8.21
Mato Grosso Dense submontane rain forest 0.666 85.1 / 63.2 0.582 42.0 / 20.7 0.66 37.4 / 18.6 14.43
Mato Grosso Open submontane rain forest 0.645 83.4 / 57.0 0.588 42.1 / 16.70 0.635 38.6 / 26.6 9.69
Mato Grosso Savanna/seasonal forest 0.634 87.5 / 57.3 0.582 39.1 / 12.7 0.651 37.1 / 23.1 8.93
Mato Grosso Rain Forest/Seasonal Forest 0.651 81.6 / 52.3 0.585 40.4 / 17.8 0.667 36.0 / 21.0 11.28
Acre/Amazonas Dense lowland rain forest 0.65 80.2 / 51.5 0.572b 30.5 / 5.8 0.647 28.0 / 15.3 8.88
Acre/Amazonas Open lowland rain forest 0.657 75.0 /50.8 0.550 b 39.3 / 7.1 0.69 34.2 / 22.8 14.46
Amazonas/Rondônia Open submontane rain forest 0.664 94.7 / 50.1 0.589 b 38.7 / 3.1 0.697 37.6 / 13.7 7.97
Acre/Amazonas Open alluvial rain forest 0.602 70.1 / 46.2 0.534 b 37.7 / 7.0 0.632 28.3 / 16.8 8.08
Average 0.662 0.583 0.659 12.58
Here the Fearnside data are not corrected for radial variation. Percent of total wood volume identified to genus and to species levels is given for the two studies. The RadamBrasil forest-volume inventories include only trees above 31.8 cm DBH. See text for explanation of "test"column. a Test column provides the mean wood density for each vegetation unit using the Fearnside (1997) table of density by taxon, but only using those taxa found in the new datasets of this study (Appendix A). The test shows that the reduction in density is little affected by the fraction of identifications made to the species level. b Based on the eastern Acre data of Appendix B. Wood density was measured only at breast height, then reduced by 4.2% for longitudinal decrease in density with height along the of bole. Without this correction, the values were: 0.597, 0.574, 0.615, and 0.557. All other values in same column were calculated from the southern Amazon dataset (Appendix A).

38
Table 3. New mean wood density for Brazilian Amazonia (updated from Fearnside, 1997): volume-weighted means by vegetation zone, vegetation type and state (g cm-3).
Forest vegetation type: Group, Subgroup and class (code) Acre Amapa Amazonas Maranhão Mato Grosso Pará Rondônia Roraima Tocantins/Goiás
Area-weighted
mean
Rain (ombrophilous) forest
Dense alluvial (Da-0) 0.634 0.635 0.609 0.634 0.554 0.635 0.634 0.634 Dense lowland (Db-0) 0.572 0.634 0.662 0.634 0.701 0.668 0.636 0.668 Dense montane (Dm-0) 0.646 0.646 0.646 0.646 0.646 Dense submontane (Ds-0) 0.687 0.687 0.696 0.687 0.582 0.695 0.599 0.670 0.687 0.687
Mean dense forests 0.672
Rain (ombrophilous) forest Open alluvial (Aa-0) 0.534 0.534 0.534 0.534 0.534 Open lowland (Ab-0) 0.550 0.620 0.595 0.595 Open submontane (As-0) 0.589 0.588 0.589 0.589 0.589 0.589 0.589
Seasonal forest Deciduous submontane (Cs-0) 0.602 0.602 0.602 0.602 0.602 Semideciduous alluvial (Fa-0) 0.602 0.602 Semideciduous submontane (Fs-0) 0.602 0.602 0.602 0.602 0.602
Woody oligotrophic vegetation of swampy and sandy areas
Open arboreal (La-0) 0.711 0.711 0.711 Dense arboreal (Ld-0) 0.602 0.602 0.602 Grassy-woody (Lg-0) 0.602 0.602 0.602
Areas of ecological tension and contact (ecotones)
Woody oligotrophic vegetation of swampy and sandy areas - rain forest (LO-0) 0.642 0.642 0.642
Rain forest - seasonal forest (ON-0) 0.585 0.587 0.587 0.679 0.587 Areas of pioneer formations (early succession) Fluvio-marine influence (Pf-0) 0.602 0.602 0.602 0.602
Areas of ecological tension and contact (ecotones)
Savanna-dense rain forest (SM-0) 0.602 0.602 Savanna-seasonal forest (SN-0) 0.583 0.583 0.582 0.583 0.583 0.714 0.583 0.583 Savanna-ombrophilous forest (SO-0) 0.672 0.655 0.672 0.679 0.672 0.672 0.672 0.672
Mean non-dense forests 0.602 Mean all forests 0.642
Values in italics are for ecoregions without species-specific data; the area-weighted mean for the same vegetation type in other states has been substituted. For the seven non-dense forest types with no data from any state, the area-weighted mean for all non-dense forests has been used. For detailed information about forest types, see Fearnside (1997).
39
Discussion
Environmental conditions and variation in wood density
Studies have generally assumed that variation in wood density is purely driven by
variation in species composition. Although there are important environmental influences,
mean wood density is conserved phylogenetically (Chave et al., 2006). The range of wood
density exhibited by any given species being likely to have genetically determined
components associated with intrinsic growth allometry and other architectural features of the
species (Meinzer, 2003; Sterck et al., 2006; van Gelder et al., 2006; Wright et al., 2003).
The variation in mean forest wood density has been analysed by tree species
composition (Terborgh and Andersen, 1998; ter Steege et al., 2006). Thus, in southern
Amazonia one cause of lower wood density in the forests will be the increasing abundance of
low wood-density species (ter Steege et al., 2006), with greater frequency of families that
have light wood. In regions like southwestern Brazilian Amazonia, abundant gaps in open
forest are created by vines or climbing bamboo favoring fast-growing tree species with low
wood density (Nelson et al., 2006; Putz et al., 1983). In Acre, wood density in one open
bamboo-dominated forest averaged 0.51, versus 0.60 in neighboring forest without bamboo
(França, 2002). Bamboo also reduced the number of large trees per hectare. With lower wood
density and fewer large trees, the bamboo-dominated forest had half the biomass of the dense
forest (França, 2002; Nelson et al., 2006).
It is thought that variation in certain environmental factors may drive these patterns in
composition and wood density. Wood density has been demonstrated to vary with different
environmental conditions. Such factors as soil fertility (Baker et al., 2004; Muller-Landau,
2004), and light conditions (van Gelder et al., 2006) are recognized as affecting wood density
at the stand level. The intensity of solar radiation is higher but more seasonal at the southern
margins of Amazonia, where the climate shifts towards non-tropical conditions and there are
long dry seasons (Malhi et al., 2004). Due to the long dry period in southern Amazonia, the
degree of seasonality and the magnitude of resulting drought stress could affect wood density.
This is because wood density determines the variation in a suite of characteristics related to
efficiency and integrity of xylem water transport, regulation of leaf water balance, and
avoidance of turgor loss (Hacke et al., 2001; Meinzer, 2003). The gain in cavitation resistance
with increasing wood density appears to be associated with a cost in terms of reduced
hydraulic conductivity. Thus, for plants growing in arid environments it is reasonable to
suggest that the increased cavitation resistance is an advantageous feature, but, despite
potential environmental influences, a broad range of wood densities co-exist in both arid and
40
humid environments. The accumulating evidence suggests that within the tropics, seasonality
and rainfall (Borajas-Morales, 1987; Wiemann and Williamson, 2002) do not explain large-
scale regional variation in wood density (Baker et al., 2004; Muller-Landau, 2004), although
this feature constrains physiological options related to plant water economy, leading to broad
functional convergence (Meinzer, 2003).
Therefore, ideally it is important to sample wood density data in the study area, rather
than simply using published values of species averages. The mean wood density at the species
level obtained from two datasets with identical sampling methods (dense forest in central
Amazonia, Nogueira et al., 2005 and open forest in southern Amazonia, new dataset reported
in this study) allows a comparison of the mean wood density of the bole between location in
two species. For Brosimum lactescens (S. Moore) C.C. Berg (Moraceae) in central Amazonia
the mean wood density of the bole was 0.708 (n = 2) versus 0.620 (n = 8) in southern
Amazonia. Wood density of Pouteria anomala (Pires) T.D. Penn. (Sapotaceae) was 0.725 (n
= 4) in central Amazonia and 0.680 (n = 4) in southern Amazonia. In spite of phylogenetic
conservatism in wood density, these instances suggest an important effect of environmental
conditions such as soils. They also suggest that comparative studies employing a uniform
methodology between various species in different soil and forest types could enhance
knowledge of the separate effects of the environmental factors at a finer scale.
Analysis of the responses to the environment in wood density and in patterns of
species composition may to help define the roles of these two effects in gradients of wood
density in Amazonia (Baker et al., 2004; Malhi et al., 2006). The results of this chapter
provide wood densities specific to southern Amazonia, where the dry period is long (six
months with precipitation below 100 mm: Brazil, ANA/SIH, 2006). It is precisely in these
portions of Amazonia that there has been a major gap in the datasets used in previous studies
that have not found wood density to be correlated with climatic variables (Malhi et al., 2004,
2006).
Mean wood density: radial variation and variation along the length of the bole
The changes in density along the bole and in the radial direction for open forest in
southern Amazonia are similar to those found in dense forest in central Amazonia (Nogueira
et al., 2005). The average radial variation (difference between heartwood and full disk
densities) is 3.3% here and 5.3% in central Amazonia. Variation along the length of the bole
(difference between full disk at breast height and density of the entire bole) was 4.2% for
southern Amazonia, and 4.3% in central Amazonia. Due to these variations, the use of the

41
previously published datasets on wood density obtained by different methodologies can
partially explain differences between means reported by various other authors, including the
accuracy of recent estimates. The major wood-density datasets available for Amazonia were
not designed for estimating tree biomass. Data are scarce for wood density obtained from
samples adequately positioned in the bole and with dry weight and volume determined by
appropriate methods (see Fearnside, 1997 and Nogueira et al., 2005, pp. 268-269).
Normalization of the wood density data may be performed using linear models as
suggest by Reyes et al. (1992). Normalization can also be done using equations for moisture
content as proposed by Brotero (1956) and Oliveira (1981), as used in IBAMA lists, or with
Sallenave’s (1971) equation used by Chave et al. (2006).
Correction for the position of the samples in the bole can be done using linear models
developed by Nogueira et al. (2005) or using simple percentage corrections. However, theses
models were not tested for open forest in the southern Amazon. Linear models have the
convenience of only requiring transformation of the independent variable, in this case the
wood density. However, it is not possible to use the model for all corrections. For instance,
the model was not tested by direct comparison of cores taken with increment borers with full
disks including bark, but a large number of recent studies have used samples obtained using
increment borers (DeWalt and Chave, 2004; King et al., 2006; Muller-Landau, 2004;
Woodcock, 2000; Woodcock and Shier, 2003). The large wood-density dataset for Brazilian
Amazonia (Brazil, IBDF, 1981, 1983, 1988) is difficult to standardize adequately for accurate
estimates of the whole bole (i.e., with corrections for radial variation and variation along the
bole). It is important to focus attention on methods used for the weight and volume measures,
such as time and temperature of drying and proper use of the water-displacement method
(Trugilho et al., 1990). While errors from these factors may be ignored for purposes that do
not require a high level of accuracy in estimates of mean density, the errors are too large for
biomass estimates in tropical forests. This is because a difference of few percent in mean
wood density can imply large errors in calculations of the carbon balance.
Wood basic density by forest type in the arc of deforestation, southern and southwestern
portions of Brazilian Amazonia: Adjustments for biomass and carbon emission estimates
The estimates of wood density for the Amazon region have been improved by recent
studies (Baker et al., 2004; Chave et al., 2006; Nogueira et al., 2005). The recent estimates are
significantly different from values reported for specific regions, which were used in previous

42
calculation of the mean wood density for Brazilian Amazonia as a whole. The value of 0.69 g
cm-3 had been used in a number of carbon emission and biomass estimates (Brown et al.,
1989; Brown, 1997; Houghton et al., 2001) and is based on Brown et al. (1989) and Fearnside
(1997). In Fearnside (1997) the values that were used in each region were weighted by area of
forest type. The comparison of the values used in calculating the 0.69 mean with recent
estimates, reinforces the suggestion of an overestimate in the mean wood density for Brazilian
Amazonia (Nogueira et al., 2005). For instance, the mean estimate for dense forest (0.66) by
Chave et al. (2006) is similar to the mean of 0.67 found by Nogueira et al. (2005), and both
are lower than the 0.70 value derived by Fearnside (1997) for the same forest type. For
southern and southwestern Amazonia, the present study found a mean of ~0.58, similar to the
0.60 found by Chave et al. (2006) for southwestern Amazonia and also lower than the values
in Fearnside (1997). The mean wood density for 2456 tree species from Central and South
America by Chave et al. (2006) was 0.645 g cm-3. This is similar to the value of 0.642 g cm-3
(Table 3) found in this chapter for the whole of Brazilian Amazonia obtained by updating the
values in Fearnside (1997), using the inventory volume of each taxon and the area of each
forest type. The mean wood density reported in this chapter was obtained from a substantially
smaller list of wood densities by taxon than that of Chave et al. (2006). However, the two new
datasets presented here were directly sampled in the southern and southwestern Amazon and
represent the entire bole. Furthermore, this study made adjustments for radial variation to the
other data used in Fearnside (1997).
Because of the need for assessing the consistency of the means obtained using the new
dataset for SSWA and the França (2002) dataset for Acre, means were compared only for
species that were coincident between the Fearnside (1997) dataset and the new southern
Amazon or southwest Amazon datasets described here. The column "test" in Table 2 shows
that the results are similar, with different percentage reductions at the species level. With the
exception a few species, the dataset used by Fearnside (1997) for the large RadamBrasil
inventories has a tendency to overestimate wood density (Figure 6 A-C).
A wide range of estimates have been made of carbon emissions from land-cover
change in the tropics (Achard et al., 2002, 2004; DeFries et al., 2002; Fearnside, 2000a,b;
Houghton, 2003a, b, 2005; McGuire et al., 2001). The results of the present study imply a
downward adjustment of all estimates in parallel. Consequently there will be little effect on
the relative differences between the various previous biomass and carbon emissions estimates
for Amazonia (the effect is not zero because only values for primary forest biomass are
affected, not those for the secondary forests whose growth counterbalances part of the gross

43
emission). The reduction in net committed emissions is large because it applies to two major
types forest undergoing deforestation in recent years (see Brazil, INPE, 2006; Houghton et al.,
2001). The reduction of 23.4-24.4 × 10⁶ Mg of CO2-equivalent C/year for 1990 for low- and
high-trace gas scenarios, respectively is sufficiently large to be significant for the global
carbon balance. Considering living and dead biomass only (i.e., ignoring soils, cattle, periodic
reburning and other emissions sources), this reduction represents 9.4-9.5% of the gross
emission, or 10.7% of the net committed emission as calculated by Fearnside (2000a, with
corrections for form factor and hollow trees as described in Fearnside and Laurance, 2004).
For estimates (Fearnside, 2007) that include wood-density adjustments based on the Central
Amazon data of Nogueira et al. (2005), the SSWA dataset in the present study reduces
estimated 1990 emissions by 4.1% for gross emissions and 4.3% for net committed emissions.
The corrected gross emission for 1990 is 247.7-257.5 × 10⁶ Mg of CO2-equivalent C/year,
while the net committed emission is 218.1-227.8 × 10⁶ Mg of CO2-equivalent C/year for
biomass emissions only, and 230.0-239.7 × 10⁶ Mg of CO2-equivalent C/year including soils
and other sources. Deforestation in 1990 (the standard base year for national inventories under
the United Nations Framework Convention on Climate Change) was 13.8 × 10³ km2 (in
primary forest only, not counting clearing of savannas or re-clearing of secondary forests).
In spite of this new SSWA dataset and the recent studies with improved estimates,
Fearnside's (1997) argument is still valid: there is a need to expand the dataset on wood
density so that it is better distributed across the Amazon region. It is particularly important to
expand the number of the collections in regions undergoing deforestation.
Conclusions
This study suggests that the mean wood density values for the whole Amazon region
that have been widely used in biomass estimates were overestimated, probably because they
were obtained using datasets with uncertainties in methodology and that were restricted as to
forest type. The absence of a wood-density dataset directly sampled in the forest type
undergoing the most rapid deforestation is an important cause of overestimated carbon
emission for Brazilian Amazonia. Considering the forest type and species composition for
forests in southern and southwestern Amazonia, a downward adjustment by 13.6% is needed
relative to the mean used in many previous estimates. For the entire Brazilian Amazon, the
mean wood density previously estimated by Fearnside (1997) should be lowered by 7%, to
0.642. For mean wood density weighted by the volume deforested in 1990 in each forest type
the value is lowered by 9% to 0.631. The impacts on biomass estimates and on carbon
44
emissions are substantial because the greatest adjustment is necessary exactly in the forest
types undergoing the most deforestation. Estimates of net committed emissions for Brazilian
Amazonia in 1990 that already include wood density values weighted by the volumes of each
species present at the locations undergoing deforestation (e.g., Fearnside, 2000a,b with
adjustments described in Fearnside and Laurance, 2004) would be reduced by 10.7%: 23.4-
24.4 × 10⁶ Mg CO2-equivalent C/year for high and low trace gas scenarios, respectively. The
impact is sufficient to affect the global carbon balance. These new data will help to reduce
uncertainties in various previous biomass studies and in the carbon budget for the Amazon.
Chapter II - Linear regressions for normalization of wood density
in biomass estimates of Amazon forests2
Abstract Wood density is an important variable needed to obtain accurate estimates of biomass and carbon flux in tropical regions. However, the Amazon region lacks large-scale wood density datasets that employ a sampling methodology adequate for use in estimates of biomass and carbon emissions. Normalization of the available datasets is needed to avoid bias in estimates that combine previous studies of wood density, which used wood sampling at diverse positions in the bole or with various methods of density determination. This chapter examines the question of whether regressions for radial variation and for variation along the bole in wood density, both developed in dense forest in central Amazonia (CA), are suitable for open forest in southern Amazonia (SA) that are currently the target of most of Amazonia’s deforestation activity. The wood density of the heartwood and density of full disks or slices (bark, sapwood and heartwood) in each tree (n = 146 trees in CA; 76 in SA) were measured to assess the radial variation. Therefore sampling is not representative at the community level but only for trees with heartwood. For variation along the length of the bole, wood density at breast height and at the top of the bole were used (307 trees in CA; 235 in SA). Moisture content of the bole was measured for 223 trees in SA and compared with values reported by studies from CA in similar dense forest (n = 50 trees). Comparing regressions that predict full disk density from the heartwood density, the pattern of radial variation differs slightly and significantly between the two forest types (ANCOVA p = 0.001); the slopes have similar values but the intercepts differ. The variation along the bole in the two forest types does not differ significantly (p = 0.144). So the CA model for predicting mean bole density from the density of a slice at breast height gives an unbiased estimate of the mean bole density when applied to SA trees. In SA the mean moisture content of the bole was 0.416 (± 0.068 SD; n = 223 trees). Moisture content of the bole had a strong inverse relationship with basic wood density (Pearson correlation = -0.77, p=0.000; n=222), which explains the lower moisture content in the trees in CA relative to SA. There was a much weaker inverse relationship between moisture content and green wood density (r = -0.292, p = 0.000; n = 222). These two results are expected if the density of dry wood tissue free of air varies little across all species and if trees with less-dense wood store more water, but not much more air, in the same volume of green wood. The relationship between wood basic density and green (‘fresh’) density presented in this study provides an alternative means of obtaining basic wood density directly in the field when drying samples is not possible. Keywords: Amazon forests, basic wood density, global warming, green wood density, linear regression, moisture content. 2 Written according to the norms of the journal Forest Ecology and Management.

46
Introduction
Wood density has been recognized as an important variable for improving biomass
estimates in Amazon forests (Baker et al., 2004; Malhi et al., 2006) and estimates of
greenhouse gas emissions (Fearnside, 2007; Nogueira et al., 2005, 2007). Recent large scale
estimates of wood density across the Amazon have been based on a variety of earlies studies
(Baker et al., 2004; Chave et al., 2006; Fearnside, 1997). However, many wood-density
datasets sampled in Amazonia were intended for technological and commercial uses rather
than for biomass estimates (e.g., Brazil, IBAMA, 1997; Brazil, IBDF, 1981, 1983, 1988; de
Souza et al., 2002; Feldalto et al., 1989). Studies differ in collection methodology, such as the
position of the sampling in the bole and the way that weight and volume are determined,
usually tending to overestimate mean density (Fearnside, 1997; Nogueira et al., 2005). For
biomass estimates the best measure is basic wood density (fully dry weight divided by green
volume) expressed as a mean of the bole, that is, including appropriate corrections for radial
variation and variation along the length of the bole of each tree. In order to use the available
datasets one therefore needs accurate corrections to avoid bias in wood density means
calculated from diverse measures.
Several previously published equations allow normalization to estimate basic density
based on data from diverse methods of wood-density measurement, such as those that report
density with 12% moisture content (e.g., Brotero, 1956; Oliveira, 1981; Reyes et al., 1992;
Sallenave, 1971) (Table 1). Recent large-scale wood density estimates have adopted
normalization for moisture content (Baker et al., 2004; Chave et al., 2006). However,
corrections for position of sampling in the bole have not been applied in recent estimates.
Different patterns of radial variation in wood density and of variation along the bole have
been found in tropical trees, with density declining from the heartwood outwards in mature
forest or in late-successional species and the inverse occurring in typical colonizing species,
and a decline in density with height in the bole in all species groups (Nogueira et al., 2005,
2007; Suzuki, 1999; Wiemann and Williamson, 1988; 1989; Wittmann et al., 2006;
Woodcock and Shier, 2002; 2003).
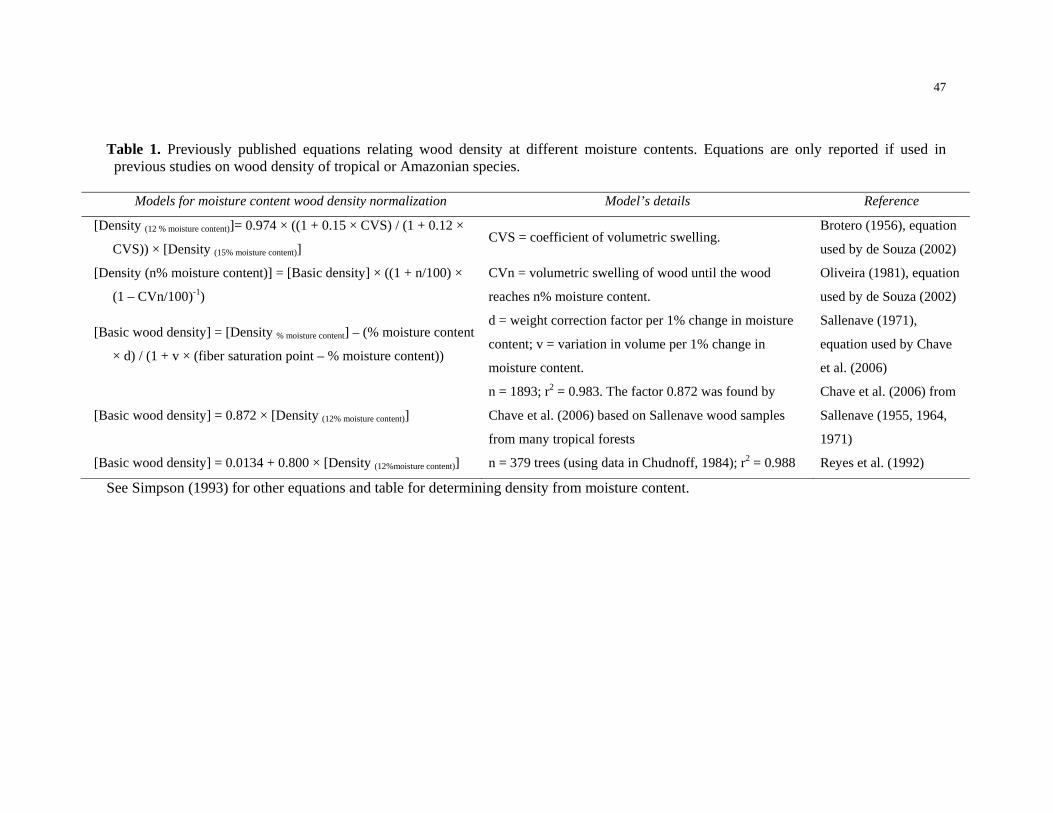
47
Table 1. Previously published equations relating wood density at different moisture contents. Equations are only reported if used in previous studies on wood density of tropical or Amazonian species.
Models for moisture content wood density normalization Model’s details Reference
[Density (12 % moisture content)]= 0.974 × ((1 + 0.15 × CVS) / (1 + 0.12 ×
CVS)) × [Density (15% moisture content)] CVS = coefficient of volumetric swelling.
Brotero (1956), equation
used by de Souza (2002)
[Density (n% moisture content)] = [Basic density] × ((1 + n/100) ×
(1 – CVn/100)-1)
CVn = volumetric swelling of wood until the wood
reaches n% moisture content.
Oliveira (1981), equation
used by de Souza (2002)
[Basic wood density] = [Density % moisture content] – (% moisture content
× d) / (1 + v × (fiber saturation point – % moisture content))
d = weight correction factor per 1% change in moisture
content; v = variation in volume per 1% change in
moisture content.
Sallenave (1971),
equation used by Chave
et al. (2006)
[Basic wood density] = 0.872 × [Density (12% moisture content)]
n = 1893; r2 = 0.983. The factor 0.872 was found by
Chave et al. (2006) based on Sallenave wood samples
from many tropical forests
Chave et al. (2006) from
Sallenave (1955, 1964,
1971)
[Basic wood density] = 0.0134 + 0.800 × [Density (12%moisture content)] n = 379 trees (using data in Chudnoff, 1984); r2 = 0.988 Reyes et al. (1992)
See Simpson (1993) for other equations and table for determining density from moisture content.

48
Some compilations of published wood density are based on heartwood samples taken
near breast height. Linear regressions are available relating the wood density of a full disk
(bark, sapwood and heartwood) to the density of heartwood and for relating the wood density
of a full disk at breast height to the mean basic density of the bole (see Table 2), but these
relationships have not been tested in the forests of the southern Amazon. It is particularly
important to have correction equations for wood density to improve biomass estimates in the
open forests that occur at the southern fringe of the Amazon region where most deforestation
activity and carbon emissions are taking place (Brazil, INPE, 2006). Environmental
conditions in this region are different from those in dense forest of the central Amazon
because soils are more fertile, insolation is higher and dry seasons are longer; all of these
characteristics affect wood density in some way (Malhi et al., 2004; Sombroek, 2000; ter
Steege et al., 2006). Lower wood densities found in open forest with a prolonged dry season
in southern Amazonia (Nogueira et al., 2007) suggest a relationship with stem water storage,
and hence help explain the phenology and distribution of species (Borchert, 1994; Reich and
Borchert, 1984; Schulze et al., 1988).
Table 2. Linear regressions developed in dense forest in central Amazonia (CA) tested in this study.
Models for wood density corrections in sampling position in the bole* Regression statistics
(1) [Basic density of the disk at breast height] = 0.146 (±0.014) + 0.765
(±0.017) × [Heartwood basic density]
Coefficients ± Std Error; r2 = 0.931,
MSE = 0.033, F = 1945, n = 146.
(2) [Mean basic density of the bole] = 0.219 (±0.014) + 0.630 (±0.018)
× [Heartwood basic density]
Coefficients ± Std Error; r2 = 0.893,
MSE=0.034, F = 1199, n = 145.
(3) [Taper-adjusted mean basic density of the bole] = 0.099 (±0.020) +
0.808 (±0.028) × [Basic density of the disk]
Coefficients ± Std Error; r2 = 0.925,
MSE = 0.027, F = 832, n = 69.
*.Data source: Nogueira et al. (2005)
In this study three linear regressions developed in dense forest in central Amazonia
(Table 2, from Nogueira et al., 2005) were evaluated for bias when accounting for radial and
vertical variation in wood density of trees sampled in the open forests of southern Amazonia
(Table 2). If the linear relationships in the two forest type are not significantly different, a
single pooled regression can be developed for the two forests. A pooled regression would also
have greater precision. Finally, for the southern Amazon open forests this study also
examined the ratio between green mass and dry mass for each sample. This ratio was

49
considered to be equivalent to the moisture content of the bole when obtained from samples at
the base and at the top of the bole.
Materials and Methods
Collection sites
The samples used in this study were collected at six sites in primary forests in the
central Amazon (CA) and five sites in southern portion of the Brazilian Amazon (SA). The
CA sites were located near Manaus, Amazonas state (Nogueira et al., 2005). Four of the SA
sites were in the northwestern portion of Mato Grosso state in the counties of Juruena (2
sites), Cotriguaçu (1 site) and Carlinda (1 site). The fifth site was located in the southern
portion of the state of Pará in the county of Novo Progresso.
At all CA sites the predominant vegetation is dense forest with a mean altitude ~100 m
above mean sea level (m.s.l.). In SA the vegetation is open rain forest at ~300 m above m.s.l
with either vines or palms as subdominant life forms. The soils at the CA sites are yellow
latosols (acrisols) that are poor in nutrients (Magnago et al., 1978; Yamazaki et al., 1978).
The sites in Mato Grosso state are predominantly on xanthic or orthic ferralsols and ferralic
arenosols. At the site in southern Pará the soils are predominantly orthic acrisols and ferralsols
on granite shield uplands (FAO, 1988; Sombroek, 2000). At the CA sites the average annual
rainfall is about 2300 mm. At the Mato Grosso sites the predominant climate is tropical humid
with 2075 mm annual precipitation. Rainfall in the CA is below 100 mm/month during three
months, from July to September (Marques-Filho et al., 1981). At the Mato Grosso sites there
is a six-month dry period from May to September with mean monthly precipitation below 100
mm (Brazil, ANA/SIH, 2006). At the southern Pará site the average annual precipitation is
2280 mm and the dry period extends from June to August (Brazil, ANA/SIH, 2006; Oliveira
et al. 2004). In CA the mean monthly temperature is stable throughout the year at around of
26 oC (Marques-Filho et al., 1981). A similar annual average is found at the other sites
(Brazil, INMET, 2006).
Collection of samples for wood density determination
The trees felled in each forest type were always chosen randomly but stratified by size
class according to the proportion that each class contributes to basal area in local forest
inventories. The research plan was authorized by the Brazilian Institute for Environment and

50
Renewable Natural Resources (IBAMA) and in Mato Grosso state by the Environment
Secretariat (SEMA/MT). For density determination, disks of constant thickness (~3 cm) were
taken at breast height (even in the presence of buttresses) or at the top of the stump (Juruena
site), and at the top of the commercial bole. For variation in wood density along the length of
the bole, samples taken at breast height and at the top of the bole were used: 307 trees in CA
with dbh 5-122 cm, identified as 186 species or morpho-species and 235 trees in SA, dbh 5-
104 cm, in 130 species or morpho species. Any radial variation in density was included by
obtaining a full slice of even thickness. Basic wood density was determined for this disk or for
a wedge obtained from it. When present, samples of the heartwood were taken close to the
center of the disks. In 146 trees of the CA sites (dbh 13-106 cm, 112 species or morpho-
species), heartwood samples were taken only at breast height, while in SA sites (n = 76 trees,
dbh = 9-124 cm, 40 species or morpho-species) heartwood samples were also taken at the tops
of the stump and bole. The green (or ‘fresh’) mass and volume were determined on the same
day. The green volume was determined by displacing water in a container placed on a battery-
operated scale, also used in the mass determination. In this study green mass and volume do
not mean that the wood is completely saturated with water (Simpson and TenWolde, 1999),
but rather refers to wood newly removed from the tree. In SA trees (n = 223; dbh 5-104 cm,
125 species or morpho-species) the ratio between green mass and mass after oven drying was
used as a measure of bole water content (e.g., Borchert, 1994; Schulze et al., 1988). This
attribute was obtained both at the base and top of the bole. The green mass was not measured
in samples from trees from CA sites. For the dry weight of each sample a vented electric oven
was used at 103 oC (ASTM, 2002) and samples were considered completely dry after three
consecutive stable weight readings at 24-hour intervals. For all trees, the mean basic density
of the bole (not taper-adjusted) was determined as the arithmetic mean of the density at breast
height (or at the top of the stump for the Juruena site) and at the top of the bole. A taper-
adjusted mean density was not determined in the SA trees because it did not differ
significantly from the arithmetic mean (Nogueira et al., 2005). However, the model developed
in dense forest (CA) tested in this study used taper-adjusted mean density of the bole as the
dependent variable. In this study it was assumed that mean taper-adjusted and mean non-taper
adjusted measures also did not differ significantly in open forest.

51
Linear model statistics from trees in southern Amazon (SA)
Higher adjusted r2 and lower standard error of the estimate constituted the statistical
criteria for selecting the best model to predict full disk density from heartwood density and to
predict ‘green density’ (green mass/green volume) from basic density (dry mass/green
volume). The relations between the variables were found to be linear and the residuals were
uniformly and normally distributed.
Results
Wood density radial variation
The linear relationships between heartwood density and full disk density for dense
forest (CA) and for open forest with palms (SA) had similar slopes (p = 0.441) but different
intercepts (p = 0.001) (Figure 1). The intercept for the CA regression was 0.146 (±0.014 SE,
Table 2); for SA it was 0.110 (±0.022) (Table 3). Despite not having a statistically significant
difference, Figure 1 indicates that the lines are not parallel. The values are clearly lower for
lower values of heartwood density, but tend to converge for values above approximately 0.75.
In this case, the model for CA could be applied in SA, so long as only the slopes of the lines
are considered and not the intercept. In a scatterplot of heartwood density against full-disk
density, 63% of the SA samples fell below the regression line for the Central Amazon. The
average full disk density of all SA samples estimated using the SA model is off by only
~0.4% (difference = -0.002 ± 0.149 SE), but is overestimated by 3% using the CA regression
(Model 1 in Table 2).

52
0.3 0.6 0.8 1.1Heartwood basic density
0.3
0.5
0.8
1.0
Bas
ic d
ensi
ty o
f the
full
disk
Open forest, Southern AmazonDense forest, Central Amazon
Forest type
Figure 1. The relationship between basic density of the full disk and basic density of the heartwood in dense forest in central Amazonia (n = 146 trees) and in open forest in southern Amazonia (n = 76 trees).
Table 3. New linear regressions developed in open forest in southern Amazonia (SA) proposed in this study.
Model description Regression statistics
[Wood density of the full disk] = 0.110 (±0.022) + 0.793
(±0.035) × [Heartwood basic density]
Coefficients ± Std Error; Adjusted r2 = 0.872, Std
error of estimate (SEE) = 0.039, F = 512, n = 76.
[Mean basic density of the bole] = -0.143 (±0.034) + 0.728
(±0.033) × [Mean green wood density of the bole] Adjusted r2 = 0.680, SEE = 0.064, F = 474, n = 224.
[Mean basic density of the bole] = -0.076 (±0.036) + 0.654
(±0.035) × [Green wood density at breast height]
Adjusted r2 = 0.665, SEE = 0.065, F = 359, n = 181
trees.
Radial variation is denoted %RV, or how much the heartwood density exceeds the full
disk density, expressed as a percentage of the latter. A tree with negative %RV has lower
wood density in the heartwood than in the whole disk, thus decreasing density toward the
center, while positive values are found in trees with increasing density toward the center. In
open forest 63% of sampled trees with heartwood had wood density decreasing towards the
outside, while in dense forest this was the case for 82% of the trees with heartwood (see
Nogueira et al., 2005).

53
Percent RV was related to ln(heartwood density) in both forest types (r2 = 0.506 in
dense forest and r2 = 0.368 in open forest, both p = 0.000). Trees with high density heartwood
were lighter toward the outside, while trees with light heartwood tended to increase in density
toward the outside (negative values for %RV) (Figure 2). This would seem to be consistent
with a tendency for light trees to add denser wood toward the outside as they grow larger.
However the relationship between %RV and diameter or height does not support this
conclusion. In the SA, trees that decrease in density toward the outside do this to a greater
degree if they are large, while trees that increase in density toward the outside do not do so to
a greater degree if they are large (Table 4, Figure 3A, B). This suggests that trees reinforce the
strength of their central core as they grow larger, rather than adding a series of successively
denser nested cylinders of wood. No relationship between tree size and %RV was found in the
CA region (Figure 3C, D).
0.3 0.5 0.7 0.9 1.1Heartwood basic density
-30
-20
-10
0
10
20
30
% R
V
Southern Amazon, open forestCentral Amazon, dense forest
Forest type
Figure 2. Difference between basic density of heartwood and of the full disk (%RV) in dense
and open forest.

54
0 50 100 150Diameter (cm)
-20
-10
0
10
20
30
%R
VDensity INCREASING towards the outsideDensity DECREASING towards the outside
Pattern of radial variation in open forest (SA)
A0 10 20 30 40 50
Total height (m)
-20
-10
0
10
20
30y
B
0 30 60 90 120Diameter (cm)
-40
-30
-20
-10
0
10
20
%R
V
Density INCREASING towards the outsideDensity DECREASING towards the outside
Pattern of radial variation in dense forest (CA)
C
0 10 20 30 40 50Total height (m)
-40
-30
-20
-10
0
10
20
D
Figure 3. Relationship between diameter (at breast height or above buttresses) and total
height of trees with %RV (meaning the difference between basic density of heartwood and that of the full disk) in open forest in southern Amazonia (A and B) and in dense forest in central Amazonia (C and D). Positive values of %RV mean that density decreases towards the outside and negative %RV values mean density increases towards the outside. For the significance of Pearson correlation and probability values, see Table 4.

55
Table 4. Correlation between pattern of radial variation (%RV) in density with diameter and total height in trees from two forest types: Dense forest, Central Amazonia and Open forest, Southern Amazonia.
% RV in trees from Dense and Open forest Diameter Total height
Pearson correlation and (p value)*
Density DECREASING towards the outside Dense (n =120) - 0.002 (0.982) 0.053 (0.565)
Open (n = 24) 0.450 (0.027) 0.490 (0.015)
Density INCREASING towards the outside Dense (n = 26) - 0.345 (0.084) - 0.257 (0.204)
Open (n = 14) 0.041 (0.890) 0.214 (0.463)
* Numbers in bold type are significantly different at the 5% level.
Variation in wood density along the bole
Two linear regressions (mean density of the bole × density at breast height) do not
differ statistically in paired comparisons between dense (CA) and open forest (SA), (p =
0.144; n = 542), Figure 4. The linear model for estimating taper-adjusted mean wood density
of the bole from disks at breast height (Model 3 in Table 2) resulted in accurate estimates of
the mean density of the bole: 0.007 ± 0.157 SE difference between measured and estimated
mean, or ~1%).
0.2 0.4 0.6 0.8 1.0Basic density at breast height
0.2
0.4
0.6
0.8
1.0
Basi
c de
nsity
me a
n of
the
bole
Open forest, Southern AmazonDense forest, Central Amazon
Forest type
Figure 4. Relationships between the mean basic wood density of the bole and wood density at
breast height (full disk) in dense forest in central Amazonia (n = 307) and in open forest in southern Amazonia (n = 235).

56
Moisture content
The mean moisture content of the bole in 223 trees in the southern Amazon was 0.416
(± 0.068 SD; 95% CI 0.407 – 0.425; range 0.246 – 0.595). Moisture content of the bole was
inversely related to basic wood density (Pearson correlation = -0.77, p = 0.000; n = 222)
(Figure 5A). There was a much weaker inverse relationship between moisture content and
green wood density (r = -0.292, p = 0.000; n = 222) (Figure 5B). These two results are
expected if the density of dry wood tissue free of air varies little across all species and if trees
with less-dense wood store more water, but not much more air, in the same volume of green
wood. The moisture content increased with height along the bole (paired t-test, p = 0.000;
Figure 5C), suggesting more moisture in younger tissues. The percentage moisture content at
the base of the bole (top of the stump or at breast height) was 0.399 (± 0.075 SD; n = 223,
95% CI 0.389 – 0.408; range 0.22 – 0.67) while at the top of the bole moisture content was
0.433 (± 0.070 SD; n = 223, 95% CI 0.442 – 0.423; range 0.18 – 0.65). The moisture content
of the entire bole was not significantly related to bole diameter at breast height (r = 0.020, p =
0.766, n = 223). Two linear relations between ‘green density’ and basic wood density using
trees sampled only in open forest (SA) are described in Table 3.

57
0.2 0.3 0.5 0.6Moisture Content (%)
0.2
0.4
0.6
0.7
0.9M
ean
b asi
c de
nsity
of t
he b
ole A
BASE TOP0.1
0.3
0.5
0.8
% M
oist
ure
Con
tent
i n th
e Bo
le C
Figure 5. Relationship between moisture content (%) with mean basic wood density of the bole (A) and, mean ‘green density’ of the bole (B). Variation in moisture content (%) along the length of the bole is also presented (C).
Discussion
Wood density normalization for biomass estimates
The relationships reported in this chapter for radial variation and variation along the
bole allow a heartwood dataset or a dataset of full-disk densities at breast height sampled in
dense and open forest to be converted to basic density of the whole bole that is suitable for
0.2 0.3 0.5 0.6Moisture Content (%)
0.5
0.8
1.0
1.3
Mea
n gr
een
dens
i ty o
f the
bol
e B

58
biomass estimates. Dense and open forests are the two main forest types presently undergoing
deforestation in Brazilian Amazonia (Brazil, INPE, 2006).
Although radial variation in both dense and open forest has similar patterns, the
regression developed in CA (dense forest) does not adequately describe light-density woods
(Figure 1). This resulted in overestimated biomass in open forest due to the predominance of
trees with light density (Figure 2). The heartwood and full disk densities in open forest tend to
be lower than those of dense forest (Figure 1). Although the bias is small (~3%) when the CA
linear regression is applied in open forest, this percentage is substantial for carbon balance
and can be minimized by use of a region-specific SA regression or by using the CA regression
and ignoring the constant. In any case, a separate regression for predicting full disk density
from heartwood is described for open forest with palms (Table 3). Furthermore, this chapter
examines only one open forest type, which has no intrinsic disturbance. Open forests
dominated by climbing bamboo or by dense tangles of lianas have many gaps which favor
fast-growing trees with light wood.
The results (Figure 4) show that a single regression developed in dense forest (Table 2,
Model 3) also can be applied in open forest to correct for the position of the sampling along
the length of the bole. This means that the pattern of variation along the bole is similar
between dense forest and open forest and that simple percentage corrections can also be used
(about 4.3% on average, see Nogueira et al., 2005, 2007). Bias from variation along the bole
has not been corrected in recent large-scale wood-density estimates and can result in
substantial overestimation.
Models that predict full-disk density from known heartwood density are needed for
biomass estimates because there are regions where only heartwood density is available. For
western Amazonia wood density datasets have all been obtained from heartwood (Baker et al.
2004, p. 562, Table A1). These heartwood values without correction were used by Malhi et al.
(2006) to produce biomass maps. In Brazilian Amazonia most of the wood density
measurements in Amazonian forest were also based on heartwood, such as those of IBDF
(Brazil, IBDF, 1981, 1988, 1989) and IBAMA (Brazil, IBAMA, 1997). Although the
corrections to current heartwood data help improve biomass estimates, it is important to
consider that the patterns of radial density found in this study are not representative at the
community level because they were based only on trees with heartwood and therefore do not
apply to all species. Moreover, in open forest the use of datasets based only on heartwood can

59
overestimate density because light species without heartwood will be under-represented, in
contrast to dense forest, which is predominantly composed of species with medium or dense
wood.
Together with moisture content the corrections for radial variation and variation along
the bole allow resolution of almost all bias present in previously published datasets, but there
still remains the relation of the density of non-tapered cores to the full-disk density. These
relationships are important because core sampling is a practical and non-destructive method
and because a number of recent studies have used increment borers (DeWalt and Chave,
2004; King et al., 2006; Muller-Landau, 2004; Woodcock and Shier, 2003; Woodcock, 2000).
In spite of several prior studies having obtained wood density from cores sampled with
increment borers, no equations exist for estimating density of the full disk using core samples.
Wood density radial variation in trees from dense and open Amazonian forest
The occurrence of trees with dense heartwood is expected to differ between dense and
open forest types because the abundance of species with light and medium density wood is
higher in open forest (around 91% in open forest with palms versus 67% in dense forest),
(Nogueira et al., 2005, 2007). Tropical species with light wood density usually do not have
heartwood (e.g. Cecropia spp.), and in species with lower central density there is a tendency
for wood density to be higher toward the outside, as shown in Figure 2. Moreover a greater
percentage of the trees in open forest had %RV in the range -5% to +5% (Figure 2), and thus
showed little or no radial tendency. Families such as Bombacaceae, Tiliaceae, Malvaceae,
Caricaceae and certain genera of Leguminosae generally have light wood or lack heartwood.
Chave et al. (2006) suggest that western Amazonian forests are also dominated by families
with low mean wood density. The fast-growing species that are common in liana-dominated
and in bamboo-dominated open forests also may not have heartwood.
Although prior studies suggest that substantial radial variation is predominant in
species with low wood density, this study shows that the difference between heartwood and
full-disk density is also high for species with high heartwood density (Figure 2). Despite
heartwood and full-disk density being strongly correlated (Figure 1). Figure 2 indicates that
when heartwood is very dense, the sapwood and bark have a lower relative density.
There are four possible strategies as trees grow larger: (1) species with uniformly low
density over the course of their development, (2) uniform high density, (3) species that invest
60
in an increasingly dense heartwood core as they grow and (4) species that initially have lower
density overall and invest in higher density wood toward the outside of the bole as they grow.
Only the first three patterns were detected in this study. Nonetheless, studies of pioneer and
early successional species have found dramatic radial increases from pith to bark (Wiemann
and Williamson, 1988; 1989; Woodcock and Shier, 2002, 2003).
In dense forest, species with denser heartwood are more abundant (Figure 2), while in
open forest there many species with light heartwood. Also, because of this the stand-level
wood density tends to be lower in disturbed forest or in the initial stages of development
because of the prevalence of colonizing species (Suzuki, 1999). Thus wood density is an
indicator of the changes in primary vegetation in Amazonian forests and is important for
studies of biomass loss in standing forests (Laurance et al., 2006). This could be important in
assessing changes in biomass of Amazonian forest caused by global warming because the
methods used so far are only able to assess increments in diameter over a period of years, but
not intrinsic changes in biomass stock, such as those caused by changes in wood density and
other wood properties (Bräker, 2001).
Moisture content
The results of this study suggest differences in water storage in the boles of trees in
dense forest (CA) and open forest (SA) that could have implications for estimates of biomass
in Amazonian forests. In dense forest the moisture content used by Chambers et al. (2001) for
converting fresh biomass to dry mass in central Amazonia was 0.38 (± 0.08 SD; n = 50 trees)
for all above-ground tree components (bole, branches, leaves), similar to the value of 0.39
(bole only) adopted by Higuchi et al. (1998) based on 38 trees and 0.388 found by da Silva
(2007) based in 128 trees. The moisture in boles in open forest found in this study (0.416)
differs significantly from the value found by Higuchi et al. (1998) and by da Silva (2007) in
dense forest in the central Amazon (t = 5.641, df = 222, p value < 0.0005) and differs from the
value of 0.38 reported by Chambers et al. (2001) (t = 7.847, p value < 0.0005). This suggests
that allometric equations developed in dense forest that estimate fresh mass from diameter
only (such as the equations of Chambers et al., 2001 and Higuchi et al., 1998) will lead to two
kinds of overestimate when applied to open forest. First, the lower wood density of open
forests must be considered. Second, an additional 3-4% overestimate will occur if fresh mass
is converted to dry mass using moisture contents typical of dense forest. An example is the

61
study of Cummings et al. (2002) that used the Higuchi et al. (1998) model. The increase in the
percentage moisture content with height of the bole (e.g., Figure 5) indicates that
measurements are needed of moisture content along the length of the bole in order to obtain
dry mass from tree biomass measures (Nelson et al., 1999).
Moisture content of the bole depends directly on wood properties because when
specific gravity is high, lumen volume is low and maximum moisture content is restricted
(Simpson, 1993; Simpson and TenWolde, 1999). Species with lower wood density have more
parenchyma tissues and hence higher water-storage capacity than denser species (Figure 5A)
(Borchert, 1994; Borchert and Pockman, 2005; Roth, 1981; Schulze et al., 1988; Suzuki,
1999). Because of this a higher moisture content is expected in the boles of trees in open
forest because there are more light-density species than in dense forest (Nogueira et al., 2005,
2007), which could be caused in part by dry-season length. Although the ecophysiological
explanation for differences in moisture content between different forest types is not yet
entirely known, it is widely recognized that wood density plays an important role in tree water
status because the wood is an important component of the soil-plant-atmosphere continuum
(Hinckley et al., 1991). For example, wood density is an important determinant of xylem
water transport properties (such as specific hydraulic conductivity and xylem cavitation
resistance), thereby determining patterns of regulation of whole-plant water balance (Hacke et
al., 2001; Meinzer, 2003).
The lack of a relationship between moisture content and bole diameter shown in this
study could help in understanding the partitioning of soil water among species or size-classes
of trees in tropical seasonal forest, as well as the presence of deep roots (Dawson, 1996;
Goldstein et al., 1998; Meinzer, 2003). Different from several prior studies, the results in this
chapter are representative at the community level because they include 125 species or
morpho-species distributed over a wide range of diameters (dbh 5 to 104 cm) and because
moisture content was obtained from samples of all tissues in the bole (bark, sapwood and
heartwood) rather than only from heartwood samples (e.g., Borchert, 1994; Meinzer et al.,
1999). Previous studies have developed equations for determining wood density as a function
of moisture content (Simpson, 1993). The two new equations developed in the present study
are also useful for estimating moisture content in the boles of trees. The new linear models are
also useful for converting green (fresh) density to basic density from samples taken at breast
height or representative of whole bole (mean of the bole). For Brazilian Amazonia, datasets
62
are scarce that are obtained as green density, but these relationships are useful for moisture
content studies in the boles of trees. These linear regressions allow basic wood density to be
obtained directly in the field, without requiring the use of a vented electric oven. This
application of the new models can to be very important in remote parts of the Amazon forest.
Conclusions
In spite of the importance of corrections for the heartwood density dataset for
improved biomass and carbon-flux estimates, linear regressions developed in dense forest do
not adequately describe radial variation in trees of open forest, southern Amazonia (SA).
Heartwood regressions from dense forest tend to overestimate the mean density of disks or the
mean of the bole in open forest. However, for corrections of variation along the bole in open
forest, the regression from dense forest provides an accurate correction of the wood-density
mean. Two new regressions described in this study allow basic wood density to be obtained
from the green density mean of the bole (either from samples taken at breast height or from
the mean of the bole). The equations can also be useful in studies of water storage in trees. In
open forests in southern Amazonia moisture content of the bole is significantly higher than in
dense forest in central Amazonia. For normalization of wood densities from a variety of
datasets an equation is needed that directly relates values from cores taken with increment
borers to the wood density of disks (heartwood, sapwood and bark).

Chapter III - Tree Height in Brazil’s ‘Arc of Deforestation’:
Shorter trees in south and southwest Amazonia imply lower
biomass3 Abstract
This chapter estimates the difference in stand biomass due to shorter and lighter trees in southwest (SW) and southern Amazonia (SA) compared to dense forest in central Amazonia (CA). The official forest biomass values used for estimating carbon emissions from deforestation throughout Brazilian Amazonia have been based on allometric relationships derived in CA. Thus, estimates of carbon emissions will be affected by any differences between CA forests and those in the “arc of deforestation” where clearing activity is concentrated along the southern edge of the Amazon forest. At 12 sites (in the Brazilian states of Amazonas, Acre, Mato Grosso and Pará) 763 trees (dbh = 5 to 124 cm) were felled and measurements were made of total height and of stem diameter. In CA dense forest, trees are taller at any given diameter than are those in SW bamboo-dominated open, SW bamboo-free dense and SA open forests. Compared to CA, the three forest types in the arc of deforestation occur on more-fertile soils, experience a longer dry season and/or are disturbed by climbing bamboos that cause frequent crown damage. Observed relationships between diameter and height were inconsistent with assumptions of metabolic ecology theory. This reinforcees the argument that allometric scaling exponents (2/3) between height and diameter vary in forests on different substrates or with different levels of natural disturbance. Reductions in stand biomass due to shorter tree height alone were 11.0%, 6.2% and 3.6%, respectively, in the three forest types in the arc of deforestation. A prior study had shown these forest types to have less-dense wood than CA dense forest. When tree-height and wood-density effects were considered jointly, total downward corrections to estimates of stand biomass were 39%, 22% and 16%, respectively. Downward corrections to biomass in these forests were 76 Mg ha-1 (~ 21.5 Mg ha-1 from the height effect alone), 65 Mg ha-1 (18.5 Mg ha-1 from height), and 45 Mg. ha-1 (10.3 Mg ha-1 from height). Hence, biomass stock and carbon emissions are overestimated when allometric relationships from dense forest are applied to SW or SA forest types. Estimates of biomass and carbon emissions in Brazil’s National Communication under the United Nations Framework Convention on Climate Change require downward corrections for both wood density and tree height. keywords: Allometry; Carbon; Global warming; Greenhouse gas emissions; Tropical forest; Wood density.
3 Nogueira, E.M., Nelson, B.W., Fearnside, P.M., França, M.B., de Oliveira, A.C.A., 2008. Tree height in Brazil’s ‘arc of deforestation’: Shorter trees in south and southwest Amazonia imply lower biomass. Forest Ecology and Management. doi:10.1016/j.foreco.2008.02.002
64
Introduction
Large-scale patterns, such as physiognomy of the vegetation, floristic composition,
tree turnover and biomass stock have recently been described for Amazonian vegetation (Eva
et al., 2004; Houghton et al., 2001; Malhi et al., 2006; Phillips et al., 2004; Terborgh and
Andresen, 1998; ter Steege et al., 2000, 2006). Conventional classifications have generally
assumed that the Amazon region has two main forest types, identified as “dense” and “open”
forest (Veloso et al., 1991). The dense forest is more extensive (Brazil, IBGE, 1997) and has
denser wood (Chave et al., 2006; Nogueira et al., 2005, 2007), giving this forest a larger
biomass stock than open forest (Malhi et al., 2006). The per-hectare total basal area has been
clearly shown to be higher in the central Amazon than at the region’s southern edge, mainly
due to the difference in the abundance of small trees (Baker et al., 2004; Malhi et al., 2006).
While dense forests are on poor soils, open forests occur on more fertile soils in the southern
portion of Brazilian Amazonia (Brazil, RadamBrasil, 1973-1983; Brown and Prance, 1987;
Malhi et al., 2004; Sombroek, 2000). Solar radiation is more seasonal and the dry season is
longer in open forest, affecting tree species diversity and above-ground net primary
productivity (Baker et al., 2004; Chave et al., 2006; Laurance et al., 2006; Malhi et al., 2004;
Meinzer et al., 1999, 2001; ter Steege et al., 2003, 2006; Tuomisto et al., 1995).
Two open forest types disturbed by abundant lianas or climbing bamboo cover
366,000 km2 of the southern Brazilian Amazon (Brazil, IBGE, 1997). Recent gaps and low-
stature patches occupied 40% of a liana-dominated forest in the eastern Amazon (Gerwing
and Farias, 2000). Forest dominated by climbing bamboo (Guadua spp.) is also largely
composed of disturbed patches. These gap-rich forests sustain more fast-growing pioneer tree
species. Consequently, wood density is lower than in neighboring dense forest without
climbers (Nelson et al., 2006). In open forests disturbed by climbing bamboo or lianas (Putz
et al., 1983; Putz, 1984; Schnitzer et al., 2000; Silveira, 1999), smaller trees suffer stem
breakage and height loss (Clark and Clark, 2001; Griscom and Ashton, 2006). In the Peruvian
Amazon, Griscom and Ashton (2006) found that, in the presence of abundant climbing
Guadua spp., trees 5-29 cm in diameter attained an average height that was about 50-55% that
of trees in the same size classes in nearby bamboo-free plots. Griscom and Ashton (2006)
attributed this difference to crown and stem breakage. Trees larger than 30 cm dbh were
mostly beyond the reach of bamboo and these showed no difference in average height
between neighboring plots with and without bamboo. In a liana-dominated open forest in the

65
Bolivian Amazon, Alvira et al. (2004) found that a large percentage of trees was infested in
all dbh size classes, the largest trees having the highest frequencies and loads. Trees with
lianas had more crown damage than trees without lianas.
Differences in the total height of trees are also expected among Amazonian forest
types due to differences in ecological interactions, such as tree mortality, development of
understory trees, competition and floristic composition, which affect vertical and horizontal
structural patterns in forest canopies (Griscom and Ashton, 2003; Latham et al., 1998;
Laurance et al., 2006; Lugo and Scatena, 1996; Muller-Landau et al., 2006; Weiner and
Thomas, 1992). Thus, allometric relationships (such as the relationships among bole diameter,
tree height, crown diameter and wood density) will be useful for understanding the structure
and dynamics of tropical forests and the competitive interactions among the tree species
(Bohlman and O’Brien, 2006; O’Brien et al., 1995; Perez, 1970; van Gelder et al., 2006;
Weiner and Thomas, 1992). Furthermore, knowledge of variation in allometric patterns
among Amazonian forests is likely to be useful in improving the theory underlying universal-
scaling relationships between diameter and tree size (Enquist, 1999, 2002; Muller-Landau et
al., 2006; Niklas and Spatz, 2004).
Variation in the vertical structure of forests could directly affect biomass stock. In
transition (open) forest, trees may be shorter at any given diameter as compared to trees in the
dense forest in central Amazonia, and obviously the shorter of two stems of the same diameter
will have less biomass. Similarly, lighter-density stems with the same volume have less
biomass.
Recent Amazonian forest biomass studies applied wood-density corrections and
recognized the necessity of adapting allometry to improve biomass estimates, mainly at the
southern edge of Amazonia (Baker et al., 2004; Malhi et al., 2004, 2006). However, if no
correction is made for the height effect, the biomass will be overestimated by allometric
relationships derived from central Amazonian studies. Recent wood-density studies (Nogueira
et al., 2007), combined with appropriate understanding of the structure of southern
Amazonian forests, could provide substantial insights into the impact of land-cover and land-
use change on the global carbon cycle. This is because the southern edge of Amazonia
comprises the “arc of deforestation” and constitutes the predominant source of carbon
emissions from deforestation in Brazil. This is also the area where the greatest uncertainties

66
remain in carbon-stock estimates (Houghton et al., 2000, 2001; Nepstad et al., 2001; Nogueira
et al., 2007).
In this study evaluated whether trees of southwestern and southern Amazonia forest
are shorter at any given diameter than in central Amazonia. The study also assesses whether
the scaling of tree stem diameter (D) with total height (L) is consistent with the assumptions
of metabolic ecology theory that suggest the universal scaling relationship log L log D 2/3
(Muller-Landau et al., 2006). In addition, the study converts the eventual differences in the
total tree height and wood density between forest types into differences in estimates of stand
biomass.
Materials and Methods
Study sites
At 12 sites in the Brazilian Amazon (in the states of Amazonas, Acre, Mato Grosso
and Pará) 763 trees were measured (“diameter at breast height”, or dbh = 5 to 124 cm). Six
sites were close to Manaus in central Amazonia (Nogueira et al., 2005) and the other six sites
were distributed in the ‘arc of deforestation’: two sites in Acre state (SW open bamboo-
dominated and SW dense forest), three sites in northwestern Mato Grosso state and one site in
the southern portion of Pará state (together designated as “SA open forest”) (Nogueira et al.,
2007). In each forest type, trees over 5 cm dbh were felled and measurements were made of
total height, diameter (dbh or above buttresses) and wood density: 310 trees in CA dense
forest, 92 trees in SW open bamboo-dominated forest, 97 trees in SW dense forest without
bamboo and 264 trees in SA open forest (in this last forest type, wood-density samples were
taken of 72% of the trees).
Detailed descriptions of all sites are available in Nogueira et al. (2005, 2007). These
two previous studies address the wood-density effect on biomass and on estimates of carbon
emissions based on wood-volume inventories throughout Amazonia. In the present study the
effect of the total height of trees, together with the previously published wood-density dataset,
are used to adjust allometric equations from well-studied forests in central Amazonia to the
forests of southern and southwestern Amazonia. This objective is similar to that of recent
studies that applied only wood density adaptations to allometric equations (Baker et al., 2004;
Malhi et al., 2006).
67
Data collection
At all sites, trees to be felled were chosen randomly, but stratified by size classes
starting at 5 cm dbh, according to the proportion that each class contributes to basal area in
local forest inventories. For each tree, measurements were made of dbh (1.36 m above the
ground at the central Amazonia sites and 1.30 m above the ground at the other sites, or above
buttresses when present for all sites), and total height. The wood-density datasets used in this
study were obtained from Nogueira et al. (2005, 2007), where detailed information is given on
botanical specimens and the methodology for wood-density determination.
Adapting allometry
Height × diameter relationship: effect on biomass
The data from the two southwestern and the combined southern Amazonia forests
were compared with those from the central Amazon in paired regressions. Data for each pair
were pooled so as to examine the effects on total tree height of ln(diameter), forest type and
the interaction between ln(diameter) and forest type. If the interaction is significant (different
slopes), the two regressions in a pair are different. If the interaction is nonsignificant, the two
slopes are homogeneous and an analysis of co-variance is needed to test for a difference
between the two intercepts. If the intercepts are different, a height correction can still be
applied to the biomass. If neither the slopes nor the intercepts are different, the trees in the test
forest and in the central Amazon forest are not distinguishable (Neter and Wasserman, 1974;
Sokal and Rohlf, 1995). Only the effect of a shorter trunk is considered, including the portion
inside the crown. The trunk is taken to be 66% of total tree biomass in central-Amazonian
dense forest (Higuchi et al., 1998). Biomasses of branches, twigs and leaves are assumed to be
unaffected by reduced height.
It was assumed that shorter total height in a southern or southwestern Amazon tree, as
compared with a central Amazon tree with the same diameter, translates into a reduced total
tree biomass. A correction factor was applied based on the ratio of the two expected total tree
heights at a given diameter. Expected total tree height for any given diameter in each forest
type was obtained from the relationship between total height and ln(diameter) in the felled
calibration samples. After testing for significant differences, linear regressions between these
two variables were developed for each of the four forest types in this study (Table 1).

68
Table 1. Parameters of linear regressions for different Amazonian forest types.
Forest type Parameters* [Total height = a + b ln(diameter)]
a (±SE) a at CI 95% b (±SE) b at CI 95% n dbh range Adjusted r2 SEE**
SW Amazon, open bamboo-dominated -16.223 (1.494) -19.15 -13.29 11.198 (0.464) 10.29 12.11 91 5 - 85 0.866 3.577
SW Amazon, dense forest -12.068 (1.883) -15.81 -8.33 10.672 (0.553) 9.59 11.76 97 5 - 106 0.794 4.185
Central Amazon, dense forest -11.168 (0.793) -12.72 -9.61 11.210 (0.254) 10.71 11.71 307 5 - 106 0.864 2.691
Southern Amazon, open forest -10.678 (0.637) -11.93 -9.43 10.581 (0.233) 10.12 11.04 264 5 - 124 0.887 2.454
* All parameter values are significant for P-value (p = 0.0001). Three outliers were excluded in the central-Amazon forest, two in the southern-Amazon forest and one in the SW Bamboo forest. For identification of outliers, the studentized residuals (to identify outliers in y space) were plotted against leverage (to identify outliers in x space) and Cook’s distance was calculated. Cook’s distance measures the influence of each sample observation on the coefficient estimates (Cook and Weisberg, 1982; Wilkinson, 1990). ** Standard Error of the Estimate (SEE) = √Residual Mean-Square
69
Wood density: effect on biomass
Previous analyses of wood-density data of the four forest types (Nogueira et al., 2005,
2007) showed the boles of the trees to be denser in the central Amazon than in the other three
forest types (p = 0.0001, post-hoc Bonferroni). Wood density is highest in the central-Amazon
dense forest, lowest in the southwest Amazon bamboo-dominated forest, and has intermediate
values in the southwest-Amazon dense forest without bamboo and southern Amazon open
forest. As there was no tendency to increase or decrease density as a function of dbh within
any of the four forest types (Nogueira et al., 2005, 2007), a single correction factor can be
applied to each forest to calculate the effect of wood density on biomass, independent of dbh,
either on a tree-by-tree basis or for the total tree biomass per hectare. The correction factor
was multiplied by the dry weight biomass of trees estimated using central Amazon dense-
forest allometry (Higuchi et al. 1998), in the same way as described above for the height
effect. The correction factor is the ratio Ws : Wc; where Ws = forest average wood density at
breast height in southern or southwestern Amazonia and Wc = dense-forest average wood
density at breast height in central Amazonia.
Results
Height × diameter relationship: trees in southern and southwestern Amazonia tend to be
shorter than trees of the same diameter in central Amazonia
The relationships between total tree height and ln(diameter) are shown in three paired
regressions (Figure 1). In all three pairs the interaction effect was insignificant (p = 0.922, p =
0.438 and p = 0.818), meaning that the slopes are homogeneous within each pair. Analysis of
co-variance of total tree height using forest type as the categorical factor and ln(diameter) as
the continuous covariate, showed the intercepts of the three forests in the arc of deforestation
to be different from that of the central-Amazon forest (ANCOVA p < 0.001). Therefore, in all
three forest types of the southern and southwest Amazon, trees of any given diameter tend to
be shorter than trees of the same diameter in central Amazonia.
In order to express the effect of total height as a biomass difference between forest
types, tree biomass was estimated based only on dbh (or diameter above buttresses when these
structures are present) using the regression of Higuchi et al. (1998), which was developed for
the central Amazon. This gives the biomass estimate B1 for each tree. If B2 is the total tree
biomass in another forest type after correcting only for the height effect, and Cm is a

70
multiplicative correction factor, such that B2 = B1 × Cm, then under the assumptions outlined
in the methods, it can be shown that Cm = 0.66 (H1d/H2d) + 0.34; where H1d = expected height
in southern or southwestern Amazon forest, at diameter d; and H2d = expected height in
central Amazon dense forest, at the same diameter d. Expected heights are obtained from the
linear regressions in Figure 1. The relationship between ln(diameter) and Cm is shown in
Figure 2 for each SW Amazon forest and for the southern Amazon forest. Downward
corrections of biomass are greatest for trees with smaller diameters and for the bamboo-
dominated forest. Considering just the effect of lower tree-height for a given diameter, the
estimated stand biomass (trees and palms ≥ 5 cm dbh) is lower than in the central Amazon by
11% in SW Amazon open forest with bamboo, 6.2% in SW Amazon dense forest, and 3.6%
in the southern Amazon open forests.
Generally, the 2/3 scaling exponent predicted by metabolic ecology theory was
violated by large trees in the four Amazonian forests studied. When considering trees of all
sizes, the scaling exponents found between log10(diameter) and log10(total height) for three of
the forest types were significantly lower than the value of 2/3 predicted by metabolic ecology
theory. The exception was SW bamboo-dominated forest, which includes the value 2/3 in the
95% confidence interval (Table 2). For small trees (dbh < 20 cm), the scaling exponent was
significantly greater than 2/3 in the SW Amazon dense forest, and not significantly different
from 2/3 in the other forest types. These results reinforce the argument that allometric scaling
exponents vary in forests with different environmental resources or disturbance regimes.

71
1 2 3 4 50
10
20
30
40
50SW Amazon, dense forestCentral Amazon, dense forest
Forest type
B
1 2 3 4 5ln (D)
0
10
20
30
40
50
Tota
l tre
e he
i ght
(m)
Southern Amazon, open forestCentral Amazon, dense forest
Forest type
C
Figure 1. Paired regressions of ln(diameter) versus total tree height, compared between central
Amazon dense forest (× symbols, dark), two of the southwest Amazon forests and southern Amazon forest (solid circles, gray). A: southwest Amazon open, bamboo-dominated forest, B: southwest Amazon dense forest, C: southern Amazon open forest. D: ln (Diameter) versus total height (m) for all four forest types.
1 2 3 4 5ln (D)
0
10
20
30
40
50
Tota
l tre
e he
ight
(m)
SW Amazon, bamboo dominatedCentral Amazon, dense forest
Forest type
A
1 2 3 4 50
10
20
30
40
50SW Amazon, bamboo-dominatedSW Amazon, dense forestSouthern Amazon, open forestCentral Amazon, dense forest
Forest type
D
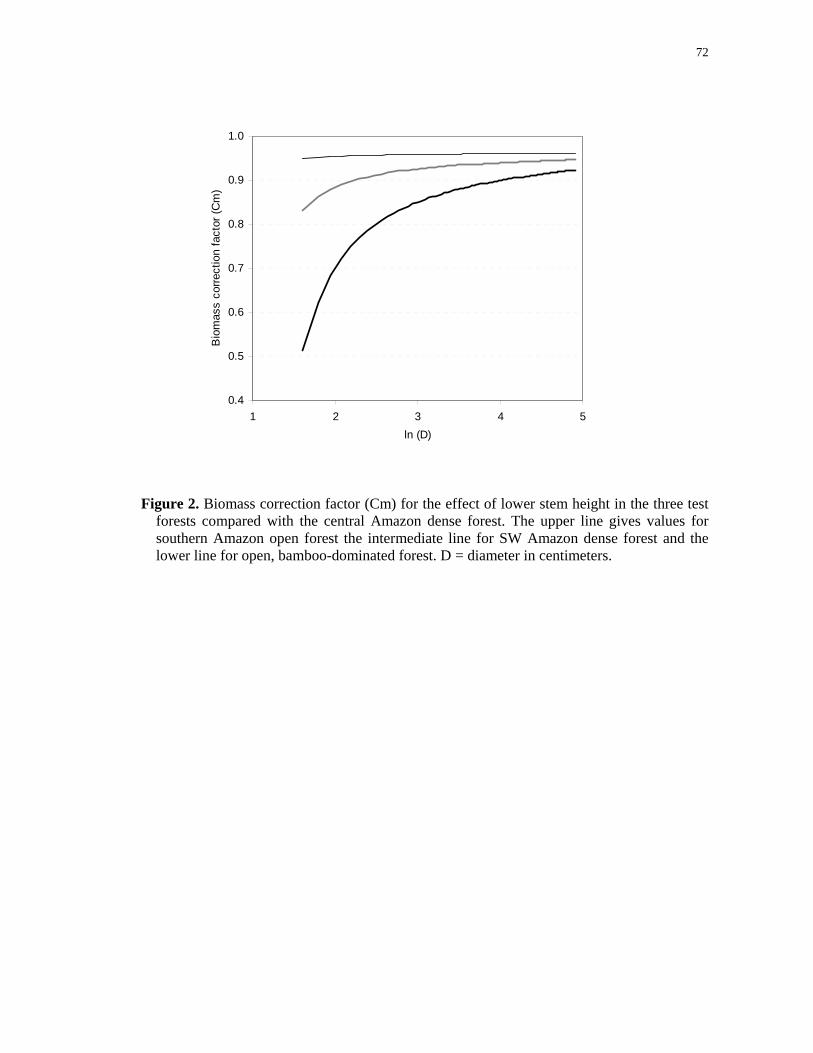
72
Figure 2. Biomass correction factor (Cm) for the effect of lower stem height in the three test forests compared with the central Amazon dense forest. The upper line gives values for southern Amazon open forest the intermediate line for SW Amazon dense forest and the lower line for open, bamboo-dominated forest. D = diameter in centimeters.
0.4
0.5
0.6
0.7
0.8
0.9
1.0
1 2 3 4 5ln (D)
Bio
mas
s co
rrect
ion
fact
or (C
m)

73
Table 2. Parameters of fitted linear relationships between log10(stem diameter) with log10(tree total height) for different Amazonian forest types, including trees of all sizes, diameter < 20 cm and trees with stem diameter ≥20 cm. Bold values highlight regression slopes.
Forest type Parameters [log 10 (Total height)= a + b log10(diameter)]
a (±SE) CI 95% b (±SE) CI 95% n Adjusted r² SEE*
All trees Dense forest (Central Amazonia) 0.625 (0.018) 0.590 - 0.661 0.538 (0.013) 0.511 - 0.564 307 0.842 0.061
Open forest (Southern Amazonia) 0.564 (0.017) 0.530 - 0.597 0.558 (0.014) 0.530 - 0.586 264 0.851 0.066
Dense forest (SW Amazonia) 0.494 (0.045) 0.404 - 0.584 0.576 (0.031) 0.515 - 0.637 97 0.788 0.101
Open bamboo-dominated forest (SW Amazonia) 0.276 (0.040) 0.197 - 0.354 0.685 (0.028) 0.628 - 0.741 91 0.867 0.095
Trees < 20 cm in stem diameter
Dense forest (Central Amazonia) 0.428 (0.042) 0.346 - 0.510 0.719 (0.038) 0.645 - 0.794 135 0.729 0.067
Open forest (Southern Amazonia) 0.448 (0.034) 0.381 - 0.515 0.673 (0.033) 0.608 - 0.737 199 0.678 0.068
Dense forest (SW Amazonia) 0.134 (0.124)** -0.106 - 0.374 0.919 (0.119) 0.689 - 1.149 30 0.680 0.119
Open bamboo-dominated forest (SW Amazonia) 0.213 (0.106)*** 0.007 - 0.419 0.737 (0.102) 0.538 - 0.935 41 0.573 0.114
Trees ≥20 cm in stem diameter
Dense forest (Central Amazonia) 0.842 (0.035) 0.774 - 0.911 0.394 (0.023) 0.350 – 0.439 172 0.636 0.046
Open forest (Southern Amazonia) 0.767 (0.050) 0.671 - 0.863 0.424 (0.032) 0.363 - 0.485 65 0.741 0.047
Dense forest (SW Amazonia) 0.817 (0.078) 0.663 - 0.971 0.379 (0.048) 0.285 - 0.473 67 0.491 0.074
Open bamboo-dominated forest (SW Amazonia) 0.547 (0.086) 0.378 - 0.716 0.522 (0.053) 0.419 - 0.625 50 0.672 0.071
*Standard Error of the Estimate (SEE) = √Residual Mean-Square **Parameter value not significant at the 5% level. Other parameter values (unmarked) are all significant at the 0.1% level. ***p = 0.051.

74
Effect on biomass due to wood-density differences between trees in southern and
southwestern Amazonia and trees in central Amazonia
Based on prior reported mean wood density by forest type (Nogueira et al., 2005,
2007) the wood-density differences expected between central Amazonia and the three other
forest types were estimated (Table 3). Average wood density for the entire tree was assumed
to vary in direct proportion to the wood density at breast height. The confidence intervals
indicate a 23-33% lowering of biomass for trees (≥5 cm dbh) in the open bamboo-dominated
forest, 11-20% lowering of biomass for trees in dense forest without bamboo and 9-15%
lowering of biomass for trees in open forest in southern Amazonia. If only the wood-density
correction were applied, the estimated stand biomass reductions for the three forest types
would be 28%, 16% and 13%, respectively.
Difference in biomass due to both height and wood density
Due to lower height and lighter wood density, trees and palms (≥ 5 cm dbh) in SW
Amazon open bamboo-dominated forest, in SW Amazon dense forest and in southern
Amazon open forests, biomass stocks were, respectively, 76, 65 and 45 Mg/ha-1 (dry weight)
less than predicted by the uncorrected central Amazon model (Figure 3, Table 4). Considering
only the height effect, the estimated biomass reductions for these forests were 21.5, 18.5 and
10.3 Mg ha-1. The effect of lower wood-density on biomass estimates is greater than the effect
of tree height in all three forest types in the S and SW Amazon regions (Figure 3). These
results suggest that biomass per hectare is substantially overestimated by the central-Amazon
model when applied to the southwestern or southern Amazon without corrections. Although
the correction applied makes logical sense, it should be emphasized that the corrected biomass
estimates have not yet been validated by new allometric relationships determined directly by
felling and weighing trees in test plots in southern or southwestern Amazonia.

75
Table 3. Wood density at breast height (dry weight at 80 oC/green volume with bark) in the four Amazonian forest typesa
Forest type Sample size
(trees ≥ 5 cm dbh)
Average basic density at
breast height Std deviation
Biomass correction factor
(± 2 std errors of the ratio of means)b
Central Amazon dense 310 0.712 (0.704) 0.119 (0.117) ---
SW Amazon open bamboo-dominated 92 0.512 0.176 0.718 ± 0.0534
SW Amazon dense 97 0.600 0.160 0.843 ± 0.0482
Southern Amazon open 191 (0.618) (0.125) 0.877 ± 0.0306 a Values in parentheses are dry weight at 103 oC. The biomass correction factor is the ratio between the mean wood density in a given forest type and the mean wood density in the central Amazon. b Standard error for a ratio of two estimates (Ott and Longnecker, 2001).
Table 4. Effect of total-height and wood-density corrections on estimated per-hectare biomassa
Forest type Biomass estimated using central
Amazon allometric equation
Biomass corrected for height and
wood-density difference % Difference
SW Amazon bamboo-dominated 194 ± 36.8 118 ± 23.4 39%
SW Amazon dense 297 ± 21.6 232 ± 17 22%
Southern Amazon open 285 240 16% a For the two forest types in the southwestern Amazon means ± 1 std. dev. (n = 10) are given for trees and palms ≥5 cm dbh (or above buttresses). In the southern Amazon the biomass estimates were obtained from the mean number of trees for each diameter class (5-cm intervals) estimated from 11 ha where trees ≥ 10 cm in diameter were inventoried by Feldpausch et al. (2005) and 30 ha where trees with diameter ≥ 5 cm were inventoried by Pereira et al. (2005).

76
0
50
100
150
200
250
300
SW Amazon dense forest
SW Amazon bamboo-dominated
forest
S Amazon open forest
Mg ha
-1
height effect
wood density effect
fully corrected
Figure 3. Stand biomass for trees + palms ≥5 cm dbh (or above buttresses) in the SW
Amazon is adjusted downward by 39% (SW Amazon open, bamboo-dominated forest), 22% (SW Amazon dense forest), and by 16% (southern Amazon open forest) after corrections for lower wood density and shorter tree height as compared with these attributes in central-Amazon dense forest.
Discussion
This study assumes that there is no difference in crown biomass for trees of equal
diameter between dense forest in central Amazonia and the three forest types studied in
southwestern and southern Amazonia. This may be a conservative assumption. Crown
damage was more prevalent in trees infested by abundant climbing bamboos or lianas (Alvira
et al., 2004; Griscom and Ashton, 2006) in two widespread open forest types of S and SW
Amazonia. On Barro Colorado Island, Panama, Bohlman and O’Brien (2006) found that gap
species have smaller crowns than shade species. Gap species are more prevalent in open
forests in Amazonia, while shade species are more prevalent in dense forests.
The variation of vegetation structure at the meso scale (i.e. over geographical distances
of 1 - 103 km) and the concurrent changes of tree form are adaptations to the physical,
chemical and ecological conditions of each site (Rozendaal et al., 2006). In this sense, the
results in this chapter (Figure 1 and Table 2) agree with recent models showing that plant
length, diameter, and mass scaling relationships are flexible -- that is, they can vary across
species due to species-specific differences in biomass partitioning patterns and ecological

77
responses to different environmental conditions (Muller-Landau et al., 2006; Niklas and
Spatz, 2004). However, knowledge is limited of the main factors affecting allometric
relationships in tropical forest under different environmental conditions (Malhi et al., 2006).
Recent universal scaling models have linked constraining functional traits related to
water and biomass growth with plant size, architecture and allometry (Meinzer, 2003; Niklas
and Enquist, 2001; Niklas and Spatz, 2004; West et al., 1999). For example, it is expected that
tree height per unit basal area would be reduced with increasing dry-season length (Malhi et
al., 2006; Meinzer, 2003; Meinzer et al., 2001). Because of this, trees will be shorter at any
given stem diameter in dry seasonal tropical forest. This may contribute to the lower total
height of trees in undisturbed forests in southern Amazonia, where the majority of collection
sites in this study have a slightly longer dry period (monthly precipitation < 100 mm) than the
dense forest in the central Amazon (Brazil, ANA, 2006).
Southern Amazon forests with their longer dry-season are also expected to have more
abundant lianas (which cause crown damage and probably lower tree height). More lianas are
expected because lianas may compete better for access to water throughout the dry season
(Mascaro et al., 2004; Restom and Nepstad, 2004) and because light intensity increases below
seasonally deciduous tree canopies (Gentry, 1991; Rice et al., 2004). Bamboo-dominated
Amazon forests may be associated with both drier climate and substrate. At the peak of the
dry season in eastern Acre state, climbing Guadua remains evergreen at a time when many
tree species drop their leaves. Guadua may therefore have a competitive advantage in areas
with long dry seasons. Within Amazonia, dense populations of climbing Guadua mixed in the
forest are largely restricted to a lowland terra firme landscape peculiar to the headwaters of
the muddy Purus and Juruá Rivers. Here modest tectonic uplift and mechanical erosion have
exposed seasonally impermeable 2:1 clays rich in cations (Nelson et al., 2006).
While some previous basin-wide estimates of Amazon carbon stocks have made a
correction for wood-density, no adjustments have been made for variation in allometric
differences such as tree height or crown damage (Baker et al., 2004; Malhi et al., 2006).
Available allometric equations for biomass estimates in tropical forest input tree height and
wood density as independent variables (Brown et al., 1989; Overman et al., 1994). No models
exist that have been validated using tree-biomass data obtained directly from destructive-
harvest experiments conducted in southwestern or southern Amazonian forests. Comparing
prior biomass estimates from allometric equations with the results of the present study
78
suggests that biomass and carbon stocks have been overestimated for southern Amazonia (e.g.
Alves et al., 1997; Feldspausch et al., 2005). Some estimates of tree biomass within the
Amazonian ‘arc of deforestation’ (Cummings et al., 2002) and at open-forest sites where
lianas are a dominant life form (Gerwing and Farias, 2000) have employed allometric
relationships designed for dense Amazon forest on infertile soils. These may therefore
overestimate above-ground tree biomass and greenhouse-gas emissions in this part of
Amazonia where most deforestation is taking place. Brazil’s National Communication under
the United Nations Framework Convention on Climate Change (Brazil, MCT, 2004) estimates
biomass throughout Brazilian Amazonia based on central-Amazonian allometry by Higuchi et
al. (1998) applied to tree diameter data from RadamBrasil surveys without correction for
either density or tree height.
In spite of recent studies reporting spatial variation in wood density for Amazonia
(Baker et al. 2004; Chave et al., 2006; Nogueira et al., 2007), the main environmental factor
that explains spatial variation in wood density is still unclear. Environmental and wood-
density differences between southern, southwestern and central Amazonia have been
discussed by recent studies (Baker et al., 2004; Malhi et al., 2006; Nogueira et al., 2007).
Generally, the main causes suggested to explain the lower stand wood density in southwestern
and southern Amazonian forests are related to the floristic composition, succession dynamics,
edaphic factors and physiological water-use principles. The relationship between wood-
density variation and environmental factors has been particularly difficult to assess due to a
variety of studies having used different sampling methods (Fearnside, 1997; Nogueira et al.,
2005, 2007). The results of this study suggest that the plastic responses of trees to
environmental changes are more intense for wood density than for tree height. Assuming that
growth rate is inversely proportional to wood density (Enquist et al., 1999; King et al., 2005;
Muller-Landau, 2004), the plastic response and hence the resources allocated to tree height
will be at least partially dependent on wood-density traits. The effect of environmental
conditions on tree height will therefore be weaker than their effect on wood density. As the
forests in southern Amazonia are more dynamic than those in central Amazonia (Malhi et al.,
2006), shorter trees are logical to expect in spite of lower wood density.
79
Conclusions
In the southwestern Amazon bamboo-dominated forest, southwestern Amazon dense
forest and southern Amazon open forest the trees are shorter than in dense forest in the central
Amazon. The height difference was greatest for small trees. Generally the 2/3 scaling
exponent predicted by metabolic ecology theory was violated by large trees in the four
Amazonian forests studied. When the Higuchi et al. (1998) equation (which was developed
for use in dense forests) is applied to biomass estimates in open forests of south and
southwestern Amazonia, the results have to be corrected for tree-height and wood density
effects. Together, the two effects represent reductions totaling 39% in southwestern Amazon
bamboo-dominated open forest, 22% in southwestern Amazon bamboo-free dense forest and
16% in southern Amazonian open forest (respectively, 76, 65 and 45 Mg ha-1 lower dry
biomass than dense forest in the central Amazon). Considering only the height effect,
estimated biomass is lowered by 21.5, 18.5 and 10.3 Mg ha-1, respectively, in the
southwestern Amazon bamboo-dominated forest, southwestern Amazon dense forest and
southern Amazon open forest. Revisions are needed in the estimates of biomass that have
been made using allometric equations developed in dense forest in the central Amazon. This
implies lower emissions of greenhouse gases than previously thought for deforestation in
Brazilian Amazonia, which is concentrated in the “arc of deforestation” in non-dense forest
types such as the ones studied here.

Chapter IV - Estimates of forest biomass in the Brazilian
Amazon: New allometric equations and adjustments to biomass
from wood-volume inventories4
Abstract Uncertainties in biomass estimates in Amazonian forests result in a broad range of
possible magnitude for the emissions of carbon from deforestation and other land-use changes. This chapter presents biomass equations developed from trees directly weighed in open forest on fertile soils in the southern Amazon (SA) and allometric equations for bole volume estimates of trees in both dense and open forests. Biomass estimates were obtained from these new equations and used them to improve the commonly used biomass models based on large-scale wood-volume inventories carried out in Amazonian forest. The biomass estimates from the SA allometric equation indicate that equations developed in forests on infertile soils in central Amazonia (CA) result in overestimates if applied to trees in the open forests of SA. All above-ground components of 267 trees in open forests of SA were cut and weighed, and it was found that the proportion of the biomass stored in the crowns of trees in open forest is higher than it is in dense-forest. For wood-volume estimates bole equations were shown to be an alternative way to avoid errors in bole volume due to height estimates, tapering and indentations or hollow trunks. In the case of inventoried wood volume corrections were applied for indentations and hollow trunks and determined that no adjustment is needed for the form factor used in the RadamBrasil volume formula. New values are suggested for use in models to convert wood volume to biomass estimates. A biomass map for Brazilian Amazonia was produced from 2860 plots inventoried by the RadamBrasil Project incorporating all corrections for wood density and wood volume and in factors used to add the bole volume of small trees and the crown biomass. The average biomass values estimated from large-scale inventories of wood volume showed reasonable agreement with biomass estimated by allometric equations. Considering all adjustments the biomass map indicates average biomass of 125.4 Pg (=1015 g) dry weight (above-ground + below-ground) for originally forested areas in the Brazilian Legal Amazon as a whole (104.2 Pg for above-ground only) at the time of the RadamBrasil inventories, which were carried out before intensive deforestation had occurred in the region. Savannas and other non-forest vegetation are excluded from the estimate. If areas deforested through 2006 are eliminated, excluding agriculture, pasture and secondary forest vegetation, the estimation of dry biomass storage was reduced to 113.3 and 94.2 Pg (above-ground + below-ground and only above–ground). Thus, at the present time the carbon storage in forested areas in Brazilian Amazonia as a whole will be around 55 Pg (assuming 1 Mg dry biomass = 0.485 Mg C). It is provide the biomass estimated by forest type (aggregated into 15 vegetation classes) for each state in the Brazilian Legal Amazon. Keywords: Allometric equations, Amazon forest; Biomass estimates; Carbon flux; Global warming; Wood volume.
4 Written according to the norms of the journal Forest Ecology and Management.
81
Introduction
The Amazon forest is a huge and dynamic reservoir of carbon which may be gradually
released to the atmosphere through the combined action of deforestation and soil carbon loss
due to land-use change and the impact climate change (Cox et al., 2000, 2004; Houghton,
2005; IPCC, 2007; Malhi et al., 2006; Nepstad et al., 1999). Because the carbon stocks are
uncertain (Eva et al., 2003; Fearnside and Laurance, 2003; Houghton et al., 2001), the range
of possible emissions of carbon from tropical deforestation and degradation is broader than
commonly thought (Houghton, 2005). Estimates of the biomass storage are discordant when
the same method is applied or when estimates from allometric equations are compared with
biomass obtained from large-scale wood-volume inventories (Houghton et al., 2001; Malhi et
al., 2006).
In Amazonian forests, data from large-scale volume inventories (Brazil, Projeto
RadamBrasil, 1973-1983) have been used as the principal basis for estimating biomass and
greenhouse-gas emissions from deforestation (Fearnside, 2000b; Houghton et al., 2001).
Although uncertainties are inherent at forest-inventory data sampled over extensive areas,
these datasets have been preferred for biomass estimation over allometric equations because
the inventories are believed to be only data base that can be used for estimating forest biomass
at the landscape level because they were collected at the scale of the problem (Brown et al.,
1989; Brown and Lugo, 1992). On the other hand, large-scale spatial representativeness is the
crucial disadvantage of the allometric models that are developed from a small number of
directly harvested trees, but these models have the advantage of being easily applied to a large
area for estimating tree biomass (Baker et al., 2004; Chave et al., 2005; Malhi et al., 2006). In
spite of seldom being tested directly, allometric equations represent a necessary method for
evaluating long-term forest inventories and the magnitude of carbon fluxes between
aboveground forest ecosystems and the atmosphere (Chave et al., 2005; Grace, 2004). In
addition, it is suggested in this study that directly weighed trees in small-scale samples in
specific forest types can be useful for improving values used in models for biomass estimates
based on wood-volume data from large-scale inventories.
The uncertainties in the biomass estimates from RadamBrasil volume data (Brazil,
Projeto RadamBrasil, 1973-1983) are due to errors in the original wood volume estimates and
subsequent conversion to biomass (Brown et al., 1995). In the volume estimates the
uncertainties could be (i) in the measurements of basal area because of irregularly shaped or
hollow boles (Nogueira et al., 2006; Sheil, 1995), (ii) in the values for commercial height
estimated “by eye” without direct measurements, and (iii) due to a single mean form factor

82
being used for all tree sizes and forest types. The mean tapering (form factor) adopted in the
volume estimates was 0.7 for trees with bark and circumference ≥ 100 cm, including all
species independent of forest type, diameter class or the length of the bole (Brazil,
RadamBrasil Project, 1973-1983; Heinsdijk, 1958; Pitt, 1961, p. 20). Any uncertainties in the
bole-volume estimates imply proportionate uncertainties in biomass and carbon emission
estimates.
The usual model for Amazonian forest biomass estimates was developed as an
alternative way to use datasets on bole volume available from large-scale inventories across
Amazonia (see Brown et al., 1989; Brown and Lugo, 1992; Houghton et al., 2001). The bole
volume is converted to biomass from wood-density data, together with a ‘volume expansion
factor’ for addition of the volume of small trees (generally 10 to 30 cm stem diameter), and a
‘biomass expansion factor’ for addition crown biomass. The model allowing the biomass to
be obtained for all trees with boles ≥ 10 cm in diameter at breast height. Although recent
studies on wood density have reduced uncertainties in conversions of bole volume to biomass
of the bole, particularly in areas undergoing deforestation (Nogueira et al., 2007),
uncertainties still remain in converting bole volume to tree biomass. Basically this is due at
factors that add the bole volume of uninventoried small trees and the biomass of the crowns.
This chapter seeks to join the two main methods of biomass estimation --allometric
equations and inventoried wood volume -- in order to adjust the biomass estimates for
Amazonian forests. A new biomass equation is developed from trees harvested on fertile soils
in the southern Amazon and two new bole-volume equations are developed from trees in
dense and open forests. These allometric relationships are used to assess uncertainties in
previous wood-volume and biomass estimates. In the case of the usual biomass model, based
on inventoried wood volume, the study evaluated whether the factors currently used to add the
bole volume of small trees (volume expansion factor) and the crown biomass (biomass
expansion factor) are adequate for the biomass conversion. Finally, all corrections were
applied to generate a new biomass map for forests in Brazilian Amazonia from RadamBrasil
plots, and the biomass stocks by forest type were calculated for each of the nine states in the
Brazilian Legal Amazon.
Materials and Methods
Study sites
Details of the study area in central Amazonia (CA) are described in Nogueira et al.
(2005). Except for data from a site located in Carlinda County, the other sites in southern

83
Amazonia (SA) are described by Nogueira et al. (2007). In CA sites the vegetation is
characterized as being dense ombrophilous forest of terra firme (land that is not seasonally
flooded), on nutrient-poor yellow latosol (Magnago et al., 1978; Yamazaki et al., 1978). In
SA sites the vegetation was described as open forest, including the Carlinda site in the
northwestern portion of Mato Grosso state. Except for the Carlinda site, where evidence of
previous disturbance was observed, all other plots were in primary forest, without invasion of
pioneer trees or mortality associated with edges. The dataset sampled at the Carlinda site was
not used in biomass equations, only being used in tapering and bole volume equations. All
trees were felled randomly after authorization by the Brazilian Institute for the Environment
and Renewable Natural Resources (IBAMA). For CA an inventory of 72 ha (de Castilho et
al., 2006) was used to adjust the felled samples to a more representative size-class distribution
in 5-cm dbh intervals. In SA an inventory of the 11 ha was used for trees ≥ 10 cm dbh
(Feldpausch et al., 2005) and an inventory of 30 ha was used for trees 5 to 10 cm dbh (Pereira,
2005).
Data collection
In CA, trees (n = 302; dbh or just above any buttresses = 5 to 106 cm) were collected
in six different locations distributed over an area of 45 km2. Approximately 50 trees per site
were sampled in plots measuring 30 × 30 m. In SA, trees were collected (n = 300; dbh or just
above any buttresses = 5 to 124 cm) in four counties: 30 trees in Juruena (2 sites), 149 trees in
Cotriguaçu (1 site), 56 trees in Carlinda (1 site) and 65 trees in Novo Progresso (1 site).
Collection sites were located at least 100 m from the nearest forest edge. Botanical samples of
all trees were collected and identified by parabotanists who are employees of the herbarium of
the National Institute for Research in the Amazon - INPA. A total of 186 species or morpho-
species were identified at the sites in CA and 155 in SA.
In both CA and SA regions, disks of constant thickness (~3 cm) were collected after
felling from all trees at breast height and at the top of the bole (at the height of the first thick
branch), using a chain-saw. For all trees a tape was used to measure total height, height of the
bole and circumference at the location where each sample disk was taken. The measurements
at breast height were made 1.36 m above the ground at the CA sites and 1.30 m at the SA
sites, or just above any buttresses. Each disk was drawn on a poster-board panel by tracing the
perimeter and, in cases with hollow trunks, the internal details. The drawings were
photographed at a known distance, with the camera placed at a right angle in both the vertical
and horizontal planes. The camera, with an 80-mm telephoto lens, was placed at a distance
84
chosen to minimize the curvature in the photographed plane. A rectangle with known
dimensions was drawn on the panels in order to allow corrections for possible distortions in
the procedure and also to determine the scale of the digital image (the area of each pixel).
The area of each disk was calculated in pixels using Adobe Photoshop software and
was later converted to square centimeters. The bole volume of each tree, corrected for
indentations and hollow trunks, was calculated using the Smalian formula (Loetsch et al.,
1973): {(Asi + Asf) / 2} × h; where Asi = area of the cross section at breast height, Asf = area
of the cross section at the top of the bole; and h = height of the commercial bole. The Smalian
formula was applied after correcting the biometric measurements of the sampled trees for the
effect of irregular and hollow boles. This is hereafter referred to in this study as the
“corrected” volume and is equivalent to the volume that would be obtained by applying the
Smalian formula to uncorrected data and then correcting the result for irregular and hollow
trunks.
Weighing trees
At the SA sites, 264 trees (5 to 124 cm dbh or above buttresses) were directly
harvested and the fresh mass of each tree weighed fully. The bole was cut at the lowest height
possible using a chainsaw, which was also used to cut off parts of the bole and the branches in
the crown. For large or medium-sized trees a plastic sheet was placed on the ground under the
point where the bole or thick branches were cut in order to collect the sawdust, which was
also weighed. With the exception of the stump, the entire tree was cut into appropriately sized
pieces and weighed using a balance with 200 Kg capacity. The fresh mass of the six boles of
large trees harvested in the Rohsamar farm (Juruena County) were obtained using a different
method: each bole was placed on a truck as an intact log, and the loaded truck was driven onto
a scale designed for weighing loaded vehicles (capacity >60 metric tons). The crowns these
trees were directly weighed in the field using the same balance (200 Kg capacity) used for the
other trees. In this study, the crown was considered to be all components above of the top of
the commercial bole, weighed together: branches, twigs, leaves, flowers and fruits. In order to
obtain the dry mass of the bole, the fresh mass was multiplied by the moisture content (Mc) of
the bole of each tree. The mean Mc (0.416 ± 0.068) was used for trees that had no Mc mean of
the bole (Nogueira et al., submitted). The Mc of the crown was not measured, but rather
estimated using data from the literature. Higuchi et al. (1998) report 42% for moisture in the
crown, obtained from 38 trees in central Amazonia (CA). In a recent study, da Silva (2007)
reports Mc for roots, boles, branches and leaves obtained from 128 trees, also sampled in CA.
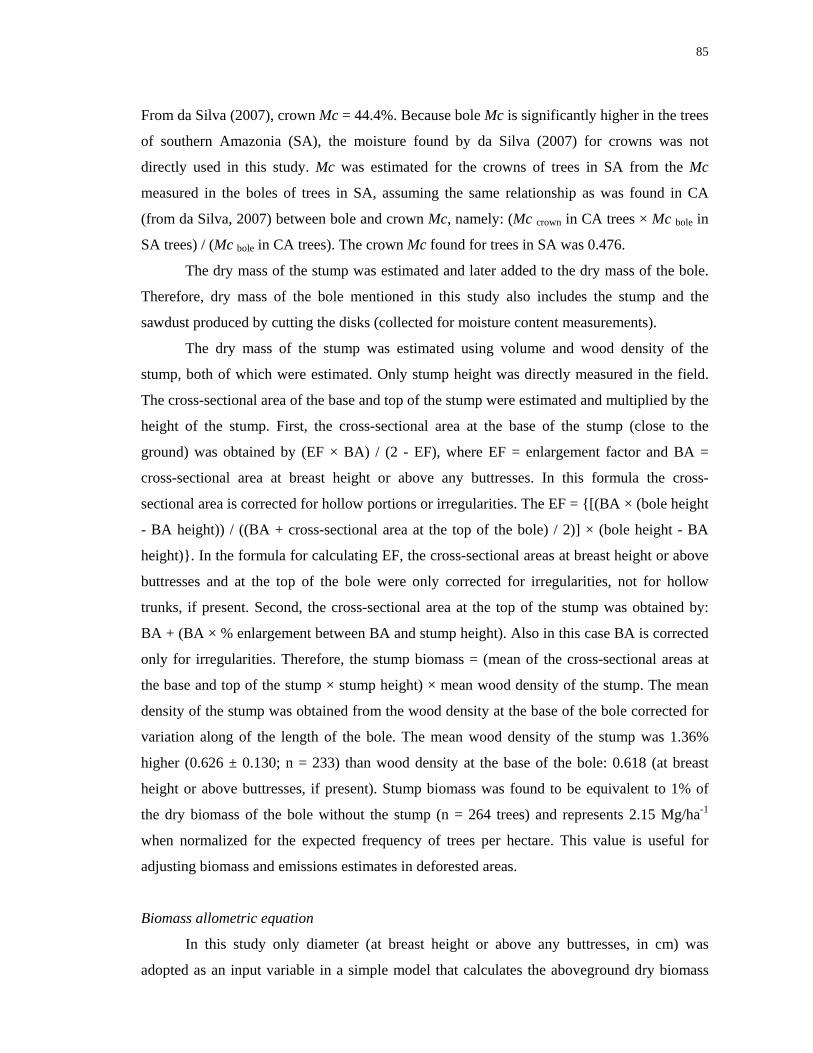
85
From da Silva (2007), crown Mc = 44.4%. Because bole Mc is significantly higher in the trees
of southern Amazonia (SA), the moisture found by da Silva (2007) for crowns was not
directly used in this study. Mc was estimated for the crowns of trees in SA from the Mc
measured in the boles of trees in SA, assuming the same relationship as was found in CA
(from da Silva, 2007) between bole and crown Mc, namely: (Mc crown in CA trees × Mc bole in
SA trees) / (Mc bole in CA trees). The crown Mc found for trees in SA was 0.476.
The dry mass of the stump was estimated and later added to the dry mass of the bole.
Therefore, dry mass of the bole mentioned in this study also includes the stump and the
sawdust produced by cutting the disks (collected for moisture content measurements).
The dry mass of the stump was estimated using volume and wood density of the
stump, both of which were estimated. Only stump height was directly measured in the field.
The cross-sectional area of the base and top of the stump were estimated and multiplied by the
height of the stump. First, the cross-sectional area at the base of the stump (close to the
ground) was obtained by (EF × BA) / (2 - EF), where EF = enlargement factor and BA =
cross-sectional area at breast height or above any buttresses. In this formula the cross-
sectional area is corrected for hollow portions or irregularities. The EF = {[(BA × (bole height
- BA height)) / ((BA + cross-sectional area at the top of the bole) / 2)] × (bole height - BA
height)}. In the formula for calculating EF, the cross-sectional areas at breast height or above
buttresses and at the top of the bole were only corrected for irregularities, not for hollow
trunks, if present. Second, the cross-sectional area at the top of the stump was obtained by:
BA + (BA × % enlargement between BA and stump height). Also in this case BA is corrected
only for irregularities. Therefore, the stump biomass = (mean of the cross-sectional areas at
the base and top of the stump × stump height) × mean wood density of the stump. The mean
density of the stump was obtained from the wood density at the base of the bole corrected for
variation along of the length of the bole. The mean wood density of the stump was 1.36%
higher (0.626 ± 0.130; n = 233) than wood density at the base of the bole: 0.618 (at breast
height or above buttresses, if present). Stump biomass was found to be equivalent to 1% of
the dry biomass of the bole without the stump (n = 264 trees) and represents 2.15 Mg/ha-1
when normalized for the expected frequency of trees per hectare. This value is useful for
adjusting biomass and emissions estimates in deforested areas.
Biomass allometric equation
In this study only diameter (at breast height or above any buttresses, in cm) was
adopted as an input variable in a simple model that calculates the aboveground dry biomass

86
(in Kg). Although it is possible to obtain an appropriate regression model from accurately
measured heights and wood densities of trees in this study, the use of a model with height or
density as additional parameters can become inaccurate due to the practical difficulty of
obtaining unbiased height or density measurements for large areas (Brown et al., 1995;
Overman et al., 1994). The priority was to obtain an accurate fit from an equation with only
diameter as an independent variable, in order to increase its practical usefulness. In addition,
sufficient previously published models exist that include height and wood density. The
accuracy of previous models is only discussed here for studies that include diameter, height
and wood density together (Brown, 1997; Chave et al., 2005; Higuchi et al., 1998; Overman
et al., 1994).
Dry mass and diameter were log transformed to satisfy the least-squares procedure
(general linear regression), which assumes that the residuals are normally distributed, that the
dependent variable is homogeneously distributed across independent variables, that
relationships are linear, that the effects of the factors are additive and that there is no random
error in the measurements of the independent variables (Magnusson and Mourão, 2005). The
studentized residuals were plotted against leverage and Cook´s distance calculated for
identification of outliers. Cook’s distance measures the influence of each sample observation
on the coefficient estimates (Cook and Weisberg, 1982; Wilkinson, 1990).
The statistical criteria used in selecting the best equation were: high adjusted r2, to
allowing comparison with published allometric equations that include different numbers of
variables (André et al., 2000), the standardized distribution of residuals and a lower standard
error of the estimate. The standard error of the estimate (SEE) refers to √Mean Standard Error
(MSE) (Neter and Wasserman, 1974). The following measurements were observed for each
variable: regression coefficient, standard error of the coefficient, standardized coefficient,
tolerance, and a t statistic for measuring the usefulness of the variable in the equation.
Assessing the performance of the equations developed in this study as compared to
previously published models was based on the deviation (%) between sum of mass of trees
directly measured and the mass as estimated by each of the previous equations; both for
sampled trees and as an extrapolation per hectare.
Bole volume equations for trees in dense and open forest
Starting from volumes of the boles corrected for indentations and hollow trunks
(dependent variable), and conventional diameter measured as dbh or just above any buttresses
(input variable), bole allometric equations were developed for dense and open forest types. In

87
the select bole equations the same statistical criterion was adopted as mentioned above for
biomass equations.
Form factor: mean tapering of the bole for trees in dense and open forest
The form factor was calculated as the ratio between the “corrected” volume of the bole
and the volume of the bole if the trunk is assumed to be a cylinder, according to the formula:
ff = {((Asic + Asfc) / 2) × h} / (Asin × h); where: Asic = corrected area of the cross section at
breast height, Asfc = corrected area of the cross section at the top of the bole; and h = height
of the commercial bole. This was done so that it would be possible to compare the results with
those obtained with the form factor used by the RadamBrasil Project: the variable "Asin" in
the denominator of the formula for form factor was not corrected for the effect of indentations
and hollow trunks. The form factor was obtained in this way for each tree.
For biomass estimates of Amazonian forests previous studies have used a single mean
form factor for the whole of Amazonia, independent of forest type. In this chapter, the mean
tapering of boles was analyzed considering forest type, reflecting differences in canopy
structure and in the density of the stem. Subsequently, the mean form factor was calculated
adjusting the felled samples to the distribution of tree diameters in each forest type.
Volume expansion factor (VEF): addition of the bole volume of trees with dbh 10 to 31.7 cm
The VEF reported in this study follows the definition of Brown (1997): ratio of
inventoried volume for all trees with a minimum diameter ≥10 cm to inventory volume for all
trees with a minimum diameter, in this study stems ≥31.8 cm in diameter. The VEF was
obtained from “corrected” bole volume and therefore does not have an overestimate due to
indentations and hollow trunks. It should be stressed that the VEF values reported in this
study include trees between 10 and 31.7 cm stem diameter, which could contrast with
previous VEF values that did not include trees 25-31.7 or 30-31.7 cm stem diameter (Brown
and Lugo, 1992; Brown, 1997). The trees sampled in dense and open forest types were also
normalized by the distribution of diameter classes and the proportional volume in the size
classes from 10 to 31.7 cm diameter was obtained based on the total bole volume inventoried
per hectare for trees ≥31.8 cm stem diameter (see item 2.1 for details of inventories).
Biomass expansion factor (BEF): addition of crown biomass to inventoried bole volume
In dense forest in CA the BEF reported in this study was obtained from the ratio of
biomass of the trees to the bole biomass. The tree’s biomass was estimated using a model
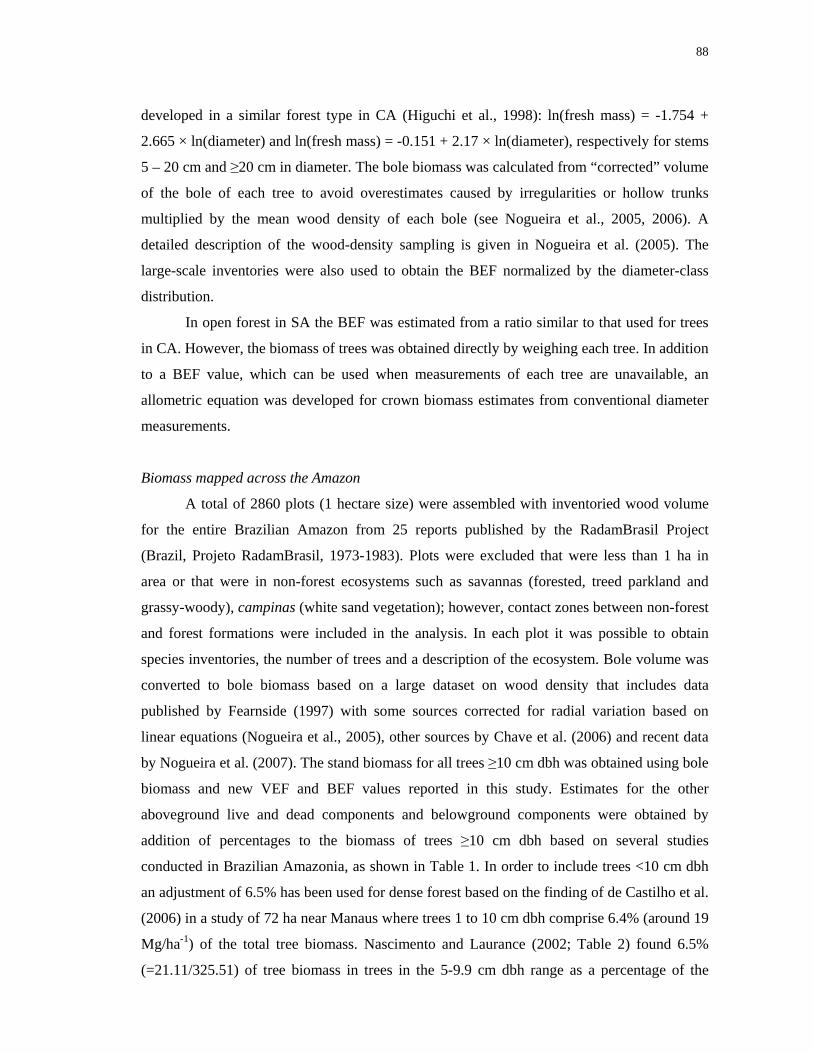
88
developed in a similar forest type in CA (Higuchi et al., 1998): ln(fresh mass) = -1.754 +
2.665 × ln(diameter) and ln(fresh mass) = -0.151 + 2.17 × ln(diameter), respectively for stems
5 – 20 cm and ≥20 cm in diameter. The bole biomass was calculated from “corrected” volume
of the bole of each tree to avoid overestimates caused by irregularities or hollow trunks
multiplied by the mean wood density of each bole (see Nogueira et al., 2005, 2006). A
detailed description of the wood-density sampling is given in Nogueira et al. (2005). The
large-scale inventories were also used to obtain the BEF normalized by the diameter-class
distribution.
In open forest in SA the BEF was estimated from a ratio similar to that used for trees
in CA. However, the biomass of trees was obtained directly by weighing each tree. In addition
to a BEF value, which can be used when measurements of each tree are unavailable, an
allometric equation was developed for crown biomass estimates from conventional diameter
measurements.
Biomass mapped across the Amazon
A total of 2860 plots (1 hectare size) were assembled with inventoried wood volume
for the entire Brazilian Amazon from 25 reports published by the RadamBrasil Project
(Brazil, Projeto RadamBrasil, 1973-1983). Plots were excluded that were less than 1 ha in
area or that were in non-forest ecosystems such as savannas (forested, treed parkland and
grassy-woody), campinas (white sand vegetation); however, contact zones between non-forest
and forest formations were included in the analysis. In each plot it was possible to obtain
species inventories, the number of trees and a description of the ecosystem. Bole volume was
converted to bole biomass based on a large dataset on wood density that includes data
published by Fearnside (1997) with some sources corrected for radial variation based on
linear equations (Nogueira et al., 2005), other sources by Chave et al. (2006) and recent data
by Nogueira et al. (2007). The stand biomass for all trees ≥10 cm dbh was obtained using bole
biomass and new VEF and BEF values reported in this study. Estimates for the other
aboveground live and dead components and belowground components were obtained by
addition of percentages to the biomass of trees ≥10 cm dbh based on several studies
conducted in Brazilian Amazonia, as shown in Table 1. In order to include trees <10 cm dbh
an adjustment of 6.5% has been used for dense forest based on the finding of de Castilho et al.
(2006) in a study of 72 ha near Manaus where trees 1 to 10 cm dbh comprise 6.4% (around 19
Mg/ha-1) of the total tree biomass. Nascimento and Laurance (2002; Table 2) found 6.5%
(=21.11/325.51) of tree biomass in trees in the 5-9.9 cm dbh range as a percentage of the

89
biomass of trees ≥10 cm dbh. In open forest this percentage is expected to be lower due to the
smaller number of young trees as compared to dense forest. Based on 30 ha inventoried in the
southwest Amazon (Pereira et al., 2005) there are 102.5 ± 24.5 trees/ha 5-10 cm dbh, while in
central Amazonia there are around 715 trees/ha (de Castilho et al., 2006). A value of 4% was
used as the mean for non-dense forest to add the biomass of all trees 1-10 cm dbh (Table 1).
For the biomass of palms 1.9% was added in dense forests and 8.6% for non-dense forests,
see Table 1. For vines 3.1% was used for both dense and open forest, based on several studies
across in the Amazon (Table 1). For adding dead aboveground biomass a value of 13.7% is
used for both dense and non-dense forests (Table 1). Also, 0.21% was added for other non-
tree forest components, according to Fearnside (1997, 2000). Finally, for belowground
biomass a value of 25.8% was used for all forest types (Table 1). In this study corrections
were not included for trees 30-31.7 cm dbh because the VEF values reported here include this
gap. Corrections are also not included for bark in wood density values, because linear
equations were used for radial variation correction.

90
Table 1. Measurements of forest biomass and non-tree components from studies conducted in Brazilian Amazonia (dry weight in Mg/ha-1 and % relative to stand biomass of trees ≥10 cm dbh).
Forest State Biomass all
trees ≥10 cm
Palms % Vines % Under-story;
seedlings (wood+ leaves)
% Dead wood (fallen + standing)
% Litter/Root mat* % Below-
ground % Source Notes
Dense Amazonas 7.3 Klinge and Rodrigues (1968) (01)
Amazonas 357.0 23.0 6.4 25.8 7.2 7.2 2.0 115.8 32.4 Klinge et al. (1975); Klinge and Rodrigues (1973) (02)
Pará 9.9 Klinge (1977) Amazonas 6.4 Franken et al. (1979) Pará 7.3 Silva and Lobo (1982) Pará 392.6 5.0 1.3 3.5 0.9 9.6 2.4 7.1 1.8 18.2 4.6 103.5 26.4 Russel (1983) (03) Pará 6.7 Silva (1984) Rondônia 387.9 4.6 1.2 13.0 3.3 1.7 0.4 15.5 4.0 Revilla Cardenas (1986) (04) Pará 186.1 2.8 1.5 5.6 3.0 11.2 6.0 11.6 6.2 Revilla Cardenas (1987) (05) Pará 297.4 9.7 3.3 9.6 3.2 12.3 4.1 10.5 3.5 Revilla Cardenas (1988) (06) Pará 198.3 9.0 4.5 9.2 4.6 8.9 4.5 13.7 6.9 Revilla Cardenas (1988) (07) Amazonas 7.8 Luizão (1989) (08) Pará 8.0 Dantas and Phillipson (1989) Amazonas 244.0 8.1 3.3 12.0 4.9 9.0 3.7 Fearnside et al. (1993) Amazonas 6.5 Luizão (1995) Roraima 9.2 Barbosa and Fearnside (1996) Amazonas 29.7 Summers (1998) (09) Roraima 8.5 Villela and Proctor (1999) (10) Pará 10.6 32.2 Fearnside et al. (1999) Amazonas 325.5 3.5 1.1 10.8 3.3 Fearnside et al. (2001) (11) Amazonas 325.5 1.3 0.4 8.3 2.5 21.1 6.5 31.0 9.5 10.5 3.2 Nascimento and Laurance (2002) (12)
Rondônia/ Amazonas 306.8 16.6 5.4 0.6 0.2 14.0 4.6 30.5 9.9 8.3 2.7 Cummings et al. (2002) (13)
Pará 258.0 35.0 13.6 16.0 6.2 55.0 21.3 Gerwing (2002) (14) Pará 287.4 96.1 33.4 Rice et al. (2004) (15) Pará 58.4 Keller et al. (2004) (16) Pará 63.5 Keller et al. (2004) (17) Amazonas 5.9 Luizão et al. (2004) (18) Amazonas 5.8 Monteiro (2005) Amazonas 306.1 2.1 0.7 19.5 6.4 de Castilho et al. (2006) (19) Amazonas 306.1 6.3 2.1 Nogueira (2006) (20) Amazonas 306.1 2.3 1.8 2.9 104.9 34.3 da Silva (2007) (21) Pará 58.4 Palace et al. (2007) (22)

91
Non-dense Pará 126.1 2.9 2.3 6.0 4.8 7.5 5.9 13.1 10.4 Revilla Cardenas (1986) (23)
Rondônia 362.5 10.8 3.0 2.6 0.7 5.5 1.5 16.0 4.4 Revilla Cardenas (1987) (24) Rondônia 303.0 27.0 8.9 10.0 3.3 Martinelli et al. (1988) Roraima 5.8 4.6 Scott et al. (1992) Acre 320.0 12.8 4.0 35.0 10.9 38.0 11.9 32.0 10.0 Brown et al. (1992) (25) Rondônia 285.0 34.5 12.1 10.0 3.5 Brown et al. (1995) (26) Rondônia 239.4 21.6 9.0 11.9 5.0 9.7 4.1 Graça et al. (1999) (27)
Rondônia/ Amazonas 239.4 17.5 7.3 0.5 0.2 14.1 5.9 32.4 13.5 10.1 4.2 Cummings et al. (2002) (28)
Mato Grosso 38.8 Pauletto (2006) (29) Mato Grosso 50.2 Palace et al. (2007) (30)
Rondônia/ Amazonas 270.1 37.9 14.0 0.6 0.2 11.4 4.2 20.8 7.7 9.5 3.5 Cummings et al. (2002) (31)
Mato Grosso/ Pará 253.8 3.1 This study (32)
All data 286.8 12.9 4.6 10.0 3.1 11.0 4.2 29.6 8.8 10.5 4.9 89.0 25.8 Dense 299.0 6.5 1.9 11.8 3.4 13.1 4.3 33.4 9.4 9.2 4.1 108.1 31.0 Non-dense 266.6 22.5 8.6 5.3 2.1 7.4 3.9 24.3 8.1 13.9 5.9 32.0 10.0 Notes: * Some of the results reported refer to the annual production of litter, which can differ from the stock per unit area. (1): Averages of the years 1963 and 1964; (2): Dry weight for lianas was obtained assuming 50% of the fresh weight (see Klinge et al. 1975, Table 9-1). The fresh weight of the roots (255 Mg ha-1) given by Klinge et al. (1975) was converted to dry mass assuming 45.4% humidity, based on the results of da Silva (2007); (3): Vegetation described by the author as submontane broadleaf dense. The biomass of trees ≥10 cm dbh was calculated starting from Table 3.3, year 1982. In the same way, the mean biomass was estimated for trees < 10 cm (9.35) which were added to broadleaved herbs (0.26) mentioned in Table 3.4; (4), (5), (7), (23), (24): the litter and the root mat were added together; (6): From Fearnside et al. (1993); (8), (10): Average of the sites studied by the authors; (9): These estimates only refer to coarse woody litter ≥20 cm dbh (p. 37); (11): The value used for the biomass of trees ≥ 10 cm dbh was that used by Nascimento and Laurance (2002); (12): The biomass of palms does not include individuals ≥10 cm dbh, which accounts for less than 1% of the stems ≥ 10 cm dbh (p. 312); (12), (13), (28), (31): the lianas biomass was esteemed by the equation of Putz (1983). The values for understory include the seedlings + trees < 10 cm dbh; (14): For the estimate of biomass of trees (≥10 cm) the equation of Overman et al. (1994) was used.and for the lianas biomass the equation of Gerwing and Farias (2000) was used; (15): Rice et al., 2004 report 48 Mg C ha-1 and not the biomass ha-1. This was converted to biomass considering our wood density and 50% C content for biomass (see Table 3). The equation of Chambers et al. (2001) was used for the biomass of trees; (16), (17), (22), (29), (30): Fallen dead woody material with diameter ≥ 2 cm; (18): Averages of the stocks among plateau, slope and valley (Table 3); (3), (16), (17), (26), (29): 15% was added for standing dead trees, based on Palace et al., 2007 (12-17%); Nascimento and Laurance, 2002 (11-14%). Other authors consider a larger percentage, such as 19-20% by Summers, 1998, 18-25% according to Keller et al., 2004; and Rice et al., 2004, and 42-76% according to Delaney et al., 1998; (19): The biomass of trees (excluding palms) ≥10cm = 306.11 Mg ha-1. See Appendix A (325.7 - 6% of the trees (19.5 Mg ha-1) between 1 and 10 cm dbh = 306.11). Palms = 2.1 Mg ha-1. The Higuchi et al. (1998) equation was used for biomass of trees ≥5 cm dbh and palms from Saldarriaga et al. (1988) equation. Trees < 5 cm from the equation by Nascimento and Laurance (2002); (20): Estimates of Nogueira (2006) varied from 6.3, 12.3 and 3.9 in central Amazonia (respectively obtained by the equations of Putz, 1983; Gerwing and Farias, 2000; Gehring et al., 2004). These values vary from 2 to 4% of the biomass of the trees ≥10 cm (= 306.11) estimated by de Castilho et al. (2006). It was adopted 2%, regarding the value obtained using the equation of Putz (1983); (=6.3/306.11); (21): For palms and lianas the same percentage was used as reported by the author for the biomass of the trees ≥5 cm dbh. For the understory the percentage does not include stems 5-10 cm dbh. The fresh weight of the roots reported per hectare was converted to dry biomass assuming 45.4% humidity; calculations were made starting from the information in Table 5.8c, pp. 66, 67. The percentage for roots refers to roots ≥2 mm diameter at the base. The estimate of de Castilho et al. (2006) was used for the biomass of trees ≥10 cm dbh, obtained starting from a similar forest and at large scale (72 ha); (24): Open upland forest on poorly drained terrain ("sandbank" forest); (25): Standing live above-ground biomass was estimated based on equation of Brown et al. (1989). Palms only measured for individuals ≥10 cm dbh, found 4% of the biomass in tree ≥10 cm dbh (Table 1). Belowground biomass obtained from Nepstad (1989), who suggests 10% of tree biomass ≥10 cm. Data for standing dead trunks were obtained from Uhl et al. (1988) in Paragominas, Pará state; (26): Estimate refers to fallen dead trunks and litter; (27): For the biomass of all trees ≥10 cm the values used for calculations were from Cummings et al. (2002) for open forest, because Graça et al. (1999) did not estimate the biomass of the trees with leaves. Also litter data were excluded because they include many leaves that had fallen after the trees were felled and dried; (32): 91 trees with 5-10 cm dbh were completely weighted and replicated for an expected frequency per hectare: 102.5 ± 24.5.
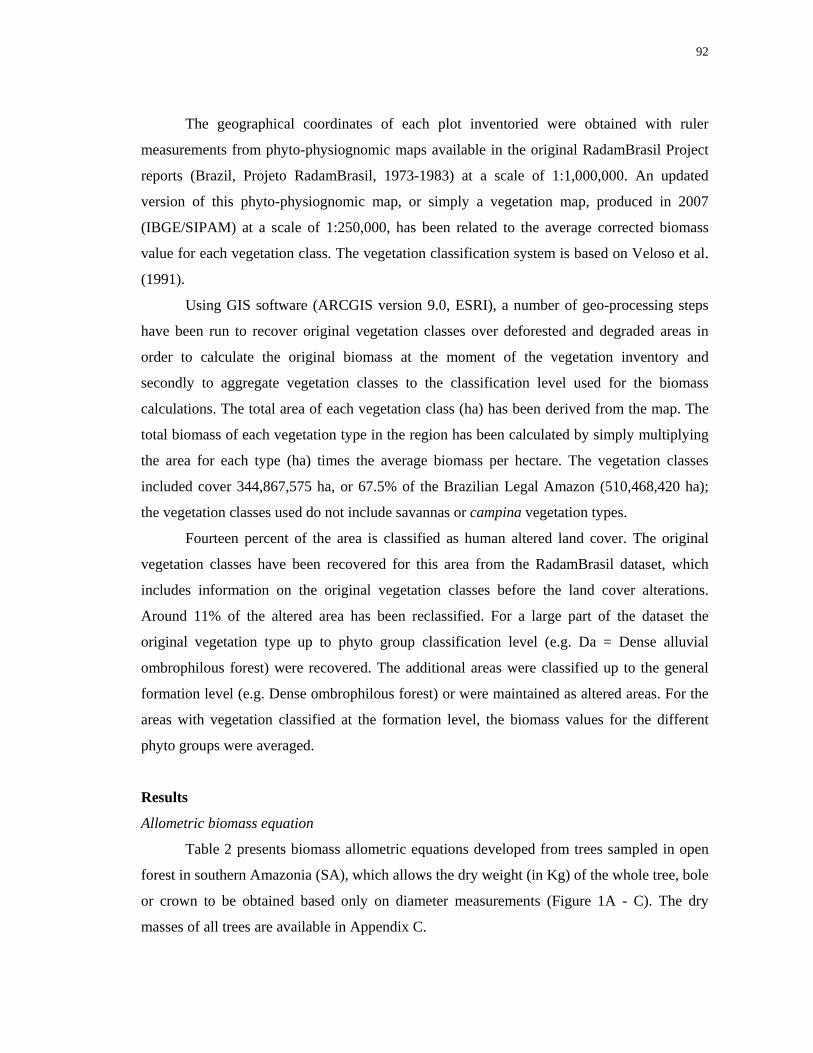
92
The geographical coordinates of each plot inventoried were obtained with ruler
measurements from phyto-physiognomic maps available in the original RadamBrasil Project
reports (Brazil, Projeto RadamBrasil, 1973-1983) at a scale of 1:1,000,000. An updated
version of this phyto-physiognomic map, or simply a vegetation map, produced in 2007
(IBGE/SIPAM) at a scale of 1:250,000, has been related to the average corrected biomass
value for each vegetation class. The vegetation classification system is based on Veloso et al.
(1991).
Using GIS software (ARCGIS version 9.0, ESRI), a number of geo-processing steps
have been run to recover original vegetation classes over deforested and degraded areas in
order to calculate the original biomass at the moment of the vegetation inventory and
secondly to aggregate vegetation classes to the classification level used for the biomass
calculations. The total area of each vegetation class (ha) has been derived from the map. The
total biomass of each vegetation type in the region has been calculated by simply multiplying
the area for each type (ha) times the average biomass per hectare. The vegetation classes
included cover 344,867,575 ha, or 67.5% of the Brazilian Legal Amazon (510,468,420 ha);
the vegetation classes used do not include savannas or campina vegetation types.
Fourteen percent of the area is classified as human altered land cover. The original
vegetation classes have been recovered for this area from the RadamBrasil dataset, which
includes information on the original vegetation classes before the land cover alterations.
Around 11% of the altered area has been reclassified. For a large part of the dataset the
original vegetation type up to phyto group classification level (e.g. Da = Dense alluvial
ombrophilous forest) were recovered. The additional areas were classified up to the general
formation level (e.g. Dense ombrophilous forest) or were maintained as altered areas. For the
areas with vegetation classified at the formation level, the biomass values for the different
phyto groups were averaged.
Results
Allometric biomass equation
Table 2 presents biomass allometric equations developed from trees sampled in open
forest in southern Amazonia (SA), which allows the dry weight (in Kg) of the whole tree, bole
or crown to be obtained based only on diameter measurements (Figure 1A - C). The dry
masses of all trees are available in Appendix C.

93
Table 2. Parameters of the biomass equations [ln(Dry weight) = a + b ln(Diameter)] in trees sampled in open forest in the southern Amazonia (SA) (diameter range 5-124 cm). The diameter measurements were taken at breast height (1.30 m above the ground) or just above any buttresses. Measurements of diameter are in cm and those of mass are in Kg.
Model Parameters*a (±SE) Lower <95%> Upper b (±SE) Lower <95%> Upper n Adjusted r2 SEE**
Whole tree - 1.716 (0.079) - 1.872 - 1.560 2.413 (0.029) 2.357 2.470 262 0.964 0.306
Bole - 1.929 (0.093) - 2.111 - 1.746 2.335 (0.034) 2.269 2.402 262 0.949 0.359
Crown - 3.355 (0.146) - 3.642 - 3.069 2.578 (0.053) 2.474 2.682 261 0.901 0.564
*All parameter values are significant (p ≤ 0.0001). **Standard Error of the Estimate (SEE) = √Residual Mean-Square
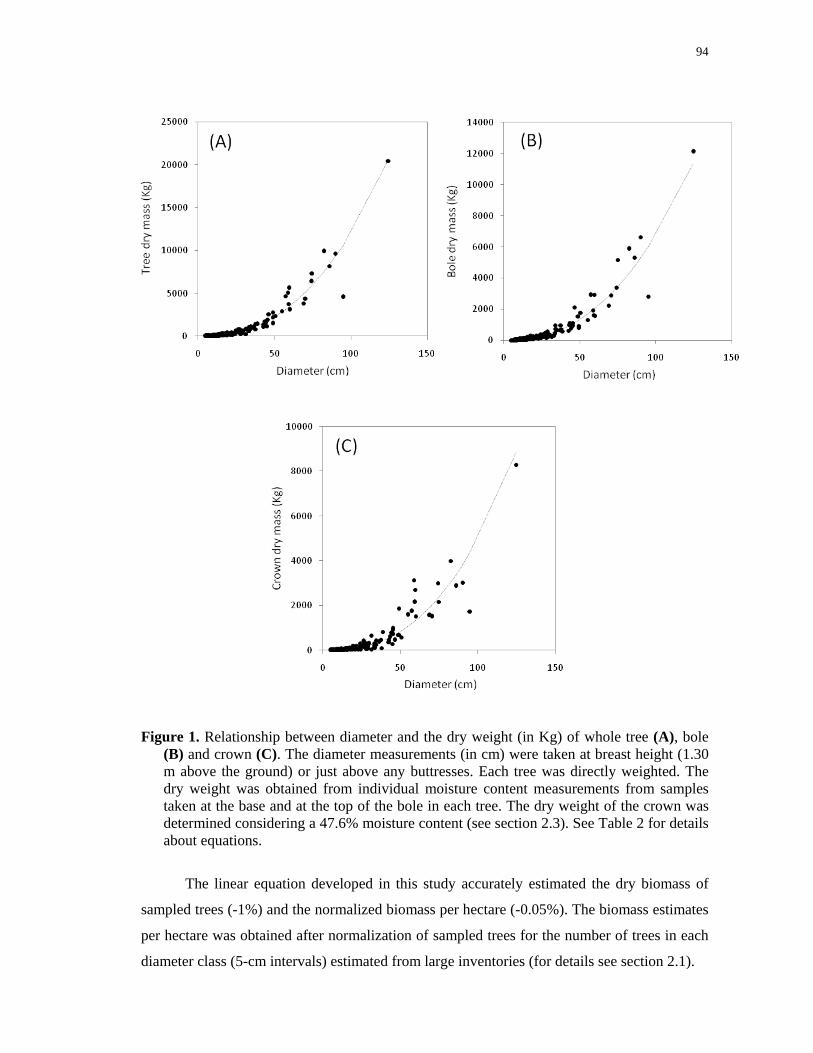
94
Figure 1. Relationship between diameter and the dry weight (in Kg) of whole tree (A), bole (B) and crown (C). The diameter measurements (in cm) were taken at breast height (1.30 m above the ground) or just above any buttresses. Each tree was directly weighted. The dry weight was obtained from individual moisture content measurements from samples taken at the base and at the top of the bole in each tree. The dry weight of the crown was determined considering a 47.6% moisture content (see section 2.3). See Table 2 for details about equations.
The linear equation developed in this study accurately estimated the dry biomass of
sampled trees (-1%) and the normalized biomass per hectare (-0.05%). The biomass estimates
per hectare was obtained after normalization of sampled trees for the number of trees in each
diameter class (5-cm intervals) estimated from large inventories (for details see section 2.1).
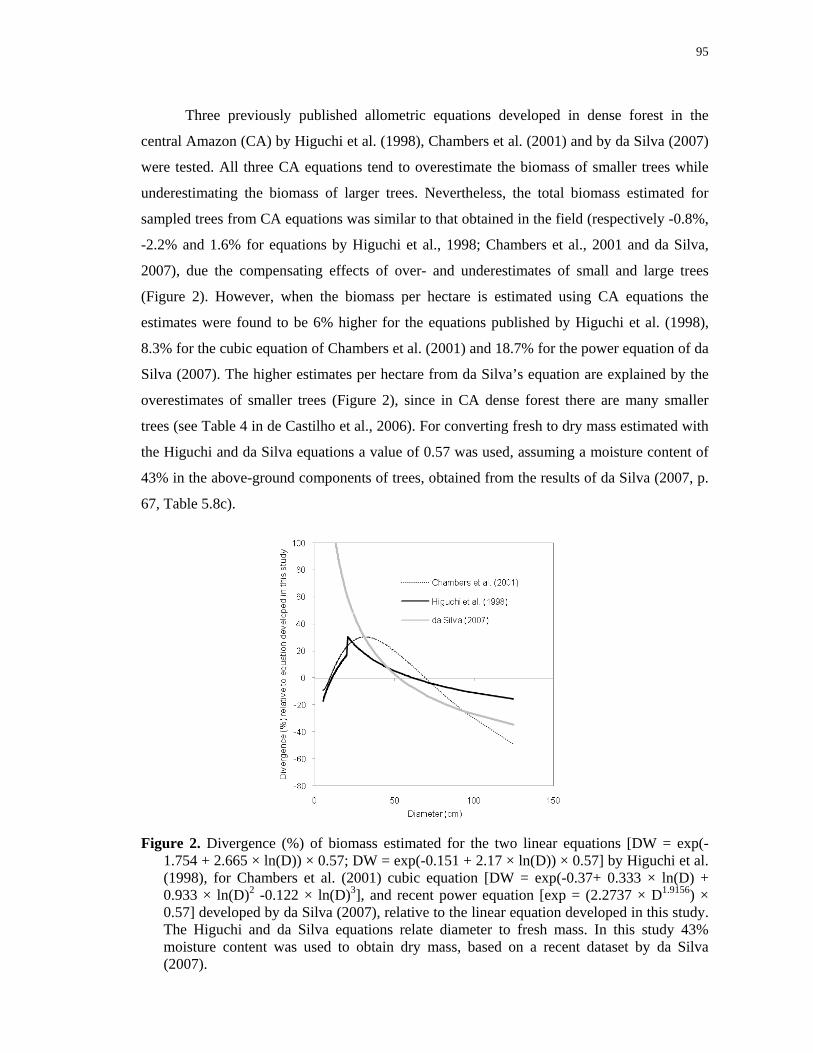
95
Three previously published allometric equations developed in dense forest in the
central Amazon (CA) by Higuchi et al. (1998), Chambers et al. (2001) and by da Silva (2007)
were tested. All three CA equations tend to overestimate the biomass of smaller trees while
underestimating the biomass of larger trees. Nevertheless, the total biomass estimated for
sampled trees from CA equations was similar to that obtained in the field (respectively -0.8%,
-2.2% and 1.6% for equations by Higuchi et al., 1998; Chambers et al., 2001 and da Silva,
2007), due the compensating effects of over- and underestimates of small and large trees
(Figure 2). However, when the biomass per hectare is estimated using CA equations the
estimates were found to be 6% higher for the equations published by Higuchi et al. (1998),
8.3% for the cubic equation of Chambers et al. (2001) and 18.7% for the power equation of da
Silva (2007). The higher estimates per hectare from da Silva’s equation are explained by the
overestimates of smaller trees (Figure 2), since in CA dense forest there are many smaller
trees (see Table 4 in de Castilho et al., 2006). For converting fresh to dry mass estimated with
the Higuchi and da Silva equations a value of 0.57 was used, assuming a moisture content of
43% in the above-ground components of trees, obtained from the results of da Silva (2007, p.
67, Table 5.8c).
Figure 2. Divergence (%) of biomass estimated for the two linear equations [DW = exp(-
1.754 + 2.665 × ln(D)) × 0.57; DW = exp(-0.151 + 2.17 × ln(D)) × 0.57] by Higuchi et al. (1998), for Chambers et al. (2001) cubic equation [DW = exp(-0.37+ 0.333 × ln(D) + 0.933 × ln(D)2 -0.122 × ln(D)3], and recent power equation [exp = (2.2737 × D1.9156) × 0.57] developed by da Silva (2007), relative to the linear equation developed in this study. The Higuchi and da Silva equations relate diameter to fresh mass. In this study 43% moisture content was used to obtain dry mass, based on a recent dataset by da Silva (2007).

96
Two models that include diameter, height and wood density as independent variables,
as published by Chave et al. (2005) and Overman et al. (1994), estimated with accuracy the
biomass of sampled trees or when normalized per hectare (both overestimating about 4%).
The quadratic equation published by Brown (1997) that has been used by prior studies in SA
forest was tested. This equation results in accurate estimates of sampled trees (+1.8%) but
when normalized per hectare the error increases to 6.5%. This differs from the linear equation
also published by Brown (1997), which overestimated the biomass of sampled trees by 4.6%
but overestimated by only in 2% when normalized per hectare.
Other previously published equations (Brown et al., 1989; linear and quadratic
equations by Chambers et al., 2001; Chave et al., 2001; cubic equation by Chave et al., 2005;
da Silva, 2007 with diameter and height; dos Santos, 1996 and Saldarriaga et al., 1988) were
also tested, but all resulted in larger errors.
The correction for lower wood density (ratio = 0.593/0.67) was applied to biomass
estimated from the Chambers et al. (2001) equation as proposed by Baker et al. (2004) and
Malhi et al. (2006). The results underestimated the biomass per hectare by 4.7%. This
suggests similar errors in biomass maps published by Malhi et al. (2006). Similarly, a recent
study (Nogueira et al., 2008) that adds corrections for shorter stems to the Higuchi et al.
(1998) equation implies a greater error in underestimates of biomass for SA open forests.
Although logical, simple corrections to allometric relationships appear to be a risky way to
make biomass adjustments.
The bole dry biomass was 60.6% of the biomass of the whole tree. This relation is
57.9% when the comparison is based on fresh mass due to higher moisture content in the
tissues of the crown, such as leaves and fine branches. These two results indicate that, as
compared to the bole, the biomass stored in the crowns of trees in open forest (39.4%) is
significantly higher that in trees in the dense forest (CA), where crown biomass is equivalent
to 30.8% (n = 121) of the biomass of the whole tree (da Silva, 2007, p. 57) or 34.4% (n = 38)
according to Higuchi et al. (1998).
An assessment was made of whether this difference could to be explained by a shorter
bole at any given diameter in SA trees (Nogueira et al., 2008) or because the size of crowns in
trees in SA trend to be larger than in CA. Results from the crown biomass model developed in
dense forest (Chambers et al., 2001) were plotted against data on crowns directly weighed in
open forest and concluded that the crowns in the open forest were not larger than in dense
forest (Figure 3). Therefore, higher biomass storage in the crowns in the SA as compared to
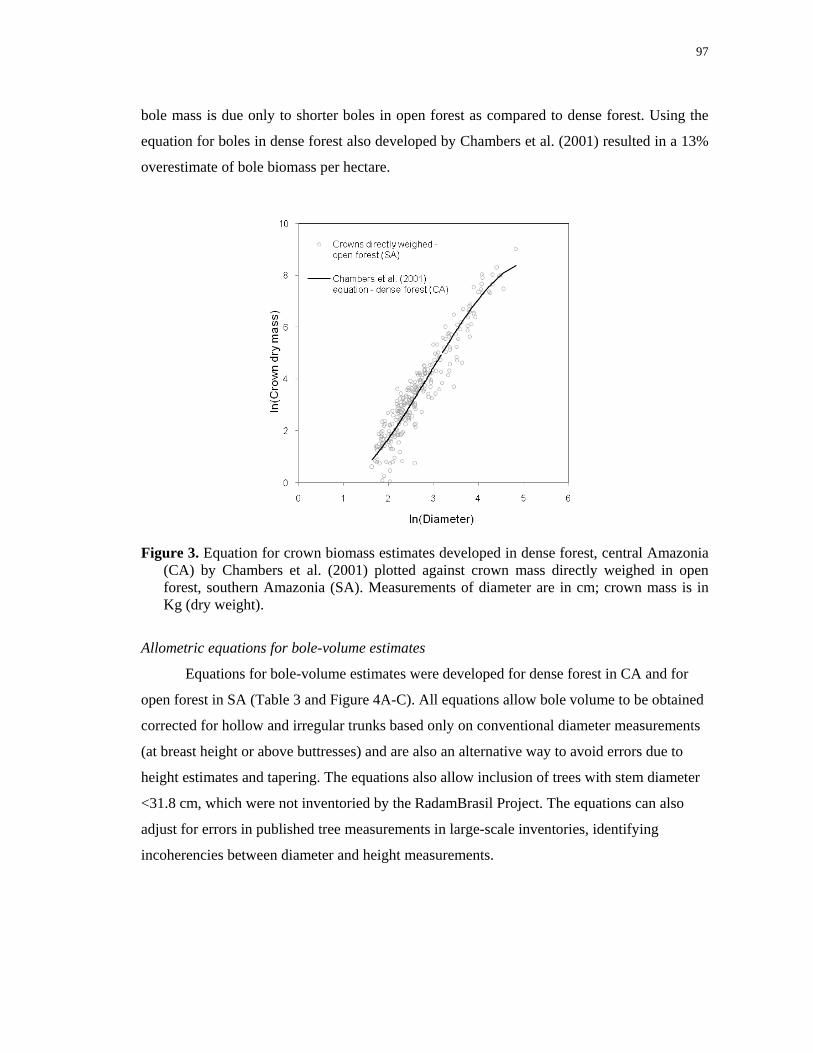
97
bole mass is due only to shorter boles in open forest as compared to dense forest. Using the
equation for boles in dense forest also developed by Chambers et al. (2001) resulted in a 13%
overestimate of bole biomass per hectare.
Figure 3. Equation for crown biomass estimates developed in dense forest, central Amazonia
(CA) by Chambers et al. (2001) plotted against crown mass directly weighed in open forest, southern Amazonia (SA). Measurements of diameter are in cm; crown mass is in Kg (dry weight).
Allometric equations for bole-volume estimates
Equations for bole-volume estimates were developed for dense forest in CA and for
open forest in SA (Table 3 and Figure 4A-C). All equations allow bole volume to be obtained
corrected for hollow and irregular trunks based only on conventional diameter measurements
(at breast height or above buttresses) and are also an alternative way to avoid errors due to
height estimates and tapering. The equations also allow inclusion of trees with stem diameter
<31.8 cm, which were not inventoried by the RadamBrasil Project. The equations can also
adjust for errors in published tree measurements in large-scale inventories, identifying
incoherencies between diameter and height measurements.

98
Table 3. Parameters of bole volume equations [ln(Corrected volume) = a + b ln(Diameter)] in central (CA) and southern Amazonia (SA). The diameter measurements were taken at breast height (1.36 m above the ground in CA or 1.30 m in SA) or just above any buttresses. Measurements of the diameter are in cm and of those of volume are in m3.
Forest type Parameters*
Diameter range a (±SE) Lower <95%> Upper b (±SE) Lower <95%> Upper n Adjusted r2 SEE**
Dense forest, CA 5 – 39.9 - 9.008 (0.091) - 9.186 - 8.830 2.579 (0.031) 2.640 2.518 253 0.965 0.245
40 – 106 - 6.860 (0.565) - 7.996 - 5.723 1.994 (0.143) 2.281 1.706 48 0.805 0.228
Open forest, SA 5 – 82 - 8.939 (0.068) - 9.072 - 8.806 2.507 (0.025) 2.458 2.557 298 0.971 0.251
*All parameter values are significant (p ≤ 0.0001) **Standard Error of the Estimate (SEE) = √Residual Mean-Square

99
Figure 4. Relationship between ln(Diameter) and ln(Corrected volume) considering trees dbh 5-39.9 cm (A) and dbh 40-106 cm (B), both in dense forest, and trees dbh 5-82 cm (C) in open forest. The diameter measurements were taken at breast height (1.36 m above the ground in central Amazonia or 1.30 m in southern Amazonia) or just above any buttresses. Measurements of diameter are in cm and those of bole volume in m3. See Table 3 for details of equations.
Form factor: mean tapering of the boles in dense and open Amazonian forests
In general, the mean form factor considering trees of all sizes (starting diameter ≥5
cm) is similar between dense forest in CA and open forest in SA (Tukey test; p >0.05). In
dense forest the tapering increases (lower form factor) with increasing tree size, while in open
forest the tapering of trees of intermediate size is higher than in dense forest (Figure 5A-B).
0 10 20 30 40Diameter (cm)
0.0
0.5
1.0
1.5
2.0
Cor
rect
ed v
olum
e (m
³)(A)
40 60 80 100 120Diameter (cm)
0
5
10
15
Cor
rect
ed v
o lum
e (m
³)
(B)
0 30 60 90Diameter (cm)
0
2
4
6
8
10
Cor
rect
ed v
olum
e (m
³)
(C)
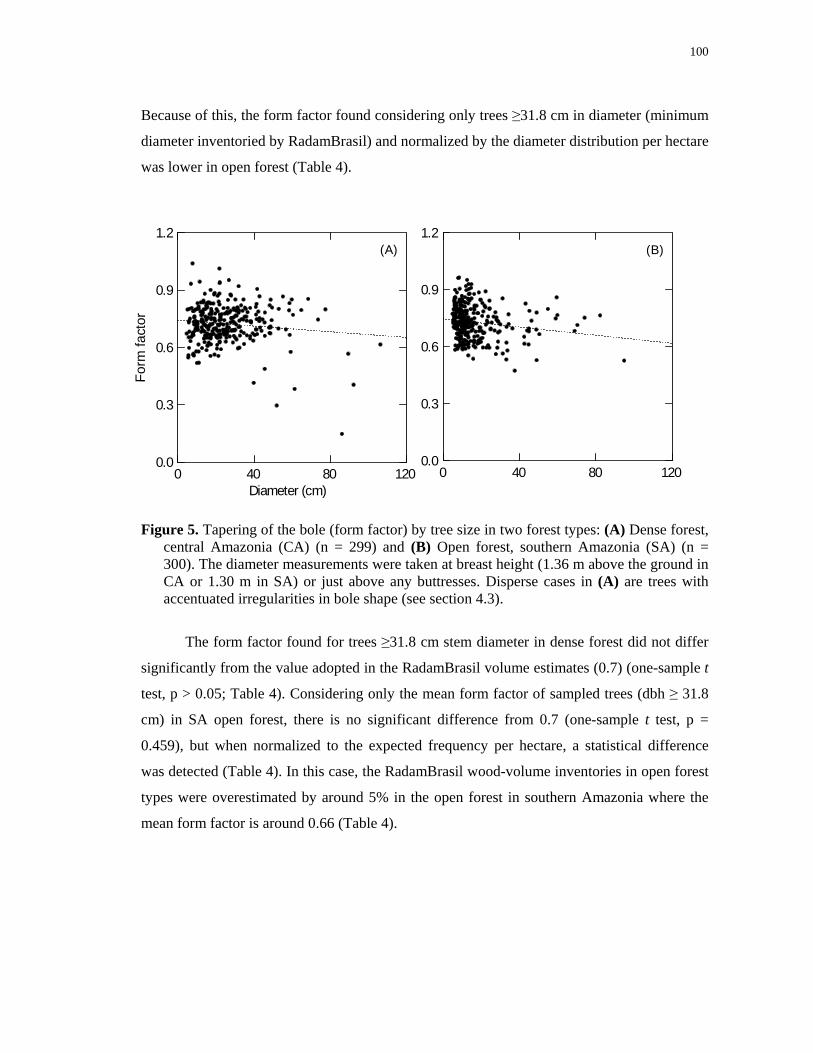
100
Because of this, the form factor found considering only trees ≥31.8 cm in diameter (minimum
diameter inventoried by RadamBrasil) and normalized by the diameter distribution per hectare
was lower in open forest (Table 4).
Figure 5. Tapering of the bole (form factor) by tree size in two forest types: (A) Dense forest, central Amazonia (CA) (n = 299) and (B) Open forest, southern Amazonia (SA) (n = 300). The diameter measurements were taken at breast height (1.36 m above the ground in CA or 1.30 m in SA) or just above any buttresses. Disperse cases in (A) are trees with accentuated irregularities in bole shape (see section 4.3).
The form factor found for trees ≥31.8 cm stem diameter in dense forest did not differ
significantly from the value adopted in the RadamBrasil volume estimates (0.7) (one-sample t
test, p > 0.05; Table 4). Considering only the mean form factor of sampled trees (dbh ≥ 31.8
cm) in SA open forest, there is no significant difference from 0.7 (one-sample t test, p =
0.459), but when normalized to the expected frequency per hectare, a statistical difference
was detected (Table 4). In this case, the RadamBrasil wood-volume inventories in open forest
types were overestimated by around 5% in the open forest in southern Amazonia where the
mean form factor is around 0.66 (Table 4).
0 40 80 120Diameter (cm)
0.0
0.3
0.6
0.9
1.2
Form
fact
o r
(A)
0 40 80 1200.0
0.3
0.6
0.9
1.2(B)
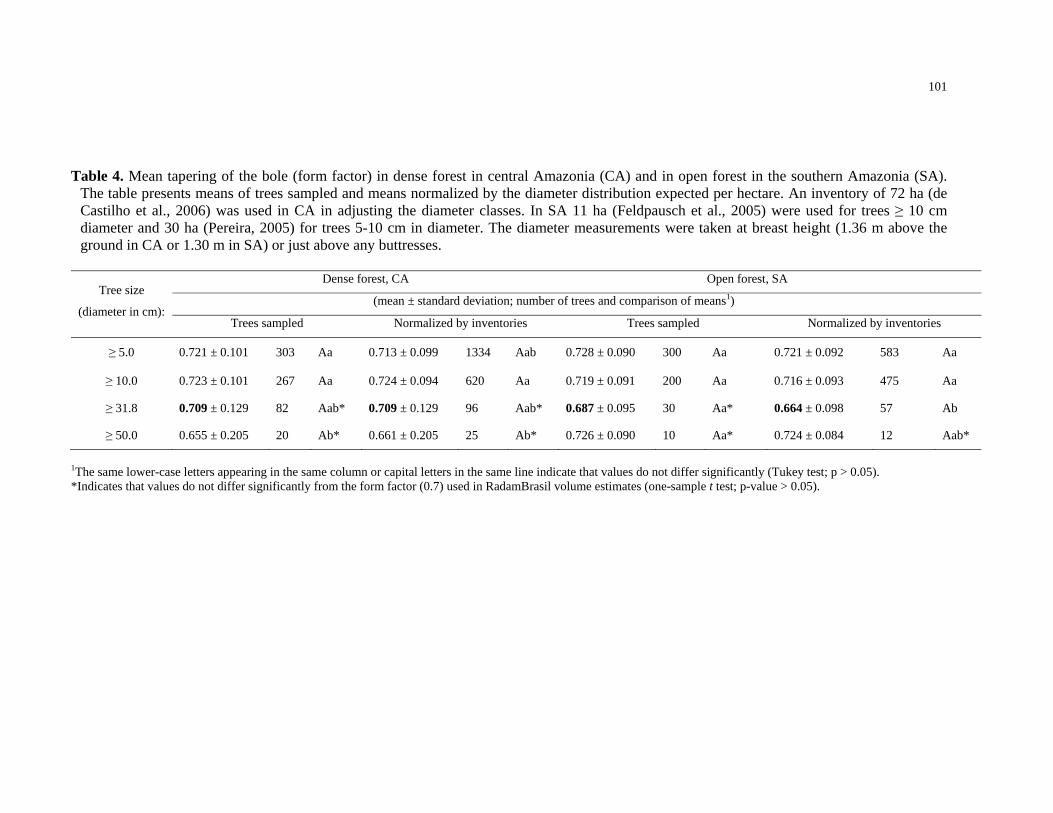
101
Table 4. Mean tapering of the bole (form factor) in dense forest in central Amazonia (CA) and in open forest in the southern Amazonia (SA). The table presents means of trees sampled and means normalized by the diameter distribution expected per hectare. An inventory of 72 ha (de Castilho et al., 2006) was used in CA in adjusting the diameter classes. In SA 11 ha (Feldpausch et al., 2005) were used for trees ≥ 10 cm diameter and 30 ha (Pereira, 2005) for trees 5-10 cm in diameter. The diameter measurements were taken at breast height (1.36 m above the ground in CA or 1.30 m in SA) or just above any buttresses.
Tree size
(diameter in cm):
Dense forest, CA Open forest, SA
(mean ± standard deviation; number of trees and comparison of means1)
Trees sampled Normalized by inventories Trees sampled Normalized by inventories
≥ 5.0 0.721 ± 0.101 303 Aa 0.713 ± 0.099 1334 Aab 0.728 ± 0.090 300 Aa 0.721 ± 0.092 583 Aa
≥ 10.0 0.723 ± 0.101 267 Aa 0.724 ± 0.094 620 Aa 0.719 ± 0.091 200 Aa 0.716 ± 0.093 475 Aa
≥ 31.8 0.709 ± 0.129 82 Aab* 0.709 ± 0.129 96 Aab* 0.687 ± 0.095 30 Aa* 0.664 ± 0.098 57 Ab
≥ 50.0 0.655 ± 0.205 20 Ab* 0.661 ± 0.205 25 Ab* 0.726 ± 0.090 10 Aa* 0.724 ± 0.084 12 Aab*
1The same lower-case letters appearing in the same column or capital letters in the same line indicate that values do not differ significantly (Tukey test; p > 0.05). *Indicates that values do not differ significantly from the form factor (0.7) used in RadamBrasil volume estimates (one-sample t test; p-value > 0.05).

102
Volume expansion factor (VEF)
The VEF currently adopted in biomass estimates is 1.25 for dense forest and 1.5 for
non-dense forest. These values are used to add the bole volume of trees 10 to 30 cm in
diameter (Brown and Lugo, 1992). Therefore, since the RadamBrasil volume inventories start
with trees 31.8 cm in diameter (1 m circumference), there is a gap for trees 30 to 31.7 cm in
diameter. This means that the bole volume of around 11 trees was not counted, according to
the 72-ha inventory in dense forest in central Amazonia (de Castilho et al., 2006), which is
equivalent at 9.5 m3.ha-1. In this study the bole volume of the trees 10 to 31.7 cm in diameter
was estimated in dense and open forest; because of this the VEF values reported here are
obviously expected to be higher than values in the literature that do not include trees with dbh
30 to 31.7 cm. The estimates were calculated from bole volume corrected for indentations and
hollow trunks.
In dense forest in CA, trees 10 to 31.7 cm in diameter represent 53.7% of the bole
volume of the trees ≥ 31.8 cm diameter. Therefore, the VEF estimated from corrected bole
volume was 1.537 when normalized by the diameter distribution expected per hectare. In this
case, the VEF (1.25) adopted currently in biomass models for dense forest will be
underestimated by around 25%. In the case of the inventories in which trees were sampled
starting at 25 cm stem diameter (such as the FAO inventories: Glerum, 1960; Glerum and
Smitt, 1962; Heinsdijk, 1957, 1958) the appropriate VEF value will be 1.305.
For open forest in southern Amazonia the bole volume estimated for trees 10 to 31.7
cm was equivalent to 50.6 % of the bole volume of all trees ≥ 31.8 cm diameter (when
normalized by the diameter distribution per hectare). Therefore the appropriate VEF value is
1.506, similar to the value currently used in biomass estimates. In the case of inventories of
trees ≥ 25 cm in diameter, the VEF value found was 1.283. In this forest type, for 6.7% of the
sampled trees the bole volume was not corrected for indentations and hollow trunks because
of operational demands of the logging company that owns of the collecting area.
Biomass expansion factor (BEF)
The BEF (biomass expansion factor) currently adopted in biomass estimates for dense
forest (inventoried bole biomass ≥ 190 Mg ha-1) is 1.74, which was obtained by Brown et al.
(1989) in plots that were mostly located in Venezuela.
The relationship between tree biomass estimated by a model developed in central
Amazonia (Higuchi et al., 1998) using bole biomass (corrected volume × wood density)
results in a BEF value of 1.621 ± 0.415 (mean ± sd; n = 267 trees). Normalized by the

103
diameter distribution per hectare the BEF is 1.635 ± 0.441. The two BEF values differ
statistically from the 1.74 value (one-sample t test, p < 0.001). The BEF value obtained from
267 trees sampled in this study is similar to the mean ratio between the total weight of the tree
and the weight of the bole (~1.64) reported for 315 trees sampled by Higuchi et al. (1998, p.
157). Considering these results, the BEF currently adopted in the biomass estimates results in
6% overestimate of the crown biomass of trees in dense forest in central Amazonia.
In open forest the crown biomass of 262 trees was directly weighed and a linear model
was developed to obtain crown biomass from diameter measures alone (Table 2). Although an
allometric equation is preferred, the BEF value of 1.580 ± 0.357 (mean ± sd; normalized by
the diameter distribution per hectare) could be used in cases where individual tree diameters
are not available. A value of the BEF was estimated for the plots in this study using the
allometric equation developed by Brown and Lugo (1992) for use where the bole biomass is
≤190 Mg ha-1: BEF = exp(3.213 – 0.506 × ln(bole biomass). The BEF value found was 1.930,
around 18% higher that the BEF value reported here.
The adjusted biomass map for Brazilian Amazonia
The new wood-density dataset reduces uncertainties in converting bole volume to
estimated bole biomass for Brazilian Amazonia as a whole. In the case of uncertainties in the
volume reported in the inventories, corrections were not applied for lower form factor in open
forest because this is related to hollow trunks in the intermediate-sized trees sampled (Figure
5B). As there are no data on occurrence of hollow trunks that relate to tree size that would
assure that this effect is expected at large scale, this effect was not applied in biomass
estimates (see discussion section). However, overestimates in bole volume (4.4% found in
dense forest and 3.3% in open forest) by the formula adopted in the RadamBrasil inventories,
which includes a form factor of 0.7, was applied in biomass adjustments because new BEF
values were used in this study. This error has not been transferred to the biomass estimates
because it is assumed to be compensated by the variables that add the crown biomass (BEF)
when the volume data are converted to biomass (see Nogueira et al., 2006, p. 19). The new
VEF values were applied to all forest types and the BEF value for dense forest (1.635) was
applied to forest types with bole biomass ≥190 Mg ha-1. In the non-dense forest type a BEF
value of 1.58 was found for a forest with a biomass stock of 156 Mg ha-1 (dry weight) in all
boles ≥10 cm dbh. Thus, in non-dense forest types the only BEF value used was 1.58 for
forest with bole biomass 156 Mg ha-1 ± 5% (148.2 to 163.8 Mg ha-1), and in the remaining
forest applied the equation proposed by Brown and Lugo (1992) that relates BEF to the

104
corresponding biomass of the inventoried volume was applied. This was adopted because
other work in the tropics and later work on US forests has shown that the magnitude of the
BEF varies with the merchantable volume of the stand, with high values of BEF at low values
of volume, and values generally decreasing exponentially to a constant BEF at high volume
(Brown, 2002). If the BEF value of 1.58 is applied to plots with a stock in bole biomass lower
than 156 Mg ha-1, the biomass would be systematically underestimated.
The distribution of biomass over the Brazilian Amazon is presented in Figures 6.
The total biomass (below- and above-ground) for the Brazilian Amazon using the
corrected values is 125.4 Pg (=1015 g) dry weight, or 60.8 PgC assuming 1 Mg dry biomass =
0.485 Mg C (da Silva, 2007). The above-ground biomass alone is 104.2 Pg (50.5 PgC). The
total biomass storage and above-ground biomass were estimated in 15 forest type for the nine
states of the Brazilian Legal Amazon (Tables 5 and 6). The average per-hectare biomass of
each of the vegetation types is also given in Table 5. Considering the cumulative deforestation
in Brazilian Amazonia through 2006 (Brazil, INPE, 2007), the dry biomass stock had been
reduced to 113.3 and 94.2 Pg (or 54.9 and 45.6 PgC), respectively for below-ground + above-
ground and only above-ground, excluded non-forest areas or secondary formations. These
results have implications for biomass and carbon emissions because they directly affect the
estimates of carbon stock and emission in all forest types when compared with previous
estimates.

105
Table 5. Average total biomass (below + above-ground) and above-ground biomass by forest type (dry weight in Mg ha-1) and total stock by state (×106 Mg) in Brazilian Legal Amazonia at the time of the RadamBrasil inventory, therefore before intensive deforestation had occurred. Values in brackets [value] denote only above-ground biomass. All other values denote below + above-ground biomass. Secondary formations and non-forest vegetation were not considered.
Forest type (IBGE code) Average DW Biomass
(Mg ha-1) Acre Amazonas Amapá Maranhão Mato Grosso Pará Rondônia Roraima Tocantins Total
Open alluvial rain forest (Aa) 357.8 453.878 2628.872 29.953 10.425 3.068 179.527 10.739 3316.462
[298.4] [378.527] [2192.441] [24.980] [8.695] [2.559] [149.723] [8.956] [2765.881]
Open lowland rain forest (Ab) 363.4 4230.781 8244.753 2.680 29.563 1516.546 9.952 14034.274
[303.1] [3528.755] [6876.677] [2.235] [24.657] [1264.901] [8.301] [11705.526]
Open submontane rain forest (As) 336 1688.396 18.651 43.295 3370.779 8995.234 2954.668 340.164 513.068 17924.254
[280.2] [1408.002] [15.554] [36.105] [2810.989] [7501.383] [2463.982] [283.672] [427.862] [14947.548]
Seasonal Deciduous submontane (Cs) 290.1 259.290 100.996 43.249 403.536
[241.9] [216.209] [84.216] [36.064] [336.488]
Dense alluvial rain forest (Da) 360.8 21.282 4427.041 217.135 29.309 177.148 2079.974 71.020 108.029 9.829 7140.766
[299.3] [17.654] [3672.432] [180.124] [24.313] [146.952] [1725.433] [58.914] [89.615] [8.153] [5923.590]
Dense lowland rain forest (Db) 384.5 611.706 25590.142 796.717 336.086 6215.557 69.043 381.177 34000.426
[318.9] [507.342] [21224.177] [660.788] [278.746] [5155.113] [57.263] [316.144] [28199.573]
Dense montane rain forest (Dm) 361.3 414.986 32.419 922.239 1369.644
[299.7] [344.233] [26.892] [765.002] [1136.126]
Dense submontane rain forest (Ds) 385.3 30.798 7694.882 3132.182 633.965 1994.164 17294.611 435.885 3133.542 39.105 34389.134
[319.6] [25.547] [6382.778] [2598.093] [525.864] [1654.127] [14345.595] [361.560] [2599.221] [32.437] [28525.220]
Seasonal Semideciduous alluvial (Fa) 283.4 0.474 565.080 24.166 9.578 19.671 150.606 769.574
[236.4] [0.395] [471.365] [20.158] [7.990] [16.409] [125.629] [641.946]
Seasonal Semideciduous in lowland areas (Fb)
309.3 327.601 46.747 374.347 [258] [273.265] [38.993] [312.259]
Seasonal semideciduous submontane (Fs)
315.7 177.145 5298.019 317.448 252.242 438.728 8.973 6492.555 [263.3] [147.743] [4418.652] [264.758] [210.375] [365.908] [7.484] [5414.918]
Contact Woody oligotrophic vegetation (Campinarana) of swampy and sandy areas / Rain forest (LO)
384.6 468.644 0.260 3.857 246.608 719.370
[320.8] [390.903] [0.217] [3.217] [205.699] [600.036]
Contact Rain forest/Seasonal forest (ON)
310.6 1142.401 10.584 99.742 30.902 1283.629 [259.1] [952.981] [8.829] [83.204] [25.778] [1070.793]
Contact Savanna / Seasonal forest (SN)
302.7 738.387 1244.575 28.094 27.929 0.492 261.612 2301.089 [252.4] [615.689] [1037.762] [23.425] [23.288] [0.410] [218.139] [1918.714]
Contact Savanna / Rain forest (SO) 314.3 75.873 8.750 3.460 173.921 223.638 301.178 119.260 906.079
[262.1] [63.272] [7.296] [2.886] [145.035] [186.495] [251.157] [99.453] [755.594]
Total only Above-ground [4457.825] [42554.913] [3486.835] [1633.975] [12136.249] [29372.729] [4971.350] [4676.158] [964.177] [104254.211] Total (Below- and Above-ground) 5348.444 51233.588 4203.387 1964.801 14563.662 35359.207 5964.104 5631.504 1156.440 125425.138

106
Table 6. Stock estimate of dry biomass (×106 Mg) by state and forest type in Brazilian Legal Amazonia, excluding areas deforested through 2006 (Brazil, INPE, 2007). Values in brackets [value] denote only above-ground biomass. All other values denote below + above-ground biomass. Secondary formations and non-forest vegetation were not considered. The forest type is in the column headed “IBGE code” (see Table 5 for correspondence). IBGE code Acre Amapá Amazonas Maranhão Mato grosso Pará Rondônia Roraima Tocantins Total
Aa 394.288 27.180 2573.827 10.149 2.466 172.890 7.350 3188.151
[328.830] [22.668] [2146.534] [8.464] [2.057] [144.188] [6.130] [2658.872]
Ab 4105.243 8172.446 0.500 23.820 1312.795 9.903 13624.707
[3424.048] [6816.369] [0.417] [19.867] [1094.959] [8.260] [11363.920]
As 17.994 1658.517 20.518 2911.118 8237.571 2299.615 323.842 264.490 15733.665
[15.006] [1383.084] [17.110] [2427.664] [6869.546] [1917.715] [270.061] [220.566] [13120.753]
Cs 163.691 96.389 43.249 303.330
[136.494] [80.374] [36.063] [252.932]
Da 20.524 212.723 4332.541 21.446 162.814 1994.710 66.093 107.652 8.667 6927.170
[17.026] [176.463] [3594.039] [17.791] [135.062] [1654.702] [54.827] [89.303] [7.190] [5746.402]
Db 494.833 778.474 24093.628 297.693 5459.001 64.967 380.815 31569.409
[410.409] [645.657] [19982.985] [246.903] [4527.635] [53.883] [315.844] [26183.315]
Dm 414.784 32.418 920.949 1368.151
[344.065] [26.891] [763.931] [1134.887]
Ds 30.777 3124.909 7639.255 453.528 1295.669 15898.043 300.742 3049.585 9.092 31801.601
[25.529] [2592.060] [6336.636] [376.194] [1074.736] [13187.165] [249.461] [2529.581] [7.541] [26378.904]
Fa 0.138 525.633 20.590 8.086 19.301 146.288 720.035
[0.115] [438.460] [17.175] [6.745] [16.100] [122.027] [600.622]
Fb 253.719 32.892 286.610
[211.637] [27.436] [239.073]
Fs 152.774 4227.746 308.664 204.652 381.344 8.338 5283.518
[127.417] [3526.023] [257.432] [170.684] [318.049] 6.954 [4406.558]
LO 442.504 0.244 1.820 244.811 689.379
[369.098] [0.204] [1.518] [204.200] [575.020]
ON 110.917 0.468 7.654 7.192 126.232
[92.526] [0.390] [6.385] [6.000] [105.301]
SN 694.400 477.601 18.100 12.035 0.492 242.215 1444.844
[579.011] [398.238] [15.093] [10.035] [0.410] [201.966] [1204.753]
SO 7.860 46.762 2.686 47.273 52.652 125.757 12.727 295.717
[6.555] [38.996] [2.240] [39.422] [43.908] [104.871] [10.613] [246.604]
Total 5045.664 4169.139 49374.264 1643.682 10186.575 32146.713 4608.178 5445.887 742.417 113362.519
[4205.842] 3458.409 [41011.808] [1367.197] [8488.931] [26703.753] [3841.188] [4521.738] [619.051] [94217.917]

107
Figure 6. Below and aboveground biomass map (dry weight) for Brazilian Legal Amazonia based on 2860 plots inventoried by the RadamBrasil
Project (Brazil, Projeto RadamBrasil, 1973-1983). These estimates do not include savanna, campinarana, secondary formations or pioneers. The color scaling of the biomass map is according to Jenks natural breaks classification.

108
Discussion
Allometric biomass equation developed in the southern Amazon
In spite of there being several previous allometric equations developed in Amazonian
forests (Araújo et al., 1999; Chambers et al., 2001; Higuchi et al., 1998; Overman et al., 1994;
dos Santos, 1996), equations have not been developed based on direct measurements in non-
dense forest types, which are precisely where deforestation has historically predominated
(Brazil, INPE, 2007). This is the case of the southern part of the Brazilian Amazon, where
open forest and contact zones (ecotones) on fertile soils prevail (Brazil, IBGE, 1997). The
new equation proposed by this study is the first equation developed from trees directly
weighed in southern Amazon forests. This equation makes it possible to obtain accurate tree
biomass estimates using only diameter. This is an important advantage for practical use. In
addition, the previously published models that theoretically allow estimation of tree biomass
for any forest type, due to their use of height and wood density as input variables, produced
larger errors than the equation developed in this study.
The results of this study show that biomass estimates obtained from equations
developed in central Amazonia result in overestimates if applied in southern Amazonia
(Cummings et al., 2002). However, if downward corrections due to lower wood density and
height are applied, the biomass would be underestimated (see Baker et al., 2004; Malhi et al.,
2006; Nogueira et al., 2008). The biomass underestimates per hectare due to wood density
corrections (as in Malhi et al., 2006) will be close to the overestimates if the Higuchi et al.
(1998) formula is applied without wood density corrections. The results also indicate that
biomass estimates from quadratic allometric equations developed by Brown (1997) will imply
an overestimate of 17 Mg ha-1 in open forest in the southern Amazon (Feldpausch et al.,
2005). A linear equation with only diameter as an input variable, published by Brown (1997)
for moist forest, and the equations developed by Overman et al. (1994) and Chave et al.
(2005) that need diameter, height and wood density, resulted in reasonable biomass estimates
per hectare. Surprisingly, the equations developed by Chave et al. (2005) and Overman et al.
(1994) provide very similar fits and hence biomass estimates, although the Chave et al.
equation was developed from 2410 trees while the Overman et al. equation used only 54 trees.
These two equations resulted in very small differences, basically due to smaller trees. This
appears to reinforce the argument that it is more reasonable to develop regional allometric
equations (Brown, 2002) than to fit tree biomass to large datasets (Chave et al., 2005),
because, despite a better theoretical description of the scaling relationship Mass Diameter,

109
fitting from a dataset that is lumped from several regions may not accurately reflect the true
biomass of the trees in any given region.
Allometric equations for bole-volume estimates in dense and open Amazonian forest: an
alternative way to avoid errors due to height estimates, tapering, indentations and hollow
trunks
The volume equations developed in Amazonia for estimating the commercial bole of
trees generally ignore non-commercial trees or those with hollow trunks or with irregular
boles (indentations, non-circular forms or protuberances), which are also denominated as
slitted (“fenestrado”) and channeled (“acanalado”) boles according Ribeiro et al. (1999, p.
27). A large inventory in central Amazonia (72 ha; de Castilho et al., 2006) has shown that
9.7 ± 0.7 trees/ha (mean ± sd; dbh≥10 cm) occur with very irregularly shaped boles
(Aspidosperma marckgravianum, A. nitidum; Swartzia polyphylla, S. reticulata, S.
schomburgkii) or “fenestrado” (including Minquartia guianensis; Geissospermum argenteum,
G. urceolatum). These trees could imply a substantial bias in volume estimates, especially
when large trees are included (Nogueira et al., 2006). Considering the species cited above, the
mean number of individuals with dbh ≥ 40 cm was 1.6/ha (s.d. = 1.8). These arguments are
reinforced if these or other species are hollow and/or have irregular trunks. According to
Ribeiro et al. (1999), very irregular bole shapes occur in several families in Amazonia, such
as Apocynaceae (Aspidosperma nitidum Benth.), Olacaceae (Minquartia guianensis Aubl.),
Leguminosae (Swartzia sp.), Euphorbiaceae (Pausandra macropetala Ducke),
Melastomataceae (Miconia splendens Griseb) and Rubiaceae (Amaioua guianensis Aubl.).
Previous bole-volume models developed in central Amazonia might have
overestimated the dependent variable if they did not exclude trees with indentations and
hollow trunks. The errors would be present in the estimates of the cross-sectional area of the
bole, which is frequently treated as the "real" volume and has traditionally been obtained
using the Smalian formula without corrections for irregular and hollow boles. The Smalian
formula is used as a baseline in developing and validating models (Fernandes et al., 1983, p.
539; Higuchi and Ramm, 1985, p. 35; Moura, 1994, p. 29; Ribeiro, 1996, p. 23). These errors
might have been eliminated or minimized in the models that were developed or tested using
trees that were free of defects such as hollow trunks and protuberances, as assumed by
Fernandes et al. (1983, p. 539). Possibly, errors will be small when using these models in
estimates of commercial timber, which use species with boles that are more regular than
average. Studies that estimate the biomass of all trees in a forest type starting from volume

110
equations developed for commercial trees will result in overestimation. Because many of the
existing datasets were compiled for purposes of commercial timber exploitation, this bias
could be present in studies that fit biomass models to these datasets.
Allometric equations for bole volume that include corrections for irregular and hollow
trunks and improved estimates of average wood density (Nogueira et al., 2005) can help
reduce uncertainties regarding the magnitude of greenhouse-gas emissions from deforestation
and other land-use changes in Amazonia. These equations allow estimates to be based on the
full sequence of calculation steps, starting from tree measurements to estimate bole volume,
then applying appropriate corrections for hollow trunks and irregularities, converting to bole
biomass with properly adjusted density values, and adding estimates for trees below the
minimum diameter surveyed, for tree components other than the bole and for non-tree forest
components. In addition, in datasets from large-scale inventories the use of allometric
equations for bole volume that include corrections for irregular and hollow trunks could help
resolve discrepancies in diameter and bole height given in RadamBrasil reports. It should be
stressed that these methods are needed for assessing carbon stocks and emissions from
deforestation and that the task of detecting biomass changes in standing forest requires
different methods based on detailed monitoring of individual trees (see Fearnside, 2004).
Form factor: mean tapering of the boles in dense and open Amazonian forest and
implications for biomass estimates
The method adopted in this study for calculating form factor allows an adequate
estimate of the mean tapering of the bole to be obtained. If conventional measurements are
used, the mean form factor is found to be higher than form factors derived from the
relationship between corrected bole volume and the volume of a cylinder calculated from
conventional diameter measurements. While with the method adopted here the form factor
tends to decrease with tree size, non-corrected measures of form factor tend to increase with
tree size. This is expected because errors in biometric characters tend to increase with tree
size (Nogueira et al., 2006) due to indentations and greater frequency of hollow trunks. For
dense forest in central Amazonia the form factor presented in this study (0.709), based on the
relationship between “corrected” volume and volume from conventional measurements,
agrees with the form factor used by the RadamBrasil Project (0.70). However, form factor
was found to be lower in trees in the open forest because it is lower in trees of intermediate
size (Table 4; Figure 5B). In analyzing the trees in open forest, it was noted that around 36%
of trees with stem diameter ≥ 31.8 cm have hollow spaces in the trunk, which suggests that

111
occurrence of hollow trunks explains a lower form factor in trees of intermediate size,
particularly those 31.8 to 49 cm dbh. The form factor found in open forest using non-
corrected measurements was 0.760 ± 0.075 (mean ± sd, n=38; trees ≥ 31.8 cm dbh); the form
factor increases with tree size (0.745 and 0.781 for trees ≥10 and ≥50 cm, respectively). These
data confirm the decreases in the form factor from corrected measurements in trees of
intermediate size due to hollow trunks. For this reason the difference of 5% between mean
form factor in open forest and the value of 0.7 used by the RadamBrasil Project was not
applied in biomass adjustments. The difference is substantial and its effect on biomass
therefore has important implications for carbon emission, but there is no information about
distribution of hollow trunks by tree size that would allow consistent adjustments to biomass.
These results also reinforce the necessity of assessing whether a single form factor is adequate
for use with all trees across the Amazon basin.
A previous study in central Amazonia reported 0.75 as the mean form factor (Moura,
1994; dbh ≥ 45 cm, n = 752 trees), obtained from conventional measurements. Using the same
methodology as Moura (1994), a mean value of 0.789 ± 0.090 (mean ± s.d.; n = 33; dbh ≥ 45
cm) was found for trees sampled in this study, while using the “corrected” measurement
methodology the mean was 0.680 ± 0.170. The results, together with values reported in Table
4, suggest that for large trees in central Amazonia, the effect of irregularities of the bole and
hollow trunks will have a strong influence on the estimate of the mean form factor. In spite of
large trees storing a substantial portion of the biomass, they have little influence on the mean
form factor, which is strongly influenced by the large number of small trees. Eliminating the
large trees (dbh ≥ 50 cm; n = 20), the mean form factor is increased by only 2.5%, while
considering only trees ≥ 31.8 cm dbh raises mean form factor from 0.709 to 0.727(2.5%).
These same trees are equivalent to 37% of the bole volume of all trees ≥ 10 cm stem diameter.
Considering only the form factor of trees with dbh ≥ 50 cm, there is an overestimate of at least
6% with respect to the form factor of 0.7 used in the RadamBrasil Project formula. The use of
a mean form factor without weighting by the proportional volume of the large trees will result
in errors in the estimated volume per hectare.
In the case of the estimates published by the RadamBrasil Project, it is possible that
the error in the form factor for large trees is being offset by underestimation of the volume of
the trees 31.8 to 49 cm. Similarly, in open forest the higher form factor of the large trees
could offset the lower form factor of intermediate sized trees. For all of these reasons, in the
biomass adjustments in this study the mean form factor used in dense forest by the
RadamBrasil Project was considered unbiased.

112
Volume expansion factor (VEF)
Underestimation of the Volume expansion factor (VEF) value proposed by Brown et
al. (1989) and Brown and Lugo (1992) was found only in the dense-forest type. This is
confirmed by the results for biomass stock in 20 1-ha plots in central Amazonia (Nascimento
and Laurance, 2002; Table 3), where trees with dbh ≥ 30 cm stock only 65.25% of the
biomass of trees with dbh ≥ 10 cm. In this case, the VEF (34.75/65.25 = 0.532) will be 1.532,
similar to the 1.537 value found in this study. Another large (72 ha) biomass study in central
Amazonia (de Castilho et al., 2006) similarly indicates that the biomass storage in trees 10 to
30 cm dbh was 36.2%, while in trees ≥ 30 cm dbh contained 63.8% of the biomass in all trees
≥ 10 cm dbh. The VEF in this case will be 1.567. Together, the results reinforce the fact that
adjustments are necessary in biomass estimates in dense forest due to underestimates in the
commonly used value of VEF.
Biomass expansion factor (BEF)
The biomass expansion factor (BEF) value is related to structural variables of the
forest because BEF varies as a function of stem-wood biomass (Brown and Lugo, 1992). The
regional variation in Amazonian forest biomass could directly affect the BEF value. The
variable BEF takes into account the observation that large trees have relatively more biomass
in stems than small trees (Houghton et al., 2001). The BEF proposed by Brown et al. (1989)
was estimated assuming that a large part of the biomass is stored in large trees. The biomass
estimates for large trees is the main difference between the models of Brown et al. (1989) and
those developed in central Amazonia by Chambers et al. (2001) and Higuchi et al. (1998).
The large-scale inventories in central Amazonia indicate that trees with dbh ≥ 60 cm stock
around 13-18% of the biomass of all trees ≥10 cm dbh (Nascimento and Laurance, 2002; de
Castilho et al., 2006), while in other Amazonian regions there is a higher biomass stock in
larger trees. For example, Chave et al. (2001; Table 3) found 39% of the biomass in only 12
trees ≥ 70 cm dbh, which represents only about 2.3% of the trees ≥19 cm dbh. The biomass in
large trees in central Amazonia would instead be found in intermediate-sized trees, which
would explain the value of BEF being lower than in the plots used by Brown et al. (1989). In
addition, Brown (1997) proposed a new equation to replace the earlier one (i.e., Brown et al.,
1989) that had been used in deriving the estimate of BEF, which nevertheless continues to be
the BEF value in current use for in biomass estimates based on inventoried wood volumes.
113
Significance for biomass in Brazilian Amazonia
Recent studies have indicated downward adjustments to biomass and carbon emissions
in Brazilian Amazonia due to corrections in the conversions of inventoried bole volume to
bole biomass (Fearnside, 2007; Nogueira et al., 2005, 2007). In the case of the results reported
in this study, corrections are derived for the inventoried wood-volume dataset, and for factors
used to account for smaller trees and crown biomass. The biomass map presented in this study
from large-scale inventories of wood volume shows lower biomass stock, in general, as
compared to previous studies. The spatial pattern of biomass distribution reported in this
study is similar to the distributions reported by Saatchi et al. (2007) for forests in the center-
south region (northwestern Mato Grosso and southern Pará) and for the northeastern portion
of Brazilian Amazonia (Amapá and northeastern Pará). The estimates of Saatchi et al. (2007)
were obtained from data measured in 544 plots distributed throughout Amazonia (including
the portion outside of Brazil), together with calibrations based on classification of forests by
remote sensing. The methodology is therefore different from that adopted in the present study,
which is based on 2860 plots in Brazilian Amazonia together with adjustments for allometry
and density obtained in different forests.
The map resulting from the study shows reasonable coherence in vegetation types and
topography across the basin, especially at the critical area for deforestation at the forest’s
southern edge. In higher altitude areas in the southern and southwestern Amazon (in the states
of Pará, Mato Grosso, Rondônia and part of Acre), where deforestation is concentrated, the
results clearly show lower biomass. In Acre state, biomass is possibly overestimated for the
bamboo-dominated forests, since they were not differentiated from other vegetation classes.
The results cause substantial impact on biomass and carbon-emissions estimates obtained
from large-scale inventories of forest volume in Brazilian Amazonia; the results also imply
changes in biomass estimates derived from allometric equations, since a new allometric
equation is proposed for southern Amazonia (Baker et al., 2004; Malhi et al., 2006). The
adjustments reduce discrepancies between studies developed using different methods and
reduce the uncertainties in biomass estimates in Amazonia when they are obtained from
inventoried wood volume or from allometric equations.
Conclusions
The new allometric equations developed in this study allow accurate biomass and
volume estimates to be obtained from diameter alone, which is the variable that is most easily
measured in the field. The results indicate higher biomass storage in the crowns of trees (as

114
compared to the bole of the same trees) in southern Amazonia (SA) than in central Amazonia
(CA), due to shorter boles at any given diameter in the SA trees. The results confirm that
previous equations developed in CA overestimate biomass if applied to SA trees. Simple
corrections to CA allometric equations were found to reflect lower wood density or shorter
boles resulted in biomass underestimates. The SA and CA allometric relationships were used
to adjust regional biomass estimates from large-scale wood-volume inventories. Current
values for adding crown biomass (biomass expansion factor) in dense forest were found to
result in a 6% overestimate and values adopted for adding small trees (volume expansion
factor) are underestimated by 25%. For the types of open forest studied in this study, the
equations that have been used in the past for adding crown biomass overestimate this
component by around 18%, and a new allometric equation is proposed. Finally, all corrections
were applied to adjust the estimates and produce a biomass map for Brazilian Amazonia from
2860 RadamBrasil plots. The total carbon stock (below- and above-ground) estimated to be
present at the time of the inventories was 60.8 Pg (=1015 g) for Brazilian Amazonia as a whole
(excluding non-forest areas). Deforestation through 2006 has reduced the stock in forest
biomass to 54.9 PgC.

115
GENERAL CONCLUSION
Chapter I concludes that the mean wood density values that have been widely used in
biomass estimates for the Amazon region as a whole were overestimated, probably because
they were obtained using datasets with uncertainties in methodology and that were restricted
as to forest type. The absence of a wood-density dataset directly sampled in the forest type
undergoing the most rapid deforestation is an important cause of overestimated carbon
emission for Brazilian Amazonia. Considering the forest type and species composition for
forests in southern and southwestern Amazonia, a downward adjustment by 13.6% is needed
relative to the mean used in many previous estimates. For the entire Brazilian Amazon, the
mean wood density previously estimated by Fearnside (1997) should be lowered by 7%, to
0.642. For mean wood density weighted by the volume deforested in 1990 in each forest type
the value is lowered by 9% to 0.631. The impacts on biomass estimates and on carbon
emissions are substantial because the greatest adjustment is necessary exactly in the forest
types undergoing the most deforestation. Estimates of net committed emissions for Brazilian
Amazonia in 1990 that already include wood density values weighted by the volumes of each
species present at the locations undergoing deforestation (e.g., Fearnside, 2000a,b with
adjustments described in Fearnside and Laurance, 2004) would be reduced by 10.7%: 23.4-
24.4 × 10⁶ Mg CO2-equivalent C/year for high and low trace gas scenarios, respectively. The
impact is sufficient to affect the global carbon balance. These new data will help to reduce
uncertainties in various previous biomass studies and in the carbon budget for the Amazon.
Chapter II shows that, spite of the importance of corrections for the heartwood density
dataset for improved biomass and carbon-flux estimates, linear regressions developed in
dense forest do not adequately describe radial variation in trees of open forest, southern
Amazonia (SA). Heartwood regressions from dense forest tend to overestimate the mean
density of disks or the mean of the bole in open forest. However, for corrections of variation
along the bole in open forest, the regression from dense forest provides an accurate correction
of the wood-density mean. Two new regressions described in this study allow basic wood
density to be obtained from the green density mean of the bole (either from samples taken at
breast height or from the mean of the bole). The equations can also be useful in studies of
water storage in trees. In open forests in southern Amazonia moisture content of the bole is
significantly higher than in dense forest in central Amazonia. For normalization of wood
densities from a variety of datasets an equation is needed that directly relates values from
116
cores taken with increment borers to the wood density of disks (heartwood, sapwood and
bark).
Chapter III concludes that in southwestern Amazon bamboo-dominated forest,
southwestern Amazon dense forest and southern Amazon open forest the trees are shorter
than in dense forest in the central Amazon. The height difference was greatest for small trees.
Generally the 2/3 scaling exponent predicted by metabolic ecology theory was violated by
large trees in the four Amazonian forests studied. When the Higuchi et al. (1998) equation
(which was developed for use in dense forests) is applied to biomass estimates in open forests
of south and southwestern Amazonia, the results have to be corrected for tree-height and
wood density effects. Together, the two effects represent reductions totaling 39% in
southwestern Amazon bamboo-dominated open forest, 22% in southwestern Amazon
bamboo-free dense forest and 16% in southern Amazonian open forest (respectively, 76, 65
and 45 Mg ha-1 lower dry biomass than dense forest in the central Amazon). Considering only
the height effect, estimated biomass is lowered by 21.5, 18.5 and 10.3 Mg ha-1, respectively,
in the southwestern Amazon bamboo-dominated forest, southwestern Amazon dense forest
and southern Amazon open forest. Revisions are needed in the estimates of biomass that have
been made using allometric equations developed in dense forest in the central Amazon. This
implies lower emissions of greenhouse gases than previously thought for deforestation in
Brazilian Amazonia, which is concentrated in the “arc of deforestation” in non-dense forest
types such as the ones studied here.
Finally, Chapter IV provides adjustments to biomass estimates for Amazonian forests.
A new allometric equations developed in this chapter allow accurate biomass and volume
estimates to be obtained from diameter alone, which is the variable that is most easily
measured in the field. The results indicate higher biomass storage in the crowns of trees (as
compared to the bole of the same trees) in southern Amazonia (SA) than in central Amazonia
(CA), due to shorter boles at any given diameter in the SA trees. The results confirm that
previous equations developed in CA overestimate biomass if applied to SA trees. Simple
corrections to CA allometric equations were found to reflect lower wood density or shorter
boles resulted in biomass underestimates. The SA and CA allometric relationships were used
to adjust regional biomass estimates from large-scale wood-volume inventories. Current
values for adding crown biomass (biomass expansion factor) in dense forest result in a 6%
overestimate and values adopted for adding small trees (volume expansion factor) are
underestimated by 25%. For the types of open forest studied here, the equations that have
been used in the past for adding crown biomass overestimate this component by around 18%,

117
and a new allometric equation is proposed. Finally, all corrections were applied to adjust the
estimates and produce a biomass map for Brazilian Amazonia from 2860 RadamBrasil plots.
The total carbon stock (below- and above-ground) estimated to be present at the time of the
inventories was 60.8 Pg (=1015 g) for Brazilian Amazonia as a whole (excluding non-forest
areas). Deforestation through 2006 has reduced the stock in forest biomass to 54.9 PgC.

118
REFERENCES
Achard, F.; Eva, H.D.; Mayaux, P.; Stibig, H-J.; Belward, A. 2004. Improved estimates of net
carbon emissions from land cover change in the tropics for the 1990s. Global
Biogeochemical Cycles, 18, GB2008, DOI: 10.1029/2003GB002142.
Achard, F.; Eva, H.D.; Stibig H-J.; Mayaux, P.; Gallego, J.; Richards, T.; Malingreau, J.-P.
2002. Determination of deforestation rates of the world’s humid tropical forests. Science,
297: 999-1002.
Alves, D.S.; Soares, J.V.; Amaral, S.; Mello, E.M.K.; Almeida, S.A.S.; Silva, O.F.; Silveira,
A.M. 1997. Biomass of primary and secondary vegetation in Rondônia, western Brazilian
Amazon. Global Change Biology, 3: 451-461.
Alvira, D.; Putz, F.E.; Frederiksen, T.S. 2004. Liana loads and post-logging liana densities
after liana cutting in a lowland forest in Bolivia. Forest Ecology and Management, 190: 73-
86.
Amorim, L.C. 1991. Variação da densidade básica no sentido radial em madeiras tropicais
da Amazônia. Relatório Final. PIBIC/CNPq. Instituto Nacional de Pesquisas da Amazônia
(INPA), Manaus, Amazonas, Brazil. 124 pp.
André, C.D.S.; Elian, S.N. 2000. Coefficients of determinations for variable selection in the
MSAE regression. Communications in Statistics – Theory and Methods, 29: 623-642.
Araujo, T.M.; Higuchi, N.; Carvalho Júnior, J.A. 1999. Comparison of formulae for biomass
content determination in a tropical rain forest site in the state of Pará, Brazil. Forest Ecology
and Management, 117: 43-52.
ASTM, 2002. Standard Test Methods for Specific Gravity of Wood and Wood-Based
Materials. Designation: D 2395-02. ASTM International, West Conshohocken, PA, USA. 8
pp.
Baker, T.R.; Phillips, O.L.; Malhi, Y.; Almeida, S.; Arroyo, L.; Di Fiore, A.; Killeen, T.J.;
Laurance, S.G.; Laurance, W.F.; Lewis, S.L.; Lloyd, J.; Monteagudo, A.; Neill, D.A.;
Patiño, S.; Pitman, N.C.A.; Silva, N.; Martínez, R.V. 2004. Variation in wood density
determines spatial patterns in Amazonian forest biomass. Global Change Biology, 10: 545-
562.
119
Barbosa, R.I.; Fearnside, P.M. 1996. Carbon and nutrient flows in an Amazonian forest: Fine
litter production and composition at Apiaú, Roraima, Brazil. Tropical Ecology, 37(1): 115-
125.
Bohlman, S.; O’Brien, S. 2006. Allometry, adult stature and regeneration requirement of 65
tree species on Barro Colorado Island, Panama. Journal of Tropical Ecology, 22: 123-136.
Borajas-Morales, J. 1987. Wood density gravity in species from two tropical forests in
Mexico. IAWA Journal, 8: 143-148.
Borchert, R. 1994. Soil and stem water storage determine phenology and distribution of
tropical dry forest trees. Ecology ,75(5): 1437-1449.
Borchert, R.; Pockman, W.T. 2005. Water storage capacitance and xylem tension in isolated
branches of temperate and tropical trees. Tree Physiology, 25: 457-466.
Bräker, O.U. 2001. Wood mass and density – a still unused dendro-resource for the carbon
cycle discussion. In: Kaennel Dobbertin. M.; Bräker, O.U. (Eds.). Abstracts of the
International Conference Tree Rings and People. Birmensdorf, Swiss Federal Research
Institute WSL. Davos, Switzerland.
Brazil, ANA/SIH 2006. Agência Nacional de Águas. Hidroweb, Sistemas de Informações
Hidrológicas (http://www.hidroweb.ana.gov.br/hidroweb/). Accessed 24/02/2006.
Brazil, IBAMA 1997. Madeiras da Amazônia: Características e Utilização, Amazônia
Oriental. Vol. 3. Instituto Brasileiro do Meio Ambiente e dos Recursos Naturais (IBAMA),
Brasília, DF, Brazil. 141 pp.
Brazil, IBDF 1981. Madeiras da Amazônia: Características e Utilização. Floresta Nacional
do Tapajós. Instituto Brasileiro do Desenvolvimento Florestal (IBDF), Conselho Nacional
do Densenvolvimento Científico e Tecnológico (CNPq), Brasília, DF, Brazil. 113 pp.
Brazil, IBDF 1983. Potencial Madeireiro do Grande Carajás. Instituto Brasileiro do
Desenvolvimento Florestal (IBDF), Brasília, DF, Brazil. 134 pp.
Brazil, IBDF 1988. Madeiras da Amazônia. Características e utilização; Estação
experimental de Curuá-Una / Amazonian Timbers. Characteristics and utilization; Curuá-
Una Experimental Forest Station, Vol. 2. Instituto Brasileiro de Desenvolvimento Florestal
(IBDF), Brasília, DF, Brazil. 236 pp.
Brazil, IBGE 1997. Diagnóstico Ambiental da Amazônia Legal. Instituto Brasileiro de
Geografia e Estatística (IBGE), Rio de Janeiro, Brazil. (CD-ROM using Vista-Map GIS,
produced by IBGE/DGC/DERNA-DEGEO-DECAR).
120
Brazil, INMET 2006. Instituto Nacional de Metereologia (INMET), Brasília, DF, Brazil
http://www.inmet.gov.br. Accessed 25/02/2006.
Brazil, INPA 1991. Catálogo de Madeiras da Amazônia. Instituto Nacional de Pesquisas da
Amazônia (INPA), Coordenação de Pesquisas em Produtos Florestais (CPPF), Manaus,
Amazonas, Brazil. 163 pp.
Brazil, INPE 2002. Monitoring of the Brazilian Amazonian Forest by Satellite 2000-2001.
Instituto Nacional de Pesquisas Espaciais (INPE), São José dos Campos, São Paulo, Brazil.
http://www.inpe/br/informacoes_Eventos/amazonia.htm. Accessed 09/08/2006.
Brazil, INPE 2006. Monitoramento da Floresta Amazônica Brasileira por satélite, Projeto
PRODES. Instituto Nacional de Pesquisas Espaciais (INPE), São José dos Campos, São
Paulo, Brazil. http://www.dpi.inpe.br/prodesdigital
Brazil, INPE 2007. Monitoramento da Floresta Amazônica Brasileira por satélite,
Projeto PRODES. Instituto Nacional de Pesquisas Espaciais (INPE), São José dos
Campos, São Paulo, Brazil. http://www.dpi.inpe.br/prodesdigital
Brazil, MCT 2004. Brazil’s Initial National Communication to the United Nations Framework
Convention on Climate Change. Ministry of Science and Technology (MCT), Brasília, DF,
Brazil, 271 pp.
Brazil, Projeto RadamBrasil 1973-1983. Levantamento de Recursos Naturais. Ministério das
Minas e Energia, Departamento Nacional de Produção Mineral, Rio de Janeiro, Brazil.
Brazil, Projeto RadamBrasil 1976. Folha SC 19, Rio Branco. Levantamento de Recursos
Naturais, Manaus. Departamento Nacional de Produção Mineral/Brasil. Rio de Janeiro,
Brazil. Vol. 12. 464 pp.
Brazil, Projeto RadamBrasil 1978. Folha SC.20, Porto Velho. Levantamento de Recursos
Naturais. Manaus. Departamento Nacional de Produção Mineral/Brasil. Rio de Janeiro, Vol.
16. 668 pp.
Brazil, Projeto RadamBrasil 1980. Folha SC.21, Juruena. Levantamento de Recursos
Naturais. Manaus. Departamento Nacional de Produção Mineral/Brasil. Rio de Janeiro, Vol.
20. 460 pp.
Brotero, F.A. 1956. Métodos de ensaios adotados no IPT para o estudo de madeiras
nacionais. Boletim 31, 2a. edição. Instituto de Pesquisas Tecnológicos (IPT), São Paulo,
Brazil. 28 pp.

121
Brown, I.F.; Martinelli, L.A.; Thomas, W.W.; Moreira, M.Z.; Ferreira, C.A.C.; Victoria, R.A.
1995. Uncertainty in the biomass of Amazonian forests: an example from Rondônia, Brazil.
Forest Ecology and Management, 75: 175-189.
Brown, I.F.; Nepstad, D.C.; Pires, I.O.; Luz, L.M.; Alechandre, A.S. 1992. Carbon storage
and land use in extractive reserves, Acre, Brazil. Environmental Conservation, 19: 307-315.
Brown, K.S.Jr.; Prance, G.T. 1987. Soils and vegetation. In: Whitmore, T.C; Prance, G.T.
(Eds). Biogeography and Quaternary History in Tropical America, Clarendon Press,
Oxford, U.K., p. 19-45.
Brown, S. 1997. Estimating biomass and biomass change of tropical forests: A Primer. FAO
Forestry Paper 134. Food and Agriculture Organization of the United Nations (FAO), Rome,
Italy. 55 pp.
Brown, S. 2002. Measuring carbon in forests: current status and future challenges.
Environmental Pollution, 116: 363-372.
Brown, S.; Gillespie, A.J.R.; Lugo, A.E. 1989. Biomass estimation methods for tropical forest
with applications to forest inventory data. Forest Science, 35: 881-902.
Brown, S., Lugo, A.E., 1992. Aboveground biomass estimates for tropical moist forests of the
Brazilian Amazon. Interciencia 17, 8-18.
Chambers, J.Q.; Santos, J.; Ribeiro, R.J.; Higuchi, N. 2001. Tree damage, allometric
relationship, and above-ground net primary production in central Amazon forest. Forest
Ecology and Management, 152: 73-84.
Chave, J.; Andalo, C.; Brown, S.; Cairns, M.A.; Chambers, J.Q.; Eamus, D.; Fölster, H.;
Fromard, F.; Higuchi, N.; Kira, T.; Lescure, J. –P.; Puig, H.; Riéra, B.; Yamakura, T. 2005.
Tree allometry and improved estimation of carbon stocks and balance in tropical forests.
Oecologia, 145: 87-99.
Chave, J.; Muller-Landau, H.C.; Baker, T.R.; Easdale, T.A.; ter Steege, H.; Webb, C.O. 2006.
Regional and phylogenetic variation of wood density across 2,456 neotropical tree species.
Ecological Applications, 16(6): 2356-2367.
Chave, J.; Riéra, B.; Dubois, M. 2001. Estimation of biomass in a neotropical Forest of
French Guiana: spatial and temporal variability. Journal of Tropical Ecology, 17: 79-96.
Chudnoff, M. 1976. Density of tropical timbers as influenced by climatic life zones.
Commonwealth Forestry Review, 55: 203-217.

122
Chudnoff, M. 1980. Tropical Timbers of the world. US Department of Agriculture, Forest
Service, Forest Products Laboratory, Madison, WI, USA. 831 pp.
Clark, D.A. 2007. Detecting tropical forests’ responses to global climatic and atmospheric
change: Current challenges and a way forward. Biotropica, 39: 4-19.
Clark, D.A.; Clark, D.B. 2001. Getting to the canopy: tree height growth in a neotropical rain
forest. Ecology, 82: 1460-1472.
Cook, D.R.; Weisberg, S. 1982. Residuals and influence in regression. Chapman and Hall,
New York, 230 pp.
Cox, P.M.; Betts, R.A.; Collins, M.; Harris, P.; Huntingford, C.; Jones, C.D. 2004.
Amazonian dieback under climate-carbon cycle projections for the 21st century. Theoretical
and Applied Climatology, 78: 137-156.
Cox, P.M.; Betts, R.A.; Jones, C.D.; Spall, S.A.; Totterdell, I.J. 2000. Acceleration of global
warming due to carbon-cycle feedbacks in a coupled climate model. Nature, 408: 184-187.
Cummings, D.L.; Kauffman, J.B.; Perry, D.A.; Hughes, R.F. 2002. Aboveground biomass and
structure of rainforests in the southwestern Brazilian Amazon. Forest Ecology and
Management, 163: 293-307.
da Silva, R.P. 2007. Alometria, estoque e dinâmica da biomassa de florestas primárias e
secundárias na região de Manaus (AM). Doctoral Thesis, Programa de Pós-graduação em
Ciências de Florestas Tropicais, Instituto Nacional de Pesquisas da Amazônia – INPA,
Manaus, Amazonas, Brazil, 152 pp.
Dantas, M.; Phillipson, J. 1989. Litterfall and litter nutrient content in primary and secondary
Amazonian 'terra firme' rain forest. Journal of Tropical Ecology, 5: 27-36.
Dawson, T.E. 1996. Determining water use by trees and forests from isotopic, energy balance
and transpiration analyses: the roles of tree size and hydraulic lift. Tree Physiology, 16: 263-
272.
de Castilho, C.V.; Magnusson, W.E.; de Araújo, R.N.O.; Luizão, R.C.C.; Luizão, F.J.; Lima,
A.P.; Higuchi, N. 2006. Variation in aboveground tree live biomass in a central Amazonian
Forest: Effects of soil and topography. Forest Ecology and Management, 234: 85-96.
de Souza, M.H.; Magliano, M.M.; Camargos, J.A.A.; de Souza, M.R. 2002. Madeiras
tropicais brasileiras (Brazilian Tropical woods). Second ed. Instituto Brasileiro do Meio
Ambiente e dos Recursos Naturais Renováveis, Edições IBAMA, Brasília, DF, Brazil. 152
pp.

123
DeFries, R.S.; Houghton, R.A.; Hansen, M.C.; Field, G.B.; Skole, D.; Townshend, J. 2002.
Carbon emissions from tropical deforestation and regrowth based on satellite observations
for the 1980s and 1990s. Proceedings of the National Academy of Sciences of the United
States of America, 99: 14256-14261.
Delaney, M.; Brown, S.; Lugo,A.E.; Torres-Lezama, A.; Quintero, N.B. 1998. The quantity
and turnover of dead wood in permanent forest plots in six life zones of Venezuela.
Biotropica, 30: 2-11.
DeWalt, S.J.; Chave, J. 2004. Structure and biomass of four lowland Neotropical forests.
Biotropica, 36: 7-19.
do Nascimento, C.C. 1993. Variabilidade da Densidade Básica e de Propriedades Mecânicas
de Madeiras da Amazônia. Master’s Thesis in Forestry Sciences, Universidade de São
Paulo, Escola Superior de Agricultura ‘Luiz de Queiroz’, Piracicaba, SP, Brazil. 129 pp.
dos Santos, J. 1996. Análise de modelos de regressão para estimar a fitomassa da floresta
tropical úmida de terra-firme da Amazônia Brasileira. Doctoral Thesis - Universidade
Federal de Viçosa, Minas Gerais, Brazil. 121 pp.
Enquist, B.J. 2002. Universal scaling in tree and vascular plant allometry: toward a general
quantitative theory linking plant form and function from cells to ecosystems. Tree
Physiology, 22: 1045-1064.
Enquist, B.J.; West, G.B.; Charnov, E.L.; Brown, J.H. 1999. Allometric scaling of production
and life-history variation in vascular plants. Nature, 401: 907-911.
Eva, H.D.; Achard, F.; Stibig, H-J.; Mayaux, P. 2003. Response to comment on
‘determination of deforestation rates of the world’s humid tropical forests’. Science, 299:
1015b.
Eva, H.D.; Belward, A.S.; Miranda, E.E.; di Bella, A.M.; Gond, V.; Huber, O.; Jones, S.;
Sgrenzaroli, M.; Fritz, E. 2004. A land cover map of south America. Global Change
Biology, 10: 731-744.
FAO 1988. Food and Agriculture Organization of the United Nations, Soil Map of the World
1:5,000,000. Revised Legend. FAO World Soil Resource Report 60, Rome, Italy.
Fearnside, P.M. 1997. Wood density for estimating forest biomass in Brazilian Amazonia.
Forest Ecology and Management, 90: 59-87.

124
Fearnside, P.M. 2000a. Greenhouse gas emissions from land-use change in Brazil's Amazon
region. In: Lal, R; Kimble, J. M.; Stewart, B.A. (Eds). Global Climate Change and Tropical
Ecosystems. Advances in Soil Science. CRC Press, Boca Raton, Florida, USA. p. 231-249.
Fearnside, P.M. 2000b. Global warming and tropical land-use change: greenhouse gas
emissions from biomass burning, decomposition and soils in forest conversion, shifting
cultivation and secondary vegetation. Climatic Change, 46: 115-158.
Fearnside, P.M. 2004. Are climate change impacts already affecting tropical forest biomass?
Global Environmental Change, 14(4): 299-302.
Fearnside, P.M. 2007. Uso da terra na Amazônia e as mudanças climáticas globais. Brazilian
Journal of Ecology, 10: 83-100.
Fearnside, P.M.; Ferraz, J. 1995. A conservation gap analysis of Brazil's Amazonian
vegetation. Conservation Biology, 9: 1134-1147.
Fearnside, P.M.; Graça, P.M.L.A.; Filho, N.L.; Rodrigues, F.J.A.; Robinson, J.M. 1999.
Tropical forest burning in Brazilian Amazonia: measurement of biomass loading, burning
efficiency and charcoal formation at Altamira, Pará. Forest Ecology and Management, 123:
65-79.
Fearnside, P.M.; Graça, P.M.L.A.; Leal Filho, N.; Rodrigues, F.J.A. 2001. Burning of
Amazonian rainforests: burning efficiency and charcoal formation in forest cleared for cattle
pasture near Manaus, Brazil. Forest Ecology and Management, 146: 115-128.
Fearnside, P.M.; Laurance, W.F. 2003. Comment on "Determination of deforestation rates of
the world's humid tropical forests". Science, 229: 1015a.
Fearnside, P.M.; Laurance, W.F. 2004. Tropical deforestation and greenhouse gas emissions.
Ecological Applications, 14: 982-986.
Fearnside, P.M.; Leal Jr., N.; Fernandes, F.M. 1993. Rainforest burning and the global carbon
budget: Biomass, combustion efficiency, and charcoal formation in the Brazilian Amazon.
Journal of Geophysical Research, 98: 16733-16743.
Feldalto, L.C.; Mendes, I.A.C.; Coradin, V.T.R. 1989. Madeiras da Amazônia: descrição do
lenho de 40 espécies ocorrentes na Floresta Nacional do Tapajós. Instituto Brasileiro do
Meio Ambiente e dos Recursos Naturais Renováveis (IBAMA), Brasília, DF, Brazil, 156
pp.

125
Feldpausch, T.R.; Jirka, S.; Passos, C.A.M.; Jasper, F.; Riha, S.J. 2005. When big trees fall:
Damage and carbon export by reduced impact logging in southern Amazonia. Forest
Ecology and Management, 219: 199-215.
Fernandes, N.P.; Jardim, F.C.S.; Higuchi, N. 1983. Tabelas de volume para floresta tropical
de terra-firme da Estação Experimental de Silvicultura Tropical do INPA. Acta Amazonica,
13(3-4): 537-545.
França, M.B. 2002. Modelagem de Biomassa Através do Padrão Espectral no Sudoeste da
Amazônia. Master’s Thesis, Instituto Nacional de Pesquisas da Amazônia/Fundação
Universidade Federal do Amazonas, Manaus, Amazonas, Brazil. 106pp.
Franken, M.; Irmler, U.; Klinge, H. 1979. Litterfall in inundation, riverine and terra firme
forests of central Amazonia. Tropical Ecology, 20: 225-235.
Gehring, C.; Park, S.; Denich, M. 2004. Liana allometric biomass equations for Amazonian
primary and secondary forest. Forest Ecology and Management, 195: 69-83.
Gentry, A.H. 1991. The distribution and evolution of climbing plants. In: Putz, F.E.; Mooney,
H.A. (Eds). The Biology of Vines. Cambridge University Press, Cambridge, U.K., p. 3-50.
Gerwing, J.J. 2002. Degradation of forests throught logging and fire in the eastern Brazilian
Amazon. Forest Ecology and Management, 157: 131-141.
Gerwing, J.J., Farias, D. 2000. Integrating liana abundance and forest stature into an estimate
of total above-ground biomass for an eastern Amazonian forest. Journal of Tropical
Ecology, 16: 327-335.
Glerum, B.B. 1960. Report to the Government of Brazil on a forest inventory in the Amazon
Valley. Part 5: Region between Rio Caete and Rio Maracassume. Expanded Technical
Assistance Program, FAO Report no. 1250. Food and Agriculture Organization, Rome,
Italy.
Glerum, B.B.; Smit, G. 1962. Report to the Government of Brazil on a combined forestry-soil
survey along the road BR-14 from São Miguel do Guama to Imperatriz. Expanded Program
of Technical. Assistance Report no. 1483. Food and Agriculture Organization, Rome, Italy.
Goldstein, G.; Andrade, J.L.; Meinzer, F.C.; Holbrook, N.M.; Cavelier, J.; Jackson, P.; Celis,
A. 1998. Stem water storage and diurnal patterns of water use in tropical forest canopy
trees. Plant Cell and Environment, 21: 397-406.

126
Graça, P.M.L.A.; Fearnside, P.M.; Cerri, C.C. 1999. Burning of Amazonian forest in
Ariquemes, Rondônia, Brazil: biomass, charcoal formation and burning efficiency. Forest
Ecology and Management, 120: 179-191.
Grace, J. 2004. Understanding and managing the global carbon cycle. Journal of Ecology, 92:
189-202.
Griscom, B.W.; Ashton, P.M.S. 2003. Bamboo control of forest succession: Guadua
sarcocarpa in southeastern Peru. Forest Ecology and Management, 175: 445-454.
Griscom, B.W.; Ashton, P.M.S. 2006. A self-perpetuating bamboo disturbance cycle in a
neotropical forest. Journal of Tropical Ecology, 22: 587-597.
Hacke, U.G.; Sperry, J.S.; Pockman, W.T.; Davis, S.D.; McCulloh, K.A. 2001. Trends in
wood density and structure are linked to prevention of xylem implosion by negative
pressure. Oecologia, 126: 457-461.
Hansen, J.; Sato, M.; Ruedy, R.; Lo, K.; Lea, D.W.; Medina-Elizade, M. 2006. Global
temperature change. PNAS, 103 (39): 14288-14293.
Heinsdijk, D. 1957. Report to the Government of Brazil on a forest inventory in the Amazon
Valley (Region between Rio Tapajós and Rio Xingu). Expanded Technical Assistance
Program FAO Report no. 601600. Food and Agriculture Organization, Rome, Italy.
Heinsdijk, D. 1958. Report to the Government of Brazil on a forest inventory in the Amazon
Valley. Part 3: Region between Rio Tapajós and Rio Madeira. FAO Report nº 969 & Part 4:
Region between Rio Tocatins and Rios Guama and Capin, FAO Report nº 992. Expanded
Technical Assistance Program (FAO/58/10/8131), Food and Agriculture Organization,
Rome, Italy.
Higuchi, N.; Santos, J.; Ribeiro, R.J.; Minette, L.; Biot, Y. 1998. Biomassa da parte aérea da
vegetação da floresta tropical úmida de terra-firme da Amazônia brasileira. Acta
Amazonica, 28(2): 153-166.
Higuchi, N.; Ramm, W. 1985. Developing bole wood volume equations for a group of tree
species of central Amazon (Brazil). Commonwealth Forestry Review, 64(1): 33-41.
Hinckley, T.M.; Richter, H.; Schulte, P.J. 1991. Water relations. In: Raghavendra, A.S. (Ed.).
Physiology of trees. John Wiley & Sons, New York, USA., p. 137-162.
Houghton, R.A. 2003a. Revised estimates of the annual net flux of carbon to the atmosphere
from changes in land use and land management 1850-2000. Tellus Series B-Chemical and
Physical Meteorology, 55: 378-390.

127
Houghton, R.A. 2003b. Why are estimates of the terrestrial carbon balance so different?
Global Change Biology, 9: 500-509.
Houghton, R.A. 2005. Aboveground forest biomass and the global carbon balance. Global
Change Biology, 11: 945-958.
Houghton, R.A.; Lawrence, K.T.; Hackler, J.L.; Brown, S. 2001. The spatial distribution of
forest biomass in the Brazilian Amazon: a comparison of estimates. Global Change Biology,
7: 731-746.
Houghton, R.A.; Skole, D.L.; Nobre, C.A.; Hackler, J.L.; Lawrence, K.T.; Chomentowski,
W.H. 2000. Annual fluxes of carbon from deforestation and regrowth in the Brazilian
Amazon. Nature, 403: 301-304.
IPCC 2001. Climate Change 2001: The Scientific Basis. Houghton, J.T.; Ding, Y.; Griggs,
D.J.; Noguer, M.; van der Linden, P.J.; Dai, X.; Maskell, K.; Johnson, C.A. (eds.)
Cambridge Univ Press, Cambridge, UK.
IPCC 2007. Climate Change 2007: The physical science basis. Contribution of Working
Group I to the Fourth Assessment Report of the Intergovernmental Panel on Climate
Change. WMO/UNEP, 18 pp.
Keller, M.; Palace, M.; Asner, G.P.; Pereira, R.; Silva, J.N.M. 2004. Coarse woody debris in
undisturbed and logged forests in the eastern Brazilian Amazon. Global Change Biology,
10: 784-795.
King, D.A.; Davies, S.J.; Nur Supardi, M.N.; Tan, S. 2005. Tree growth is related to light
interception and wood density in two mixed dipterocarp forests of Malaysia. Functional
Ecology, 19: 445-453.
King, D.A.; Davies, S.J.; Tan, S.; Noor, N.S.MD. 2006. The role of wood density and stem
support costs in the growth and mortality of tropical trees. Journal of Ecology, 94: 670-680.
Klinge, H. 1977. Fine litter production and nutrient return to the soil in three natural forest
stands of eastern Amazonia. Geo-Eco-Trop, 1: 159-167.
Klinge, H.; Rodrigues, W.A. 1968. Litter production in area of Amazonian terra firme forest.
Part I. Amazoniana, 1(4): 287-302.
Klinge, H.; Rodrigues, W.A. 1973. Biomass of a tierra firme forest of the Amazon basin. Acta
Cientifica Venezolana, 24: 225-237.
Klinge, H.; Rodrigues, W.A.; Brunig, E.; Fittkau, E.J. 1975. Biomass and structure in a
Central Amazonian rain forest. In: Golley, F.; Medina, E. (Eds.). Tropical Ecological

128
Systems: Trends in terrestrial and Aquatic Research. Nova York, Springer-Verlag. p. 115-
122.
Latham, P.A.; Zuuring, H.R.; Coble, D.W. 1998. A method for quantifying vertical forest
structure. Forest Ecology and Management, 104: 157-170.
Laurance, W.F.; Nascimento, H.E.M.; Laurance, S.G.; Andrade, A.; Ribeiro, J.E.L.S.;
Giraldo, J.P.; Lovejoy, T.E.; Condit, R.; Chave, J.; Harms, K.E.; D’Angelo, S. 2006. Rapid
decay of tree-community composition in Amazonian forest fragments. Proceedings of the
National Academy of Sciences of the USA, 103(50): 19010-19014.
Loetsch, F.; Zöhrer, F.; Haller, K.E. 1973. Forest Inventory. BLV Verlagsgesellschaft.
Munich, Germany, 469 pp.
Lugo, A.E.; Scatena, F.N. 1996. Background and catastrophic tree mortality in tropical moist,
wet, and rain forest. Biotropica, 28: 585-599.
Luizão, F.J. 1989. Litter production and mineral element input to the forest floor in a central
Amazonian Forest. Geojournal, 19(4): 407-417.
Luizão, F.J. 1995. Ecological studies in contrasting forest types in central Amazonian. Ph.D
Thesis, University of Stirling, UK. 288 pp.
Luizão, R.C.C.; Luizão, F.J.; Paiva, R.Q.; Monteiro, T.F.; Sousa, L.S.; Kruijt, B. 2004.
Variation of carbon and nitrogen cycling processes along a topographic gradient in a central
Amazonian forest. Global Change Biology, 10: 592-600.
Magnago, H.; Barreto, R.A.A.; Pastore, U. 1978. Projeto RADAMBRASIL. Folha SA. 20.
Parte IV Vegetação, Departamento Nacional de Produção Mineral, Rio de Janeiro, Brazil, p.
413-530.
Magnusson, W.E.; Mourão, G.M. 2005. Estatística sem matemática: a ligação entre as
questões e as análises. Editora Planta, Londrina, Paraná, Brazil. 138 pp.
Malhi, Y.; Baker, T.R.; Phillips, O.L.; Almeida, S.; Alvarez, E.; Arroyo, L.; Chave, J.;
Czimczik, C.I.; DiFiori, A.; Higuchi, N.; Killeen, T.J.; Laurance, S.G.; Laurance, W.F.;
Lewis, S.L.; Montoya, L.M.M.; Monteagudo, A.; Neill, D.A.; Vargas, P.N.; Patiño, S.;
Pitman, N.C.A.; Quesada, C.A.; Salomão, R.; Silva, J.N.M.; Lezama, A.T.; Martínez, R.V.;
Terborgh, J.; Vinceti, B.; Lloyd, J. 2004. The above-ground coarse wood productivity of
104 Neotropical forest plots. Global Change Biology, 10: 563-591.
Malhi, Y.; Wood, D.; Baker, T.R.; Wright, J.; Phillips, O.L.; Cochrane, T.; Meir, P.; Chave,
J.; Almeida, S.; Arroyo, L.; Higuchi, N.; Killeen, T.; Laurance, S.G.; Laurance, W.F.;

129
Lewis, S.L.; Monteagudo, A.; Neill, D.A.; Vargas, P.N.; Pitman, N.C.A.; Quesada, C.A.;
Salomão, R.; Silva, J.N.M.; Lezama, A.T.; Terborgh, J.; Martínez, R.V.; Vinceti, B. 2006.
The regional variation of aboveground live biomass in old-growth Amazonian forests.
Global Change Biology, 12: 1107-1138.
Marques-Filho, A.O.; Ribeiro, M.N.G.; Santos, J.M. 1981. Estudos climatológicos da Reserva
Florestal Ducke, Manaus, AM. IV-Precipitação. Acta Amazonica, 4: 759-768.
Martinelli, L.A.; Victoria, R.L.; Moreira, M.Z.; Arruda Jr., G.; Brown, I.F.; Ferreira, C.A.C.;
Coelho, L.F.; Lima, R.P.; Thomas, W.W. 1988. Implantação de parcelas para
monitoramento de dinâmica florestal na área de proteção ambiental, UHE Samuel,
Rondônia: Relatório Preliminar. Centro de Energia Nuclear na Agricultura (CENA),
Piracicaba, São Paulo, Brazil, 72 pp.
Mascaro, J.; Schnitzer, S.A.; Carson, W.P. 2004. Liana diversity, abundance, and mortality in
a tropical wet forest in Costa Rica. Forest Ecology and Management, 190: 3-14.
McGuire, A.D.; Sitch, S.; Clein, J.S.; Dargaville, R.; Esser, G.; Foley, J.; Heimann, M.; Joos,
F.; Kaplan, J.; Kicklighter, D.W.; Meier, R.A.; Melillo, J.M.; Moore III, B.; Prentice, I.C.;
Ramankutty, N.; Reichenau, T.; Schloss, A.; Tian, H.; Williams, L.J.; Wittenberg, U. 2001.
Carbon balance of the terrestrial biosphere in the twentieth century: Analyses of CO2,
climate and land use effects with four process-based 10 ecosystem models. Global
Biogeochemical Cycles, 15: 183-206.
Meinzer, F.C. 2003. Functional convergence in plant responses to the environment.
Oecologia, 134: 1-11.
Meinzer, F.C.; Andrade, J.L.; Goldstein, G.; Holbrook, N.M.; Cavelier, J.; Wright, S.J. 1999.
Partitioning of soil water among canopy trees in a seasonally dry tropical forest. Oecologia,
121: 293-301.
Meinzer, F.C.; Clearwater, M.J.; Goldstein, G. 2001. Water transport in trees: current
perspectives, new insights and some controversies. Environmental and Experimental
Botany, 45: 239-262.
Melo, J.E.; Coradin, V.T.R.; Mendes, J.C. 1990. Classes de densidade para madeiras da
Amazônia Brasileira. In: Anais do Congresso Florestal Brasileiro 6, vol.3, Campos do
Jordão, São Paulo, Sociedade Brasileira de Silvicultura, São Paulo, SP, Brazil, p. 695-699.
130
Monteiro, M.T.F. 2005. Interações na dinâmica do carbono e nutrientes da liteira entre a
floresta de terra firme e o igarapé de drenagem na Amazônia central. Master’s Thesis,
INPA/UFAM, 93 pp.
Moura, J.B. 1994. Estudo da forma do fuste e comparação de métodos de estimativa
volumétrica de espécies florestais da Amazônia brasileira. Master’s Thesis, Universidade
Federal do Paraná, Curitiba, Paraná, Brazil, 114 pp.
Muller-Landau, H.C. 2004. Interspecific and intersite variation in wood density of tropical
trees. Biotropica, 36: 20-32.
Muller-Landau, H.C.; Condit, R.S.; Chave, J.; Thomas, S.C.; Bohlman, S.A.;
Bunyavejchewin, S.; Davies, S.; Foster, R.; Gunatilleke, S.; Gunatilleke, N.; Harms, K.E.;
Hart, T.; Hubbell, S.P.; Itoh, A.; Kassim, A.R.; LaFrankie, J.V.; Lee, H.S.; Losos, E.;
Makana, J-R.; Ohkubo, T.; Sukumar, R.; Sun, I-F.; Nur Supardi, M.N.; Tan, S.; Thompson,
J.; Valencia, R.; Muñoz, G.V.; Wills, C.; Yamakura, T.; Chuyong, G.; Dattaraja, H.S.;
Esufali, S.; Hall, P.; Hernandez, C.; Kenfack, D.; Kiratiprayoon, S.; Suresh, H.S.; Thomas,
D.; Vallejo, M.I.; Ashton, P. 2006. Testing metabolic ecology theory for allometric scaling
of tree size, growth and mortality in tropical forests. Ecology Letters, 9: 575-588.
Nascimento, C.C. 1993. Variabilidade da Densidade Básica e de Propriedades Mecânicas de
Madeiras da Amazônia. Master’s Thesis in Forestry Sciences, Universidade de São Paulo,
Escola Superior de Agricultura ‘Luiz de Queiroz’, Piracicaba, SP, Brazil. 129 pp.
Nascimento, H.E.M.; Laurance, W.F. 2002. Total aboveground biomass in central Amazonian
rainforests: a landscape-scale study. Forest Ecology and Management, 168: 311-321.
Nelson, B.W. 1994. Natural forest disturbance and change in the Brazilian Amazon. Remote
Sensing Reviews, 10: 105-125.
Nelson, B.W.; Oliveira, A.C.; Vidalenc, D.; Smith, M.; Bianchini, M.C.; Nogueira, E.M.
2006. Florestas dominadas por tabocas trepadeiras do gênero Guadua, no sudoeste da
Amazônia. In: Anais do Seminário Nacional de Bambu, Faculdade de Arquitetura e
Urbanismo, Universidade de Brasília, Brasília, DF, Brazil. p. 49-55.
Nepstad, D.C. 1989. Forest regrowth on abandoned pastures in eastern Amazonia:
Limitations to tree seedling survival and crowth. PhD dissertation, Yale University, New
Haven, Connecticut, U.S.A., 234 pp.

131
Nepstad, D.; Lefebvre, P.; Silva, U.L.; Tomasella, J.; Schlesinger, P.; Solórzano, L.;
Moutinho, P.; Ray, D.; Benito, J.G. 2001. Amazon drought and its implications for forest
flammability and tree growth: a basin-wide analysis. Global Change Biology, 10: 704-717.
Nepstad, D.C.; Veríssimo, A.; Alencar, A.; Nobre, C.; Lima, E.; Lefebvre, P.; Schlesinger, P.;
Potterk, C.; Moutinho, P.; Mendoza, E.; Cochrane, M.; Brooks, V. 1999. Large-scale
impoverishment of Amazonian forests by logging and fire. Nature, 398: 505-508.
Neter, J.; Wasserman, W. 1974. Applied linear statistical models – Regression, Analysis of
Variance, and Experimental Designs. Richard D. Irwin, Inc. Homewood, Illinois, 842 pp.
Niklas, K.J.; Enquist, B.J. 2001. Invariant scaling relationships for interspecific plant biomass
production rates and body size. Proceedings of the National Academy of Sciences of the
USA, 98: 2922-2927.
Niklas, K.J.; Spatz, H-C. 2004. Growth and hydraulic (not mechanical) constraints govern the
scaling of tree height and mass. Proceedings of the National Academy of Sciences of the
USA, 101: 15661-15663.
Nogueira, A. 2006. Variação da densidade, área basal e biomassa de lianas em 64 km2 de
floresta de terra-firme na Amazônia central. Master’s thesis, Instituto Nacional de
Pesquisas da Amazônia/Fundação Universidade do Amazonas, Manaus, Amazonas, Brazil,
55 pp.
Nogueira, E.M.; Fearnside, P.M.; Nelson, B.W.; França, M.B. 2007. Wood density in forests
of Brazil’s ‘arc of deforestation’: Implications for biomass and flux of carbon from land-use
change in Amazonia. Forest Ecology and Management, 248: 119-135.
Nogueira, E.M.; Fearnside, P.M.; Nelson, B.W. submitted. Linear regressions for
normalization of wood density in biomass estimates of Amazon forests.
Nogueira, E.M.; Nelson, B.W.; Fearnside, P.M. 2005. Wood density in dense forest in central
Amazonia, Brazil. Forest Ecology and Management, 208: 261-286.
Nogueira, E.M.; Nelson, B.W.; Fearnside, P.M. 2006. Volume and biomass of trees in central
Amazonia: Influence of irregularly shaped and hollow trunks. Forest Ecology and
Management, 227: 14-21.
Nogueira, E.M.; Nelson, B.W.; Fearnside, P.M.; França, M.B.; Oliveira, A.C.A., 2008. Tree
Height in Brazil’s ‘Arc of Deforestation’: Shorter trees in south and southwest Amazonia
imply lower biomass. Forest Ecology and Management, doi:10.1016/j.foreco.2008.02.002

132
O’Brien, S.T.; Hubbell, S.P.; Spiro, P., Condit, R.; Foster, R.B. 1995. Diameter, height, crown
and age relationships in eight neotropical tree species. Ecology, 76: 1926-1939.
Oliveira, L.C.S. 1981. A variação da massa específica aparente da madeira em função do
teor de umidade. IPT, n.2. Notas técnicas em secagem de madeiras. São Paulo, SP, Brazil.
Oliveira, L.L.; Fontinhas, R.L.; Lima, A.M.M.; Lima, R.J.S. 2004. Mapas dos parâmetros
climatológicos do estado do Pará: umidade, temperatura e insolação, médias anuais.
In: Anais do XIII Congresso Brasileiro de Meteorologia, Fortaleza, Ceará, Brazil. 7 pp.
http://www.para30graus.pa.gov.br/meteorologia.htm. Accessed 09/03/2007.
Ott, R.L.; Longnecker, M.T. 2001. An Introduction to Statistical Methods and Data Analysis
(5th ed.). Duxbury Press, Belmont, California, 1184 pp.
Overman, J.P.M.; White, H.J.L.; Saldarriaga, J.G. 1994. Evaluation of regression models for
above-ground biomass determination in Amazon rainforest. Journal of Tropical Ecology,
10: 207-218.
Palace, M.; Keller, M.; Asner, G.P.; Silva, J.N.M.; Passos, C. 2007. Necromass in undisturbed
and logged forests in the Brazilian Amazon. Forest Ecology and Management, 238: 309-
318.
Parolin, P.; Ferreira, L.V. 1998. Are there differences in specific wood gravities between trees
in várzea and igapó (Central Amazonia)? Ecotropica, 4: 25-32.
Pauletto, D. 2006. Estoque e produção de liteira grossa em floresta submetida à exploração
seletiva de madeira no noroeste de Mato Grosso. Master’s Thesis, Instituto Nacional de
Pesquisas da Amazônia/Fundação Universidade do Amazonas, Manaus, Amazonas, Brazil,
78 pp.
Pereira, N.W.V.; Venturin, N.; Machado, E.L.M.; Scolforo, J.R.S.; Macedo, R.L.G.;
d`Oliveira, M.V.N. 2005. Análise das variações temporais na florística e estrutura da
comunidade arbórea de uma floresta explorada com plano de manejo. Revista Cerne, 11:
263-282.
Perez, J.W. 1970. Relation of crown diameter to stem diameter in forests of Puerto Rico,
Dominica, and Thailand. In: Odum, H.T.; Pigeon, R.F. (Eds.). A tropical Rain Forest – a
study of irradiation and ecology at El Verde, Puerto Rico. Office of Information Services
U.S. Atomic Energy Commission, Oak Ridge, Tennessee. p. B-105 – 122.
Phillips, O.L.; Baker, T.R.; Arroyo, L.; Higuchi, N.; Killeen, T.J.; Laurance, W.F.; Lewis,
S.L.; Lloyd, J.; Malhi, Y.; Monteagudo, A.; Neill, D.A.; Vargas, P.N.; Silva, J.N.M.;

133
Terborgh, J.; Martínez, R.V.; Alexiades, M.; Almeida, S.; Almeida, S.; Brown, S.; Chave,
J.; Comiskey, J.A.; Czimczik, C.I.; Di Fiore, A.; Erwin, T.; Kuebler, C.; Laurance, S.G.;
Nascimento, H.E.M.; Olivier, J.; Palacios, W.; Patiño, S.; Pitman, N.C.A.; Quesada, C.A.;
Saldias, M.; Lezama, A.T.; Vinceti, B. 2004. Pattern and process in Amazon tree turnover,
1976-2001. Philosophical Transactions of the Royal Society of London B, 359: 381-407.
Pitt, J. 1961. Application of silvicultural methods to some of the forests of the Amazon. FAO,
Expanded Technical Assistance Program, Report to the Government of Brazil, no 1337,
Rome, Italy, 94 pp.
Putz, F.E. 1983. Liana biomass and leaf area of a “Tierra Firme” forest in the Rio Negro
Basin, Venezuela. Biotropica, 15(3): 185-189.
Putz, F.E. 1984. Natural history of lianas on Barro Colorado Island, Panama. Ecology, 65:
1713-1724.
Putz, F.E.; Coley, P.D.; Lu, K.; Montalvo, A.; Aiello, A. 1983. Uprooting and snapping of
trees: Structural determinants and ecological consequences. Canadian Journal of Forest
Research, 13: 1011-1020.
Reich, P.B.; Borchert, R. 1984. Water stress and tree phenology in a tropical dry forest in the
lowlands of Costa Rica. Journal of Ecology, 72: 61-74.
Reid, Collins and Associates 1977. Jari Hog Fuel Study: Investigation of Moisture Content,
Specific Gravity, Rate of Drying and other related proprieties of Indigenous Hardwood
Species at Jari, Brazil. Progress Report, Dry Season Sampling and Results, Vancouver, BC,
Canada. 63 pp.
Restom, T.G.; Nepstad, D.C. 2004. Seedling growth dynamics of a deeply rooting liana in a
secondary forest in eastern Amazonia. Forest Ecology and Management, 190: 109-118.
Revilla Cardenas, J.D. 1986. Estudos de ecologia e controle ambiental na região do
reservatório da UHE de Samuel. Convênio: Eletronorte/MCT/CNPq/INPA de 01.07.82.
Relatório Setorial, Segmento: Estimativa de Fitomassa. Período julho-dezembro 1986.
Instituto Nacional de Pesquisas da Amazônia, Manaus, Amazonas, Brazil. 194 pp.
Revilla Cardenas, J.D. 1987. Levantamento e análise da fitomassa da UHE de Kararaô
(Relatório). Rio Xingu. Instituto Nacional de Pesquisas da Amazônia, Manaus, Amazonas,
Brazil. 181 pp.

134
Revilla Cardenas, J.D. 1988. Levantamento e análise da fitomassa da UHE de Babaquara,
Rio Xingu (Relatório). Instituto Nacional de Pesquisas da Amazônia, Manaus, Amazonas,
Brazil. 277 pp.
Reyes, G.; Brown, S.; Chapman, J.C.; Lugo, A.E. 1992. Wood densities of tropical tree
species. USDA Forest Service. General Technical Report S0-88. Southern Forest
Experiment Station, New Orleans, Louisiana, USA. 15 pp.
Ribeiro, J.E.L.S.; Hopckins, M.J.C.; Vicentini, A.; Sothers, C.A.; Costa, M.A.S.; Brito, J.M.;
Souza, M.A.D.; Martins, L.H.P.; Lohmann, L.G.; Assunção, P.A.C.L.; Pereira, E.C.; Silva,
C.; Mesquita, M.R.; Procópio, L.C. 1999. Flora da Reserva Ducke: guia de identificação
das plantas vasculares de uma floresta de terra-firme na Amazônia central. INPA/DFID,
Manaus, Amazonas, Brazil. 816 pp.
Ribeiro, R.J. 1996. Estudos de função de forma para espécies florestais de terra-firme da
Amazônia. Master’s Thesis, Instituto Nacional de Pesquisas da Amazônia/Fundação
Universidade do Amazonas, Manaus, Amazonas, Brazil, 76 pp.
Rice, A.H.; Pyle, E.H.; Saleska, S.R.; Hutyra, L.; Carmargo, P.B.; Portilho, K.; Marques,
D.F.; Wofsy, S.F. 2004. Carbon balance and vegetation dynamics in an old-growth
Amazonian forest. Ecological Applications, 14(4): S55–S71.
Rice, K.; Brokaw, N.; Thompson, J. 2004. Liana abundance in a Puerto Rican forest. Forest
Ecology and Management, 190: 33-41.
Roth, I. 1981. Structural pattern in tropical barks. Encyclopedia of plant anatomy. Volume
IX/3. Gebrüder Bornträger, Berlin, Germany.
Rozendaal, D.M.A.; Hurtado, V.H.; Poorter, L. 2006. Plasticity in leaf traits of 38 tropical tree
species in response to light; relationships with light demand and adult stature. Functional
Ecology, 20: 207-216.
Russel, C.E. 1983. Nutrient cycling and productivity of native and plantation forests at Jari
florestal, Pará, Brazil. Ph.D Thesis, University of Georgia, Athens, Georgia, U.S.A. 135 pp.
Saatchi, S.S.; Houghton, R.A.; Alvalá, R.C.S.; Soares, J.V.; Yu, Y. 2007. Distribution of
aboveground live biomass in the Amazon basin. Global Change Biology, 13: 816-837.
Saldarriaga, J.G.; West, D.C.; Tharp, M.L.; Uhl, C. 1988. Long-term chronosequence of
forest succession in the upper Rio Negro of Colombia and Venezuela. Journal of Ecology,
76: 938-958.

135
Sallenave, P. 1955. Propriétés physiques et mécaniques des bois tropicaux de l’Union
Française. Centre Technique Forestier Tropical, Nogent sur Marne, France.
Sallenave, P. 1964. Propriétés physiques et mécaniques des bois tropicaux. Premier
Supplément. Centre Technique Forestier Tropical, Nogent sur Marme, France.
Sallenave, P. 1971. Propriétés physiques et mécaniques des bois tropicaux. Deuxième
Supplément. Centre Technique Forestier Tropical, Nogent sur Marne, France.
Schnitzer, S.A.; Dalling, J.; Carson, W.P. 2000. The impact of lianas on tree regeneration in
tropical forest canopy gaps: evidence for an alternative pathway of gap-phase regeneration.
Journal of Ecology, 88: 655-666.
Schulze, E.D.; Mooney, H.A.; Bullock, S.H.; Mendoza, A. 1988. Water contents of wood of
tropical deciduous forests during the dry season. Boletin Sociedad Botanica de Mexico, 48:
113-118.
Scott, D.A.; Proctor, J.; Thompson, J. 1992. Ecological studies on a lowland evergreen rain
forest on Maracá Island, Roraima, Brazil. II. Litter and nutrient cycling. Journal of Ecology,
80: 705-717.
Sheil, D. 1995. A critique of permanent plot methods and analysis with examples from
Budongo Forest, Uganda. Forest Ecology and Management, 77: 11-34.
Silva, M.F.F. 1984. Produção anual de serrapilheira e seu conteúdo mineralógico na mata
tropical de terra firme, Tucuruí-PA. Boletim do Museu Paraense Emílio Goeldi, Série
Botânica, 1: 111-158.
Silva, M.F.F.; Lobo, M.G.A. 1982. Nota sobre deposição de matéria orgânica em floresta de
terra-firme, várzea e igapó. Boletim do Museu Paraense Emílio Goeldi, Nova Série:
Botânica, Belém, (56): 1-13.
Silveira, M. 1999. Ecological aspects of bamboo-dominated forest in southwestern Amazonia:
an ethnoscience perspective. Ecotropica, 5: 213-216.
Simpson, W.; TenWolde, A. 1999. Physical properties and moisture relations of wood.
Chapter. 3. In: Forest Products Laboratory. Wood Handbook-wood as an engineering
material. Gen. Tech. Rep. FPL-GTR-113. United States Department of Agriculture, Forest
Service, Forest Products Laboratory, Madison, Wisconsin, USA. 463 pp.
Simpson, W.T. 1993. Specific Gravity, Moisture Content, and Density Relationship for
Wood. General Technical Report FPL-GTR-76. United States Department of Agriculture,
Forest Service, Forest Products Laboratory, Madison, Wisconsin, USA. 13 pp.

136
Sokal, R.R.; Rohlf, F.J. 1995. Biometry, 3rd Ed., W.H. Freeman & Company, San Francisco,
California, 880 pp.
Sombroek, W.G. 2000. Amazon land forms and soils in relation to biological diversity. Acta
Amazonica, 30: 81-100.
Sterck, F.J.; van Gelder, H.A.; Poorter, L. 2006. Mechanical branch constraints contribute to
life-history variation across tree species in a Bolivian forest. Journal of Ecology, 94: 1192-
1200.
Summers, P.M. 1998. Estoque, decomposição e nutrientes da liteira grossa em floresta de
terra-firme na Amazônia Central. Master’s Thesis. INPA/UFAM. Manaus, AM. 105pp.
Suzuki, E. 1999. Diversity in specific gravity and water content of wood among Bornean
tropical rainforest trees. Ecological Research, 14: 211-224.
ter Steege, H.; Hammond, D.S. 2001. Character convergence, diversity, and disturbance in
tropical rain forest in Guyana. Ecology, 82: 3197-3212.
ter Steege, H.; Pitman, N.C.A.; Phillips, O.L.; Chave, J.; Sabatier, D.; Duque, A.; Molino, J-
F.; Prévost, M-F.; Spichiger, R.; Castellanos, H.; von Hildebrand, P.; Vásquez, R. 2006.
Continental-scale patterns of canopy tree composition and function across Amazonia.
Nature, 443: 444-447.
ter Steege, H.; Pitman, N.C.A.; Sabatier, D.; Castellanos, H.; van der Hout, P.; Daly, D.C.;
Silveira, M.; Phillips, O.; Vasquez, R.; van Andel, T.; Duivenvoorden, J.; Oliveira, A.A.;
Ek, R.; Lilwah, R.; Thomas, R.; van Essen, J.; Baider, C.; Maas, P.; Mori, S.; Terborgh, J.;
Vargas, P.N.; Mogollón, H.; Morawetz, W. 2003. A spatial model of tree alpha-diversity
and tree density for the Amazon. Biodiversity and Conservation, 12: 2225-2277.
ter Steege, H.; Sabatier, D.; Castellanos, H.; van Andel, T.; Duivenvoorden, J.; Oliveira, A.A.;
Ek, R.; Lilwah, R.; Mass, P.; Mori, S. 2000. An analysis of the floristic composition and
diversity of Amazonian forests including those of the Guiana Shield. Journal of Tropical
Ecology, 16: 801-828.
Terborgh, J.; Andresen, E. 1998. The composition of Amazonian forests: patterns at local and
regional scales. Journal of Tropical Ecology, 14: 645-664.
Terborgh, J.; Vargas, P.N.; Mogollón, H.; Morawetz, W. 2003. A spatial model of tree alpha-
diversity and tree density for the Amazon. Biodiversity and Conservation, 12: 2225-2277.
Trugilho, P.F.; Silva, D.A.; Frazão, F.J.L.; Matos, J.L.M. 1990. Comparação de métodos de
determinação da densidade básica em madeira. Acta Amazonica, 20 307-319.
137
Tuomisto, H.; Ruokolainen, K.; Kalliola, R.; Linna, A.; Danjoy, W.; Rodriguez, Z. 1995.
Dissecting Amazonian biodiversity. Science, 269: 63-66.
Uhl, C.; Buschbacher, R.; Serrão, E.A.S. 1988. Abandoned pastures in eastern Amazonia, I:
Pattern of plant succession. Journal of Ecology, 76: 663-681.
van Gelder, H.A.; Poorter, L.; Sterck, F.J. 2006. Wood mechanics, allometry, and life-history
variation in a tropical rain forest tree community. New Phytologist, 171: 367-378.
Veloso, H.P.; Rangel Filho, A.L.R.; Lima, J.C.A. 1991. Classificação da Vegetação
Brasileira, Adaptada a um Sistema Universal. IBGE, Rio de Janeiro, Brazil. 123 pp.
Vidalenc, D. 2000. Distribuição das florestas dominadas pelo bambu Guadua weberbaueri
em escala de paisagem no sudoeste da Amazônia e fatores edáficos que afetam sua
densidade. Master’s Thesis, Instituto Nacional de Pesquisas da Amazônia/Fundação
Universidade Federal do Amazonas, Manaus, Amazonas, Brazil. 92 pp.
Villela, D.M.; Proctor, J. 1999. Litterfall mass, chemistry, and nutrient retranslocation in a
monodominant forest on Maracá island, Roraima, Brazil. Biotropica, 31(2): 198-211.
Weiner, J.; Thomas, S.C. 1992. Competition and allometry in three species of annual plants.
Ecology, 73: 648-656.
West, G.B.; Brown, J.H.; Enquist, B.J. 1999. A general model for the structure and allometry
of plant vascular systems. Nature, 400: 664-667.
Wiemann, M.C.; Williamson, G.B. 1988. Extreme radial changes in wood specific gravity in
some tropical pioneers. Wood and Fiber Science, 20(3): 344-349.
Wiemann, M.C.; Williamson, G.B. 1989. Radial gradients in the specific gravity of wood in
some tropical and temperate trees. Forest Science, 35: 197-210.
Wiemann, M.C.; Williamson, G.B. 2002. Geographic variation in wood specific gravity:
Effects of latitude, temperature, and precipitation. Wood Fiber Science, 34: 96-107.
Wilkinson, L. 1990. SYSTAT: The system for statistics. SYSTAT Inc., Evanston, Illinois,
U.S.A.
Wittmann, F.; Schöngart, J.; Parolin, P.; Worbes, M.; Piedade, M.T.F.; Junk, W.J. 2006.
Wood specific gravity of trees in Amazonian white-water forests in relation to flooding.
IAWA Journal, 27(3): 255–266.
Woodcock, D.W. 2000. Wood specific gravity of trees and forest types in the southern
Peruvian Amazon. Acta Amazonica, 30: 589-599.
138
Woodcock, D.W.; Shier, A.D. 2002. Wood specific gravity and its radial variations: the many
ways to make a tree. Trees – Structure and Functions, 16: 437-443.
Woodcock, D.W.; Shier, A.D. 2003. Does canopy position affect wood specific gravity in
temperate forest trees? Annals of Botany, 91: 529-537.
Wright, S.J.; Muller-Landau, H.C.; Condit, R.; Hubbell, S.P. 2003. Gap-dependent
recruitment, realized vital rates, and size distributions of tropical trees. Ecology, 84: 3174-
3185.
Yamazaki, D.R.; Costa, A.M.R.; Azevedo, W.P. 1978. Projeto RADAMBRASIL, Folha AS.
20, Parte III – Pedologia, Departamento Nacional de Produção Mineral, Rio de Janeiro, RJ,
Brazil, p. 247-410.

139Appendix A. Mean basic density of the bole (cross-sectional disk of wood with bark) by species or morpho-species for four sites in the southern portion of Brazilian Amazonia.
Family Scientific name Mean of the bole (st. deviation) n
Anacardiaceae Anacardium giganteum W. Hancock ex Engl. 0.445 1 Fabaceae Andira inermis (W. Wright) Kunth ex. DC. 0.650 1 Annonaceae Annona ambotay Aubl. 0.605 1 Tiliaceae Apeiba echinata Gaertner 0.265 1 Apocynaceae Aspidosperma cf. spruceanum Mull. Arg. 0.726 (0.010) 2 Anacardiaceae Astronium le-cointei Ducke 0.638 (0.062) 7Moraceae Batocarpus amazonicus (Ducke) Fosberg 0.604 1 Bixaceae Bixa arborea Huber 0.332 1Moraceae Brosimum acutifolium Huber ssp. interjectum C.C. Berg 0.511 1 Moraceae Brosimum gaudichaudii Trécul 0.644 1 Moraceae Brosimum guianense (Aubl.) Huber 0.766 (0.065) 3 Moraceae Brosimum lactescens (S. Moore) C.C.Berg. 0.627 (0.048) 6 Urticaceae Castilloa ulei Warb 0.410 1 Cecropiaceae Cecropia sciadophylla Mart. 0.310 1 Ulmaceae Celtis schippii Standl. 0.669 1 Hippocrateaceae Cheiloclinium cognatum (Miers) A.C. Smith 0.703 (0.025) 11
Sapotaceae Chrysophyllum lucentifolium Cronquist ssp. pachicardium Pires T. D. Pen 0.737 1
Sapotaceae Chrysophyllum sp. 0.728 1 Moraceae Clarisia racemosa Ruiz & Pav. 0.526 1 Cochlospermaceae Cochlospermum orinocense (Kunth) Steud. 0.394 1 Euphorbiaceae Conceveiba guianensis Aubl. 0.556 1 Caesalpinioideae Copaifera multijuga Hayne 0.563 (0.009) 2 Boraginaceae Cordia ecalyculata Vell. 0.467 1 Boraginaceae Cordia sp. 0.550 1 Boraginaceae Cordia sprucei Mez 0.467 (0.022) 2 Euphorbiaceae Croton palanostigma Klotzsch 0.454 1 Fabaceae Diplotropis purpurea var. leptophylla (Kleinhoonte) Amshoff 0.674 (0.053) 2 Sapotaceae Ecclinusa guianensis Eyma 0.613 (0.124) 4 Mimosoideae Enterolobium sp. 0.379 1 Bombacaceae Eriotheca globosa (Aubl.) Robyns 0.590 1 Myrtaceae Eugenia anastomosans DC. 0.594 1 Annonaceae Fusaea longifolia (Aubl.) Saff. 0.657 (0.035) 4 Nyctaginaceae Guapira noxia (Netto) Lundell 0.533 1 Meliaceae Guarea cf. humaitensis T.D. Penn. 0.513 1 Meliaceae Guarea grandifolia DC. 0.623 1 Meliaceae Guarea kunthiana A.Juss. 0.492 1 Meliaceae Guarea sp. 0.613 1 Meliaceae Guarea trunciflora C. DC. 0.607 (0.016) 2 Annonaceae Guatteria citriodora Ducke 0.516 1 Annonaceae Guatteria sp. 0.487 1 Sterculiaceae Guazuma sp. 0.484 1 Lecythidaceae Gustavia augusta L. 0.604 1 Chrysobalanaceae Hirtella cf. racemosa Lam. 0.761 1 Chrysobalanaceae Hirtella sp. 0.699 1 Caesalpinioideae Hymenaea courbaril L. 0.785 1 Fabaceae Hymenolobium cf. pulcherrimum Ducke 0.586 (0.023) 2 Fabaceae Hymenolobium modestum Ducke 0.538 1 Fabaceae Hymenolobium nitidum Benth. 0.632 1 Fabaceae Hymenolobium sericeum Ducke 0.715 1 Mimosoideae Inga alba (Swartz.) Willd. 0.588 1

140Appendix A. (continued)
Family Scientific name Mean of the bole (standard deviation) n
Mimosoideae Inga flagelliformis (Vell.) Mart. 0.496 1 Mimosoideae Inga stipularis DC. 0.676 1Mimosoideae Inga thibaudiana DC. ssp. thibaudiana 0.657 1 Myristicaceae Iryanthera sagotiana Warb. 0.551 1Rubiaceae Isertia hypoleuca Benth. 0.484 1 Flacourtiaceae Laetia procera (Poepp.) Eichler 0.615 1 Tiliaceae Lueheopsis duckeana Burret 0.546 (0.022) 2 Moraceae Maquira calophylla (Planch. & Endl.) C.C. Berg 0.617 (0.095) 3 Moraceae Maquira sclerophylla (Ducke) C.C. Berg 0.416 1 Sapindaceae Matayba cf. purgans (Poepp. & Endl.) Radlk. 0.565 1 Rutaceae Metrodorea flavida K. Krause 0.693 (0.046) 5 Melastomataceae Miconia holosericea (L.) DC. 0.587 1 Memecylaceae Mouriri duckeanoides Morley 0.704 1 Moraceae Naucleopsis caloneura (Huber) Ducke 0.453 1 Nyctaginaceae Neea cf. oppositifolia Ruiz & Pav. 0.454 1 Lauraceae Ocotea aciphylla (Nees) Mez 0.466 (0.112) 2Lauraceae Ocotea longifolia H.B.K. 0.558 1 Lauraceae Ocotea nitida (Meissn.) Rohwer 0.536 1Lauraceae Ocotea sp. 0.702 1 Mimosoideae Parkia sp. 0.624 1 Violaceae Paypayrola grandiflora Tul. 0.492 (0.021) 2 Fabaceae Poeppigia procera C. Presl 0.531 1
Cecropiaceae Pourouma cf. tomentosa Miq. ssp. apiculata (Bem.) C.C. Berg. & van Heus. 0.379 (0.016) 2
Cecropiaceae Pourouma minor Benoist 0.423 (0.046) 4 Sapotaceae Pouteria anomala (Pires) T.D. Penn. 0.680 (0.011) 4 Sapotaceae Pouteria cf. campanulata Baehni 0.690 (0.069) 3 Sapotaceae Pouteria cf. cladantha Sandwith 0.615 1 Sapotaceae Pouteria cf. glomerata (Miq.) Radlk. 0.643 (0.088) 4 Sapotaceae Pouteria reticulata (Engl.) Eyma 0.682 (0.034) 2 Sapotaceae Pouteria sp. 0.681 1 Burseraceae Protium cf. decandrum (Aubl.) March. 0.562 (0.028) 2 Burseraceae Protium cf. spruceanum (Benth.) Engl. 0.568 (0.008) 2 Burseraceae Protium guianensis (Aubl.) Marchand 0.665 1 Burseraceae Protium sp. 0.620 1 Burseraceae Protium tenuifolium (Engl.) Engl. 0.553 1 Moraceae Pseudolmedia laevis (Ruiz & Pav.) Macbr. 0.593 (0.041) 7 Moraceae Pseudolmedia macrophylla Trécul 0.588 (0.049) 4 Annonaceae Pseudoxandra obscurinervis Maas 0.691 1 Vochysiaceae Qualea cf. paraensis Ducke 0.553 1 Bombacaceae Quararibea ochrocalyx (K. Schum.) Vischer 0.563 (0.024) 5 Violaceae Rinoreocarpus ulei (Melch.) Ducke 0.589 1 Euphorbiaceae Sapium glandulosum (L.) Morong 0.441 1 Sapotaceae Sarcaulus sp. 0.680 1 Araliaceae Schefflera morototoni (Aubl.) Frodin 0.423 (0.036) 2 Caesalpinioideae Sclerolobium cf. micropetalum Ducke 0.553 (0.123) 3 Caesalpinioideae Sclerolobium cf. setiferum Ducke 0.438 1 Caesalpinioideae Sclerolobium sp. 0.576 1 Caesalpinioideae Sclerolobium sp. 0.645 1 Caesalpinioideae Sclerolobium sp. 0.511 1 Caesalpinioideae Sclerolobium sp. 0.380 1

141Appendix A. (continued)
Family Scientific name Mean of the bole (standard deviation) n
Caesalpinioideae Sclerolobium sp. 0.463 1 Simaroubaceae Simarouba amara Aubl. 0.344 1 Siparunaceae Siparuna sp. 0.436 1 Sterculiaceae Sterculia excelsa Mart. 0.455 (0.015) 2 Sterculiaceae Sterculia pruriens (Aubl.) K. Schum. 0.344 1 Sterculiaceae Sterculia sp. 0.387 1 Bignoniaceae Tabebuia sp. 0.713 1 Sapindaceae Talisia cerasina (Benth.) Radlk. 0.825 1 Burseraceae Tetragastris altissima (Aubl.) Swart 0.646 (0.033) 8 Burseraceae Tetragastris panamensis (Engl.) Kuntze 0.666 1 Sterculiaceae Theobroma microcarpum Mart. 0.476 (0.031) 5 Sterculiaceae Theobroma speciosum Willd. ex Spreng 0.495 (0.029) 6 Sapindaceae Toulicia guianensis Aubl. 0.671 (0.029) 2 Clusiaceae Tovomita sp. 0.713 1 Burseraceae Trattinnickia cf. peruviana Loes. 0.515 1 Meliaceae Trichilia cf. rubra C. DC. 0.790 1 Meliaceae Trichilia guianensis Klotzsch ex C. DC. 0.804 1 Meliaceae Trichilia micrantha Benth. 0.683 (0.064) 8 Meliaceae Trichilia quadrijuga Kunth 0.620 1 Meliaceae Trichilia sp. 0.765 1 Meliaceae Trichilia sp. 0.558 1 Meliaceae Trichilia sp. 0.764 1 Humiriaceae Vantanea guianensis Aubl. 0.816 1 Humiriaceae Vantanea sp. 0.799 1 Myristicaceae Virola cf. venosa (Benth.) Warb. 0.427 1

142Appendix B. Basic density at breast height (cross-sectional disk of wood with bark) in southwestern Amazonia for two forest types: open bamboo-dominated forest and dense bamboo-free forest. The content below is same dataset used by França (2002) after identification of botanical specimens. However, the information in erratum notices appended to França (2002, Annex I) was incorporated into the corrected values for Acre used here.
Family Scientific name Basic density at breast height n
Mimosaceae Acacia paniculata Willd. 0.472 1 Mimosaceae Acacia paraensis Ducke 0.554 2 Fabaceae Alexa sp. 0.665 1 Sapindaceae Allophylus pilosus (J.F. Macbr.) A.H. Gentry 0.614 5 Ulmaceae Ampelocera edentula Kuhl 0.804 1 Fabaceae Andira multistipula Ducke 0.675 1 Tiliaceae Apeiba echinata Gaertner 0.391 2 Tiliaceae Apeiba tibourbou Aubl. 0.242 1 Olacaceae Aptandra tubicina (Poepp.) Benth. ex Miers 0.605 1 Apocynaceae Aspidosperma ulei Markgr. 0.670 1 Anacardiaceae Astronium le-cointei Ducke 0.691 2 Sterculiaceae Basiloxylon sp. 0.175 1 Moraceae Batocarpus cf. amazonicus (Ducke) Fosberg 0.605 1 Fabaceae Bocoa alterna (Benth.) R. S. Cowan 0.747 1 Bombacaceae Bombacopsis macrocalyx (Ducke) Robyns 0.362 2 Monimiaceae Bracteanthus glycycarpus Ducke 0.677 1
Moraceae Brosimum alicastrum subsp. bolivarense (Pittier) C.C. Berg 0.618 1
Moraceae Brosimum guianense (Aubl.) Huber 0.602 1 Moraceae Brosimum lactescens (S. Moore) C.C.Berg. 0.632 2 Combretaceae Buchenavia grandis Ducke 0.753 1 Myrtaceae Calyptranthes sp. 0.480 1 Myrtaceae Calyptranthes sp. 0.818 1 Euphorbiaceae Caryodendron grandifolium (Mull. Arg.) Pax 0.644 5 Flacourtiaceae Casearia javintensis H.B.K. 0.571 1 Flacourtiaceae Casearia pitumba Sleumer 0.519 1 Flacourtiaceae Casearia sp. 0.621 1 Flacourtiaceae Casearia sp. 0.723 1 Olacaceae Cathedra acuminata (Benth.) Miers 0.658 1 Bombacaceae Cavanillesia sp. 0.153 1 Bombacaceae Cavanillesia sp. 0.192 1 Cecropiaceae Cecropia distachya Huber 0.438 1 Cecropiaceae Cecropia ficifolia Warb. ex Snethl. 0.277 1 Cecropiaceae Cecropia latiloba Miq. 0.271 1 Cecropiaceae Cecropia sciadophylla Mart. 0.456 1 Bombacaceae Ceiba insignis (Kunth) P.E. Gibbs & Semir 0.410 3 Cochlospermaceae cf. Cochlospermum sp. 0.790 1 Sapotaceae Chrysophyllum sp. 0.589 1 Verbenaceae Citharexylum macrophyllum Poir. 0.538 1 Moraceae Clarisia biflora Ruiz & Pav. 0.498 1 Moraceae Clarisia ilicifolia (Spreng.) Lanj. & Rossb. 0.672 1 Fabaceae Clathrotropis macrocarpa Ducke 0.675 1 Caesalpinioideae Copaifera multijuga Hayne 0.547 1 Boraginaceae Cordia alliodora (Ruiz & Pav.) Oken 0.372 1 Boraginaceae Cordia sp. 0.640 1 Euphorbiaceae Drypetes variabilis Uittien 0.713 5 Annonaceae Duguetia quitarensis Benth. 0.754 2 Annonaceae Duguetia spixiana Mart. 0.613 1 Fabaceae Dypterix alata Vogel 0.936 1 Lecythidaceae Eschweilera aff. coriacea (DC.) Mart. ex Berg. 0.615 1
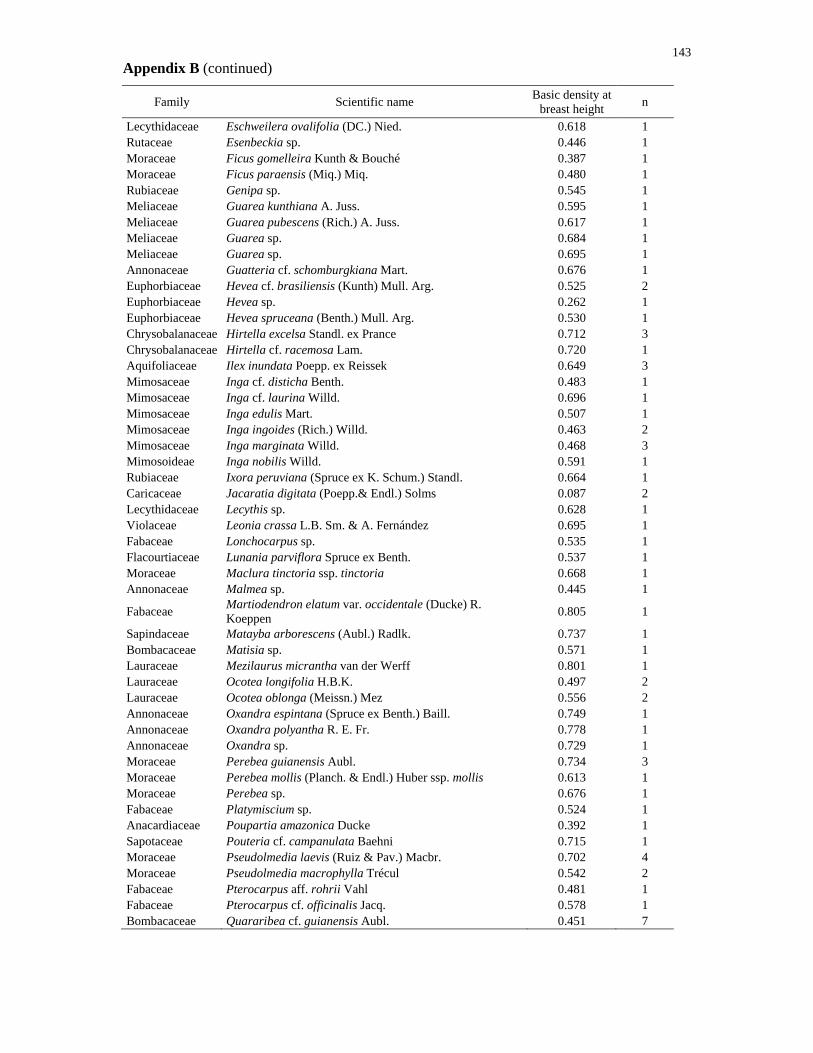
143Appendix B (continued)
Family Scientific name Basic density at breast height n
Lecythidaceae Eschweilera ovalifolia (DC.) Nied. 0.618 1 Rutaceae Esenbeckia sp. 0.446 1 Moraceae Ficus gomelleira Kunth & Bouché 0.387 1 Moraceae Ficus paraensis (Miq.) Miq. 0.480 1 Rubiaceae Genipa sp. 0.545 1 Meliaceae Guarea kunthiana A. Juss. 0.595 1 Meliaceae Guarea pubescens (Rich.) A. Juss. 0.617 1 Meliaceae Guarea sp. 0.684 1 Meliaceae Guarea sp. 0.695 1 Annonaceae Guatteria cf. schomburgkiana Mart. 0.676 1 Euphorbiaceae Hevea cf. brasiliensis (Kunth) Mull. Arg. 0.525 2 Euphorbiaceae Hevea sp. 0.262 1 Euphorbiaceae Hevea spruceana (Benth.) Mull. Arg. 0.530 1 Chrysobalanaceae Hirtella excelsa Standl. ex Prance 0.712 3 Chrysobalanaceae Hirtella cf. racemosa Lam. 0.720 1 Aquifoliaceae Ilex inundata Poepp. ex Reissek 0.649 3 Mimosaceae Inga cf. disticha Benth. 0.483 1 Mimosaceae Inga cf. laurina Willd. 0.696 1 Mimosaceae Inga edulis Mart. 0.507 1 Mimosaceae Inga ingoides (Rich.) Willd. 0.463 2 Mimosaceae Inga marginata Willd. 0.468 3 Mimosoideae Inga nobilis Willd. 0.591 1 Rubiaceae Ixora peruviana (Spruce ex K. Schum.) Standl. 0.664 1 Caricaceae Jacaratia digitata (Poepp.& Endl.) Solms 0.087 2 Lecythidaceae Lecythis sp. 0.628 1 Violaceae Leonia crassa L.B. Sm. & A. Fernández 0.695 1 Fabaceae Lonchocarpus sp. 0.535 1 Flacourtiaceae Lunania parviflora Spruce ex Benth. 0.537 1 Moraceae Maclura tinctoria ssp. tinctoria 0.668 1 Annonaceae Malmea sp. 0.445 1
Fabaceae Martiodendron elatum var. occidentale (Ducke) R. Koeppen 0.805 1
Sapindaceae Matayba arborescens (Aubl.) Radlk. 0.737 1 Bombacaceae Matisia sp. 0.571 1 Lauraceae Mezilaurus micrantha van der Werff 0.801 1 Lauraceae Ocotea longifolia H.B.K. 0.497 2 Lauraceae Ocotea oblonga (Meissn.) Mez 0.556 2 Annonaceae Oxandra espintana (Spruce ex Benth.) Baill. 0.749 1 Annonaceae Oxandra polyantha R. E. Fr. 0.778 1 Annonaceae Oxandra sp. 0.729 1 Moraceae Perebea guianensis Aubl. 0.734 3 Moraceae Perebea mollis (Planch. & Endl.) Huber ssp. mollis 0.613 1 Moraceae Perebea sp. 0.676 1 Fabaceae Platymiscium sp. 0.524 1 Anacardiaceae Poupartia amazonica Ducke 0.392 1 Sapotaceae Pouteria cf. campanulata Baehni 0.715 1 Moraceae Pseudolmedia laevis (Ruiz & Pav.) Macbr. 0.702 4 Moraceae Pseudolmedia macrophylla Trécul 0.542 2 Fabaceae Pterocarpus aff. rohrii Vahl 0.481 1 Fabaceae Pterocarpus cf. officinalis Jacq. 0.578 1 Bombacaceae Quararibea cf. guianensis Aubl. 0.451 7
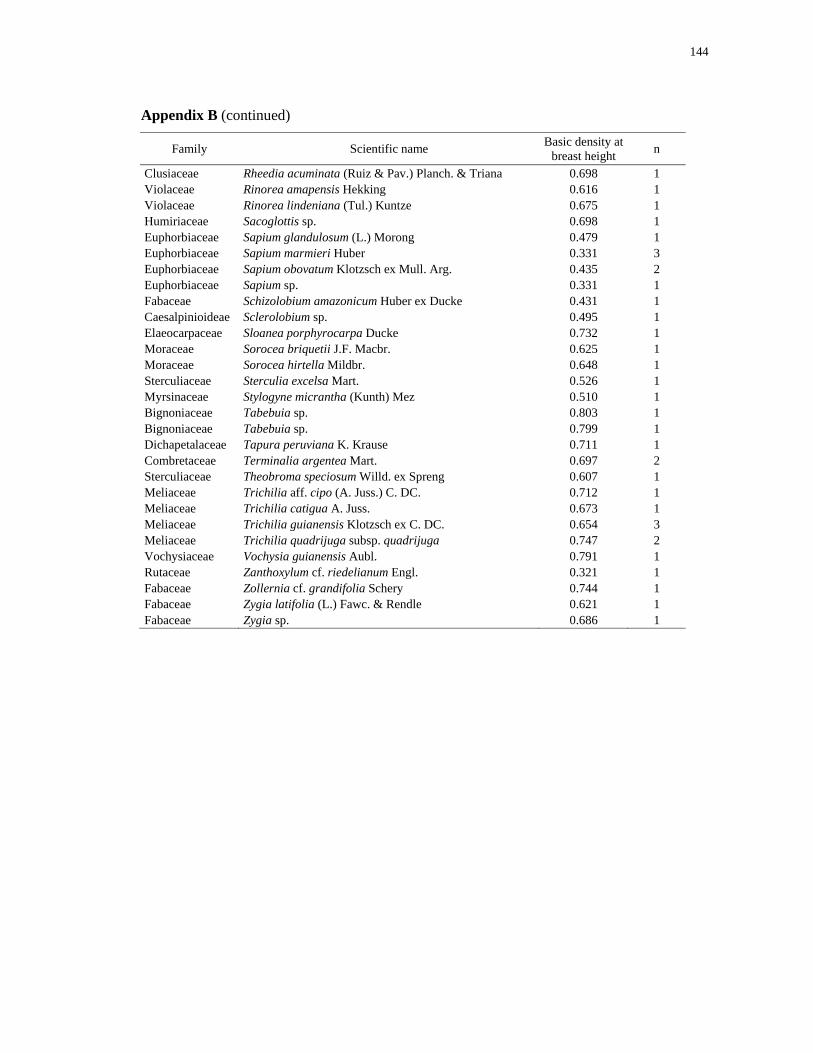
144
Appendix B (continued)
Family Scientific name Basic density at breast height n
Clusiaceae Rheedia acuminata (Ruiz & Pav.) Planch. & Triana 0.698 1 Violaceae Rinorea amapensis Hekking 0.616 1 Violaceae Rinorea lindeniana (Tul.) Kuntze 0.675 1 Humiriaceae Sacoglottis sp. 0.698 1 Euphorbiaceae Sapium glandulosum (L.) Morong 0.479 1 Euphorbiaceae Sapium marmieri Huber 0.331 3 Euphorbiaceae Sapium obovatum Klotzsch ex Mull. Arg. 0.435 2 Euphorbiaceae Sapium sp. 0.331 1 Fabaceae Schizolobium amazonicum Huber ex Ducke 0.431 1 Caesalpinioideae Sclerolobium sp. 0.495 1 Elaeocarpaceae Sloanea porphyrocarpa Ducke 0.732 1 Moraceae Sorocea briquetii J.F. Macbr. 0.625 1 Moraceae Sorocea hirtella Mildbr. 0.648 1 Sterculiaceae Sterculia excelsa Mart. 0.526 1 Myrsinaceae Stylogyne micrantha (Kunth) Mez 0.510 1 Bignoniaceae Tabebuia sp. 0.803 1 Bignoniaceae Tabebuia sp. 0.799 1 Dichapetalaceae Tapura peruviana K. Krause 0.711 1 Combretaceae Terminalia argentea Mart. 0.697 2 Sterculiaceae Theobroma speciosum Willd. ex Spreng 0.607 1 Meliaceae Trichilia aff. cipo (A. Juss.) C. DC. 0.712 1 Meliaceae Trichilia catigua A. Juss. 0.673 1 Meliaceae Trichilia guianensis Klotzsch ex C. DC. 0.654 3 Meliaceae Trichilia quadrijuga subsp. quadrijuga 0.747 2 Vochysiaceae Vochysia guianensis Aubl. 0.791 1 Rutaceae Zanthoxylum cf. riedelianum Engl. 0.321 1 Fabaceae Zollernia cf. grandifolia Schery 0.744 1 Fabaceae Zygia latifolia (L.) Fawc. & Rendle 0.621 1 Fabaceae Zygia sp. 0.686 1

145
Appendix C. Dry mass of trees directly sampled in open forest in southern Amazonia. Measurements of diameter (in cm) were taken at breast height or just above buttresses. Bole dry mass (in Kg), obtained considering moisture content in each tree (or mean value when absent) and including the mass of the stump. Crown dry mass was obtained considering 47.6 % as moisture content (see section 2.3).
Scientific name Diameter Bole Crown Scientific name Diameter Bole Crown
Pseudolmedia macrophylla Trécul 5.157 4.931 1.834 Trichilia cf. rubra C. DC. 7.321 44.979 14.882 Guarea sp. 5.507 14.309 2.306 Pourouma minor Benoist 7.480 6.918 7.284 Ocotea longifolia H.B.K. 5.570 5.662 3.825 Protium cf. spruceanum (Benth.) Engl. 7.480 6.998 4.873 Ocotea cf. aciphylla (Nees) Mez 5.634 5.320 4.035 Fusaea longifolia (Aubl.) Saff. 7.576 21.878 9.327 Maquira calophylla (Planch. & Endl.) C.C. Berg 5.730 7.388 2.201 Brosimum guianense (Aubl.) Huber 7.639 15.072 6.550 Sclerolobium sp. 5.793 8.279 2.463 Sclerolobium cf. micropetalum Ducke 7.703 11.359 9.170 Cheiloclinium cognatum (Miers) A.C. Smith 5.825 7.507 3.458 Theobroma speciosum Willd. ex Spreng 7.703 15.206 2.096 Miconia holosericea (L.) DC. 5.825 7.986 4.087 Theobroma speciosum Willd. ex Spreng 7.703 25.019 1.048 Pouteria reticulata (Engl.) Eyma 5.984 14.236 4.402 Enterolobium sp. 7.703 21.409 4.192 Naucleopsis glabra Spruce ex Pittier 6.048 11.658 6.550 Cordia sprucei Mez 7.703 33.942 1.572 Sterculia sp. 6.112 4.646 2.096 Brosimum guianense (Aubl.) Huber 7.830 25.049 4.978 Cheiloclinium cognatum (Miers) A.C. Smith 6.207 6.577 6.812 Pseudolmedia laevis (Ruiz & Pav.) Macbr. 7.862 17.512 6.550 Cheiloclinium cognatum (Miers) A.C. Smith 6.207 8.036 6.026 Pouteria cf. cladantha Sandwith 7.862 23.474 5.974 Swartzia polyphylla DC. 6.271 10.106 3.825 Quararibea ochrocalyx (K. Schum.) Vischer 7.862 15.776 5.450 Guarea cf. humaitensis T.D. Penn. 6.303 9.360 3.773 Virola cf. venosa (Benth.) Warb. 7.894 14.932 3.668 Protium cf. spruceanum (Benth.) Engl. 6.303 9.555 5.240 Trichilia guianensis Klotzsch ex C. DC. 8.085 79.689 16.244 Cheiloclinium cognatum (Miers) A.C. Smith 6.366 7.216 4.454 Maquira calophylla (Planch. & Endl.) C.C. Berg 8.117 13.955 9.432 Simarouba amara Aubl. 6.366 4.145 4.087 Astronium le-cointei Ducke 8.212 15.780 3.668 Fusaea longifolia (Aubl.) Saff. 6.398 9.725 5.869 Cordia sprucei Mez 8.212 42.586 2.201 Pourouma minor Benoist 6.462 4.008 7.336 Pseudoxandra obscurinervis Maas 8.308 24.409 13.467 Guarea kunthiana A.Juss. 6.462 11.011 4.611 Guatteria sp. 8.435 22.126 2.620 Pseudima frutescens (Aubl.) Radlk. 6.462 13.676 1.100 Iryanthera sagotiana Warb. 8.499 24.144 6.393 Protium guianensis (Aubl.) Marchand 6.462 12.001 10.270 Pouteria cf. campanulata Baehni 8.531 28.203 6.812 Sclerolobium sp. 6.589 13.446 5.240 Trichilia micrantha Benth. 8.594 28.856 5.869 Trichilia micrantha Benth. 6.685 10.369 8.856 Naucleopsis caloneura (Huber) Ducke 8.658 17.148 11.423 Sclerolobium sp. 6.685 9.414 1.310 Poeppigia procera C. Presl 8.722 23.343 7.860 Cheiloclinium cognatum (Miers) A.C. Smith 6.780 11.575 10.847 Cheiloclinium cognatum (Miers) A.C. Smith 8.881 18.416 16.087 Brosimum lactescens (S. Moore) C.C.Berg. 6.780 10.354 4.192 Pseudolmedia macrophylla Trécul 8.881 30.032 7.860 Theobroma speciosum Willd. ex Spreng 6.907 10.288 6.131 Metrodorea flavida K. Krause 8.913 22.789 23.318 Trichilia micrantha Benth. 6.907 44.145 9.432 Trichilia sp. 8.913 33.617 20.960 Astronium le-cointei Ducke 7.035 14.187 2.253 Trichilia sp. 9.040 26.189 36.575 Trichilia sp. 7.066 13.747 4.716 Pseudolmedia laevis (Ruiz & Pav.) Macbr. 9.072 18.547 12.576 Pouteria cf. campanulata Baehni 7.257 27.261 5.240 Pseudolmedia laevis (Ruiz & Pav.) Macbr. 9.104 29.287 6.655
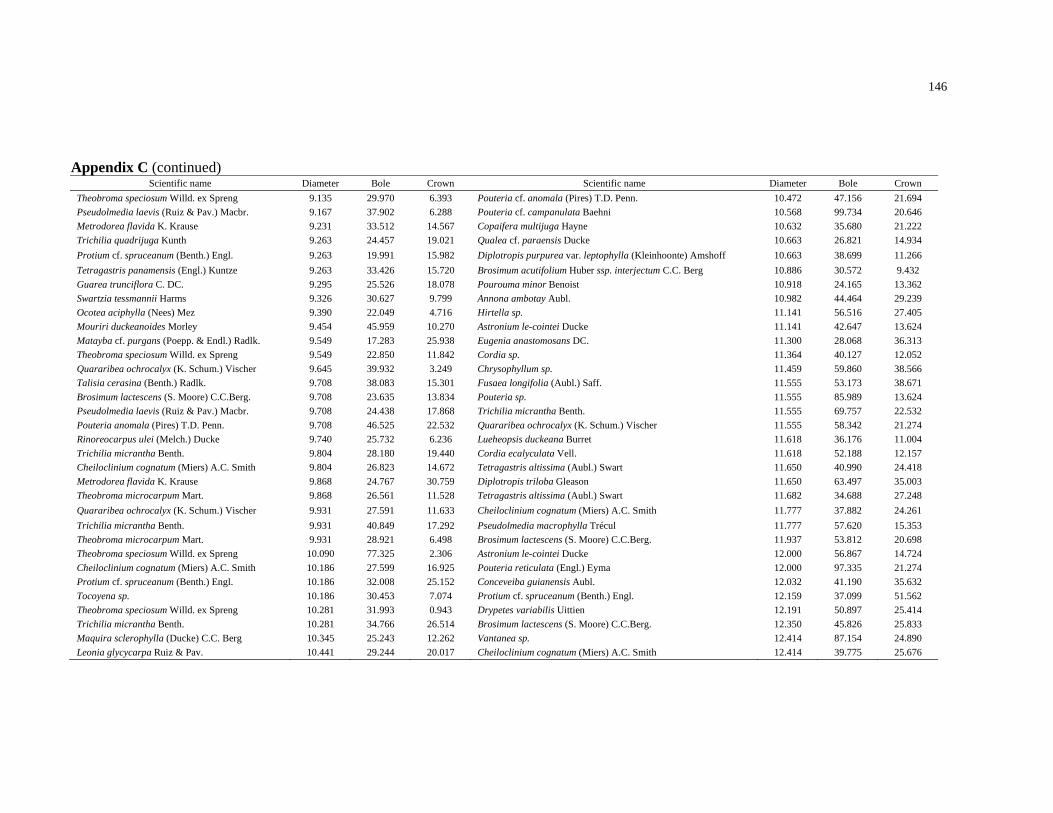
146
Appendix C (continued)
Scientific name Diameter Bole Crown Scientific name Diameter Bole Crown Theobroma speciosum Willd. ex Spreng 9.135 29.970 6.393 Pouteria cf. anomala (Pires) T.D. Penn. 10.472 47.156 21.694 Pseudolmedia laevis (Ruiz & Pav.) Macbr. 9.167 37.902 6.288 Pouteria cf. campanulata Baehni 10.568 99.734 20.646 Metrodorea flavida K. Krause 9.231 33.512 14.567 Copaifera multijuga Hayne 10.632 35.680 21.222 Trichilia quadrijuga Kunth 9.263 24.457 19.021 Qualea cf. paraensis Ducke 10.663 26.821 14.934 Protium cf. spruceanum (Benth.) Engl. 9.263 19.991 15.982 Diplotropis purpurea var. leptophylla (Kleinhoonte) Amshoff 10.663 38.699 11.266 Tetragastris panamensis (Engl.) Kuntze 9.263 33.426 15.720 Brosimum acutifolium Huber ssp. interjectum C.C. Berg 10.886 30.572 9.432 Guarea trunciflora C. DC. 9.295 25.526 18.078 Pourouma minor Benoist 10.918 24.165 13.362 Swartzia tessmannii Harms 9.326 30.627 9.799 Annona ambotay Aubl. 10.982 44.464 29.239 Ocotea aciphylla (Nees) Mez 9.390 22.049 4.716 Hirtella sp. 11.141 56.516 27.405 Mouriri duckeanoides Morley 9.454 45.959 10.270 Astronium le-cointei Ducke 11.141 42.647 13.624 Matayba cf. purgans (Poepp. & Endl.) Radlk. 9.549 17.283 25.938 Eugenia anastomosans DC. 11.300 28.068 36.313 Theobroma speciosum Willd. ex Spreng 9.549 22.850 11.842 Cordia sp. 11.364 40.127 12.052 Quararibea ochrocalyx (K. Schum.) Vischer 9.645 39.932 3.249 Chrysophyllum sp. 11.459 59.860 38.566 Talisia cerasina (Benth.) Radlk. 9.708 38.083 15.301 Fusaea longifolia (Aubl.) Saff. 11.555 53.173 38.671 Brosimum lactescens (S. Moore) C.C.Berg. 9.708 23.635 13.834 Pouteria sp. 11.555 85.989 13.624 Pseudolmedia laevis (Ruiz & Pav.) Macbr. 9.708 24.438 17.868 Trichilia micrantha Benth. 11.555 69.757 22.532 Pouteria anomala (Pires) T.D. Penn. 9.708 46.525 22.532 Quararibea ochrocalyx (K. Schum.) Vischer 11.555 58.342 21.274 Rinoreocarpus ulei (Melch.) Ducke 9.740 25.732 6.236 Lueheopsis duckeana Burret 11.618 36.176 11.004 Trichilia micrantha Benth. 9.804 28.180 19.440 Cordia ecalyculata Vell. 11.618 52.188 12.157 Cheiloclinium cognatum (Miers) A.C. Smith 9.804 26.823 14.672 Tetragastris altissima (Aubl.) Swart 11.650 40.990 24.418 Metrodorea flavida K. Krause 9.868 24.767 30.759 Diplotropis triloba Gleason 11.650 63.497 35.003 Theobroma microcarpum Mart. 9.868 26.561 11.528 Tetragastris altissima (Aubl.) Swart 11.682 34.688 27.248 Quararibea ochrocalyx (K. Schum.) Vischer 9.931 27.591 11.633 Cheiloclinium cognatum (Miers) A.C. Smith 11.777 37.882 24.261 Trichilia micrantha Benth. 9.931 40.849 17.292 Pseudolmedia macrophylla Trécul 11.777 57.620 15.353 Theobroma microcarpum Mart. 9.931 28.921 6.498 Brosimum lactescens (S. Moore) C.C.Berg. 11.937 53.812 20.698 Theobroma speciosum Willd. ex Spreng 10.090 77.325 2.306 Astronium le-cointei Ducke 12.000 56.867 14.724 Cheiloclinium cognatum (Miers) A.C. Smith 10.186 27.599 16.925 Pouteria reticulata (Engl.) Eyma 12.000 97.335 21.274 Protium cf. spruceanum (Benth.) Engl. 10.186 32.008 25.152 Conceveiba guianensis Aubl. 12.032 41.190 35.632 Tocoyena sp. 10.186 30.453 7.074 Protium cf. spruceanum (Benth.) Engl. 12.159 37.099 51.562 Theobroma speciosum Willd. ex Spreng 10.281 31.993 0.943 Drypetes variabilis Uittien 12.191 50.897 25.414 Trichilia micrantha Benth. 10.281 34.766 26.514 Brosimum lactescens (S. Moore) C.C.Berg. 12.350 45.826 25.833 Maquira sclerophylla (Ducke) C.C. Berg 10.345 25.243 12.262 Vantanea sp. 12.414 87.154 24.890 Leonia glycycarpa Ruiz & Pav. 10.441 29.244 20.017 Cheiloclinium cognatum (Miers) A.C. Smith 12.414 39.775 25.676
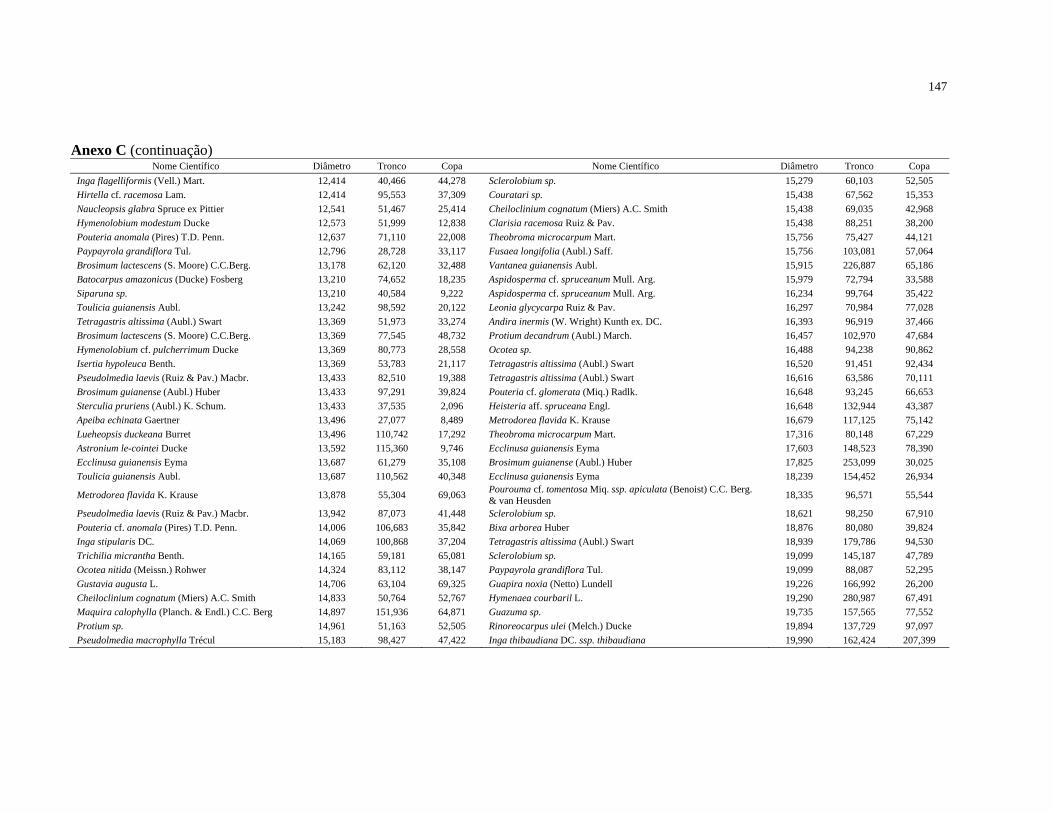
147
Anexo C (continuação) Nome Científico Diâmetro Tronco Copa Nome Científico Diâmetro Tronco Copa
Inga flagelliformis (Vell.) Mart. 12,414 40,466 44,278 Sclerolobium sp. 15,279 60,103 52,505 Hirtella cf. racemosa Lam. 12,414 95,553 37,309 Couratari sp. 15,438 67,562 15,353 Naucleopsis glabra Spruce ex Pittier 12,541 51,467 25,414 Cheiloclinium cognatum (Miers) A.C. Smith 15,438 69,035 42,968 Hymenolobium modestum Ducke 12,573 51,999 12,838 Clarisia racemosa Ruiz & Pav. 15,438 88,251 38,200 Pouteria anomala (Pires) T.D. Penn. 12,637 71,110 22,008 Theobroma microcarpum Mart. 15,756 75,427 44,121 Paypayrola grandiflora Tul. 12,796 28,728 33,117 Fusaea longifolia (Aubl.) Saff. 15,756 103,081 57,064 Brosimum lactescens (S. Moore) C.C.Berg. 13,178 62,120 32,488 Vantanea guianensis Aubl. 15,915 226,887 65,186 Batocarpus amazonicus (Ducke) Fosberg 13,210 74,652 18,235 Aspidosperma cf. spruceanum Mull. Arg. 15,979 72,794 33,588 Siparuna sp. 13,210 40,584 9,222 Aspidosperma cf. spruceanum Mull. Arg. 16,234 99,764 35,422 Toulicia guianensis Aubl. 13,242 98,592 20,122 Leonia glycycarpa Ruiz & Pav. 16,297 70,984 77,028 Tetragastris altissima (Aubl.) Swart 13,369 51,973 33,274 Andira inermis (W. Wright) Kunth ex. DC. 16,393 96,919 37,466 Brosimum lactescens (S. Moore) C.C.Berg. 13,369 77,545 48,732 Protium decandrum (Aubl.) March. 16,457 102,970 47,684 Hymenolobium cf. pulcherrimum Ducke 13,369 80,773 28,558 Ocotea sp. 16,488 94,238 90,862 Isertia hypoleuca Benth. 13,369 53,783 21,117 Tetragastris altissima (Aubl.) Swart 16,520 91,451 92,434 Pseudolmedia laevis (Ruiz & Pav.) Macbr. 13,433 82,510 19,388 Tetragastris altissima (Aubl.) Swart 16,616 63,586 70,111 Brosimum guianense (Aubl.) Huber 13,433 97,291 39,824 Pouteria cf. glomerata (Miq.) Radlk. 16,648 93,245 66,653 Sterculia pruriens (Aubl.) K. Schum. 13,433 37,535 2,096 Heisteria aff. spruceana Engl. 16,648 132,944 43,387 Apeiba echinata Gaertner 13,496 27,077 8,489 Metrodorea flavida K. Krause 16,679 117,125 75,142 Lueheopsis duckeana Burret 13,496 110,742 17,292 Theobroma microcarpum Mart. 17,316 80,148 67,229 Astronium le-cointei Ducke 13,592 115,360 9,746 Ecclinusa guianensis Eyma 17,603 148,523 78,390 Ecclinusa guianensis Eyma 13,687 61,279 35,108 Brosimum guianense (Aubl.) Huber 17,825 253,099 30,025 Toulicia guianensis Aubl. 13,687 110,562 40,348 Ecclinusa guianensis Eyma 18,239 154,452 26,934
Metrodorea flavida K. Krause 13,878 55,304 69,063 Pourouma cf. tomentosa Miq. ssp. apiculata (Benoist) C.C. Berg. & van Heusden 18,335 96,571 55,544
Pseudolmedia laevis (Ruiz & Pav.) Macbr. 13,942 87,073 41,448 Sclerolobium sp. 18,621 98,250 67,910 Pouteria cf. anomala (Pires) T.D. Penn. 14,006 106,683 35,842 Bixa arborea Huber 18,876 80,080 39,824 Inga stipularis DC. 14,069 100,868 37,204 Tetragastris altissima (Aubl.) Swart 18,939 179,786 94,530 Trichilia micrantha Benth. 14,165 59,181 65,081 Sclerolobium sp. 19,099 145,187 47,789 Ocotea nitida (Meissn.) Rohwer 14,324 83,112 38,147 Paypayrola grandiflora Tul. 19,099 88,087 52,295 Gustavia augusta L. 14,706 63,104 69,325 Guapira noxia (Netto) Lundell 19,226 166,992 26,200 Cheiloclinium cognatum (Miers) A.C. Smith 14,833 50,764 52,767 Hymenaea courbaril L. 19,290 280,987 67,491 Maquira calophylla (Planch. & Endl.) C.C. Berg 14,897 151,936 64,871 Guazuma sp. 19,735 157,565 77,552 Protium sp. 14,961 51,163 52,505 Rinoreocarpus ulei (Melch.) Ducke 19,894 137,729 97,097 Pseudolmedia macrophylla Trécul 15,183 98,427 47,422 Inga thibaudiana DC. ssp. thibaudiana 19,990 162,424 207,399
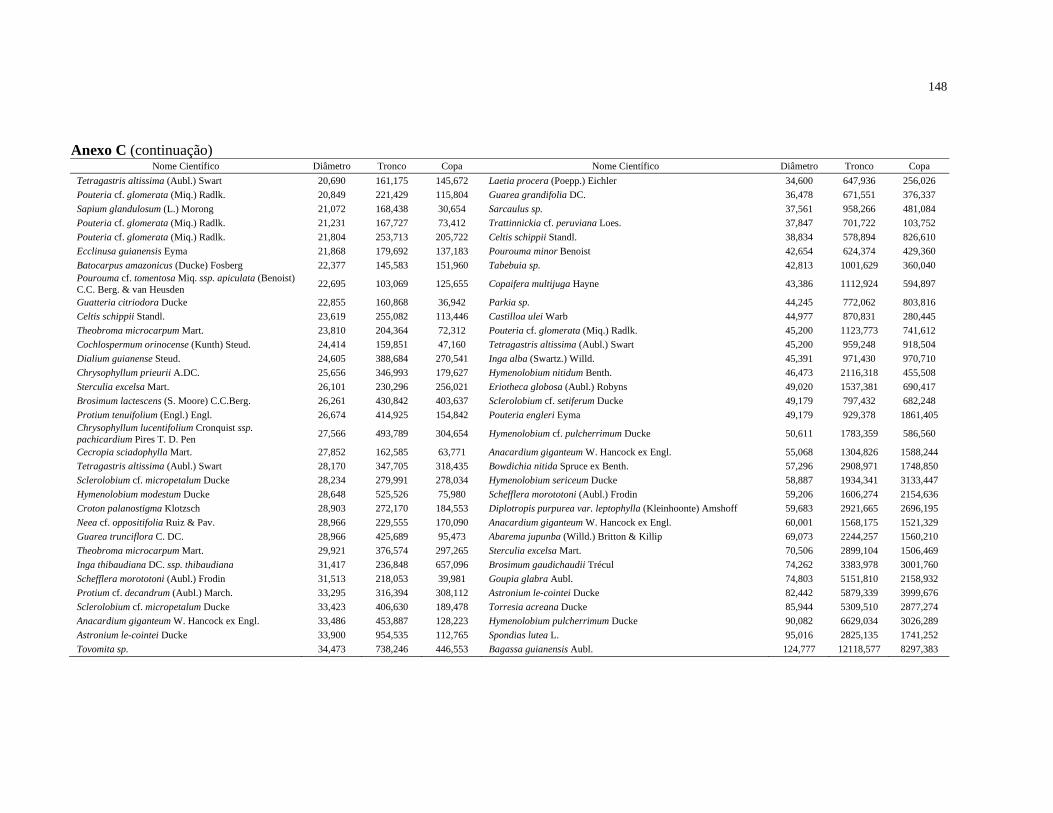
148
Anexo C (continuação) Nome Científico Diâmetro Tronco Copa Nome Científico Diâmetro Tronco Copa
Tetragastris altissima (Aubl.) Swart 20,690 161,175 145,672 Laetia procera (Poepp.) Eichler 34,600 647,936 256,026 Pouteria cf. glomerata (Miq.) Radlk. 20,849 221,429 115,804 Guarea grandifolia DC. 36,478 671,551 376,337 Sapium glandulosum (L.) Morong 21,072 168,438 30,654 Sarcaulus sp. 37,561 958,266 481,084 Pouteria cf. glomerata (Miq.) Radlk. 21,231 167,727 73,412 Trattinnickia cf. peruviana Loes. 37,847 701,722 103,752 Pouteria cf. glomerata (Miq.) Radlk. 21,804 253,713 205,722 Celtis schippii Standl. 38,834 578,894 826,610 Ecclinusa guianensis Eyma 21,868 179,692 137,183 Pourouma minor Benoist 42,654 624,374 429,360 Batocarpus amazonicus (Ducke) Fosberg 22,377 145,583 151,960 Tabebuia sp. 42,813 1001,629 360,040 Pourouma cf. tomentosa Miq. ssp. apiculata (Benoist) C.C. Berg. & van Heusden 22,695 103,069 125,655 Copaifera multijuga Hayne 43,386 1112,924 594,897
Guatteria citriodora Ducke 22,855 160,868 36,942 Parkia sp. 44,245 772,062 803,816 Celtis schippii Standl. 23,619 255,082 113,446 Castilloa ulei Warb 44,977 870,831 280,445 Theobroma microcarpum Mart. 23,810 204,364 72,312 Pouteria cf. glomerata (Miq.) Radlk. 45,200 1123,773 741,612 Cochlospermum orinocense (Kunth) Steud. 24,414 159,851 47,160 Tetragastris altissima (Aubl.) Swart 45,200 959,248 918,504 Dialium guianense Steud. 24,605 388,684 270,541 Inga alba (Swartz.) Willd. 45,391 971,430 970,710 Chrysophyllum prieurii A.DC. 25,656 346,993 179,627 Hymenolobium nitidum Benth. 46,473 2116,318 455,508 Sterculia excelsa Mart. 26,101 230,296 256,021 Eriotheca globosa (Aubl.) Robyns 49,020 1537,381 690,417 Brosimum lactescens (S. Moore) C.C.Berg. 26,261 430,842 403,637 Sclerolobium cf. setiferum Ducke 49,179 797,432 682,248 Protium tenuifolium (Engl.) Engl. 26,674 414,925 154,842 Pouteria engleri Eyma 49,179 929,378 1861,405 Chrysophyllum lucentifolium Cronquist ssp. pachicardium Pires T. D. Pen 27,566 493,789 304,654 Hymenolobium cf. pulcherrimum Ducke 50,611 1783,359 586,560
Cecropia sciadophylla Mart. 27,852 162,585 63,771 Anacardium giganteum W. Hancock ex Engl. 55,068 1304,826 1588,244 Tetragastris altissima (Aubl.) Swart 28,170 347,705 318,435 Bowdichia nitida Spruce ex Benth. 57,296 2908,971 1748,850 Sclerolobium cf. micropetalum Ducke 28,234 279,991 278,034 Hymenolobium sericeum Ducke 58,887 1934,341 3133,447 Hymenolobium modestum Ducke 28,648 525,526 75,980 Schefflera morototoni (Aubl.) Frodin 59,206 1606,274 2154,636 Croton palanostigma Klotzsch 28,903 272,170 184,553 Diplotropis purpurea var. leptophylla (Kleinhoonte) Amshoff 59,683 2921,665 2696,195 Neea cf. oppositifolia Ruiz & Pav. 28,966 229,555 170,090 Anacardium giganteum W. Hancock ex Engl. 60,001 1568,175 1521,329 Guarea trunciflora C. DC. 28,966 425,689 95,473 Abarema jupunba (Willd.) Britton & Killip 69,073 2244,257 1560,210 Theobroma microcarpum Mart. 29,921 376,574 297,265 Sterculia excelsa Mart. 70,506 2899,104 1506,469 Inga thibaudiana DC. ssp. thibaudiana 31,417 236,848 657,096 Brosimum gaudichaudii Trécul 74,262 3383,978 3001,760 Schefflera morototoni (Aubl.) Frodin 31,513 218,053 39,981 Goupia glabra Aubl. 74,803 5151,810 2158,932 Protium cf. decandrum (Aubl.) March. 33,295 316,394 308,112 Astronium le-cointei Ducke 82,442 5879,339 3999,676 Sclerolobium cf. micropetalum Ducke 33,423 406,630 189,478 Torresia acreana Ducke 85,944 5309,510 2877,274 Anacardium giganteum W. Hancock ex Engl. 33,486 453,887 128,223 Hymenolobium pulcherrimum Ducke 90,082 6629,034 3026,289 Astronium le-cointei Ducke 33,900 954,535 112,765 Spondias lutea L. 95,016 2825,135 1741,252 Tovomita sp. 34,473 738,246 446,553 Bagassa guianensis Aubl. 124,777 12118,577 8297,383