noaa water level and meteorlogical data report hurrican … · noaa water level and meteorological...
TRANSCRIPT

NOAA Water Level and Meteorological Data Report
noaa National Oceanic and Atmospheric Administration
U.S. DEPARTMENT OF COMMERCE National Ocean Service Center for Operational Oceanographic Products and Services
HURRICANE IRMA
Silver Spring, Maryland January 2, 2018
Photo Credit: NOAA National Environmental Satellite, Data & Information Service GOES-16 Imagery
NOAA Water Level and Meteorological Data Report
U.S. DEPARTMENT OF COMMERCE Wilbur L. Ross, Jr., Secretary
National Oceanic and Atmospheric Administration RDML Timothy Gallaudet, Acting NOAA Administrator and Under Secretary of Commerce for Oceans and Atmosphere
National Ocean Service Dr. Russell Callender, Assistant Administrator
Center for Operational Oceanographic Products and Services Richard Edwing, Director
Hurricane IRMA Alison Carisio Katie Kirk Rhyan Lange Ashley Miller January 2, 2018
NOAA NOS Hurricane Irma Water Level & Meteorological Data Report 3
Table of Contents Overview ...................................................................................................................................................... 4 Hurricane Irma Summary ......................................................................................................................... 5 Maps of NOS Water Level Station Locations........................................................................................... 7 Table of Maximum Recorded Water Levels (Storm Tide) ...................................................................... 9 Table of Maximum Recorded Water Level Residuals (Storm Surge).................................................. 11 Table of Maximum Wind Speed and Minimum Barometric Pressure ................................................ 13 Stations that Exceeded Historical Maximum Water Levels ................................................................. 15 Time-Series Plots of Observed, Predicted and Residual Water Levels ................................................ 16 Acknowledgements ................................................................................................................................... 38 Contact Information ................................................................................................................................. 39 Table of NOS Water Level Station Locations ........................................................................................ 40 Definitions .................................................................................................................................................. 42

NOAA NOS Hurricane Irma Water Level & Meteorological Data Report 4
Overview
The National Oceanic and Atmospheric Administration (NOAA) Center for Operational Oceanographic Products and Services (CO-OPS) maintains a network of oceanographic and meteorological stations along the United States coastlines and Great Lakes to monitor water levels, winds (speed, direction and gusts), barometric pressure, and air/water temperature. This report documents the elevated water levels, high winds and reduced barometric pressures recorded at stations in the Caribbean from Barbuda to Puerto Rico in addition to stations along the Gulf and East Coasts of the U.S. from the Florida panhandle to North Carolina during Hurricane Irma, which occurred August 30 – September 11, 2017.
Station information and locations are displayed in Figures 2 - 3 and Appendices 1 & 2. Tidal stations are referenced to Mean Higher High Water (MHHW), based on the National Tidal Datum Epoch 1983 - 2001 (Appendix 3). In addition, at several locations along the U.S. and Caribbean coasts, water levels are provided relative to an orthometric datum (North American Vertical Datum of 1988 [NAVD88], Puerto Rico Vertical Datum of 2002 [PRVD02] or Virgin Islands Vertical Datum of 2009 [VIVD09]) to assist in relating water levels to coastal inundation estimates.
Table 1 provides peak water level (storm tide) and predicted tide elevations for stations affected by Hurricane Irma by geographic region, referenced to MHHW and the appropriate orthometric datum (where available). Included in Table 1 are the residuals corresponding to the times of maximum storm tides. Maximum residual levels (independent of overall peak water level) are summarized in Table 2, ranked by amplitude. Storm tides are the maximum observed water level elevations during a storm passage (Figure 1). Residuals are elevation differences between observed water levels and predicted tides and can result from numerous factors such as storm surge, rainfall runoff, and non-storm related oceanographic variability. Storm surge is the residual caused directly by the storm and includes the effects of wind stress, atmospheric pressure and wave setup.
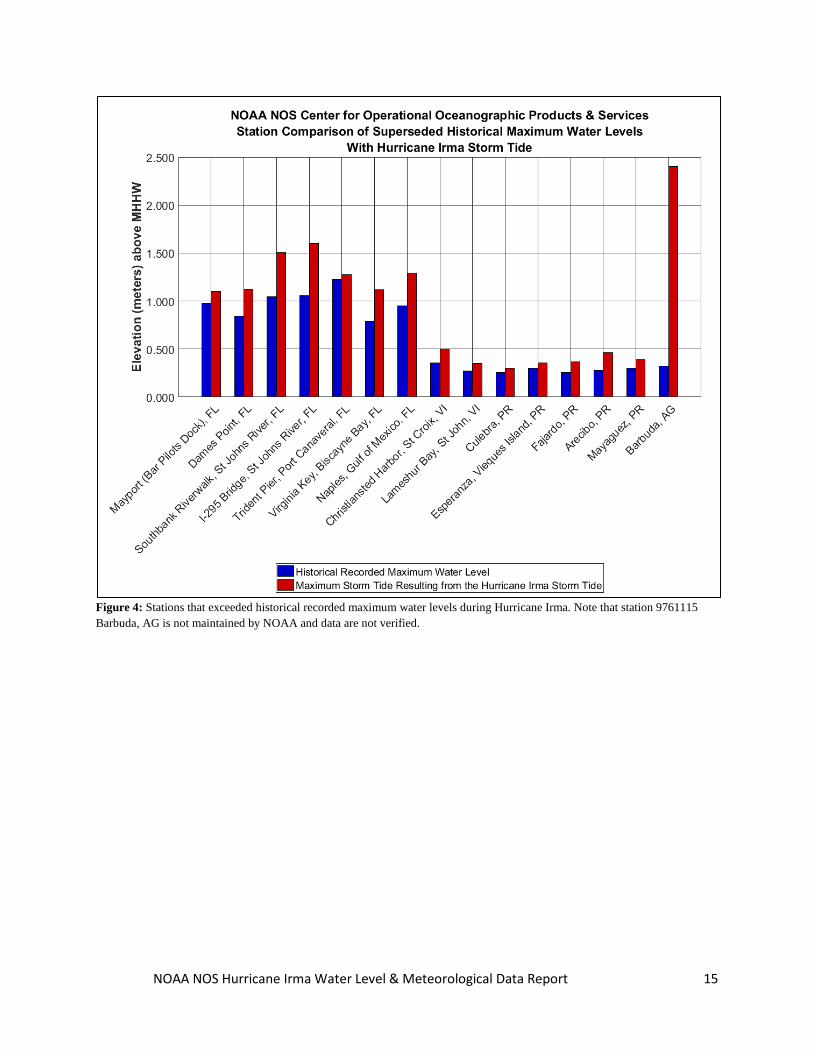
In addition, the report highlights stations that have exceeded historical recorded maximum water levels because of Hurricane Irma (Figure 4). The historical recorded maximum water levels are the maximum water elevations measured throughout a high tide cycle for the entire historical period. A complete high tide cycle is required to apply a best fit curve to the observations and calculate the maximum tide elevation. These historic records may not have included the highest water levels measured at a station during an event if a complete high tide cycle was not measured due to station/sensor damage (Appendix 3).
Individual time series graphs are provided for each station (Figures 5 – 48). For comparison and context, the historical recorded maximum water levels are displayed on the graphs, where available.
Figure 1: Storm tides are the maximum observed water level elevations measured by a water level station during a storm event.

NOAA NOS Hurricane Irma Water Level & Meteorological Data Report 5
Hurricane Irma Summary
On August 30, 2017, Irma developed into a tropical storm 676 km (420 mi) west of the Cabo Verde Islands. Irma quickly intensified into a hurricane as it moved westward across the Atlantic Ocean. After interacting with the warm waters around the Lesser Antilles, Irma further strengthened into a Category 5 storm breaking the Atlantic hurricane record for strongest sustained winds at 82.7 m/s (160.8 kts). The storm directly hit Barbuda on September 6 with high wind gusts and heavy rainfall. After devastating the Northern Lesser Antilles, Irma’s eye skirted the Northern side of the Greater Antilles bringing strong winds and heavy rain to the islands in its path while maintaining its Category 5 strength. Irma then weakened to a Category 3 storm and turned northward hitting Cuba before strengthening once again to a Category 4 storm as it traveled directly over Cudjoe Key in the Florida Keys. On September 10, Irma made landfall at Marco Island, south of Naples, FL at 19:35 GMT as a Category 3 hurricane and moved up the west coast of the state. Within a day of making landfall on the Florida peninsula, Hurricane Irma weakened to a tropical storm. The storm continued to move farther inland where it weakened to a remnant low on September 12 before dissipating.
Hurricane Irma’s impacts were felt from the Caribbean to the eastern Gulf of Mexico and along the southeast coast of the United States. The peak water level at many locations in the Caribbean and along the Florida coast exceeded historical maximum values. Peak water levels at eight of the 15 stations in the Caribbean broke records. Water levels at 1Barbuda, AG were significantly higher than the other Caribbean stations as the eye passed directly over the island, measuring 2.404 m (7.89 ft) above MHHW at 9/6/2017 6:12 GMT. Seven stations along the southeast United States also exceeded their respective historical maximum water level values. Four of these record-breaking locations, which are located within the St. Johns River in Florida, experienced a combination of storm surge and excessive rainfall, causing higher river levels. The station at I-295 Bridge, FL measured the highest observed water level in the contiguous U.S. of 1.603 m (5.26 ft) above MHHW at 9/11/2017 11:18 GMT. This was followed closely by Southbank Riverwalk, FL which measured 1.505 m (4.94 ft) above MHHW on 9/11/2017 16.24 GMT.
The maximum residuals from the U.S. Virgin Islands and Puerto Rico ranged approximately from 0.169 to 0.622 m (0.55 to 2.04 ft) above normal tide levels with the highest overall value of 2.421 m (7.94 ft) measured at 1Barbuda, AG on 9/6/2017 6:12 GMT. The maximum residuals along the eastern Gulf of Mexico and southeast United States were also impressive and ranged from 0.149 to 2.370 m (0.49 to 7.78 ft) above normal tide levels with the highest value of 2.370 m (7.78 ft) measured at Fernandina Beach, FL on 9/11/2017 10:24 GMT. In addition, the peak residuals exceeded 1.524 m (5 ft) above normal tide levels at Naples, Fort Pulaski, I-295 Bridge, Dames Point, Mayport, and Southbank Riverwalk. Note that many of the peak residual values occurred within +/- 2 hours of low tide, diminishing inundation in comparison to peak residuals coinciding with high tide (see Tables 1 & 2).
In addition to several record high water levels, Irma produced record low water levels as well. As the storm traveled up Florida’s west coast, winds ahead of the eye blowing from the northeast caused significant amounts of water to be pushed offshore, including out of Tampa Bay for several hours. After the eye passed over Tampa Bay, the winds rapidly shifted direction, shifting to the southwest, causing the water to rush back into parts of Tampa Bay at a rate of approximately 0.183-0.274 m (0.6-0.9 ft) per hour. The highest rate of change in water levels occurred at Naples, FL, rising at approximately 0.914 m (3 ft) per hour.
In comparison to all other National Ocean Service (NOS) stations, Barbuda, AG experienced the highest wind speed and gust, along with the minimum barometric pressure during Hurricane Irma. The highest wind speed was 52.8 m/s (102.6 kts) on 9/06/2017 04:54 GMT; the highest wind gust measured was 69.3 m/s (134.7 kts) on 9/06/2017 05:00 GMT; and the minimum barometric pressure was 916.1 mb on 9/06/2017 05:36 GMT. The highest wind gusts in the U.S. Virgin Islands and Puerto Rico measured 43.6 m/s (84.8 kts) at Charlotte Amalie, USVI on 9/6/2017 17:42 GMT and 33 m/s (64.4 kts) at San Juan, PR on 9/6/2017 22:36 GMT, respectively.
The highest wind speed recorded at NOS water level stations along the eastern Gulf of Mexico and southeast United States during Hurricane Irma was 32.2 m/s (62.6 kts) at Key West, FL on 9/10/2017 12:24 GMT. The highest wind gust was recorded at Vaca Key, FL measuring 41.9 m/s (81.4 kts) on 9/10/2017

NOAA NOS Hurricane Irma Water Level & Meteorological Data Report 6
13:42 GMT. The minimum barometric pressure recorded was 939.7 mb at Naples, FL on 9/10/2017, 20:54 GMT. More information, data and storm reports can be found on the CO-OPS website, https://tidesandcurrents.noaa.gov. Storm reports are located under the Publications section of the webpage. 1Barbuda, AG (9761115) is not maintained by NOAA and has not been subjected to the National Ocean Service’s quality control or quality assurance procedures and do not meet the criteria and standards of official NOS data. They are released for limited public use as preliminary data to be used only with appropriate caution.

NOAA NOS Hurricane Irma Water Level & Meteorological Data Report 7
Figure 2: NOS stations affected by Irma from Barbuda to Mona Island, Puerto Rico.

NOAA NOS Hurricane Irma Water Level & Meteorological Data Report 8
Figure 3: NOS stations affected by Irma from Pensacola, Florida to Wrightsville Beach, North Carolina.
NOAA NOS Hurricane Irma Water Level & Meteorological Data Report 9
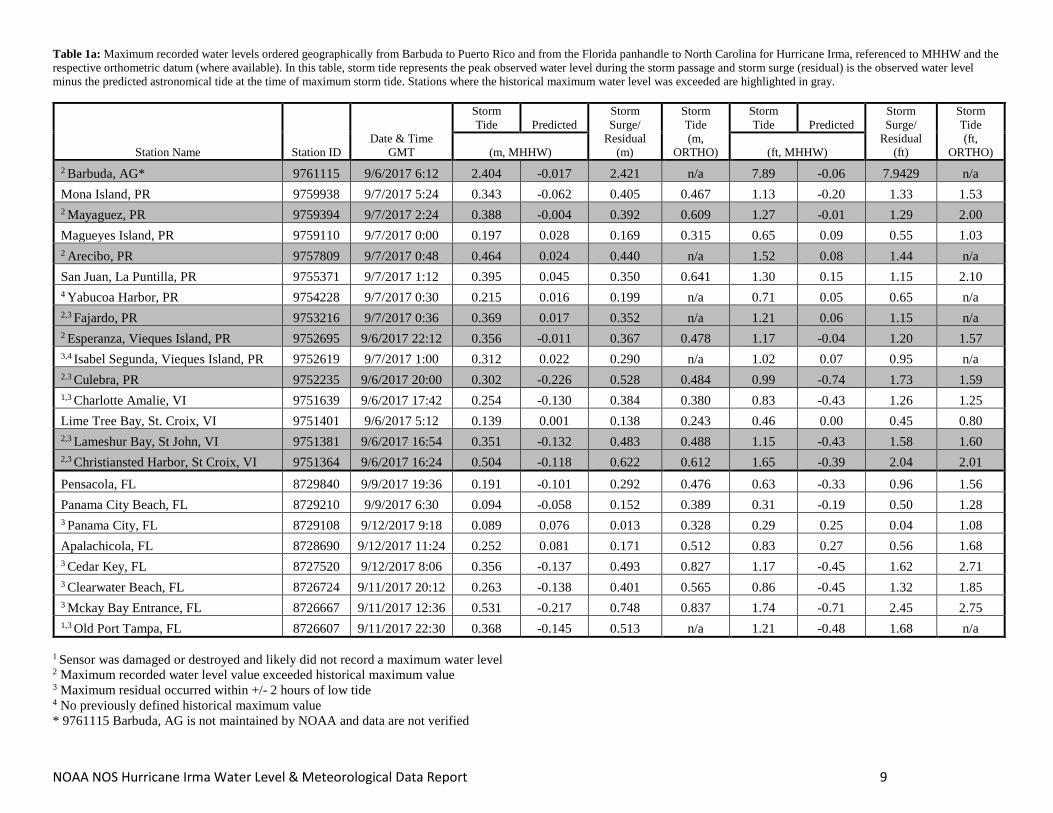
Table 1a: Maximum recorded water levels ordered geographically from Barbuda to Puerto Rico and from the Florida panhandle to North Carolina for Hurricane Irma, referenced to MHHW and the respective orthometric datum (where available). In this table, storm tide represents the peak observed water level during the storm passage and storm surge (residual) is the observed water level minus the predicted astronomical tide at the time of maximum storm tide. Stations where the historical maximum water level was exceeded are highlighted in gray.
Station Name Station ID Date & Time
GMT
Storm Tide Predicted
Storm Surge/
Residual (m)
Storm Tide (m,
ORTHO)
Storm Tide Predicted
Storm Surge/
Residual (ft)
Storm Tide (ft,
ORTHO) (m, MHHW) (ft, MHHW) 2 Barbuda, AG* 9761115 9/6/2017 6:12 2.404 -0.017 2.421 n/a 7.89 -0.06 7.9429 n/a Mona Island, PR 9759938 9/7/2017 5:24 0.343 -0.062 0.405 0.467 1.13 -0.20 1.33 1.53 2 Mayaguez, PR 9759394 9/7/2017 2:24 0.388 -0.004 0.392 0.609 1.27 -0.01 1.29 2.00 Magueyes Island, PR 9759110 9/7/2017 0:00 0.197 0.028 0.169 0.315 0.65 0.09 0.55 1.03 2 Arecibo, PR 9757809 9/7/2017 0:48 0.464 0.024 0.440 n/a 1.52 0.08 1.44 n/a San Juan, La Puntilla, PR 9755371 9/7/2017 1:12 0.395 0.045 0.350 0.641 1.30 0.15 1.15 2.10 4 Yabucoa Harbor, PR 9754228 9/7/2017 0:30 0.215 0.016 0.199 n/a 0.71 0.05 0.65 n/a 2,3 Fajardo, PR 9753216 9/7/2017 0:36 0.369 0.017 0.352 n/a 1.21 0.06 1.15 n/a 2 Esperanza, Vieques Island, PR 9752695 9/6/2017 22:12 0.356 -0.011 0.367 0.478 1.17 -0.04 1.20 1.57 3,4 Isabel Segunda, Vieques Island, PR 9752619 9/7/2017 1:00 0.312 0.022 0.290 n/a 1.02 0.07 0.95 n/a 2.3 Culebra, PR 9752235 9/6/2017 20:00 0.302 -0.226 0.528 0.484 0.99 -0.74 1.73 1.59 1,3 Charlotte Amalie, VI 9751639 9/6/2017 17:42 0.254 -0.130 0.384 0.380 0.83 -0.43 1.26 1.25 Lime Tree Bay, St. Croix, VI 9751401 9/6/2017 5:12 0.139 0.001 0.138 0.243 0.46 0.00 0.45 0.80 2,3 Lameshur Bay, St John, VI 9751381 9/6/2017 16:54 0.351 -0.132 0.483 0.488 1.15 -0.43 1.58 1.60 2,3 Christiansted Harbor, St Croix, VI 9751364 9/6/2017 16:24 0.504 -0.118 0.622 0.612 1.65 -0.39 2.04 2.01
Pensacola, FL 8729840 9/9/2017 19:36 0.191 -0.101 0.292 0.476 0.63 -0.33 0.96 1.56 Panama City Beach, FL 8729210 9/9/2017 6:30 0.094 -0.058 0.152 0.389 0.31 -0.19 0.50 1.28 3 Panama City, FL 8729108 9/12/2017 9:18 0.089 0.076 0.013 0.328 0.29 0.25 0.04 1.08 Apalachicola, FL 8728690 9/12/2017 11:24 0.252 0.081 0.171 0.512 0.83 0.27 0.56 1.68 3 Cedar Key, FL 8727520 9/12/2017 8:06 0.356 -0.137 0.493 0.827 1.17 -0.45 1.62 2.71 3 Clearwater Beach, FL 8726724 9/11/2017 20:12 0.263 -0.138 0.401 0.565 0.86 -0.45 1.32 1.85 3 Mckay Bay Entrance, FL 8726667 9/11/2017 12:36 0.531 -0.217 0.748 0.837 1.74 -0.71 2.45 2.75 1,3 Old Port Tampa, FL 8726607 9/11/2017 22:30 0.368 -0.145 0.513 n/a 1.21 -0.48 1.68 n/a
1 Sensor was damaged or destroyed and likely did not record a maximum water level 2 Maximum recorded water level value exceeded historical maximum value 3 Maximum residual occurred within +/- 2 hours of low tide 4 No previously defined historical maximum value * 9761115 Barbuda, AG is not maintained by NOAA and data are not verified
NOAA NOS Hurricane Irma Water Level & Meteorological Data Report 10
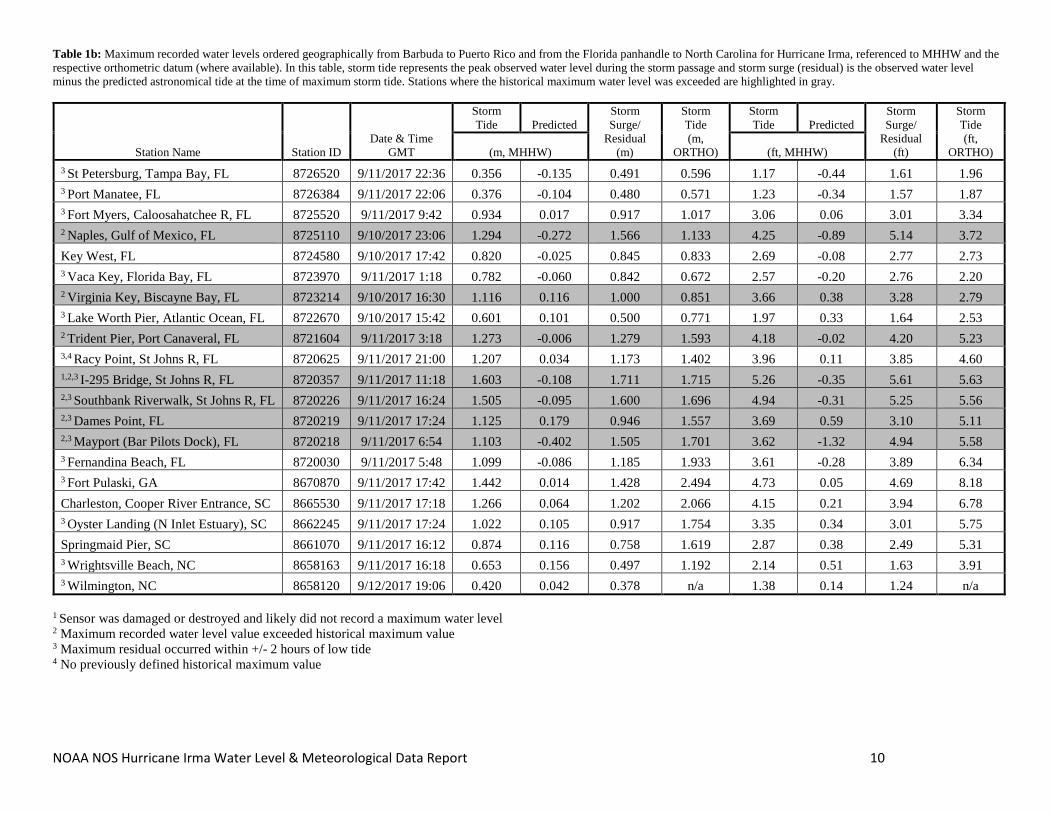
Table 1b: Maximum recorded water levels ordered geographically from Barbuda to Puerto Rico and from the Florida panhandle to North Carolina for Hurricane Irma, referenced to MHHW and the respective orthometric datum (where available). In this table, storm tide represents the peak observed water level during the storm passage and storm surge (residual) is the observed water level minus the predicted astronomical tide at the time of maximum storm tide. Stations where the historical maximum water level was exceeded are highlighted in gray.
Station Name Station ID Date & Time
GMT
Storm Tide Predicted
Storm Surge/
Residual (m)
Storm Tide (m,
ORTHO)
Storm Tide Predicted
Storm Surge/
Residual (ft)
Storm Tide (ft,
ORTHO) (m, MHHW) (ft, MHHW) 3 St Petersburg, Tampa Bay, FL 8726520 9/11/2017 22:36 0.356 -0.135 0.491 0.596 1.17 -0.44 1.61 1.96 3 Port Manatee, FL 8726384 9/11/2017 22:06 0.376 -0.104 0.480 0.571 1.23 -0.34 1.57 1.87 3 Fort Myers, Caloosahatchee R, FL 8725520 9/11/2017 9:42 0.934 0.017 0.917 1.017 3.06 0.06 3.01 3.34 2 Naples, Gulf of Mexico, FL 8725110 9/10/2017 23:06 1.294 -0.272 1.566 1.133 4.25 -0.89 5.14 3.72 Key West, FL 8724580 9/10/2017 17:42 0.820 -0.025 0.845 0.833 2.69 -0.08 2.77 2.73 3 Vaca Key, Florida Bay, FL 8723970 9/11/2017 1:18 0.782 -0.060 0.842 0.672 2.57 -0.20 2.76 2.20 2 Virginia Key, Biscayne Bay, FL 8723214 9/10/2017 16:30 1.116 0.116 1.000 0.851 3.66 0.38 3.28 2.79 3 Lake Worth Pier, Atlantic Ocean, FL 8722670 9/10/2017 15:42 0.601 0.101 0.500 0.771 1.97 0.33 1.64 2.53 2 Trident Pier, Port Canaveral, FL 8721604 9/11/2017 3:18 1.273 -0.006 1.279 1.593 4.18 -0.02 4.20 5.23 3,4 Racy Point, St Johns R, FL 8720625 9/11/2017 21:00 1.207 0.034 1.173 1.402 3.96 0.11 3.85 4.60 1,2,3 I-295 Bridge, St Johns R, FL 8720357 9/11/2017 11:18 1.603 -0.108 1.711 1.715 5.26 -0.35 5.61 5.63 2,3 Southbank Riverwalk, St Johns R, FL 8720226 9/11/2017 16:24 1.505 -0.095 1.600 1.696 4.94 -0.31 5.25 5.56 2,3 Dames Point, FL 8720219 9/11/2017 17:24 1.125 0.179 0.946 1.557 3.69 0.59 3.10 5.11 2,3 Mayport (Bar Pilots Dock), FL 8720218 9/11/2017 6:54 1.103 -0.402 1.505 1.701 3.62 -1.32 4.94 5.58 3 Fernandina Beach, FL 8720030 9/11/2017 5:48 1.099 -0.086 1.185 1.933 3.61 -0.28 3.89 6.34 3 Fort Pulaski, GA 8670870 9/11/2017 17:42 1.442 0.014 1.428 2.494 4.73 0.05 4.69 8.18 Charleston, Cooper River Entrance, SC 8665530 9/11/2017 17:18 1.266 0.064 1.202 2.066 4.15 0.21 3.94 6.78 3 Oyster Landing (N Inlet Estuary), SC 8662245 9/11/2017 17:24 1.022 0.105 0.917 1.754 3.35 0.34 3.01 5.75 Springmaid Pier, SC 8661070 9/11/2017 16:12 0.874 0.116 0.758 1.619 2.87 0.38 2.49 5.31 3 Wrightsville Beach, NC 8658163 9/11/2017 16:18 0.653 0.156 0.497 1.192 2.14 0.51 1.63 3.91 3 Wilmington, NC 8658120 9/12/2017 19:06 0.420 0.042 0.378 n/a 1.38 0.14 1.24 n/a
1 Sensor was damaged or destroyed and likely did not record a maximum water level 2 Maximum recorded water level value exceeded historical maximum value 3 Maximum residual occurred within +/- 2 hours of low tide 4 No previously defined historical maximum value

NOAA NOS Hurricane Irma Water Level & Meteorological Data Report 11
Table 2a: Maximum recorded residual separated by geographic region and ranked by amplitude for Hurricane Irma. Storm surge (residual) represents the maximum observed water level (storm tide) minus predicted astronomical tide levels. Stations where the historical maximum water level was exceeded are highlighted in gray.
Station Name Station ID Date & Time
GMT
Residual
in Meters in Feet 2 Barbuda, AG 9761115 9/6/2017 6:12 2.421 7.94 2,3 Christiansted Harbor, St Croix, VI 9751364 9/6/2017 16:24 0.622 2.04 2.3 Culebra, PR 9752235 9/6/2017 20:00 0.528 1.73 3 Isabel Segunda, Vieques Island, PR 9752619 9/6/2017 20:00 0.497 1.63 2,3 Lameshur Bay, St John, VI 9751381 9/6/2017 18:54 0.493 1.62
San Juan, La Puntilla, San Juan Bay, PR 9755371 9/6/2017 22:30 0.472 1.55 2 Arecibo, PR 9757809 9/7/2017 0:48 0.440 1.44
Mona Island, PR 9759938 9/7/2017 5:24 0.405 1.33 2 Mayaguez, PR 9759394 9/7/2017 2:24 0.392 1.29 1,3 Charlotte Amalie, VI 9751639 9/6/2017 17:42 0.384 1.26 2 Esperanza, Vieques Island, PR 9752695 9/6/2017 21:30 0.375 1.23 2,3 Fajardo, PR 9753216 9/6/2017 19:30 0.369 1.21 Yabucoa Harbor, PR 9754228 9/6/2017 20:36 0.254 0.83 Lime Tree Bay, St Croix, VI 9751401 9/6/2017 18:48 0.183 0.60 Magueyes Island, PR 9759110 9/7/2017 0:00 0.169 0.55 3 Fernandina Beach, FL 8720030 9/11/2017 10:24 2.370 7.78 2,3 Southbank Riverwalk, St Johns R, FL 8720226 9/11/2017 12:12 2.016 6.61 2,3 Mayport (Bar Pilots Dock), FL 8720218 9/11/2017 10:30 1.966 6.45 2,3 Dames Point, FL 8720219 9/11/2017 11:36 1.843 6.05 1,2,3 I-295 Bridge, St Johns R, FL 8720357 9/11/2017 12:48 1.743 5.72 3 Fort Pulaski, GA 8670870 9/11/2017 9:42 1.717 5.63 2 Naples, Gulf of Mexico, FL 8725110 9/10/2017 23:06 1.566 5.14 Charleston, Cooper River Entrance, SC 8665530 9/11/2017 19:00 1.482 4.86 3 Oyster Landing (N Inlet Estuary), SC 8662245 9/11/2017 23:06 1.412 4.63 2 Trident Pier, Port Canaveral, FL 8721604 9/11/2017 1:24 1.402 4.60 3 Racy Point, St Johns R, FL 8720625 9/11/2017 18:00 1.291 4.24 2 Virginia Key, Biscayne Bay, FL 8723214 9/10/2017 19:18 1.194 3.92 Key West, FL 8724580 9/10/2017 14:24 1.003 3.29 Springmaid Pier, SC 8661070 9/11/2017 19:36 0.998 3.27 3 Fort Myers, Caloosahatchee R, FL 8725520 9/11/2017 18:54 0.952 3.12 3 Mckay Bay Entrance, FL 8726667 9/11/2017 17:24 0.937 3.07
1 Sensor was damaged or destroyed and likely did not record a maximum water 2 Maximum recorded water level value exceeded historical maximum value 3 Maximum residual occurred within +/- 2 hours of low tide

NOAA NOS Hurricane Irma Water Level & Meteorological Data Report 12
Table 2b: Maximum recorded storm surge (residual) ranked by amplitude for Hurricane Irma. Storm surge (residual) represents the maximum observed water level (storm tide) minus predicted astronomical tide levels. Stations where the historical maximum water level was exceeded are highlighted in gray.
Station Name Station ID Date & Time
GMT
Residual
in Meters in Feet 3 Vaca Key, Florida Bay, FL 8723970 9/11/2017 1:48 0.852 2.80 3 Lake Worth Pier, Atlantic Ocean, FL 8722670 9/10/2017 22:42 0.823 2.70 3 Cedar Key, FL 8727520 9/11/2017 17:36 0.788 2.59 1,3 Old Port Tampa, FL 8726607 9/11/2017 16:06 0.720 2.36 3 Wilmington, NC 8658120 9/12/2017 12:18 0.705 2.31 3 St Petersburg, Tampa Bay, FL 8726520 9/11/2017 16:36 0.661 2.17 3 Port Manatee, FL 8726384 9/11/2017 15:18 0.659 2.16 3 Wrightsville Beach, NC 8658163 9/11/2017 20:24 0.564 1.85 3 Clearwater Beach, FL 8726724 9/12/2017 2:54 0.510 1.67 Pensacola, FL 8729840 9/9/2017 18:06 0.305 1.00 Apalachicola, FL 8728690 9/12/2017 8:06 0.285 0.94
Panama City Beach, FL 8729210 9/9/2017 17:06 0.178 0.58 3 Panama City, FL 8729108 9/8/2017 1:00 0.149 0.49
1 Sensor was damaged or destroyed and likely did not record a maximum water 2 Maximum recorded water level value exceeded historical maximum value 3 Maximum residual occurred within +/- 2 hours of low tide
NOAA NOS Hurricane Irma Water Level & Meteorological Data Report 13
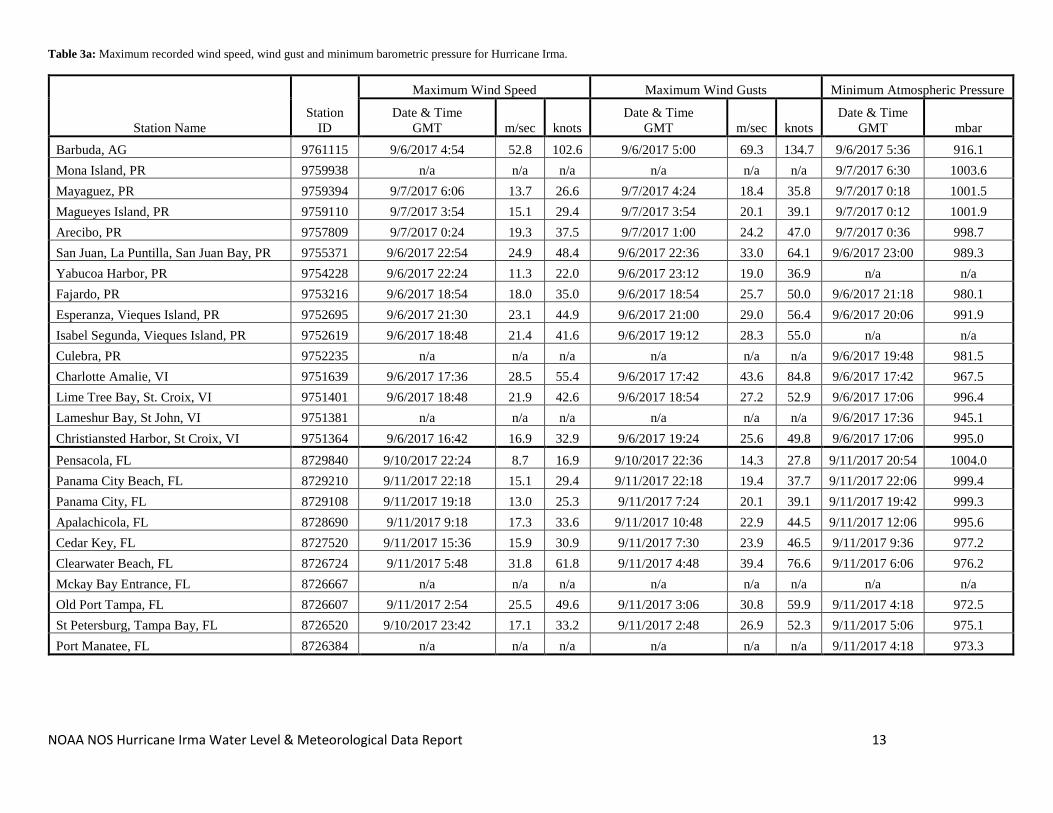
Table 3a: Maximum recorded wind speed, wind gust and minimum barometric pressure for Hurricane Irma.
Station Name Station
ID
Maximum Wind Speed Maximum Wind Gusts Minimum Atmospheric Pressure
Date & Time GMT m/sec knots
Date & Time GMT m/sec knots
Date & Time GMT mbar
Barbuda, AG 9761115 9/6/2017 4:54 52.8 102.6 9/6/2017 5:00 69.3 134.7 9/6/2017 5:36 916.1 Mona Island, PR 9759938 n/a n/a n/a n/a n/a n/a 9/7/2017 6:30 1003.6 Mayaguez, PR 9759394 9/7/2017 6:06 13.7 26.6 9/7/2017 4:24 18.4 35.8 9/7/2017 0:18 1001.5 Magueyes Island, PR 9759110 9/7/2017 3:54 15.1 29.4 9/7/2017 3:54 20.1 39.1 9/7/2017 0:12 1001.9 Arecibo, PR 9757809 9/7/2017 0:24 19.3 37.5 9/7/2017 1:00 24.2 47.0 9/7/2017 0:36 998.7 San Juan, La Puntilla, San Juan Bay, PR 9755371 9/6/2017 22:54 24.9 48.4 9/6/2017 22:36 33.0 64.1 9/6/2017 23:00 989.3 Yabucoa Harbor, PR 9754228 9/6/2017 22:24 11.3 22.0 9/6/2017 23:12 19.0 36.9 n/a n/a Fajardo, PR 9753216 9/6/2017 18:54 18.0 35.0 9/6/2017 18:54 25.7 50.0 9/6/2017 21:18 980.1 Esperanza, Vieques Island, PR 9752695 9/6/2017 21:30 23.1 44.9 9/6/2017 21:00 29.0 56.4 9/6/2017 20:06 991.9 Isabel Segunda, Vieques Island, PR 9752619 9/6/2017 18:48 21.4 41.6 9/6/2017 19:12 28.3 55.0 n/a n/a Culebra, PR 9752235 n/a n/a n/a n/a n/a n/a 9/6/2017 19:48 981.5 Charlotte Amalie, VI 9751639 9/6/2017 17:36 28.5 55.4 9/6/2017 17:42 43.6 84.8 9/6/2017 17:42 967.5 Lime Tree Bay, St. Croix, VI 9751401 9/6/2017 18:48 21.9 42.6 9/6/2017 18:54 27.2 52.9 9/6/2017 17:06 996.4 Lameshur Bay, St John, VI 9751381 n/a n/a n/a n/a n/a n/a 9/6/2017 17:36 945.1 Christiansted Harbor, St Croix, VI 9751364 9/6/2017 16:42 16.9 32.9 9/6/2017 19:24 25.6 49.8 9/6/2017 17:06 995.0 Pensacola, FL 8729840 9/10/2017 22:24 8.7 16.9 9/10/2017 22:36 14.3 27.8 9/11/2017 20:54 1004.0 Panama City Beach, FL 8729210 9/11/2017 22:18 15.1 29.4 9/11/2017 22:18 19.4 37.7 9/11/2017 22:06 999.4 Panama City, FL 8729108 9/11/2017 19:18 13.0 25.3 9/11/2017 7:24 20.1 39.1 9/11/2017 19:42 999.3 Apalachicola, FL 8728690 9/11/2017 9:18 17.3 33.6 9/11/2017 10:48 22.9 44.5 9/11/2017 12:06 995.6 Cedar Key, FL 8727520 9/11/2017 15:36 15.9 30.9 9/11/2017 7:30 23.9 46.5 9/11/2017 9:36 977.2 Clearwater Beach, FL 8726724 9/11/2017 5:48 31.8 61.8 9/11/2017 4:48 39.4 76.6 9/11/2017 6:06 976.2 Mckay Bay Entrance, FL 8726667 n/a n/a n/a n/a n/a n/a n/a n/a Old Port Tampa, FL 8726607 9/11/2017 2:54 25.5 49.6 9/11/2017 3:06 30.8 59.9 9/11/2017 4:18 972.5 St Petersburg, Tampa Bay, FL 8726520 9/10/2017 23:42 17.1 33.2 9/11/2017 2:48 26.9 52.3 9/11/2017 5:06 975.1 Port Manatee, FL 8726384 n/a n/a n/a n/a n/a n/a 9/11/2017 4:18 973.3

NOAA NOS Hurricane Irma Water Level & Meteorological Data Report 14
Table 3b: Maximum recorded wind speed, wind gust and minimum barometric pressure in geographic order for Hurricane Irma.
Station Name Station
ID
Maximum Wind Speed Maximum Wind Gusts Minimum Atmospheric Pressure
Date & Time GMT m/sec knots
Date & Time GMT m/sec knots
Date & Time GMT mbar
Fort Myers, Caloosahatchee R, FL 8725520 9/10/2017 22:54 22.8 44.3 9/10/2017 22:54 30.1 58.5 9/10/2017 23:24 953.0 Naples, Gulf of Mexico, FL 8725110 9/10/2017 22:00 28.6 55.6 9/10/2017 22:00 36.9 71.7 9/10/2017 20:54 939.7 Key West, FL 8724580 9/10/2017 12:24 32.2 62.6 9/10/2017 12:24 41.7 81.1 9/10/2017 12:36 956.6 Vaca Key, Florida Bay, FL 8723970 9/10/2017 13:42 27.8 54.0 9/10/2017 13:42 41.9 81.4 9/10/2017 13:18 964.2 Virginia Key, Biscayne Bay, FL 8723214 9/10/2017 19:00 23.7 46.1 9/10/2017 12:54 31.8 61.8 9/10/2017 19:18 989.0 Lake Worth Pier, Atlantic Ocean, FL 8722670 9/10/2017 21:00 28.2 54.8 9/10/2017 21:00 40.4 78.5 n/a n/a Trident Pier, Port Canaveral, FL 8721604 9/11/2017 9:42 23.8 46.3 9/11/2017 7:42 30.3 58.9 9/11/2017 7:00 990.1 Racy Point, St Johns R, FL 8720625 n/a n/a n/a n/a n/a n/a n/a n/a I-295 Bridge, St Johns R, FL 8720357 9/11/2017 6:48 25.9 50.3 9/11/2017 9:36 30.7 59.7 9/11/2017 11:42 983.9 Southbank Riverwalk, St Johns R, FL 8720226 n/a n/a n/a n/a n/a n/a n/a n/a Dames Point, FL 8720219 n/a n/a n/a n/a n/a n/a n/a n/a Mayport (Bar Pilots Dock), FL 8720218 9/11/2017 7:36 29.1 56.6 9/11/2017 7:42 40.0 77.8 9/11/2017 12:18 988.3 Fernandina Beach, FL 8720030 9/11/2017 15:48 15.2 29.5 9/11/2017 12:36 26.5 51.5 9/11/2017 13:12 990.0 Fort Pulaski, GA 8670870 9/11/2017 12:18 21.4 41.6 9/11/2017 12:36 31.4 61.0 9/11/2017 17:06 999.7 Charleston, Cooper River Entrance, SC 8665530 9/11/2017 16:54 21.5 41.8 9/11/2017 17:00 27.2 52.9 9/11/2017 16:54 1002.8 Oyster Landing (N Inlet Estuary), SC 8662245 n/a n/a n/a n/a n/a n/a n/a n/a Springmaid Pier, SC 8661070 n/a n/a n/a n/a n/a n/a 9/12/2017 2:24 1006.6 Wrightsville Beach, NC 8658163 9/11/2017 19:48 19.1 37.1 9/11/2017 17:48 22.7 44.1 9/12/2017 11:48 1007.6 Wilmington, NC 8658120 n/a n/a n/a n/a n/a n/a 9/12/2017 11:48 1008.3
NOAA NOS Hurricane Irma Water Level & Meteorological Data Report 15
Figure 4: Stations that exceeded historical recorded maximum water levels during Hurricane Irma. Note that station 9761115 Barbuda, AG is not maintained by NOAA and data are not verified.
NOAA NOS Hurricane Irma Water Level & Meteorological Data Report 16
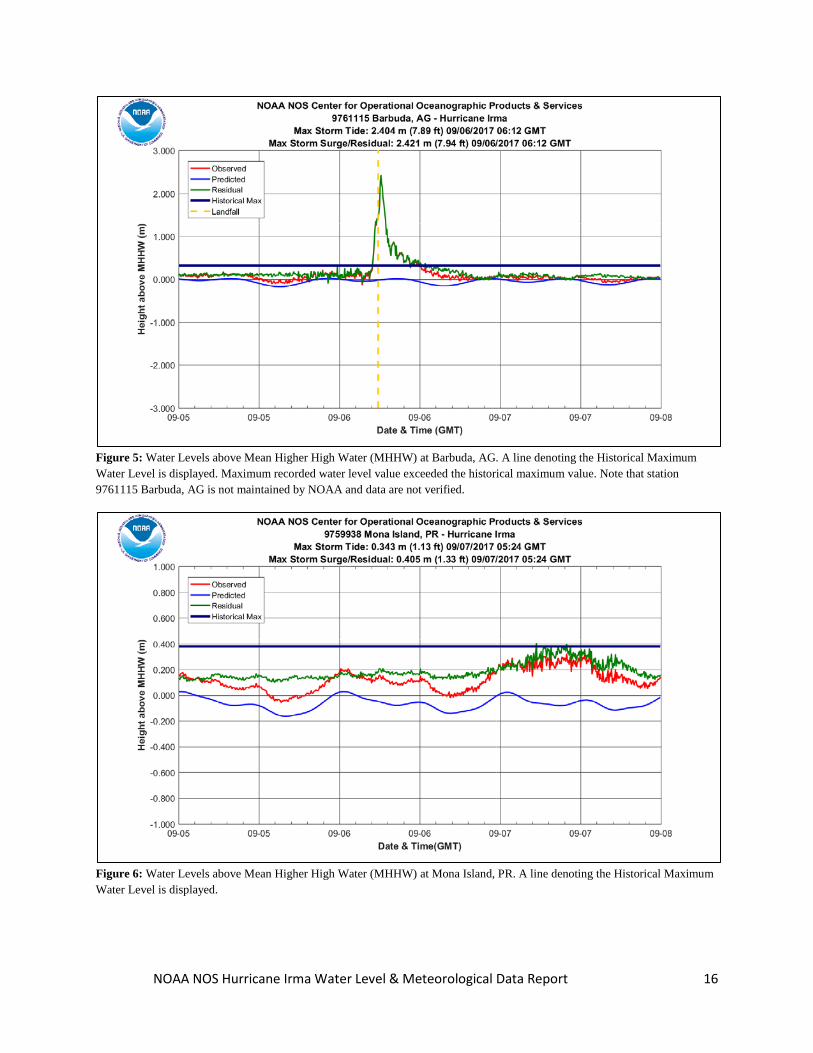
Figure 5: Water Levels above Mean Higher High Water (MHHW) at Barbuda, AG. A line denoting the Historical Maximum Water Level is displayed. Maximum recorded water level value exceeded the historical maximum value. Note that station 9761115 Barbuda, AG is not maintained by NOAA and data are not verified.
Figure 6: Water Levels above Mean Higher High Water (MHHW) at Mona Island, PR. A line denoting the Historical Maximum Water Level is displayed.

NOAA NOS Hurricane Irma Water Level & Meteorological Data Report 17
Figure 7: Water Levels above Mean Higher High Water (MHHW) at Mayaguez, PR. A line denoting the Historical Maximum Water Level is displayed. Maximum recorded water level value exceeded the historical maximum value.
Figure 8: Water Levels above Mean Higher High Water (MHHW) at Magueyes Island, PR. There is no available Historical Maximum Water Level at this station.
NOAA NOS Hurricane Irma Water Level & Meteorological Data Report 18
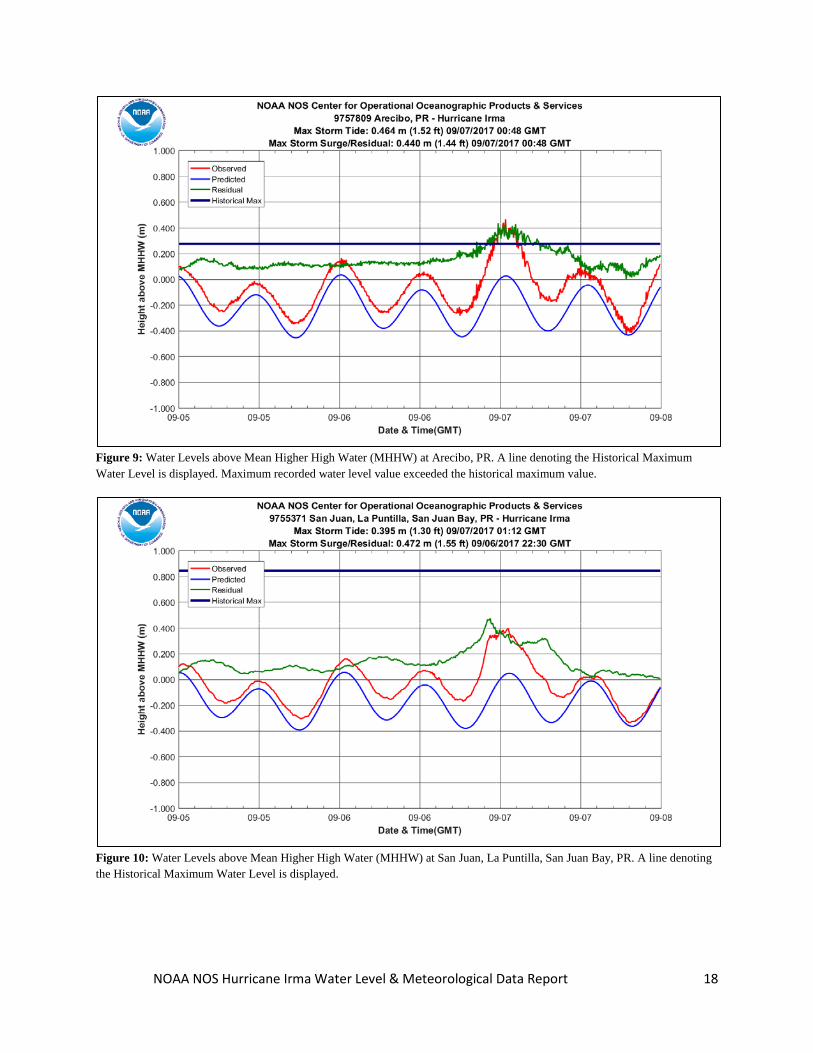
Figure 9: Water Levels above Mean Higher High Water (MHHW) at Arecibo, PR. A line denoting the Historical Maximum Water Level is displayed. Maximum recorded water level value exceeded the historical maximum value.
Figure 10: Water Levels above Mean Higher High Water (MHHW) at San Juan, La Puntilla, San Juan Bay, PR. A line denoting the Historical Maximum Water Level is displayed.

NOAA NOS Hurricane Irma Water Level & Meteorological Data Report 19
Figure 11: Water Levels above Mean Higher High Water (MHHW) at Yabucoa, PR. A Historical Maximum Water Level value does not exist at this station.
Figure 12: Water Levels above Mean Higher High Water (MHHW) at Fajardo, PR. A line denoting the Historical Maximum Water Level is displayed. Maximum recorded water level value exceeded the historical maximum value. Maximum residual occurred within +/- 2 hours of low tide.

NOAA NOS Hurricane Irma Water Level & Meteorological Data Report 20
Figure 13: Water Levels above Mean Higher High Water (MHHW) at Esperanza, Vieques Island, PR. A line denoting the Historical Maximum Water Level is displayed. Maximum recorded water level exceeded the historical maximum value.
Figure 14: Water Levels above Mean Higher High Water (MHHW) at Isabel Segunda, Vieques Island, PR. A Historical Maximum Water Level value does not exist at this station.
NOAA NOS Hurricane Irma Water Level & Meteorological Data Report 21
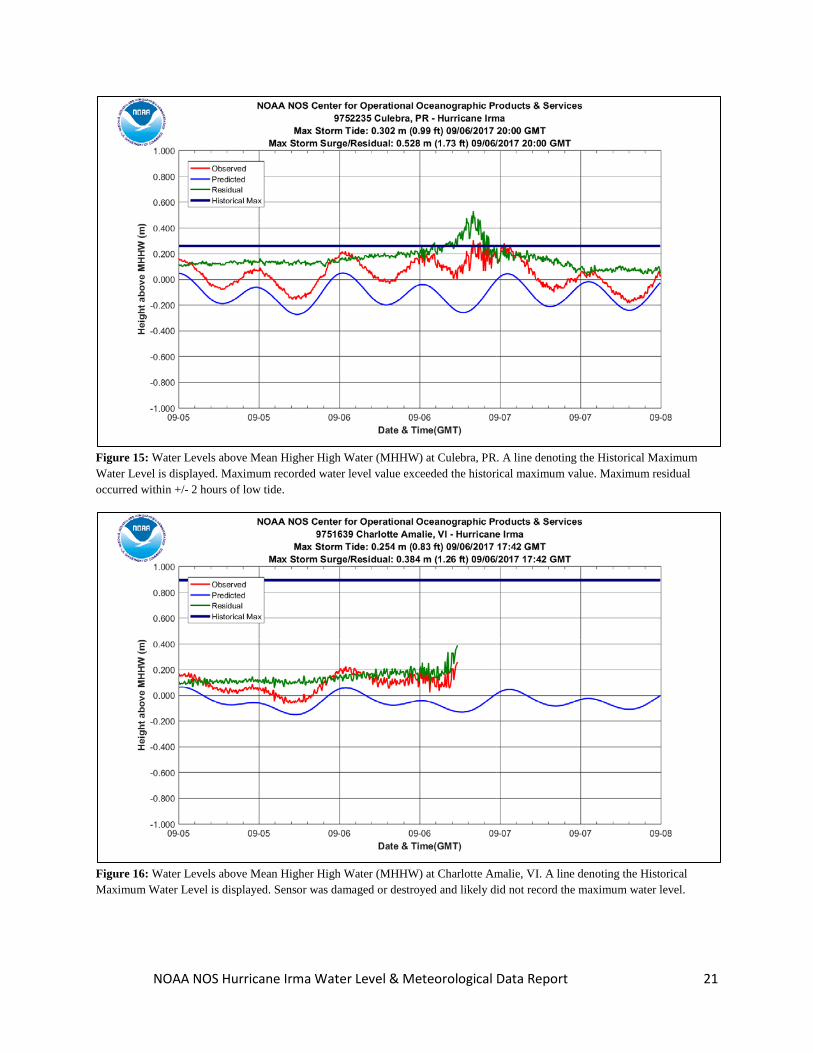
Figure 15: Water Levels above Mean Higher High Water (MHHW) at Culebra, PR. A line denoting the Historical Maximum Water Level is displayed. Maximum recorded water level value exceeded the historical maximum value. Maximum residual occurred within +/- 2 hours of low tide.
Figure 16: Water Levels above Mean Higher High Water (MHHW) at Charlotte Amalie, VI. A line denoting the Historical Maximum Water Level is displayed. Sensor was damaged or destroyed and likely did not record the maximum water level.

NOAA NOS Hurricane Irma Water Level & Meteorological Data Report 22
Figure 17: Water Levels above Mean Higher High Water (MHHW) at Lime Tree Bay, St Croix, VI. A line denoting the Historical Maximum Water Level is displayed.
Figure 18: Water Levels above Mean Higher High Water (MHHW) at Lameshur Bay, St John, VI. A line denoting the Historical Maximum Water Level is displayed. Maximum recorded water level value exceeded the historical maximum value. Maximum residual occurred within +/- 2 hours of low tide.

NOAA NOS Hurricane Irma Water Level & Meteorological Data Report 23
Figure 19: Water Levels above Mean Higher High Water (MHHW) at Christiansted Harbor, St Croix, VI. A line denoting the Historical Maximum Water Level is displayed. Maximum recorded water level value exceeded the historical maximum value. Maximum residual occurred within +/- 2 hours of low tide.
Figure 20: Water Levels above Mean Higher High Water (MHHW) at Pensacola, FL. A line denoting the Historical Maximum Water Level is displayed.

NOAA NOS Hurricane Irma Water Level & Meteorological Data Report 24
Figure 21: Water Levels above Mean Higher High Water (MHHW) at Panama City Beach, FL. A line denoting the Historical Maximum Water Level is displayed.
Figure 22: Water Levels above Mean Higher High Water (MHHW) at Panama City, FL. A line denoting the Historical Maximum Water Level is displayed. Maximum residual occurred within +/- 2 hours of low tide.
NOAA NOS Hurricane Irma Water Level & Meteorological Data Report 25
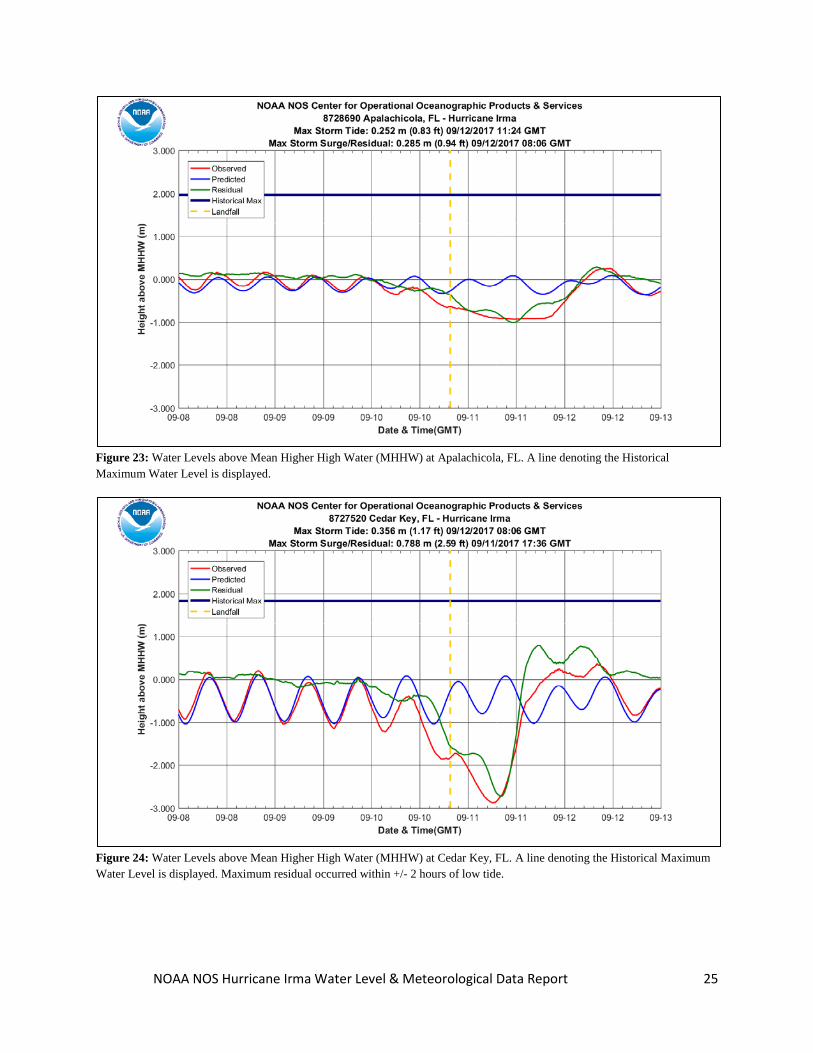
Figure 23: Water Levels above Mean Higher High Water (MHHW) at Apalachicola, FL. A line denoting the Historical Maximum Water Level is displayed.
Figure 24: Water Levels above Mean Higher High Water (MHHW) at Cedar Key, FL. A line denoting the Historical Maximum Water Level is displayed. Maximum residual occurred within +/- 2 hours of low tide.

NOAA NOS Hurricane Irma Water Level & Meteorological Data Report 26
Figure 25: Water Levels above Mean Higher High Water (MHHW) at Clearwater Beach, FL. A line denoting the Historical Maximum Water Level is displayed. Maximum residual occurred within +/- 2 hours of low tide.
Figure 26: Water Levels above Mean Higher High Water (MHHW) at Mckay Bay Entrance, FL. A line denoting the Historical Maximum Water Level is displayed. Maximum residual occurred within +/- 2 hours of low tide.

NOAA NOS Hurricane Irma Water Level & Meteorological Data Report 27
Figure 27: Water Levels above Mean Higher High Water (MHHW) at Old Port Tampa, FL. A line denoting the Historical Maximum Water Level is displayed. The winds ahead of Hurricane Irma’s eye caused significant amounts of water to be pushed offshore, causing the data gap as the sensor went dry. Maximum residual occurred within +/- 2 hours of low tide.
Figure 28: Water Levels above Mean Higher High Water (MHHW) at St Petersburg, Tampa Bay, FL. A line denoting the Historical Maximum Water Level is displayed. Maximum residual occurred within +/- 2 hours of low tide.

NOAA NOS Hurricane Irma Water Level & Meteorological Data Report 28
Figure 29: Water Levels above Mean Higher High Water (MHHW) at Port Manatee, FL. A line denoting the Historical Maximum Water Level is displayed. Maximum residual occurred within +/- 2 hours of low tide.
Figure 30: Water Levels above Mean Higher High Water (MHHW) at Fort Myers, Caloosahatchee River, FL. A line denoting the Historical Maximum Water Level is displayed. Maximum residual occurred within +/- 2 hours of low tide.

NOAA NOS Hurricane Irma Water Level & Meteorological Data Report 29
Figure 31: Water Levels above Mean Higher High Water (MHHW) at Naples, Gulf of Mexico, FL. A line denoting the Historical Maximum Water Level is displayed. Maximum recorded water level value exceeded the historical maximum value.
Figure 32: Water Levels above Mean Higher High Water (MHHW) at Key West, FL. A line denoting the Historical Maximum Water Level is displayed.
NOAA NOS Hurricane Irma Water Level & Meteorological Data Report 30
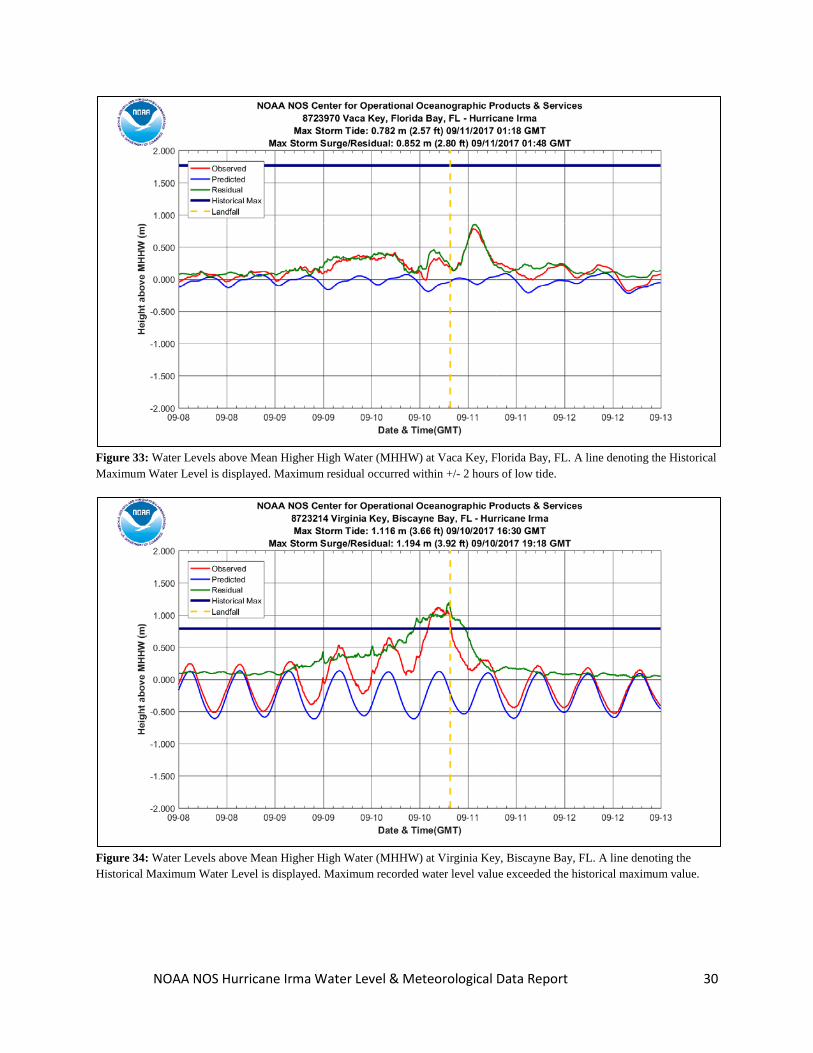
Figure 33: Water Levels above Mean Higher High Water (MHHW) at Vaca Key, Florida Bay, FL. A line denoting the Historical Maximum Water Level is displayed. Maximum residual occurred within +/- 2 hours of low tide.
Figure 34: Water Levels above Mean Higher High Water (MHHW) at Virginia Key, Biscayne Bay, FL. A line denoting the Historical Maximum Water Level is displayed. Maximum recorded water level value exceeded the historical maximum value.

NOAA NOS Hurricane Irma Water Level & Meteorological Data Report 31
Figure 35: Water Levels above Mean Higher High Water (MHHW) at Lake Worth Pier, Atlantic Ocean, FL. A line denoting the Historical Maximum Water Level is displayed. Maximum residual occurred within +/- 2 hours of low tide.
Figure 36: Water Levels above Mean Higher High Water (MHHW) at Trident Pier, Port Canaveral, FL. A line denoting the Historical Maximum Water Level is displayed. Maximum recorded water level value exceeded the historical maximum value.

NOAA NOS Hurricane Irma Water Level & Meteorological Data Report 32
Figure 37: Water Levels above Mean Higher High Water (MHHW) at Racy Point, St Johns River, FL. A line denoting the Historical Maximum Water Level is displayed. A Historical Maximum Water Level value does not exist at this station. Maximum residual occurred within +/- 2 hours of low tide.
Figure 38: Water Levels above Mean Higher High Water (MHHW) at I-295 Bridge, St Johns River, FL. A line denoting the Historical Maximum Water Level is displayed. Maximum recorded water level value exceeded the historical maximum value. Sensor was damaged or destroyed and likely did not record the maximum water level. Maximum residual occurred within +/- 2 hours of low tide.

NOAA NOS Hurricane Irma Water Level & Meteorological Data Report 33
Figure 39: Water Levels above Mean Higher High Water (MHHW) at Southbank Riverwalk, St Johns River, FL. A line denoting the Historical Maximum Water Level is displayed. Maximum recorded water level value exceeded the historical maximum value. Maximum residual occurred within +/- 2 hours of low tide.
Figure 40: Water Levels above Mean Higher High Water (MHHW) at Dames Point, FL. A line denoting the Historical Maximum Water Level is displayed. Maximum recorded water level value exceeded the historical maximum value. Maximum residual occurred within +/- 2 hours of low tide.
NOAA NOS Hurricane Irma Water Level & Meteorological Data Report 34
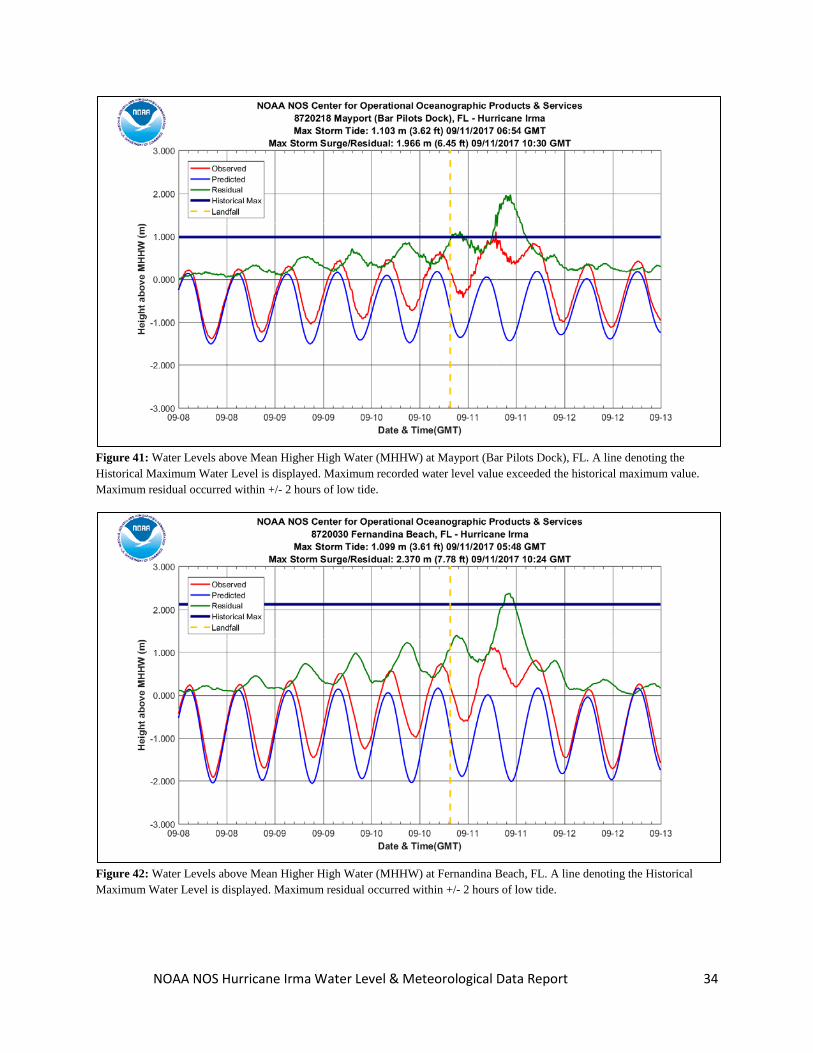
Figure 41: Water Levels above Mean Higher High Water (MHHW) at Mayport (Bar Pilots Dock), FL. A line denoting the Historical Maximum Water Level is displayed. Maximum recorded water level value exceeded the historical maximum value. Maximum residual occurred within +/- 2 hours of low tide.
Figure 42: Water Levels above Mean Higher High Water (MHHW) at Fernandina Beach, FL. A line denoting the Historical Maximum Water Level is displayed. Maximum residual occurred within +/- 2 hours of low tide.

NOAA NOS Hurricane Irma Water Level & Meteorological Data Report 35
Figure 43: Water Levels above Mean Higher High Water (MHHW) at Fort Pulaski, GA. A line denoting the Historical Maximum Water Level is displayed. Maximum residual occurred within +/- 2 hours of low tide.
Figure 44: Water Levels above Mean Higher High Water (MHHW) at Charleston, Cooper River Entrance, SC. A line denoting the Historical Maximum Water Level is displayed.

NOAA NOS Hurricane Irma Water Level & Meteorological Data Report 36
Figure 45: Water Levels above Mean Higher High Water (MHHW) at Oyster Landing (N Inlet Estuary), SC. A line denoting the Historical Maximum Water Level is displayed. Maximum residual occurred within +/- 2 hours of low tide.
Figure 46: Water Levels above Mean Higher High Water (MHHW) at Springmaid Pier, SC. A line denoting the Historical Maximum Water Level is displayed.
NOAA NOS Hurricane Irma Water Level & Meteorological Data Report 37
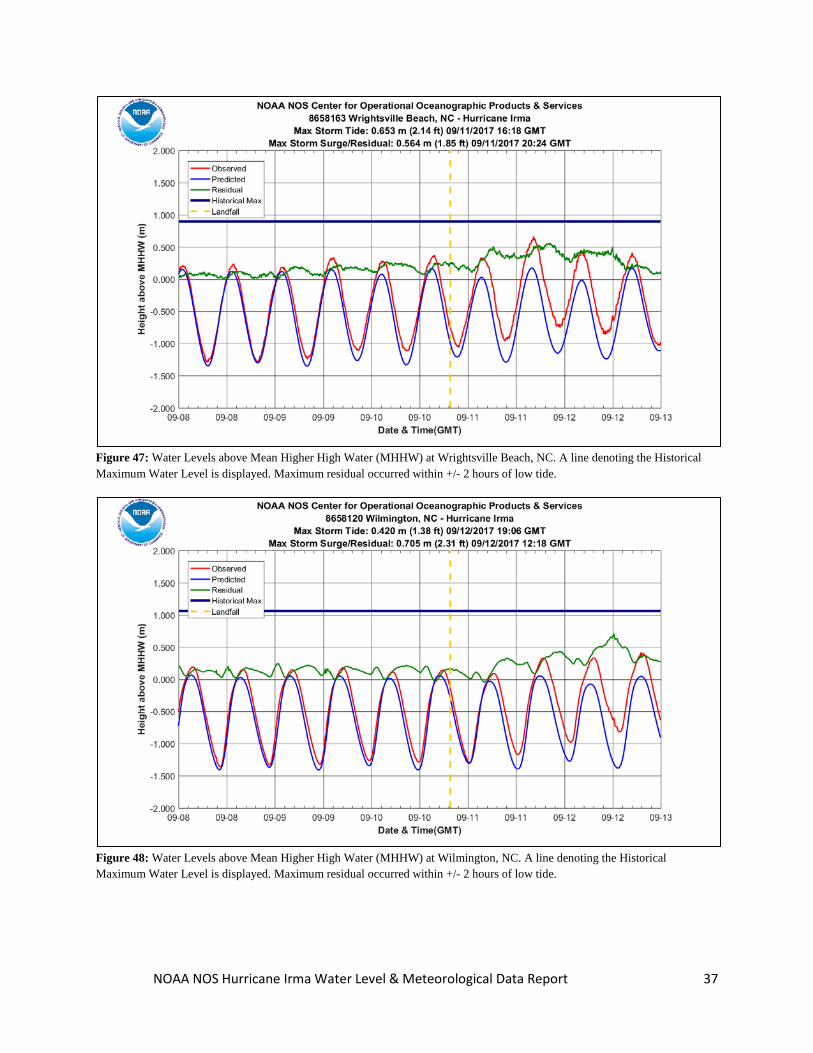
Figure 47: Water Levels above Mean Higher High Water (MHHW) at Wrightsville Beach, NC. A line denoting the Historical Maximum Water Level is displayed. Maximum residual occurred within +/- 2 hours of low tide.
Figure 48: Water Levels above Mean Higher High Water (MHHW) at Wilmington, NC. A line denoting the Historical Maximum Water Level is displayed. Maximum residual occurred within +/- 2 hours of low tide.
NOAA NOS Hurricane Irma Water Level & Meteorological Data Report 38
Acknowledgements: This report represents the cumulative efforts of the personnel of the Center for Operational
Oceanographic Products and Services (CO-OPS). We would like to thank the Oceanographic Division’s Data Processing Team who were responsible for the processing, analysis and verification of the data incorporated into this report. We would like to thank the Continuous Operational Real-Time Monitoring System (CORMS) team who performed an around-the-clock thorough QA/QC assessment on all real-time data. We would like to thank the Field Operations Division personnel who operated and maintained all stations to ensure that a reliable and robust source of real-time data was readily available.
NOAA NOS Hurricane Irma Water Level & Meteorological Data Report 39
Appendix 1: Contact Information For further information or updates on the Storm Technical Reports and Storm QuickLook product, contact: Storm QuickLook Center for Operational Oceanographic Products and Services (CO-OPS) 1305 East-West Highway Silver Spring, MD 20910-3281 Phone: (240) 533-0580 Fax: (301) 713-4437 E-mail: Storm QuickLook ([email protected])

NOAA NOS Hurricane Irma Water Level & Meteorological Data Report 40
Appendix 2: NOS Water Level Station Locations
Station Name Station ID Latitude Longitude
Barbuda, AG 9761115 17.59083 -61.82056 Mona Island, PR 9759938 18.08992 -67.93850 Mayaguez, PR 9759394 18.21756 -67.15883 Magueyes Island, PR 9759110 17.97000 -67.04639 Arecibo, PR 9757809 18.48056 -66.70250 San Juan, La Puntilla, San Juan Bay, PR 9755371 18.45917 -66.11639 Yabucoa Harbor, PR 9754228 18.05508 -65.83300 Fajardo, PR 9753216 18.33522 -65.63111 Esperanza, Vieques Island, PR 9752695 18.09386 -65.47136 Isabel Segunda, Vieques Island, PR 9752619 18.15253 -65.44381 Culebra, PR 9752235 18.30086 -65.30247 Charlotte Amalie, VI 9751639 18.33583 -64.92000 Lime Tree Bay, St. Croix, VI 9751401 17.69472 -64.75381 Lameshur Bay, St John, VI 9751381 18.31825 -64.72422 Christiansted Harbor, St Croix, VI 9751364 17.75000 -64.70500 Pensacola, FL 8729840 30.40439 -87.21119 Panama City Beach, FL 8729210 30.21331 -85.87831 Panama City, FL 8729108 30.15228 -85.66694 Apalachicola, FL 8728690 29.72670 -84.98170 Cedar Key, FL 8727520 29.13361 -83.03089 Clearwater Beach, FL 8726724 27.97830 -82.83170 Mckay Bay Entrance, FL 8726667 27.91333 -82.42500 Old Port Tampa, FL 8726607 27.85778 -82.55278 St Petersburg, Tampa Bay, FL 8726520 27.76056 -82.62694 Port Manatee, FL 8726384 27.63833 -82.56250 Fort Myers, Caloosahatchee R, FL 8725520 26.64770 -81.87120 Naples, Gulf of Mexico, FL 8725110 26.13167 -81.80747 Key West, FL 8724580 24.55570 -81.80790 Vaca Key, Florida Bay, FL 8723970 24.71100 -81.10650 Virginia Key, Biscayne Bay, FL 8723214 25.73140 -80.16180 Lake Worth Pier, Atlantic Ocean, FL 8722670 26.61278 -80.03417 Trident Pier, Port Canaveral, FL 8721604 28.41583 -80.59306 Racy Point, St Johns R, FL 8720625 29.80170 -81.54830 I-295 Bridge, St Johns R, FL 8720357 30.19170 -81.69170 Southbank Riverwalk, St Johns R, FL 8720226 30.32000 -81.65830 Dames Point, FL 8720219 30.38670 -81.55830 Mayport (Bar Pilots Dock), FL 8720218 30.39817 -81.42789

NOAA NOS Hurricane Irma Water Level & Meteorological Data Report 41
Station Name Station ID Latitude Longitude Fernandina Beach, FL 8720030 30.67139 -81.46583 Fort Pulaski, GA 8670870 32.03670 -80.90170 Charleston, Cooper River Entrance, SC 8665530 32.78083 -79.92361 Oyster Landing (N Inlet Estuary), SC 8662245 33.35170 -79.18670 Springmaid Pier, SC 8661070 33.65500 -78.91831 Wrightsville Beach, NC 8658163 34.21331 -77.78669 Wilmington, NC 8658120 34.22750 -77.95361
NOAA NOS Hurricane Irma Water Level & Meteorological Data Report 42
Appendix 3: Definitions Excerpts From: Tide and Current Glossary, NOAA National Ocean Service, Silver Spring, MD, 2000 (https://www.tidesandcurrents.noaa.gov/publications/glossary2.pdf), the Tidal Datums homepage (https://www.tidesandcurrents.noaa.gov/datum_options.html), the Storm QuickLook homepage (https://tidesandcurrents.noaa.gov/quicklook.html), the NGS webpage on Vertical Datums (https://www.ngs.noaa.gov/datums/vertical), and NOAA’s Vertical Datum Transformation webpage (https://vdatum.noaa.gov/docs/datums.html) Bench mark (BM): A fixed physical object or mark used as reference for a horizontal or vertical datum. A tidal bench mark is one near a tide station to which the tide staff and tidal datums are referred. A primary bench mark is the principal mark of a group of tidal bench marks to which the tide staff and tidal datums are referred. Chart datum: The datum to which soundings on a chart are referred. It is usually taken to correspond to a low-water elevation, and its depression below mean sea level is represented by the symbol Z. Since 1980, chart datum has been implemented to mean lower low water for all marine waters of the United States, its territories, Commonwealth of Puerto Rico, and Trust Territory of the Pacific Islands. Datum (vertical): For marine applications, a base elevation used as a reference from which to reckon heights or depths. It is called a tidal datum when defined in terms of a certain phase of the tide. Tidal datums are local datums and should not be extended into areas which have differing hydrographic char-acteristics without substantiating measurements. In order that they may be recovered when needed, such datums are referenced to fixed points known as bench marks. See chart datum and bench marks. Historical Recorded Maximum Tide Level: The maximum tide elevation measured by a water level station with a continuous time series throughout a high tide cycle. A complete cycle is required to calculate the maximum tide elevation, using a best fit curve of the observations. These historical records may not have included the highest water levels measured at a station during an event if a complete high tide cycle was not measured due to station/sensor damage. See storm tides. Mean Lower Low Water (MLLW): A tidal datum. The average of the lower low water height of each tidal day observed over the National Tidal Datum Epoch. See National Tidal Datum Epoch. For stations with shorter series, comparison of simultaneous observations with a control tide station is made in order to derive the equivalent datum of the National Tidal Datum Epoch. Mean Higher High Water (MHHW): A tidal datum. The average of the higher high water height of each tidal day observed over the National Tidal Datum Epoch. For stations with shorter series, comparison of simultaneous observations with a control tide station is made in order to derive the equivalent datum of the National Tidal Datum Epoch.
NOAA NOS Hurricane Irma Water Level & Meteorological Data Report 43
Mean Sea Level (MSL): A tidal datum. The arithmetic mean of hourly heights observed over the National Tidal Datum Epoch. Shorter series are specified in the name; e.g. monthly mean sea level and yearly mean sea level. National Tidal Datum Epoch: The specific 19-year period adopted by the National Ocean Service as the official time segment over which tide observations are taken and reduced to obtain mean values (e.g., mean lower low water, etc.) for tidal datums. It is necessary for standardization because of periodic and apparent secular trends in sea level. The present National Tidal Datum Epoch is 1983 through 2001. It is reviewed annually for possible revision and must be actively considered for revision every 25 years. North American Vertical Datum of 1988 (NAVD 1988): A fixed reference for elevations determined by geodetic leveling. The datum was derived from a general adjustment of the first-order terrestrial leveling nets of the United States, Canada, and Mexico. In the adjustment, only the height of the primary tidal bench mark, referenced to the International Great Lakes Datum of 1985 (IGLD 1985) local mean sea level height value, at Father Point, Rimouski, Quebec, Canada was held fixed, thus providing minimum constraint. NAVD 1988 and IGLD 1985 are identical. However, NAVD 1988 bench mark values are given in Helmert orthometric height units while IGLD 1985 values are in dynamic heights. National Tidal Datum Epoch: The specific 19-year period adopted by the National Ocean Service as the official time segment over which tide observations are taken and reduced to obtain mean values (e.g., mean lower low water, etc.) for tidal datums. It is necessary for standardization because of periodic and apparent secular trends in sea level. The present NTDE is 1983 through 2001 and is actively considered for revision every 20-25 years. Tidal datums in certain regions with anomalous sea level changes (Alaska, Gulf of Mexico) are calculated on a Modified 5-Year Epoch. National Water Level Observation Network (NWLON): The network of tide and water level stations operated by the National Ocean Service along the marine and Great Lakes coasts and islands of the United States. Neap tides: Tides of decreased range occurring semimonthly as the result of the Moon being in quadrature (first or last quarters). Non-tidal: Water levels may be classified as tidal or non-tidal. Water bodies with little or no range in tide and where the rise and fall of the water surface can no longer be practically measured in a predictable rhythm due to masking of the tide by hydrologic, wind, or other effects are non-tidal. Ortho: Abbreviation for “orthometric” datum (employs the Earth’s gravity field). Any height referenced to the Earth’s gravity field can be called a “geopotential height,” which represents the distance between the geoid and a point on the Earth’s surface measured along the plumb line. A geoid is a specified equipotential surface, defined in the Earth’s gravity field, which best fits, in a least squares sense, global mean sea level. The orthometric datums corresponding to the continental United States, Puerto Rico and the U.S. Virgin Islands are NAVD88, PRVD02 and VIVD09, respectively. Range of tide: The difference in height between consecutive high and low waters. The mean range is the difference in height between mean high water and mean low water. The great diurnal range or diurnal range is the difference in height between mean higher high water and mean lower low water. For other ranges see spring, neap, perigean, apogean, and tropic tides; and tropic ranges.
NOAA NOS Hurricane Irma Water Level & Meteorological Data Report 44
Tide: The periodic rise and fall of a body of water resulting from gravitational interactions between Sun, Moon, and Earth. The vertical component of the particulate motion of a tidal wave. Same as astronomic tide. Tide (water level) gauge: An instrument for measuring the rise and fall of the tide (water level). Water levels may be classified as tidal and non-tidal. Spring tides: Tides of increased range occurring semimonthly as the result of the Moon being new or full. Storm Surge/Residual: The onshore rush of sea or lake water caused by the high wind and the low pressure centers associated with a landfalling hurricane or other intense storm. The amplitude of the storm surge at any given location is dependent upon the orientation of the coastline with the storm track, the intensity, size and speed of the storm, and the local bathymetry. In practice, storm surge is usually estimated by subtracting the normal or astronomical tide from the observed storm tide at tide stations. This difference between observed storm tides and astronomical tide can have other components such as regional elevated mean sea levels in the Gulf of Mexico due to the Loop Current, elevated sea levels on the West Coast due to El Niño Southern Oscillation (ENSO), or local elevated sea levels due to river runoff in tidal rivers. Storm Tide: The maximum water level elevation measured by a water level station during storm events. Depending on location, the storm tide is the potential combination of storm surge, local astronomical tide, regional sea level variations and river runoff during storm events. Since wind generated waves ride on top of the storm surge (and are not included in the definition), the total instantaneous elevation may greatly exceed the predicted storm surge plus astronomical tide. It is potentially catastrophic, especially on low lying coasts with gently sloping offshore topography.