noaa technical memorandum ar 5 o forecasting ice in cook inlet richard j. hutcheon wsfo, anchorage,...
TRANSCRIPT

f
"
ALASKA REGIONAnchorage,AlaskaAugust 1972
NOAA TECHNICAL MEMORANDUM AR 5
lIaUoaa1 OcaaD1c ADd At_pheric AdII1n1atraUoalIaUoaa! weather S.rnce
fORECASTING ICE IN COOK INLETALASKA
RICHARD J. HlITCHEONMARINE METEOROLOGIST
ANCHORAGE, ALASKA

o
o
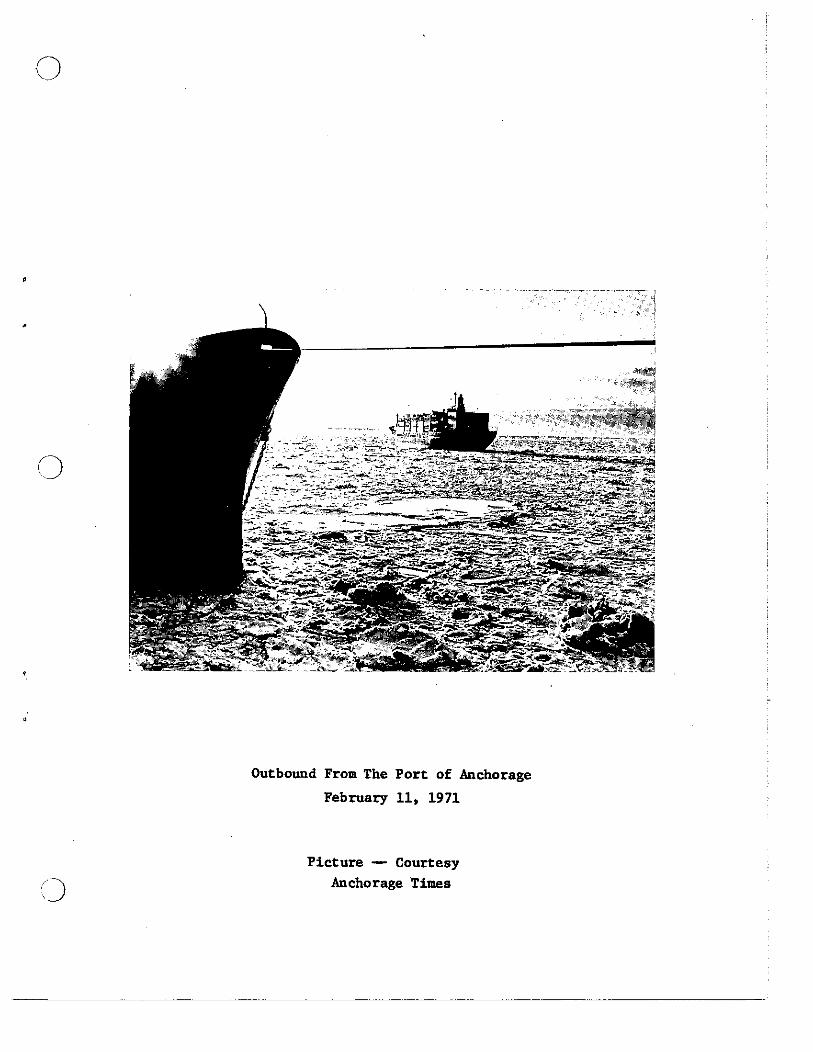
Outbound From The Port of Anchorage
February 11, 1971
Picture -- CourtesyAnchorage Times

..
.,
o
o
ALASKA REGION
ANCHORAGE, ALASKAAugust 1972
U.S. DEPARTMENT OF COMMERCENATIONAL OCEANIC AND ATMOSPHERIC ADMINISTRATION
NATIONAL WEATHER SERVICE
NOAA Technical Memorandum AR 5
FORECASTING ICE IN COOK INLET, ALASKA
Richard J. Hutcheon
1

,n
o
TABLE OF CONTENTS
Map of Cook Inlet ..
Discussion ..
PICTURES
FIGURES
PAGE1
2-5
6-9
1. Ice Thickness VS Frost Degree Days .................................... 10
2. Normal Cook Inlet Ice Thickness •••••••••••••••••••••• 11
3.
4.
Ice Growth with Snowcover
Decrease in Ice Thickness
........................................................
~ ..
12
13
References -................................................................ 14
ii

o
()
()
N
t
VAu9ustineIs1.
CapeDouglas
....w...z
><<><><.>
Q191njJK~~l.
~ PI?'Barren 151.
1

•
•
o
o
()
FORECASTING ICE IN COOK INLET
Richard J. HutcheonWSFO, Anchorage, Alaska
The unique character of Cook Inlet makes the forecasting, and even thestudy of ice conditions highly complex. The usual computations of icethickness using the accumulated frost degree days is complicated by theoccurrence of a number of periods during the winter when the averagedaily temperatures rises above freezing. The tidal action in the Inletfurther complicates any study of ice conditions by creating huge pilesof ice on the mud flats and occasionally lifting them free. In additiona number of rivers drain into the Inlet, creating areas of mostly freshwater, as well as releasing large fresh water ice cakes during riverbreakup •
TYPES OF ICE. The ice in Cook Inlet comes from four different sources(6).
1. Sea Ice. This type is formed in sea water, first developing a thincrust on the surface and growing through the addition of ice on the bottom of the surface layer. Sea ice is the predominant type of ice inCook Inlet.2. Beach Ice. The large tidal range in the Inlet accounts for the sudden appearance of a considerable amount of ice on the mud flats early inthe winter. The ebbing tide exposes the mud to cold air, freezing theupper layer of mud. On flood tide, the water adjacent to the frozen mudalso freezes. Growth may be as much as an inch or more a day. Generally,however, a thickness no greater than about 20 inches is reached before theice is pulled free of the mud. Some beach ice is lifted higher on the beach and some is carried out into the Inlet, where it grows much the same assea ice.3. Stamukhas. Observers have seen ice cakes greater than 20 feet thickon the mud flats. These result from beach ice which has broken free, beendeposited higher on the mud flats, and frozen to the underlying mud. Icefloes floating toward the beach are caught on top of the higher piece ofice and, as the tide recedes, the overhanging pieces break off leaving astack of layered ice with nearly straight sides. This process is repeatedmany times, being limited only by the height of the tides and the strengthwith which the original beach ice is frozen into the mud. On high tide,occasional stamukhas of massive proportions are carried into the Inlet.Stamkhas 20 feet high, 30 feet wide and 60 feet long grounded on MiddleGround Shoal were observed by Pan American personnel in 1964.4. Estuary and River Ice. Fresh water ice forms during the winter inestuaries and rivers around Cook Inlet. The estuary ice grows in the samemanner as sea ice but is much harder. The river ice is unaffected by tidalactions and remains in the rivers until spring breakup. At that time, aconsiderable quanity of river ice with thicknesses up to 6 or 7 feet may bedischarged into the Inlet.
2

()
o
()
ICE THICKNESS. K. A. Blenkarn (2) of Pan American Petroleum Corporation,during the winter of 1964-65, obtained quantitative information on themovement of ice in Cook Inlet. His study indicated that ice tends tomove out of the Inlet at speed varying between about 2 and 5 miles a day.Assuming the slower speed of 2 miles a day, an ice floe would have approximately 30 days to grow in the northern part of the Inlet before reachingwarmer water south of the Forelands. Therefore, when computing sea icethickness in the Inlet an average growth period of 30 days must be used.
Kriskern and Potocsky (3) computed sea ice growth at 60 Arctic stationsusing cumulative frost degree days. Numerous equations are available toforecast the ice growth. Bilello (1) summarizes these as follows:
"Using 19 stations in the Kara, East Siberian, Chukhotsh, Barents, andLaptev seas for 24 station years of observations, Levedev found the accretion of sea ice (under average snow cover conditions) related to the sumof negative mean daily air temperature as follows:
h = 1.33 (:fe ) 0.58
h = ice thickness in centimeters
:z:. e = sum of negative airtemperature (below O·C)
"An equation of the same form
h = 1.53 (~e) 0.59
fits data obtained by Graystone in Button Bay near Churchill Canada, whensnow cover was negligible.
"Zubov expresses ice thickness as
h2 + 50h = 8'i:e
for stations in the Kara and Chukhotsh seas.
"Lebdev also introduces the formula
h= (1.245) (c'"') 0.62 (h) -1.5oC.."'" s
which defines the dependence of ice accretion h on negative air temperatureE1 (below O·C) and the thickness of snow cover on ice in centimeters hs •
This equation, however, was based on only one year of data on fresh waterice from the Yana River at Kazach'ye and the Kolyma River at Konzoboy innortheast Russia.
3

()
•
liAssur presents the relation
h = (K) 1. 06 "IS
where h = ice thickness ininches
K = coefficient, considering snow coverstream flow and otherlocal conditions
S = accumulated degree daysof frost since freeze~
up (below n'F)"
Bilello (1) presents the following equation as approximately describingsea ice accretion of snow-free ice:
I • 1.q..f,lfiiiiwhere I is in inches.()
I = 3.551~FDD
I
or
• ice thickness in centimeters FDD = frost degree days.
,
This equation is based on 30'F, and was chosen for this study.
A graph of Bilello's equation is shown in Figure 1. From this graph andthe maximum and minimum temperatures at Anchorage International Airport,the ice thickness in the northern part of the Inlet can easily be determined by summing the number of degrees that the average daily temperatureis below 30·F. Figure 2 shows the normal ice growth in the northern partof the Inlet using Bilello's equation with 42 years of temperature dataand assuming that the ice moves out of the Inlet in 30 days.
SNOW COVER. The effect of snow cover on the growth of ice can not be overemphasized. The Hand Book of Geophysics for Air Force Designers (5) saysthat 1 inch of normal snow will have about the same insulating effect as16 inches of ice. Under one inch of snow cover, a thin layer of ice willgrow at the same rate as 16 inches of ice with no snow cover. Figure (3)is a series of graphs which show the rate of ice growth under differentamounts of snow cover. It can be seen from this figure that just a fewinches of snow dramatically alters the growth of ice. It can be assumedthat ice floes which have more than 6 inches of snow on them will not in~
crease in thickness.
DECREASE IN ICE THICKNESS. As with ice growth, the decrease in ice thickness can be described by a number of equations. Bilello (1) empiricallydeveloped the following equation for the decrease in ice thickness.
4

•
•
()
(j
()
A I = O.22~ WDD
~ WDD = accumulation of warming degreedays <=r30°F)
AI - decrease in ice thickness ininches.
A graph of this equation appears in Figure 4. From the graph, the decreasein ice thickness can be obtained.
Figures 3 and 4 describe ice growth and disintegration knowing only airtemperatures. It is interesting to note that while it requires 450 frostdegree days to grow ice 30 inches thick, only 135 warming degree days areneeded to melt 30 inches of ice.
The results of the scheme developed in this paper for determing ice thickness in Cook Inlet are not unreasonable. The maximum accumulation of degree days over a 3D-day period occurred in 1964-65 when 1075 degree daysaccumulated. Figure 3 indicates that bare ice would have grown to about 4feet with this accumulation. This agrees well with observations by CaptainCollar of ice off Point Possession during the winter of 1964-65. Figure 2indicates that an ice thickness of nearly 3 feet can be expected during a"normal" year.
5

()
•
(J
()
Ice on beach of Cook Inlet January 1969----Courtesy CaptainB.J. Logan, American Institute of Marine Underwriters.
6
o
()
()
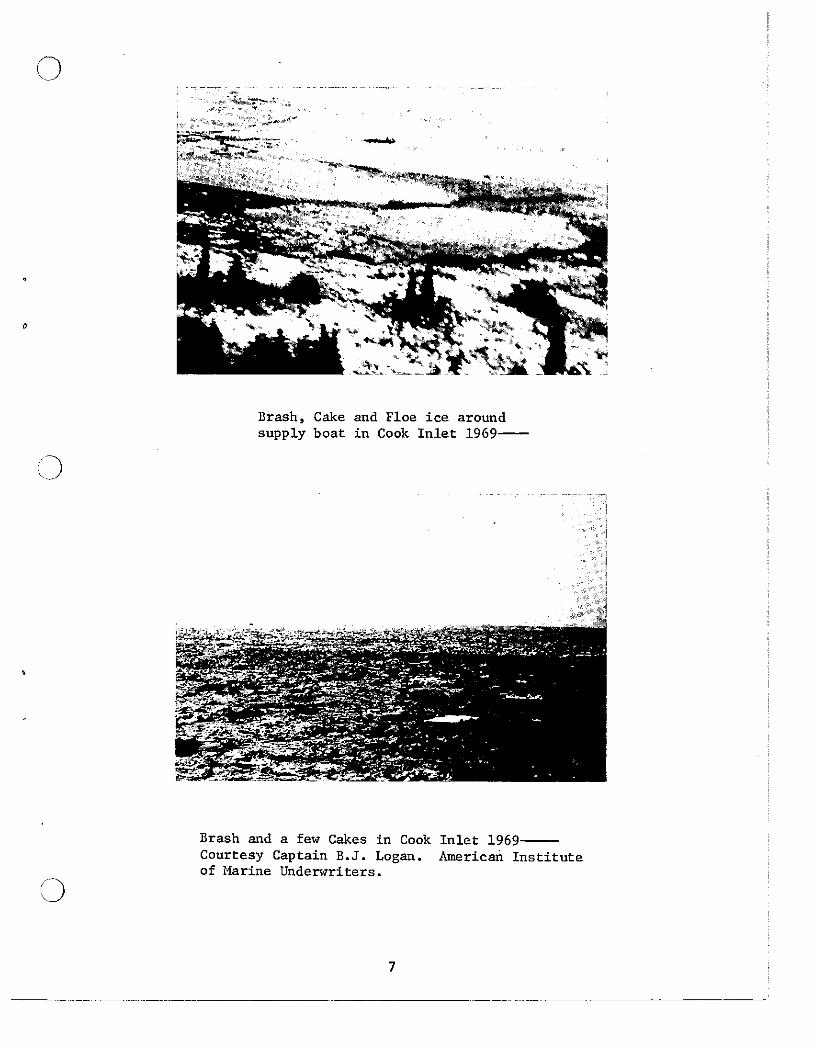
Brash, Cake and Floe ice aroundsupply boat in Cook Inlet 1969----
()
Brash and a few Cakes in CookCourtesy Captain B.J. Logan.of Marine Underwriters.
7
Inlet 1969-American Institute

()
,
..
"""- "" ..... '
.c.~ -r'~.,
()
Mud Flats at low tide North side Cook Inlet nearPt. McKenzie--National \-Ieather Service
Mud Flats at low tide between Fire Island andAnchorage near International Airport---NationalWeather Service
8
"'-"-'--

()
()I
Ice mixed with silt and gravel near Port of Anchorage-Courtesy Captain B.J. Logan, American Institute ofUnderwriters.
9

,
o
oFrost Degree Days lEase 30°)
()
()
Ho<D
!:f".~<D0101
+l
-; LCI I
, ,iiii I I
I I
10

o
()
()
()
"•
•
I I:""""
•
II I,-,
-H'"1 II-Mi--- ,
, I
• I
•
Ice Thickness {Inches)
11

-,
(J
()
Ice Thickness (Inches)'" I\> \II \II
•
12

()
()
i)
; !
II
+-!
!_-
'
I I _-.L....L. --L I
I
Accumulative Wa~.ing D.g~ee Days (Base 300~)
13

•
REFERENCES
1. Bilello, M.A. Formation Growth and Decay of Sea Ice in theCanadian Arctic Archipelago. u. S. Army Snow Ice and Permafrost Research Establishment. Wilmette, Illinois. 1960.
2. Blenkarn, D. A. Data Analysis, Cook Inlet Ice Studies. PanAmerican Petroleum Corporation. 1966.
3. Kniskern, Franklin E., and Gsbrie1 J. Potocsky. Frost DegreeDay, Related Ice Thickness Curves, and Harbor Freezeup andBreakup Dates for Selected Arctic Stations. U. S. Naval Oceanographic Office, Washington, D. C. 1965.
4. Wittman, Walter and Gorden P. MacDowell. Manual of Short TermSea Ice Forecasting. U. S. Naval Oceanographic Office, WashingtonD. C.
5. Handbook of Geophysics for Air Force Designer. Air Fore CambridgeResearch Center, Cambridge, Mass. 1957.
6. Summary Report Cook Inlet Ice Studies. Pan American PetroleumCorporation. 1964 •
141689-73