no slide title - home - office of facilities...
TRANSCRIPT

G. Kemble Bennett, Ph.D., P.E.Vice Chancellor and Dean of Engineering
Director, Texas Engineering Experiment StationHarold J. Haynes Dean’s Chair Professor
Space NeedsDwight Look College of Engineering
Presentation to the Council on the Built EnvironmentApril 28, 2010
Overview
• College of Engineering Overview• College of Engineering Space at Glance• 2008 SNAPS Summary• College of Engineering Space Needs
Projections - 2015• Reasons for Increased Space Needs

Texas A&M University
Total Enrollment (Fall 2009)
University total
48,702College of Engineering
10,735
7,882 UNDERGRADUATE
2,853GRADUATE
(Source: OISP)
OTHER COLLEGES

Dwight Look College of Engineering
Total Enrollment
7598 7055 6628 6772 7257 7344 7643 7882
2093 2215 2153 2064 2206 2399 2659 2853
0
2000
4000
6000
8000
10000
12000
2002 2003 2004 2005 2006 2007 2008 2009
Fall SemesterGraduate Undergrad
9691 92708781 8836
9463 9743 10,302 10,735
Source – OISP

93
0
10
20
30
40
50
60
70
80
90
100
2002
2003
2004
2005
2006
2007
2008
2009
National Merit Scholar EnrollmentBy College

Tenured/Tenure Track Faculty
0
50
100
150
200
250
300
350
400
450
2002 2003 2004 2005 2006 2007 2008 2009
Tenure Track
Tenured

Results of Faculty Reinvestment
Fall 2002 Fall 2009 Increase
Tenured/Tenure Track Faculty *:
290 400 38%
Tenured 221 261 18%
Tenure Track 69 139 101%
Tenured/Tenure Track Faculty Diversity:
Women 19 55 189%
Hispanic 14 26 86%
African American 3 8 166%
*Total Faculty Fall 2009: 468

Quality Engineering Faculty
• 44 CAREER Award Recipients since January 2003
• 11 NAE Members• 10 Distinguished
Professors• 16 Regents Professors• 122 Endowed Chairs and
Professorships

Source: U.S. News and World Report Rankings of Public Universities
Undergraduate Program
Graduate Program
Departments Ranked in Top 10
Research Expenditures
Dwight Look College of Engineering
2009-2010 National Rankings
9th
6th
82nd

Department Rankings - Public Institutions
• 9th College - Overall
• 1st Petroleum Engineering • 2nd Nuclear Engineering • 3rd Agricultural Engineering • 7th Industrial Engineering • 8th Aerospace Engineering• 8th Civil Engineering• 9th Mechanical Engineering • 9th Electrical Engineering• 13th Chemical Engineering
• 6th College - Overall
• 2nd Petroleum Engineering• 3rd Biological/Ag Engineering• 3rd Nuclear Engineering • 6th Aerospace Engineering • 6th Industrial Engineering • 8th Civil Engineering • 9th Mechanical Engineering • 14th Electrical Engineering • 17th Chemical Engineering • 18th Biomedical Engineering
Undergraduate Program Graduate Program
Source: U.S. News & World Report – Fall 2009 Source: U.S. News & World Report – Spring 2010

Formal Proposal Submissions
0
200
400
600
800
1,000
1,200
SEPT OCT NOV DEC JAN FEB MAR APR MAY JUNE JULY AUG
FY10
FY09
FY08
FY07
FY06

Sponsored Research Awards
$0
$20
$40
$60
$80
$100
$120
SEPT OCT NOV DEC JAN FEB MAR APR MAY JUNE JULY AUG
FY10
FY09
FY08
FY07
FY06
Mill
ions

Sponsored Research Expenditures
$0
$10
$20
$30
$40
$50
$60
$70
$80
SEPT OCT NOV DEC JAN FEB MAR APR MAY JUNE JULY AUG
FY10
FY09
FY08
FY07
FY06
Mill
ions

Texas A&M Engineering Facilities Housed in some thirty-five buildings
that stretch across Brazos County:
Main Campus
West Campus
University Services Building
Easterwood Airport
Riverside
863,178 Assignable Square Feet (ASF) of space
Note: This does not include any TEES, TTI or TEEX space.

Riverside
Engineering Facilities at a Glance
Easterwood
Main & West Campus
University Services Building
35 buildings stretching across Brazos County from Riverside to east of HWY 6.

Engineering Facilities - Main Campus20 Buildings House College of Engineering
Astronomy & Space Sciences Engineering Bldg
H. R. Bright Bldg
Civil Engineering Bldg Hydromechanics Lab Bldg
Civil Engineering Lab Bldg Jack E. Brown Bldg
Coastal Engineering Lab Reed McDonald Bldg
Concrete Materials Lab Richardson Bldg
Doherty Building Teague Bldg
Engineering/Physics Lab Bldg
Thompson Hall
Engineering/Physics Office Tower
Volatile Storage bldg
Fermier Hall Wisenbaker
Graphics Services Bldg Zachry Engineering Center

Engineering Facilities - Easterwood Airport
Eight buildings, all under the Department of Aerospace Engineering, house:
•various wind tunnel research facilities
•the LASR (Land, Air, Space & Robotics) building – otherwise known as the HTRI facility
•hangar for real time aircraft flight research vehicles
Wind Tunnel Facility
Aircraft hangar
LASR Facility

Engineering Facilities – Riverside Campus
Seven buildings at Riverside Campus, under various departments in the College, house:
•a multitude of research functions
•much needed storage space
Wind Tunnel Facility

Engineering Facilities – University Services Bldg• ~ 1/3 of ASF is Engineering
• Used for research by multiple departments
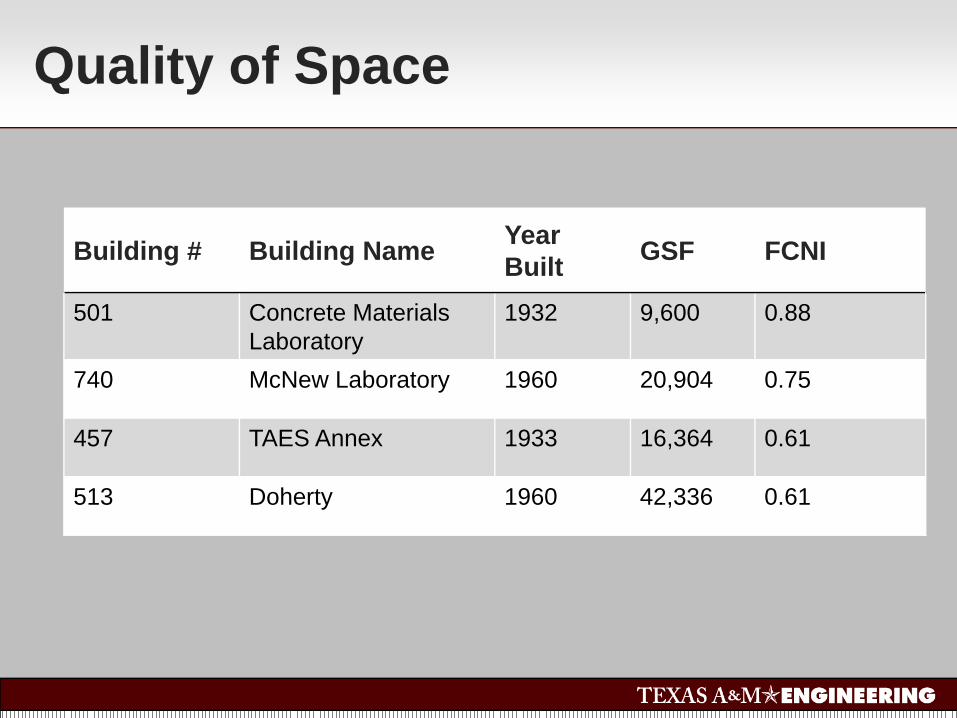
Quality of Space
Building # Building Name YearBuilt GSF FCNI
501 Concrete Materials Laboratory
1932 9,600 0.88
740 McNew Laboratory 1960 20,904 0.75
457 TAES Annex 1933 16,364 0.61
513 Doherty 1960 42,336 0.61

Concrete Materials Lab Building
• Built in 1932 as a livestock facility• No central HVAC• Wooden roof structure without
sprinklers• Located on main campus right
behind WERC

Hydromechanics Lab
Sister building to Concrete Materials lab built in 1932
• No building-wide central HVAC, only isolated units; mostly window AC
• Wooden roof structure without sprinklers
• Extremely hot in warm season• Exterior beyond repair with
rotting wood and squirrel nests

Zachry Engineering Center
Currently remains the flagship of the COE• Finally receiving a much needed face lift• Fountain finally works after sixteen years • Leaky windows

Thompson Hall
Also built in the 1930’s, 95% of all the labs, classrooms and shops of the ETID department are housed in this grossly inadequate space
• Originally built as a livestock facility now used as a lab building
• ETID has done a superb job retrofitting Thompson over the last ten years to suit their needs but are still extremely short on usable space.


Space acquired since 2008 SNAPS
• Mechanical Engineering acquired 24,225** ASF from Physics move to the Mitchell Building:
– Engineering Physics Building - 4th and 5th
floors – Doherty– Cain - 2nd and 4th floors
**COE originally promised 45,481 ASF from Mitchell Backfill

Emerging Technologies Building
~ 79,200 ASF for Engineering Completion - June 2011

Office Space Needs Lab Space Needs Special Use Needs
Dept. Admin Faculty StaffLecturer/ Post Doc
Grad Std. Teaching Research
Computer/Special
Use ConferenceStorage/Server Auditorium Total
ESSAP 1,000 1,000 2,000 0 0 0 0 0 1,200 200 1,000 6,400AERO 1,000 290 650 1,230 5,250 9,500 5,400 2,500 2,100 250 1,000 29,170BMEN 344 163 588 858 2,904 1,225 27,013 4,874 1,229 352 0 39,550CHEN 0 600 3,285 550 15,169 1,022 15,600 0 0 192 0 36,418CSCE 0 1,299 528 0 750 1,432 4,678 0 2,209 711 0 11,607CVEN 0 875 0 1,400 7,200 7,810 3,010 1,256 0 0 3,500 25,051ECEN 0 1,038 600 1,304 15,195 5,954 19,860 500 1,259 1,984 0 47,694ETID 909 1,481 654 692 2,192 6,457 2,323 765 309 853 596 17,231ISEN 480 1,032 326 1,204 3,246 5,385 22,638 1,075 6,091 500 2,000 43,977MEEN 0 0 0 2,976 13,645 4,951 23,454 0 728 3,734 0 49,488NUEN 1,078 1,488 948 0 2,147 0 3,988 1,337 440 406 0 11,832PETE 450 1,050 650 1,000 2,500 5,000 7,679 2,000 2,200 1,000 0 23,529MSEN 200 200 100 1,000 4,000 400 4,000 500 800 250 0 11,450
Total 5,461 10,516 10,329 12,214 74,198 49,136 139,643 14,807 18,565 10,432 8,096 353,397
Total Office Needs 112,718Total Lab Space Needs 203,586
College of Engineering Space Needs Projections for 2015
Total Special Use Needs 37,093Total Space Need by 2015 353,397

Fall 2004 Fall 2009 Increase
Assignable Square Feet (ASF) 765,797 863,178 13%
Undergraduate Enrollment 6,628 7,882 19%
Graduate Enrollment 2,153 2,853 33%
Total Enrollment 8,781 10,735 22%
Tenured/Tenure Track Faculty 327 400 22%
FY05 FY09
SCH 127,861 153,455 20%
WSCH 651,005 797,746 23%
Research Expenditures (Direct) $65,934,396 $73,206,840 11%
Research Awards $91,338,251 $121,956,082 34%
College of Engineering Growth

Reasons for Additional Space Needs
• Currently at a deficit• Increase in both undergraduate and graduate
enrollment• Increase in Tenured/Tenure Track Faculty• Increase in number of experimentalists• Increase in research awards• Acute shortage of conference rooms,
auditorium space, and server/storage rooms

Additional Space Needs by 2015
ASF
2008 SNAPS - Deficit (433,483)
Mitchell Backfill Received +24,225
Space to be gained by ETED in 2011 +79,200
Remaining COE Deficit (330,058)
COE Growth (including MSEN) until 2015 (23,339)
COE Space Needs by 2015 (353,397)
Summary
