no slide title - biuu.cs.biu.ac.il/~kapaho/cg/11_color.pdfthe spectral power distribution (spd) of a...
TRANSCRIPT

Color
Representation

Electromagnetic Radiation - Spectrum
400 nm 500 nm 600 nm 700 nm
Wavelength in nanometers (nm)
Gamma X rays Infrared Radar FM TV AMUltra-violet
10-12
10-8
10-4
104
1 108
electricityACShort-
wave
Wavelength in meters (m)
Visible light
What is a Color?

The Spectral Power Distribution (SPD) of a light is
a function V(l) which defines the power in the light
at each wavelength.
Wavelength (l)
400 500 600 7000
0.5
1
Re
lative
Po
we
r

12614111
3636 111
36
111
36 12
12 17
17 111
14
126
17
36
12
111
3636200 12
14
126 17
36 36
111
12
14
3636200 12
14
126 17
36 36
111
36200
200
12
14111
14
126
126
17
36
36
36
36
12
14
111
111
36
12617
36
36200
111
72
72
12
12 17
10 128
3617
200 11112
14
126
126
126
126
17 17
17
17
36
36
36
36
36
200
200
200
12
12
12
14
14
111
111
72
72
72 106 15510 128
3617
200 11112
14
126
126
126
126
17 17
17
17
36
36
36
36
36
200
200
200
12
12
12
14
14
111
111
72
72
72 106 155
14
126 17
36 36
111
36200
200
12
14111
14
126
126
17
36
36
36
36
12
14
111
111
36
12617
36
36200
111
72
72
12
12 17
12614111
3636 111
36
111
36 12
12 17
17 111
14
126
17
36
12
111
3636200 12
14
126 17
36 36
111
12
14
3636200 12
Rgb Image
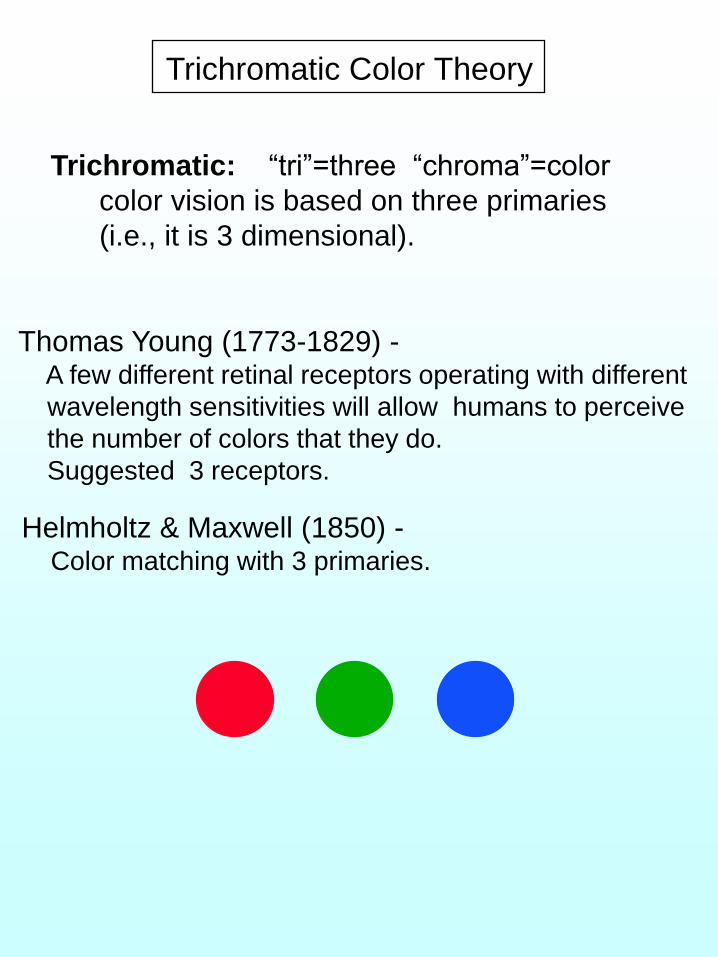
Trichromatic Color Theory
Thomas Young (1773-1829) -A few different retinal receptors operating with different
wavelength sensitivities will allow humans to perceive
the number of colors that they do.
Suggested 3 receptors.
Helmholtz & Maxwell (1850) -Color matching with 3 primaries.
Trichromatic: “tri”=three “chroma”=color
color vision is based on three primaries
(i.e., it is 3 dimensional).

Color Matching
Color Matching - behavioral basis for color
representation.
Metamer - two lights that appear the same
visually. They might have different SPDs
(spectral power distributions).
400 500 600 7000
400
800
400 500 600 7000
100
200
Wavelength (nm)
Po
we
r
The phosphors of the monitor were set to match
the tungsten light.
Tungsten light Monitor emission

+ -
+ -
+ -
test match
Color Matching Experiment
Three primary lights are set to match a test light.
=~
400 500 600 7000
0.25
0.5
0.75
1
400 500 600 7000
0.25
0.5
0.75
1
Test light Match light

The Human Eye
Optic NerveFovea
Vitreous
Optic Disc
Lens
Pupil
Cornea
Ocular Muscle
Retina
Humor
Iris

The Human Retina
light
rods cones
horizontal
amacrine
bipolar
ganglion

Cones -
Wavelength (nm)
Re
lative
se
nsitiv
ity
Retinal Photoreceptors
Cone Spectral Sensitivity
400 500 600 7000
0.25
0.5
0.75
1
• High illumination levels (Photopic vision)
• Less sensitive than rods.
• 5 million cones in each eye.
• Only cones in fovea (aprox. 50,000).
• Density decreases with distance from fovea.
• 3 cone types differing in their spectral
sensitivity: L , M, and S cones.
LMS

3D Color Spaces
R
G
B
Brightness
Hue
black-white
red-green
blue-yellow
Cubic Color Spaces
Polar Color Spaces
Opponent Color Spaces

Hue
Saturation
Brightness
Black
White
RG
B
Color Description
Hue (red, green, yelow, blue ...)
Saturation (pink,bright red, ....)
Lightness (black, grey, white ....)
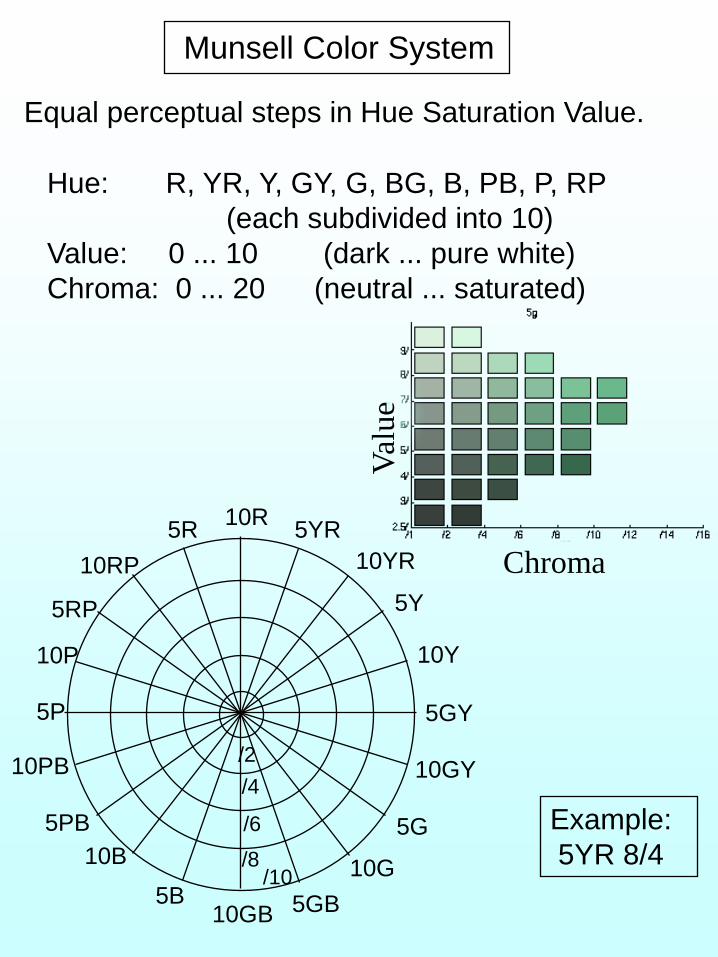
Munsell Color System
Equal perceptual steps in Hue Saturation Value.
Hue: R, YR, Y, GY, G, BG, B, PB, P, RP
(each subdivided into 10)
Value: 0 ... 10 (dark ... pure white)
Chroma: 0 ... 20 (neutral ... saturated)
5R10R
5YR
10YR
5Y
5PB
10PB
5P
10P
5RP
10RP
10B
5B10GB 5GB
10G
5G
10GY
5GY
10Y
/2
/4
/6
/8/10
Example:
5YR 8/4
Val
ue
Chroma

Munsell Book of Colors

Linear Color Spaces
Colors in 3D color space can be described as linear
combinations of 3 basis colors.
a + b + c=
The representation of :
is then given by: (a, b, c)

the color matching functions
Stiles & Burch (1959) Color matching functions.
Primaries are: 444.4 525.3 645.2
10 deg field..
r(l)
g(l)b(l)
400 500 600 700
0
1
2
3
Wavelength (nm)
Prim
ary
In
ten
sity
RGB Space
This is the color model used in color CRT monitors

Given the color matching functions, we can describe
any light with 3 values (CIE-RGB):
(85, 38, 10) (21, 45, 72) (65, 54, 73)
BG
R
Additive primaries

CIE Color Standard - 1931
CIE - Commision Internationale d‟Eclairage
XYZ tristimulus coordinate system.
1931 - defined a standard system for
color representation.
1) Non negative over the visible wavelengths.
2) The 3 primaries associated with x y z color
matching functions are unrealizable (negative
power in some of the wavelengths).
3) y was chosen to equal luminance of
monochromatic lights.
Wavelength (nm)
Tristim
ulu
s v
alu
es
400 500 600 700
0.2
0.6
1
1.4
1.8
z(l)
y(l)
x(l)

.
,
,
ll
ll
ll
l
l
l
dzPkZ
dyPkY
dxPkXz(l)
y(l)
x(l)
k is set so Y is between 0 and 100

RGB to XYZ
RGB to XYZ is a linear transformation
2.365 -0.515 0.005
-0.897 1.426 -0.014
-0.468 0.089 1.009
R
G
B
X
Y
Z
=
R = monochromatic primary 700nm
G = monochromatic primary 546.1nm
B = monochromatic primary 435.8nm
(Primaries are normalized so that equal amounts are
required to match equal energy illuminant E).
xλ, yλ, zλ, are linear combination of rλ, gλ, bλ.

X
Z
Y
X
Y

CIE Chromaticity Diagram
A common representative of color signal: [x,y,Y]
(x,y) – do not contain brightness info.x
650
610
590
550
570
600
580
560
540
505
500
510
520530
490
495
485
480
470450
1.00.50.0
0.5
0.9
y
0.0
All visible colors
Let’s ignore the brightness:
X+Y+Z
Y= y
X+Y+Z
X= x
x+y+z = 1
X+Y+Z
Z= z
y
x
650
610
590
550
570
600
580
560
540
505
500
510
520530
490
495
485
480
470450
1.00.50.0
0.5
0.9
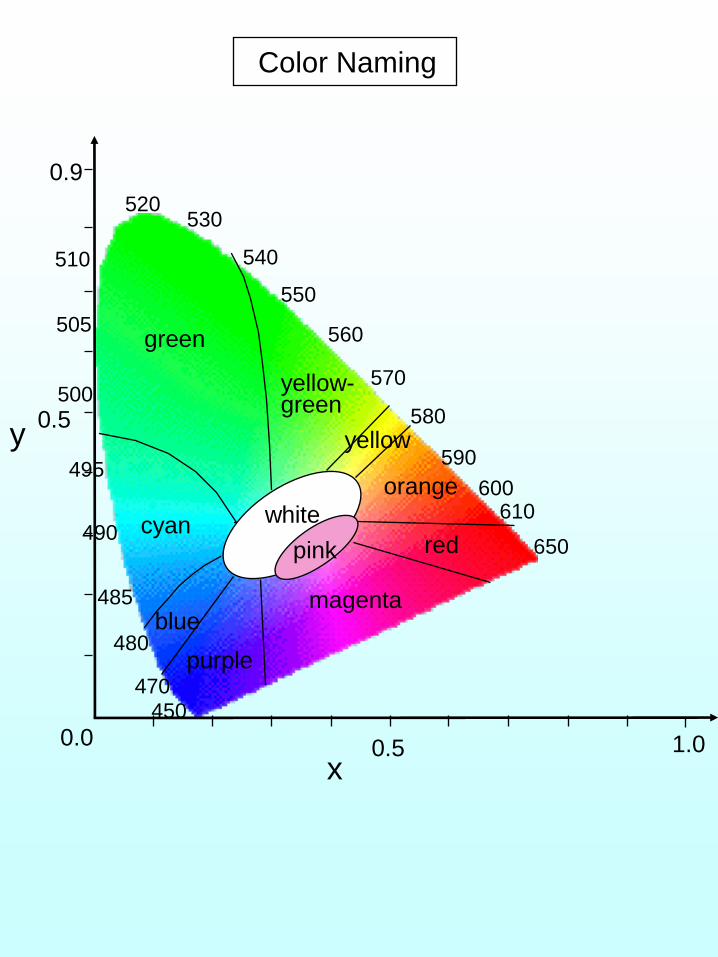
green
yellow-green
yellow
orange
red
magenta
purple
blue
cyan white
pink
Color Naming
x
650
610
590
550
570
600
580
560
540
505
500
510
520530
490
495
485
480
470450
y
C
A
B
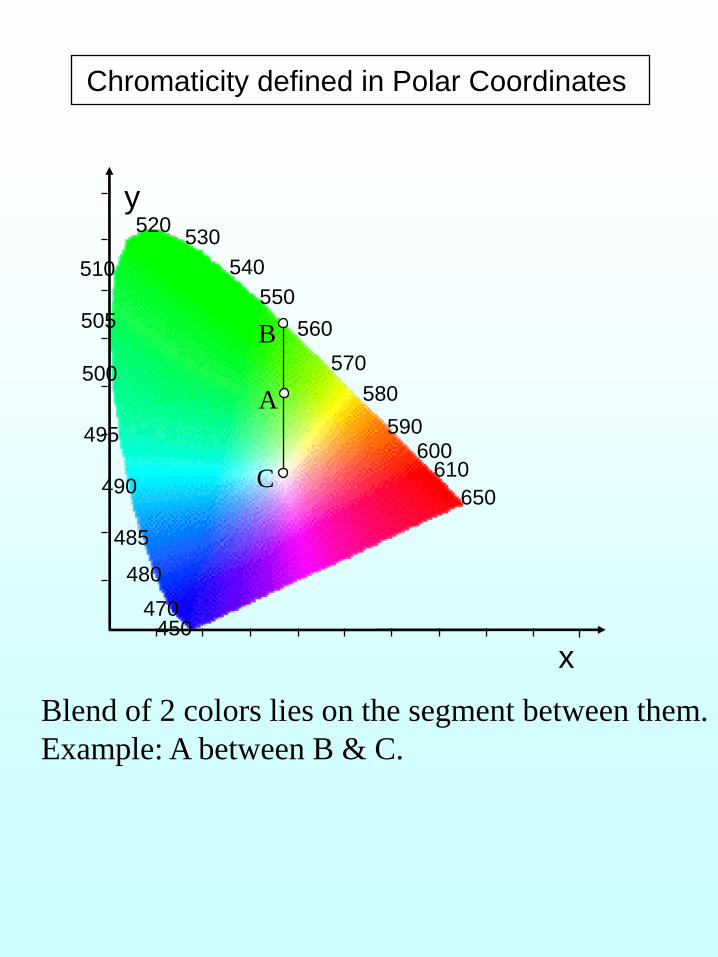
Blend of 2 colors lies on the segment between them.
Example: A between B & C.
Chromaticity defined in Polar Coordinates

Dominant Wavelength - wavelength of the
spectral color which added to the reference
white, produces the given color.
Reference white: CIE standard illuminant - C.
x
650
610
590
550
570
600
580
560
540
505
500
510
520530
490
495
485
480
470450
y
100% saturation (Purity)
Reference white
C
A
B
Example: B – dominant wave-length of A.
E is a dominant wavelength of D
Chromaticity defined in Polar Coordinates
D E

Complementary Wavelength - wavelength of the
spectral color which added to the given color,
produces the reference white.
x
650
610
590
550
570
600
580
560
540
505
500
510
520530
490
495
485
480
470450
y
C
Chromaticity defined in Polar Coordinates
Complementary Wavelength of color D is E’.
A does not have a complimentary wavelength.„
A
B
D E
E’

x
650
610
590
550
570
600
580
560
540
505
500
510
520530
490
495
485
480
470450
y
100% saturation (Purity)
C
A
B
Excitation purity of A: AC/BC
Excitation purity of D: DC/EC
Chromaticity defined in Polar Coordinates
Excitation Purity - the ratio of the lengths between
the given color and reference white and between
the dominant wavelength light and reference
white.
Ranges between 0 .. 1.
PurityD E
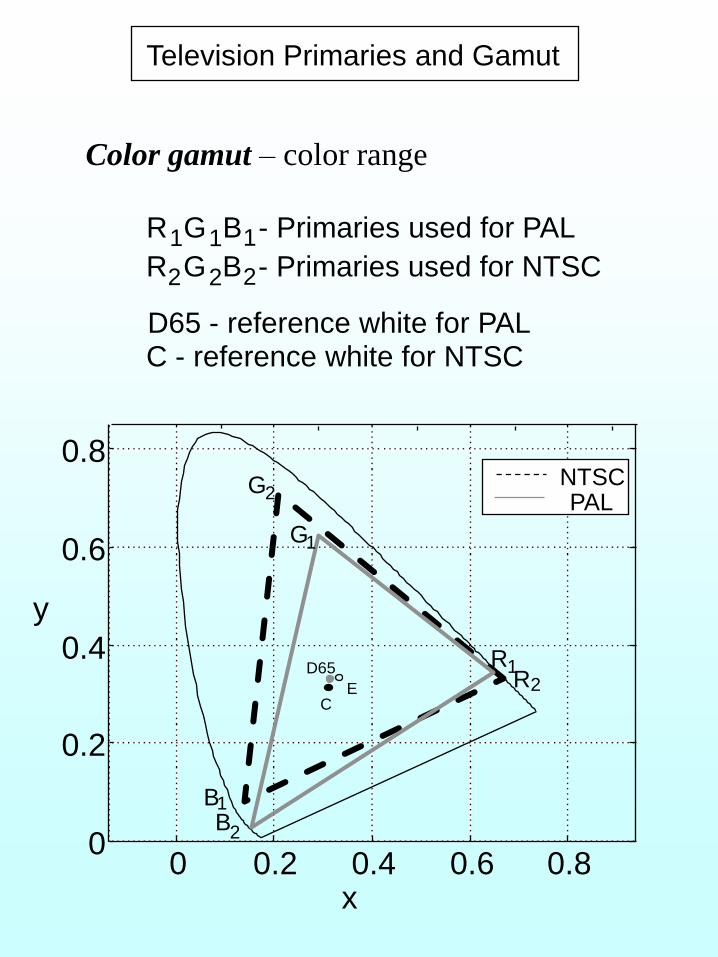
0 0.2 0.4 0.6 0.80
0.2
0.4
0.6
0.8
G1
R1
B1B2
R2
G2
CE
D65
PALNTSC
Television Primaries and Gamut
R G B - Primaries used for PAL
R G B - Primaries used for NTSC1 1 1
2 2 2
C - reference white for NTSCD65 - reference white for PAL
x
y
Color gamut – color range
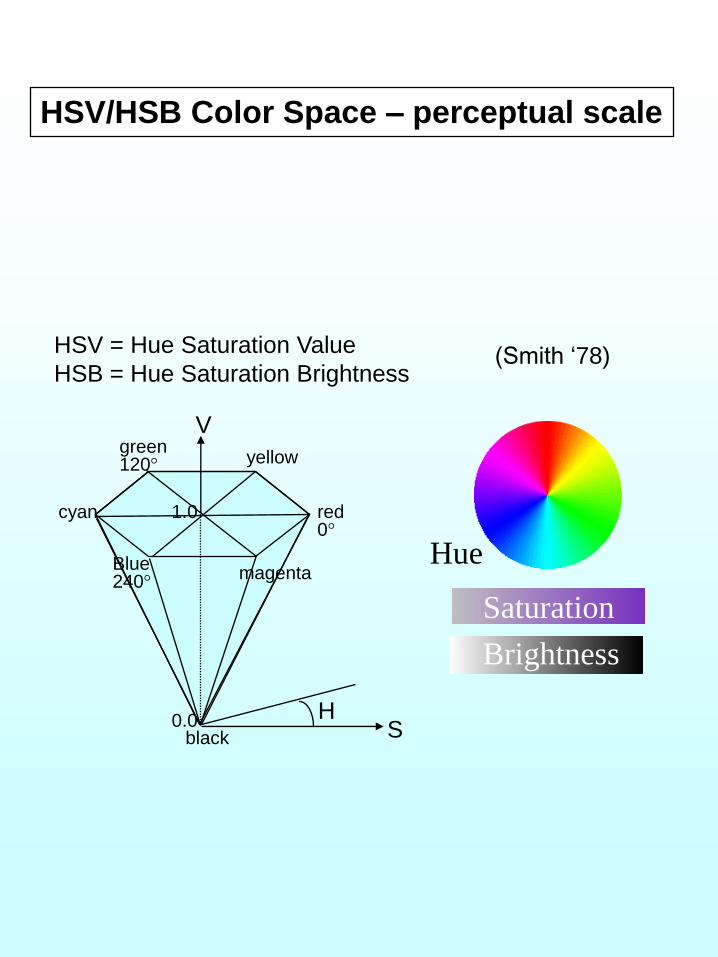
HSV/HSB Color Space – perceptual scale
HSV = Hue Saturation Value
HSB = Hue Saturation Brightness
red0°
green120° yellow
Blue240°
cyan
magenta
V
black0.0
1.0
HS
(Smith „78)
Hue
Saturation
Brightness

Relationship between HSV and XYZ
Y vs V :
Luminance (intensity) vs Brightness (Lightness)
Lum
inance
DI1
DI2I2
I1
I1 < I2, DI1 = DI2

Weber‟s Law:
Perceived Brightness = log (I)
Equal intensity steps:
Equal brightness steps:

Munsell lines of constant Hue and Chroma.
MacAdam Ellipses of JND (Just Noticable difference)
x
y
0 0.1 0.2 0.3 0.4 0.5 0.60
0.1
0.2
0.3
0.4
0.5
Value =1/
0.2
0.4
0.6
0.8
0
y
0.2 0.4 0.60x
(Ellipses
scaled by 10)

The transformation from XYZ space to perceptual
space is Non Linear:
CIE- Luv Coordinates
u =4x
-2x + 12y + 3
v =6y
-2x + 12y + 3
CIE-uv Chromaticity Coordinates:

Munsell lines of constant hue and chroma
plotted in CIE-uv coordinates:
u
v
0 0.1 0.2 0.3 0.4 0.5 0.60
0.1
0.2
0.3
0.4
CIE- L*u*v* Coordinates (1964,1976)
u0 v0 Y0 = coordinates of reference white
u„ = u
v„ = 1.5 v
u* = 13 L*(u‟-u0‟)
v* = 13 L*(1.5v‟-v0‟)
{L* =116(Y/Y0)
1/3 - 16 for Y/Y0
903(Y/Y0) otherwise
> 0.01

Munsell lines of constant hue and chroma
plotted in CIE- L*u*v* Coordinates:
u*-150 -100 -50 0 50 100 150
-150
Value =5/
200
100
50
0
-50
-100
v*
MacAdam Ellipses of JND plotted in
CIE- L*u*v* Coordinates:
u*-150 -100 -50 0 50 100 150 200
-150
100
50
0
-50
-100
v*

YIQ - Color Space
NTSC = National Television Systems Committee
Y = luminance – B&W signal
I = red-green
Q = blue-yellow
X
Y
Z
=Y
I
Q
0.299 0.587 0.114
0.569 -0.275 -0.321
0.212 -0.523 0.311
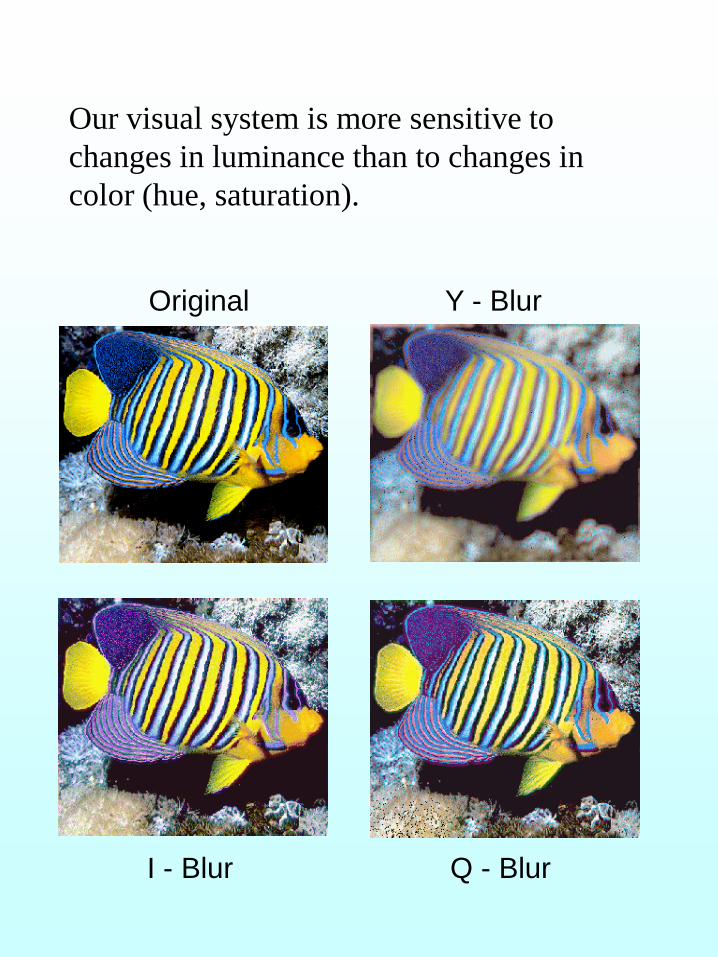
Original Y - Blur
I - Blur Q - Blur
Our visual system is more sensitive to
changes in luminance than to changes in
color (hue, saturation).
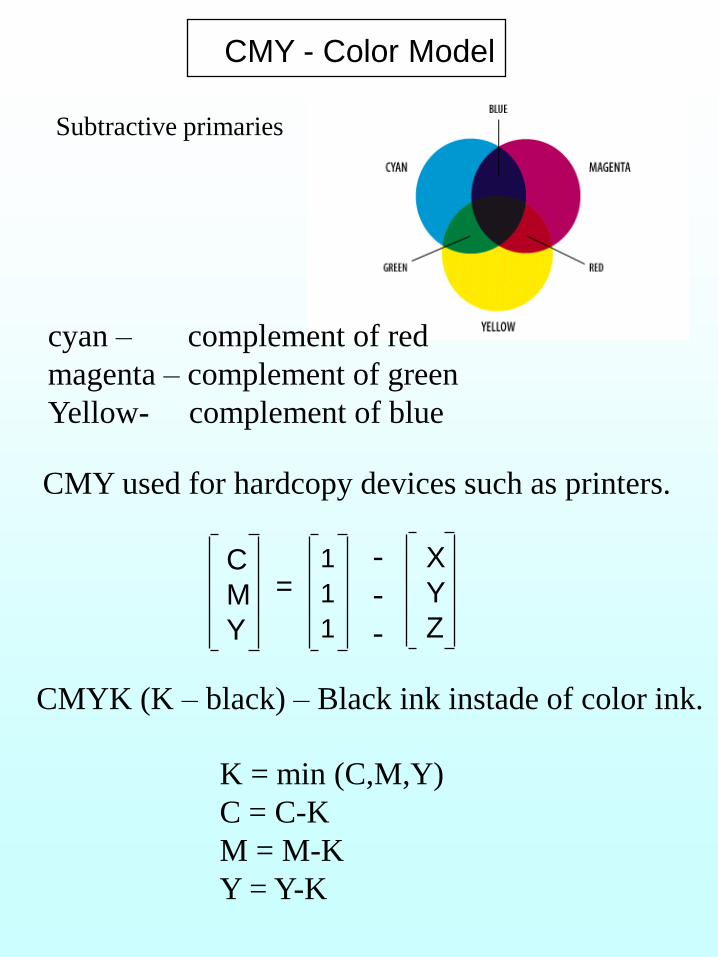
CMY - Color Model
Subtractive primaries
cyan – complement of red
magenta – complement of green
Yellow- complement of blue
CMY used for hardcopy devices such as printers.
X
Y
Z
=C
M
Y
1
1
1
-
-
-
CMYK (K – black) – Black ink instade of color ink.
K = min (C,M,Y)
C = C-K
M = M-K
Y = Y-K

Color Spaces - Summary
RGB space - Additive space used for CRT,
Color Image representation
CIE-XYZ Tri-stimulus Coordinates -
Device Independent, Universal standard
YIQ - Opponent Space,
used for color television broadcast.
HSV - Perceptual Digitized Space,
used for Human Interactive Painting.
CMY/CMYK – Subtractive space used for hardcopy
devices.
All these color spaces are 3D.
There are conversions from one space to the other.