no slide titleocw.metu.edu.tr/pluginfile.php/3887/mod_resource/content/0/market... · demand on...
TRANSCRIPT
EE 710 Electricity Trading, Electrical and Electronics Eng. Dept., METU, Spring 2005, Prof. Dr. Osman SEVAİOĞLU, Page 1
METU
Market StructureM
arke
t
Stru
cture
EE 710 Electricity Trading, Electrical and Electronics Eng. Dept., METU, Spring 2005, Prof. Dr. Osman SEVAİOĞLU, Page 2
METU
Market Structure
Factors Shaping Market Structure
Definition
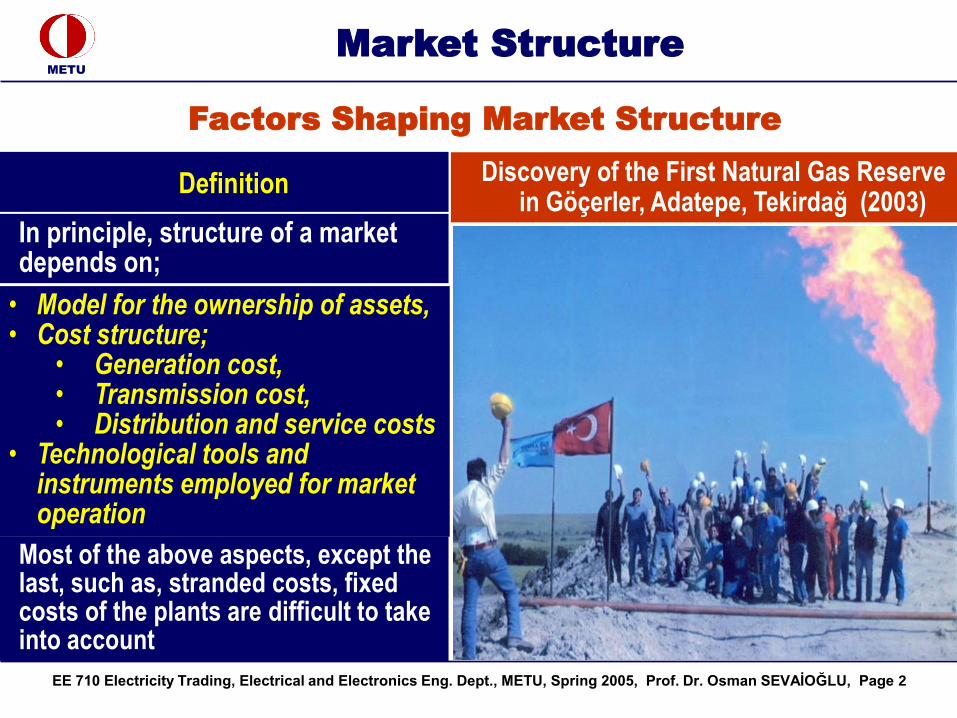
In principle, structure of a market depends on;
• Model for the ownership of assets,• Cost structure;
• Generation cost,• Transmission cost,• Distribution and service costs
• Technological tools and instruments employed for market operation
Most of the above aspects, except the last, such as, stranded costs, fixed costs of the plants are difficult to take into account
Discovery of the First Natural Gas Reserve in Göçerler, Adatepe, Tekirdağ (2003)

EE 710 Electricity Trading, Electrical and Electronics Eng. Dept., METU, Spring 2005, Prof. Dr. Osman SEVAİOĞLU, Page 3
METU
Market Structure
Difficulties in Designing Market Structure
Main Difficulties
Main difficulties in designing the market structure;
• The field is rather new and undiscovered,
• The field requires sophisticated technological hardware and software tools for an effective monitoring and control,
• The field is multi-disciplinary, i.e. there are a lot of technological knowledge to be gathered from engineering, economics and legislation,
• Market utilizes the grid, which is a regulated, sometimes shared asset
EE 710 Electricity Trading, Electrical and Electronics Eng. Dept., METU, Spring 2005, Prof. Dr. Osman SEVAİOĞLU, Page 4
METU
Market Structure
The Effect of Technology on Market Structure
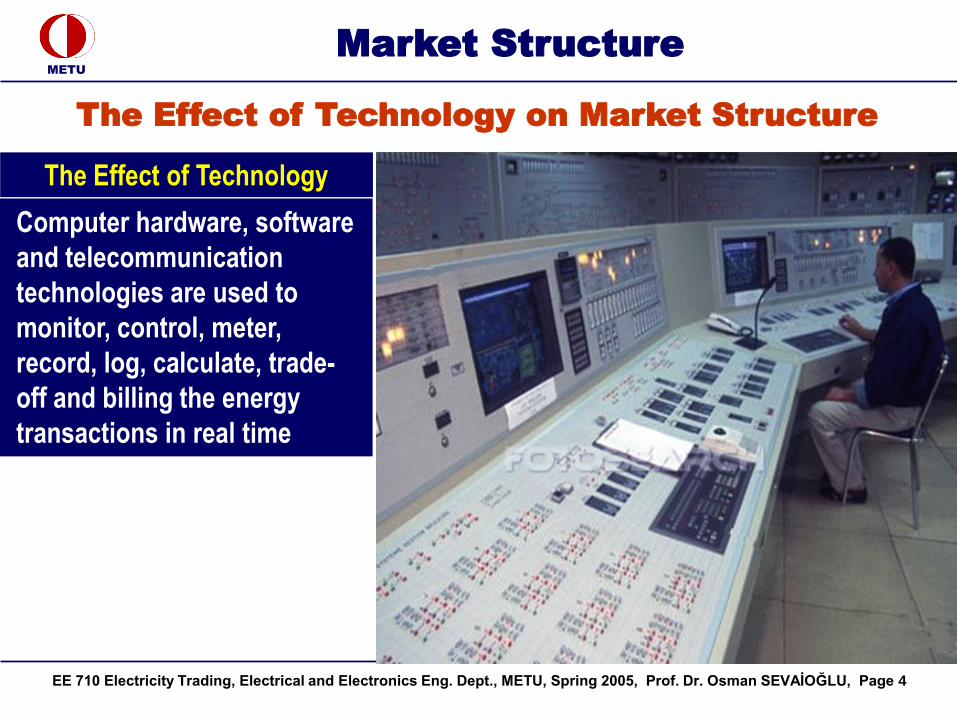
Computer hardware, software
and telecommunication
technologies are used to
monitor, control, meter,
record, log, calculate, trade-
off and billing the energy
transactions in real time
The Effect of Technology

EE 710 Electricity Trading, Electrical and Electronics Eng. Dept., METU, Spring 2005, Prof. Dr. Osman SEVAİOĞLU, Page 5
METU
Market Structure
Two Demand-Side Flaws
• The First Demand-Side Flaw
Demand characteristics of the customers in a regulated retail market is rather ridig, i.e., it is almost completely insensitive to the price fluctuations in the wholesale market,
Two Demand Side Flaws
Demand side has two important flaws that create difficulties in market design and operation
• The Second Demand-Side Flaw
Parties in a bilateral agreement absorb / supply power to / from third party suppliers or to customers in grid without any contract
EE 710 Electricity Trading, Electrical and Electronics Eng. Dept., METU, Spring 2005, Prof. Dr. Osman SEVAİOĞLU, Page 6
METU
Market Structure
The First Demand-Side Flaw
Definition
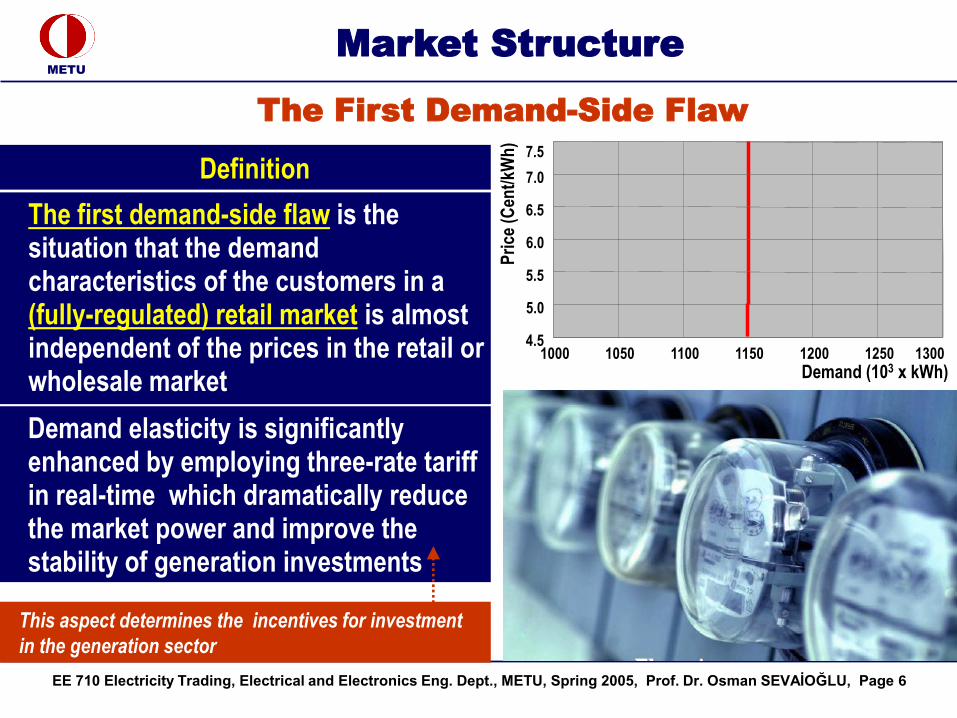
The first demand-side flaw is the situation that the demand characteristics of the customers in a (fully-regulated) retail market is almost independent of the prices in the retail or wholesale market
Demand elasticity is significantly enhanced by employing three-rate tariff in real-time which dramatically reduce the market power and improve the stability of generation investments
4.5
5.0
5.5
6.0
6.5
7.0
7.5
1000 1050 1100 1150 1200 1250 1300
Pri
ce (
Cen
t/kW
h)
This aspect determines the incentives for investment
in the generation sector
Demand (103 x kWh)

EE 710 Electricity Trading, Electrical and Electronics Eng. Dept., METU, Spring 2005, Prof. Dr. Osman SEVAİOĞLU, Page 7
METU
Market Structure
Rigid Demand
Price Elasticity of Demand
Some customers may be more elastic,
while some others rigid
A customer with rigid demand
characteristics does not agree to transfer
its consumption in the peak loading period
to other periods
A rigid (inelastic) demand is the one with a
certain daily or yearly characteristics that
does not vary with price
Pri
ce (
Cen
t/kW
h)
4.5
5.0
5.5
6.0
6.5
7.0
7.5
1000 1050 1100 1150 1200 1250 1300
Demand (103 x kWh)

EE 710 Electricity Trading, Electrical and Electronics Eng. Dept., METU, Spring 2005, Prof. Dr. Osman SEVAİOĞLU, Page 8
METU
Market Structure
Price Elasticity of Demand
Price Elasticity Curve or Demand Curve
is a curve showing the sensitivity of
electric consumption or customer
demand on price
Price Elasticity Curve depends on type
and nature of the customer
Price Elasticity Curve may be nonlinear
Pri
ce (
Cen
t/kW
h)
Elasticity of Demand
Price Elasticity Curve shows how much
the customer agrees to pay for the first
kWh to be consumed, and then for the
second, and so on
4.5
5.0
5.5
6.0
6.5
7.0
7.5
1000 1050 1100 1150 1200 1250 1300
Demand (103 x kWh)

EE 710 Electricity Trading, Electrical and Electronics Eng. Dept., METU, Spring 2005, Prof. Dr. Osman SEVAİOĞLU, Page 9
METU
Market Structure
Example to Price Elasticity of Demand
The First Demand-Side Flaw
In New York, when operating reserves run extremely short, prices has driven up to 600 Cents / kWh
In a regulated environment, where the retail prices is around only 6.0 cents / kWh, a customer will make only this amount of saving during the evening period, while the actual price was 600 Cents / kWhHence, he will not respond to prices, unless he is not metered in real-time
EE 710 Electricity Trading, Electrical and Electronics Eng. Dept., METU, Spring 2005, Prof. Dr. Osman SEVAİOĞLU, Page 10
METU
Market Structure
The Effect of Deregulation on the Elasticity of Demand
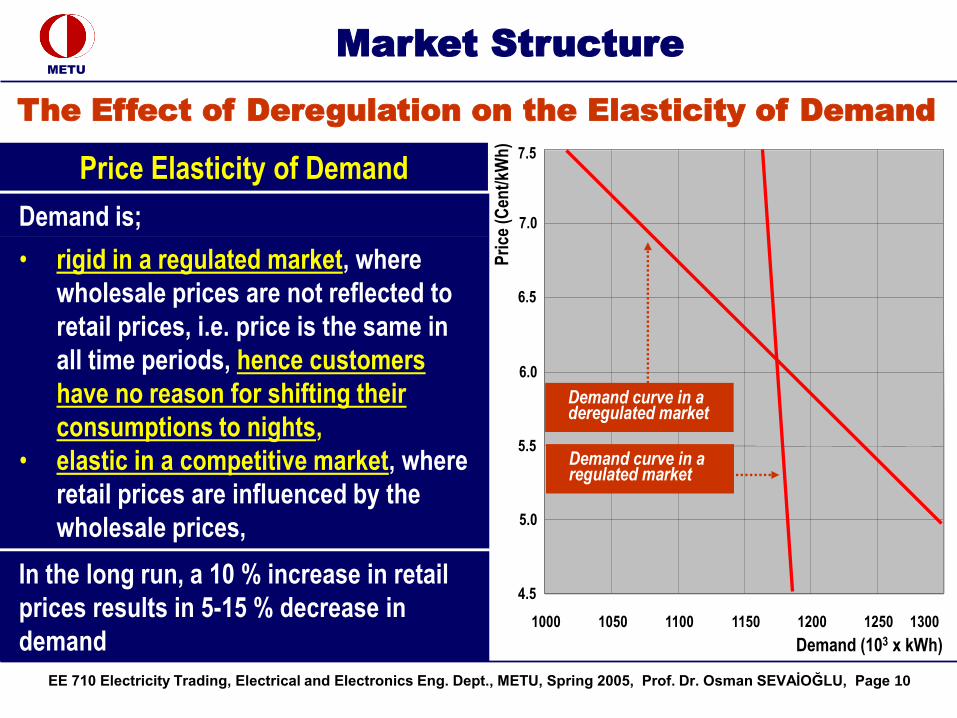
Price Elasticity of Demand
• rigid in a regulated market, where
wholesale prices are not reflected to
retail prices, i.e. price is the same in
all time periods, hence customers
have no reason for shifting their
consumptions to nights,
• elastic in a competitive market, where
retail prices are influenced by the
wholesale prices,
Demand is;
In the long run, a 10 % increase in retail
prices results in 5-15 % decrease in
demand
Pri
ce (
Cen
t/kW
h)
Demand (103 x kWh)
4.5
5.0
5.5
6.0
6.5
7.0
7.5
1000 1050 1100 1150 1200 1250 1300
Demand curve in a deregulated market
Demand curve in a regulated market

EE 710 Electricity Trading, Electrical and Electronics Eng. Dept., METU, Spring 2005, Prof. Dr. Osman SEVAİOĞLU, Page 11
METU
Market Structure
• Establish competitive retail markets to support the wholesale markets
Remedies for the First Demand Side Flaw
Remedies
The general principle is quite simple and obvious;
• Implement meters with three-rate tariff structure at retail level in order to;
a) Discourage consumption during the evening period by imposing a relatively high price,
b) Encourage consumption during other periods, particularly, during the night period, by imposing relatively low prices,
Three-Rate Tariff
0
500
1000
1500
2000
2500
3000
3500
4000
4500
0 1 2 3 4 5 6 7 8 9 10 11 12 13 14 15 16 17 18 19 20 21 22 23 24
Time (Hours)
Po
wer
Dem
and
P(t
) (M
W)
Daily Period Evening Period Night PeriodNight Period
EE 710 Electricity Trading, Electrical and Electronics Eng. Dept., METU, Spring 2005, Prof. Dr. Osman SEVAİOĞLU, Page 12
METU
Market Structure
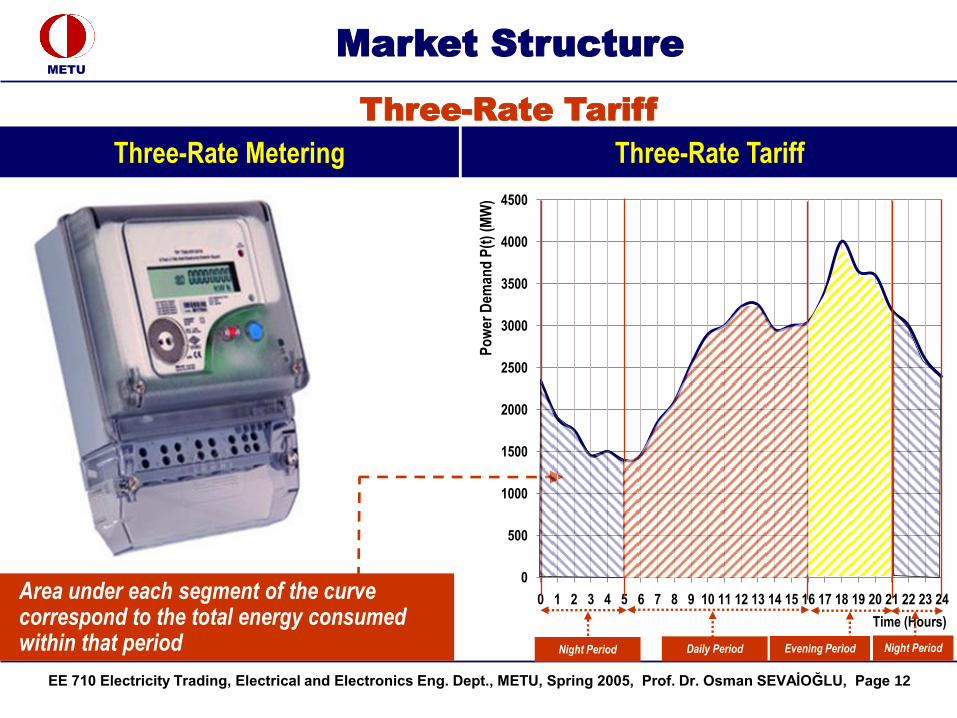
Three-Rate Tariff
Area under each segment of the curve correspond to the total energy consumed within that period
Three-Rate Tariff Three-Rate Metering
0
500
1000
1500
2000
2500
3000
3500
4000
4500
0 1 2 3 4 5 6 7 8 9 10 11 12 13 14 15 16 17 18 19 20 21 22 23 24
Time (Hours)
Po
wer
Dem
and
P(t
) (M
W)
Daily Period Evening Period Night PeriodNight Period

EE 710 Electricity Trading, Electrical and Electronics Eng. Dept., METU, Spring 2005, Prof. Dr. Osman SEVAİOĞLU, Page 13
METU
Market Structure
Single and Three-Rate Tariffs (*),(**)
(TL/kWh)
Customer
Type
Single
Rate
Tariff
Evening
(17:00-
22:00)
Night
(22:00-
06:00)
Daily
(06:00-
17:00)
Industrial(**) 119.800 202.740 58.240 113.810
Spring Water 123.300 206.450 61.300 117.150
Sewage Treatment 119.800 202.740 58.240 113.810
Commercial 151.950 277.250 61.300 144.350
Residential 127.800 201.350 61.300 115.000
Agricultural 115.250 186.550 61.300 109.500
Government Inst. 119.500 186.550 61.300 109.500
Single and Three-Rate Tariffs
--------------------------------------------------(*) TEDAS (64 cities +1 associated share), January 01, 2004(**) No incentive
0
500
1000
1500
2000
2500
3000
3500
4000
4500
0 1 2 3 4 5 6 7 8 9 10 11 12 13 14 15 16 17 18 19 20 21 22 23 24
Time (Hours)
Po
wer
Dem
and
P(t
) (M
W)
Daily Period Evening Period Night PeriodNight Period
EE 710 Electricity Trading, Electrical and Electronics Eng. Dept., METU, Spring 2005, Prof. Dr. Osman SEVAİOĞLU, Page 14
METU
Market Structure
Three-Rate Tariff Reshaped Daily Loading Curve
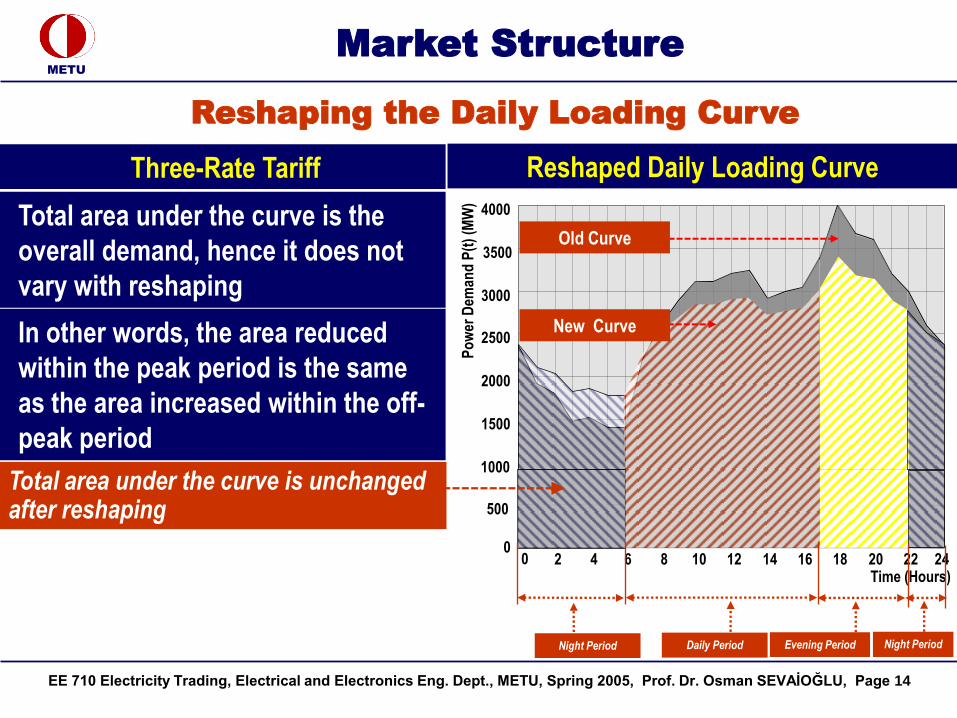
Reshaping the Daily Loading Curve
Total area under the curve is the
overall demand, hence it does not
vary with reshaping
In other words, the area reduced
within the peak period is the same
as the area increased within the off-
peak periodP
ow
er D
eman
d P
(t)
(MW
)
500
1000
1500
2000
2500
3000
3500
4000
0
New Curve
Old Curve
0 2 4 6 8 10 12 14 16 18 20 22 24Time (Hours)
Total area under the curve is unchanged after reshaping
Daily Period Evening Period Night PeriodNight Period

EE 710 Electricity Trading, Electrical and Electronics Eng. Dept., METU, Spring 2005, Prof. Dr. Osman SEVAİOĞLU, Page 15
METU
Market Structure
Time (Hours)
500
1000
1500
2000
2500
3000
3500
4000
0
New Curve
Old Curve
0 2 4 6 8 10 12 14 16 18 20 22 24
Daily Period Evening Period Night PeriodNight Period
Po
wer
Dem
and
P(t
) (M
W)
Reshaping Daily Loading Curve
Total area under the curve is unchanged after shaping
Reshaping the Daily Loading Curve
EE 710 Electricity Trading, Electrical and Electronics Eng. Dept., METU, Spring 2005, Prof. Dr. Osman SEVAİOĞLU, Page 16
METU
Market Structure
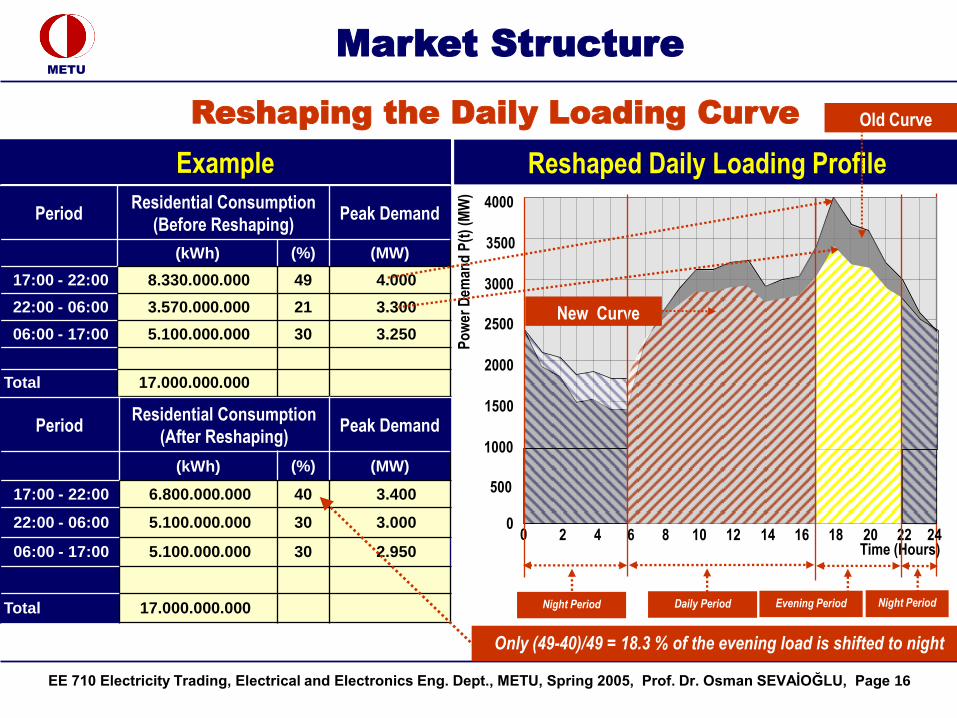
Example Reshaped Daily Loading Profile
PeriodResidential Consumption
(Before Reshaping)Peak Demand
(kWh) (%) (MW)
17:00 - 22:00 8.330.000.000 49 4.000
22:00 - 06:00 3.570.000.000 21 3.300
06:00 - 17:00 5.100.000.000 30 3.250
Total 17.000.000.000
PeriodResidential Consumption
(After Reshaping)Peak Demand
(kWh) (%) (MW)
17:00 - 22:00 6.800.000.000 40 3.400
22:00 - 06:00 5.100.000.000 30 3.000
06:00 - 17:00 5.100.000.000 30 2.950
Total 17.000.000.000
Time (Hours)
Po
wer
Dem
and
P(t
) (M
W)
Reshaping the Daily Loading Curve
Only (49-40)/49 = 18.3 % of the evening load is shifted to night
Daily Period Evening Period Night PeriodNight Period
500
1000
1500
2000
2500
3000
3500
4000
0
New Curve
Old Curve
0 2 4 6 8 10 12 14 16 18 20 22 24
EE 710 Electricity Trading, Electrical and Electronics Eng. Dept., METU, Spring 2005, Prof. Dr. Osman SEVAİOĞLU, Page 17
METU
Market Structure
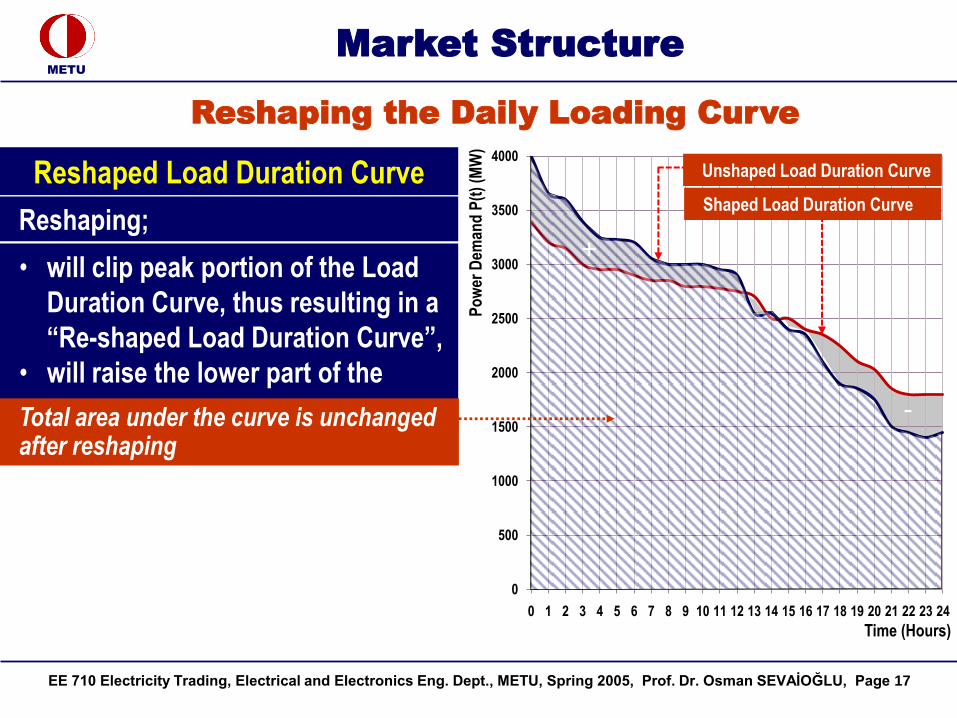
Reshaping;
Reshaped Load Duration Curve
• will clip peak portion of the Load
Duration Curve, thus resulting in a
“Re-shaped Load Duration Curve”,
• will raise the lower part of the
curveTotal area under the curve is unchanged after reshaping
Reshaping the Daily Loading Curve
Po
wer
Dem
and
P(t
) (M
W)
0
500
1000
1500
2000
2500
3000
3500
4000
0 1 2 3 4 5 6 7 8 9 10 11 12 13 14 15 16 17 18 19 20 21 22 23 24
Time (Hours)
+
-
Shaped Load Duration Curve
Unshaped Load Duration Curve

EE 710 Electricity Trading, Electrical and Electronics Eng. Dept., METU, Spring 2005, Prof. Dr. Osman SEVAİOĞLU, Page 18
METU
Market Structure
Advantages of Load Reshaping
Advantages Gained
By re-shaping the load duration curve;
a) Investment for the generation, transmission and distribution facilites to meet the same amount of energy demand will be reduced,
Hence, the generation, transmission and distribution facilities will be utilized more efficiently, since they will be more uniformly loaded, 0
500
1000
1500
2000
2500
3000
3500
4000
0 1 2 3 4 5 6 7 8 9 10 11 12 13 14 15 16 17 18 19 20 21 22 23 24
Time (Hours)
+
-
Shaped Load Duration Curve
Unshaped Load Duration Curve

EE 710 Electricity Trading, Electrical and Electronics Eng. Dept., METU, Spring 2005, Prof. Dr. Osman SEVAİOĞLU, Page 19
METU
Market Structure
Advantages of Load Reshaping
Advantages Gained
b) Overall tariff will be reduced since;
• No peaker plant with expensive fuel costs will be utilized, i.e. only base plants will be utilized,
• Expensive power exchange with the third parties (ref. to next section; “Second Demand Side Flaw”) will be reduced,
• Capacity cost is reduced since less capacity is utilized
• No payment for scarsity rents
0
500
1000
1500
2000
2500
3000
3500
4000
0 1 2 3 4 5 6 7 8 9 10 11 12 13 14 15 16 17 18 19 20 21 22 23 24
Time (Hours)
+
-
Shaped Load Duration Curve
Unshaped Load Duration Curve
EE 710 Electricity Trading, Electrical and Electronics Eng. Dept., METU, Spring 2005, Prof. Dr. Osman SEVAİOĞLU, Page 20
METU
Market Structure
Advantages of Load Reshaping
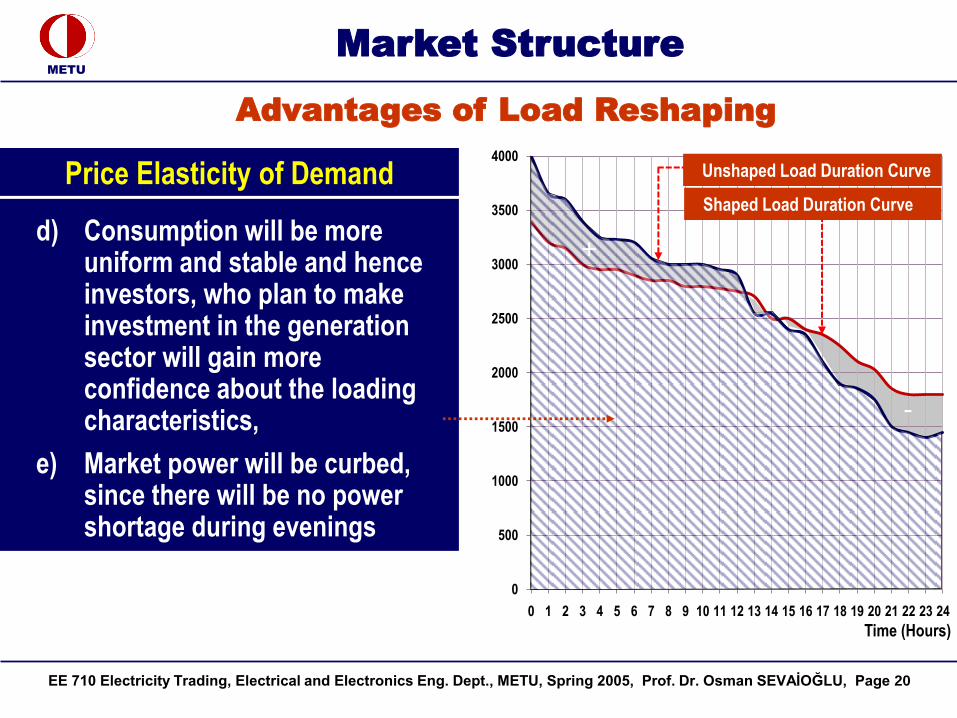
Price Elasticity of Demand
d) Consumption will be more uniform and stable and hence investors, who plan to make investment in the generation sector will gain more confidence about the loading characteristics,
e) Market power will be curbed, since there will be no power shortage during evenings
0
500
1000
1500
2000
2500
3000
3500
4000
0 1 2 3 4 5 6 7 8 9 10 11 12 13 14 15 16 17 18 19 20 21 22 23 24
Time (Hours)
+
-
Shaped Load Duration Curve
Unshaped Load Duration Curve
EE 710 Electricity Trading, Electrical and Electronics Eng. Dept., METU, Spring 2005, Prof. Dr. Osman SEVAİOĞLU, Page 21
METU
Market Structure
PgTPn
WholesaleCompany
PgTP1
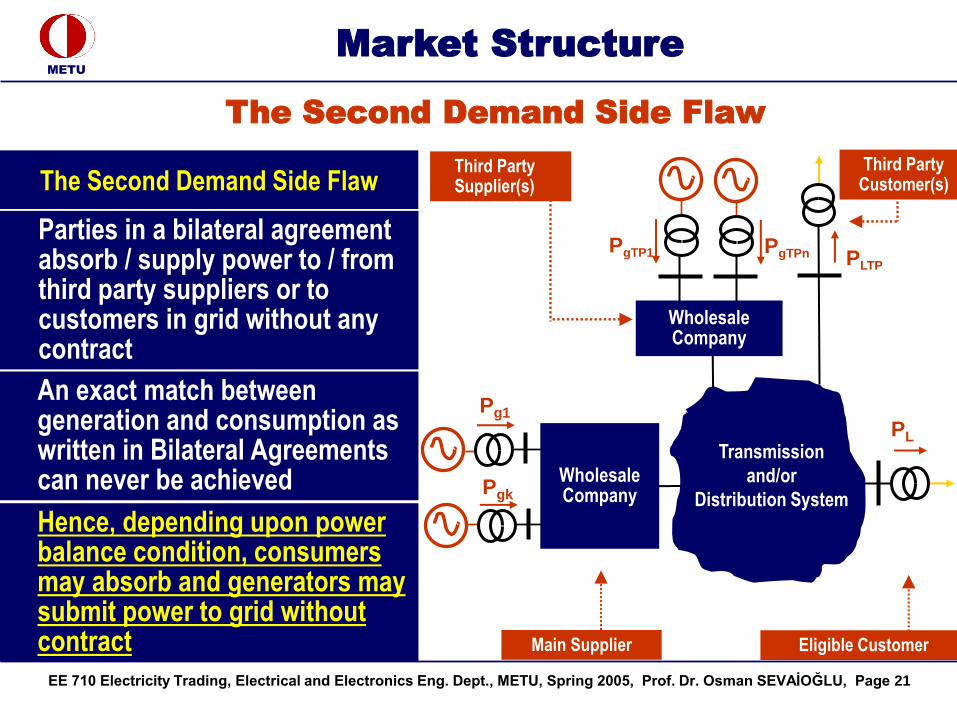
The Second Demand Side Flaw
The Second Demand Side Flaw
An exact match between generation and consumption as written in Bilateral Agreements can never be achieved
Hence, depending upon power balance condition, consumers may absorb and generators may submit power to grid without contract
Parties in a bilateral agreement absorb / supply power to / from third party suppliers or to customers in grid without any contract
Third Party Supplier(s)
Main Supplier Eligible Customer
PL
Transmission
and/or
Distribution System
Third Party Customer(s)
Pg1
PLTP
Pgk
WholesaleCompany
EE 710 Electricity Trading, Electrical and Electronics Eng. Dept., METU, Spring 2005, Prof. Dr. Osman SEVAİOĞLU, Page 22
METU
Market Structure
The Second Demand-Side Flaw
Daily Mismatch between Supply and Demand
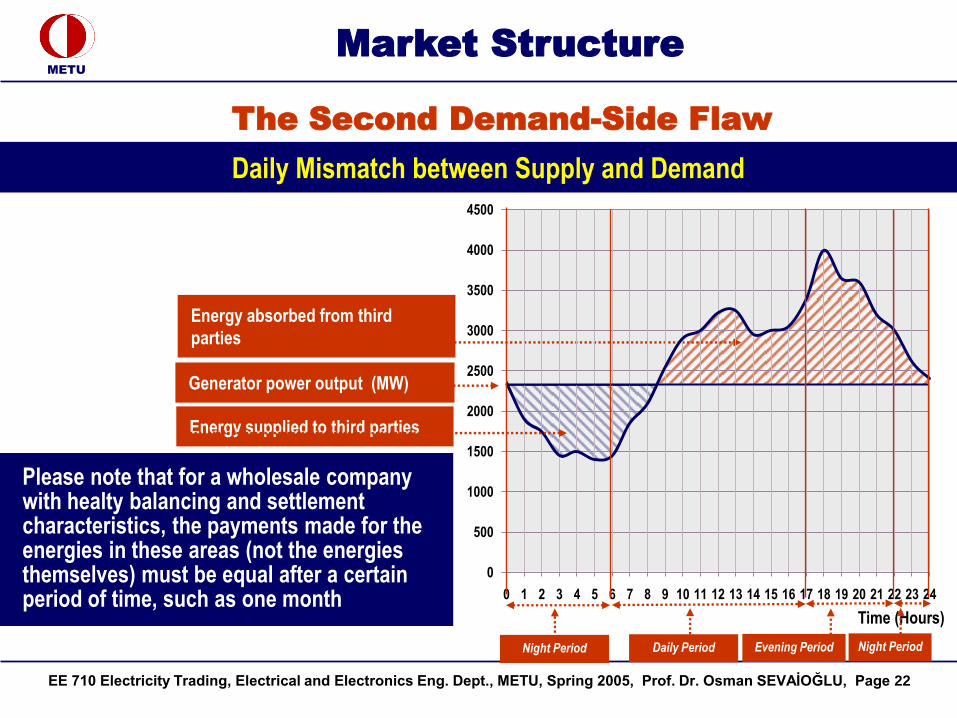
Please note that for a wholesale company with healty balancing and settlement characteristics, the payments made for the energies in these areas (not the energies themselves) must be equal after a certain period of time, such as one month
Energy supplied to third parties
Energy absorbed from third
parties
Generator power output (MW)
0
500
1000
1500
2000
2500
3000
3500
4000
4500
0 1 2 3 4 5 6 7 8 9 10 11 12 13 14 15 16 17 18 19 20 21 22 23 24
Time (Hours)
Daily Period Evening Period Night PeriodNight Period
EE 710 Electricity Trading, Electrical and Electronics Eng. Dept., METU, Spring 2005, Prof. Dr. Osman SEVAİOĞLU, Page 23
METU
Market Structure
Bilateral Agreements
Definition
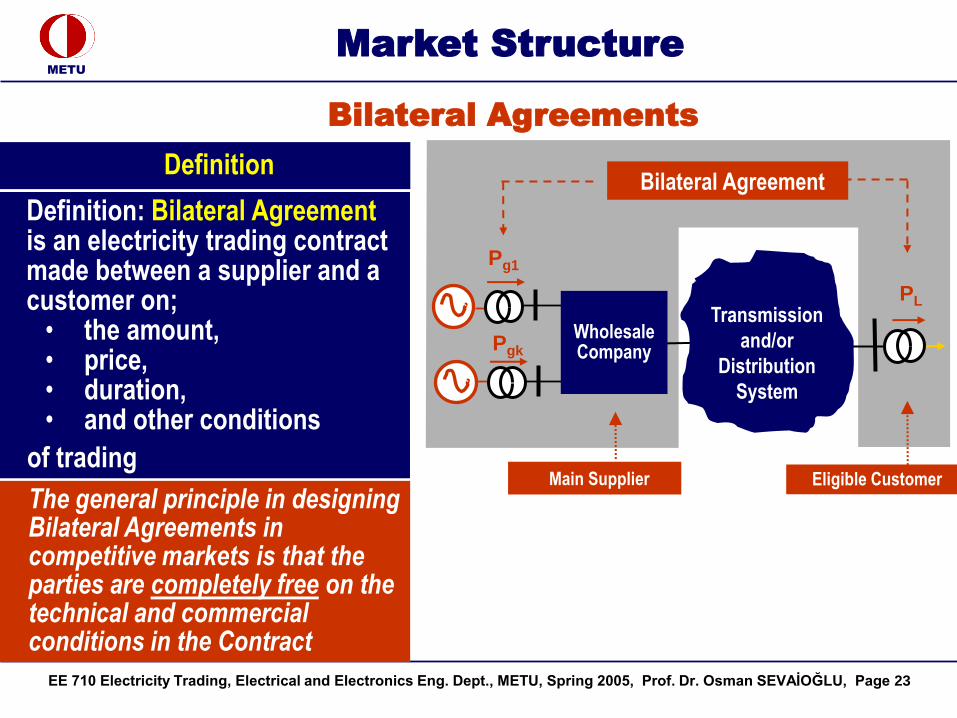
The general principle in designing Bilateral Agreements in competitive markets is that the parties are completely free on the technical and commercial conditions in the Contract
Definition: Bilateral Agreementis an electricity trading contract made between a supplier and a customer on;
• the amount,• price,• duration,• and other conditions
of tradingMain Supplier Eligible Customer
PL
Bilateral Agreement
Pgk
WholesaleCompany
Pg1
Transmission
and/or
Distribution
System
EE 710 Electricity Trading, Electrical and Electronics Eng. Dept., METU, Spring 2005, Prof. Dr. Osman SEVAİOĞLU, Page 24
METU
Market Structure
Application
All Bilateral Agreements (Electricity Sale
Agreements) (Bilateral Agreement)
concerning power trades among all market
participants are submitted to BSC for
approval and recordingBSC examines the agreements in terms of;
• amount,
• feasibility,
• system security, (congestion
possibility),
• system stability,
• load frequency control,
• resulting increase in system losses
Bilateral Agreements
EE 710 Electricity Trading, Electrical and Electronics Eng. Dept., METU, Spring 2005, Prof. Dr. Osman SEVAİOĞLU, Page 25
METU
Market Structure
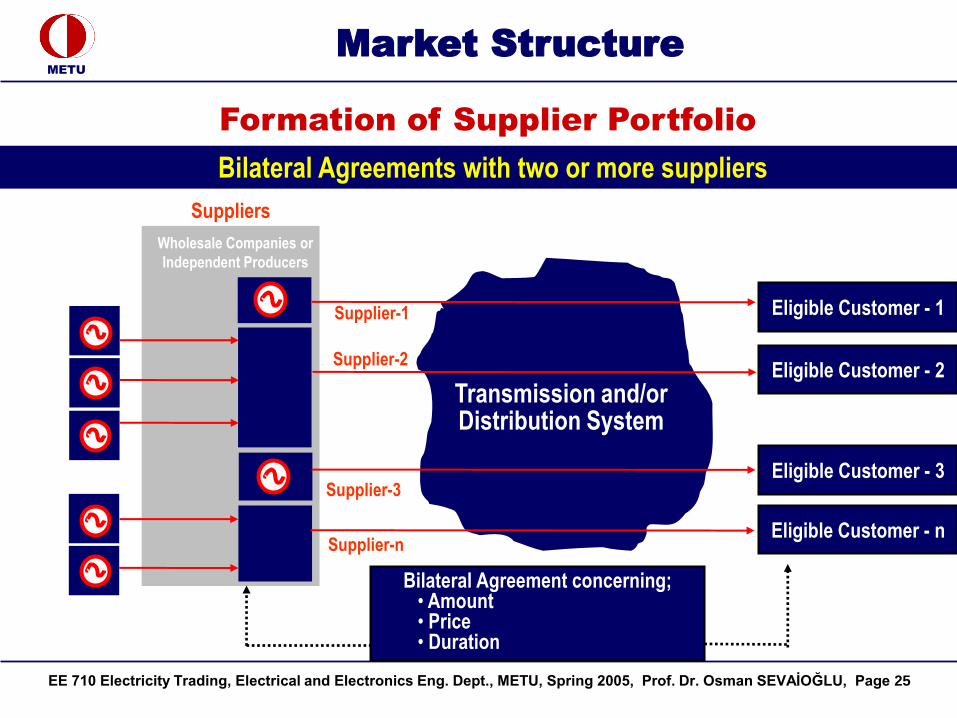
Formation of Supplier Portfolio
Bilateral Agreements with two or more suppliers
Suppliers
Wholesale Companies or
Independent Producers
Bilateral Agreement concerning;• Amount• Price• Duration
Supplier-1
Supplier-2
Supplier-3
Supplier-n
Transmission and/or Distribution System
Eligible Customer - 1
Eligible Customer - 2
Eligible Customer - 3
Eligible Customer - n
EE 710 Electricity Trading, Electrical and Electronics Eng. Dept., METU, Spring 2005, Prof. Dr. Osman SEVAİOĞLU, Page 26
METU
Market Structure
The Second Demand-Side Flaw
Balancing market structure is designed in order to meet the power absorbed or supplied from / to the third parties,
Price spikes due to power unbalance, in real-time resulting in invaluntary load shedding, treating customers are reduced
These aspects determine the incentives for investment in Generation sector
The Second Demand-Side Flaw

EE 710 Electricity Trading, Electrical and Electronics Eng. Dept., METU, Spring 2005, Prof. Dr. Osman SEVAİOĞLU, Page 27
METU
Market Structure
Mismatch between Supply and Demand
Load characteristics follows the daily loading curve, while the generation follows a flat linear profile, hence the two curves never match exactly
Eligible Customer
Po
wer
Dem
and
(M
W)
Summer
Winter
Time (Hours)
Consumption Characteristics
Time (Hours)
Gen
erat
ion
(MW
)
Generation Characteristics
4.5
5
5.5
6
6.5
7
7.5
0 6:00 12:00 18:00 24:00PL
PL
Transmission
and/or
Distribution System
Third Party Customer(s)
The Second Demand-Side Flaw
Pg1
PgkWholesaleCompany
PgTPn
WholesaleCompany
PgTP1
Main Supplier
Third Party Supplier(s)
EE 710 Electricity Trading, Electrical and Electronics Eng. Dept., METU, Spring 2005, Prof. Dr. Osman SEVAİOĞLU, Page 28
METU
Market Structure
The Second Demand-Side Flaw
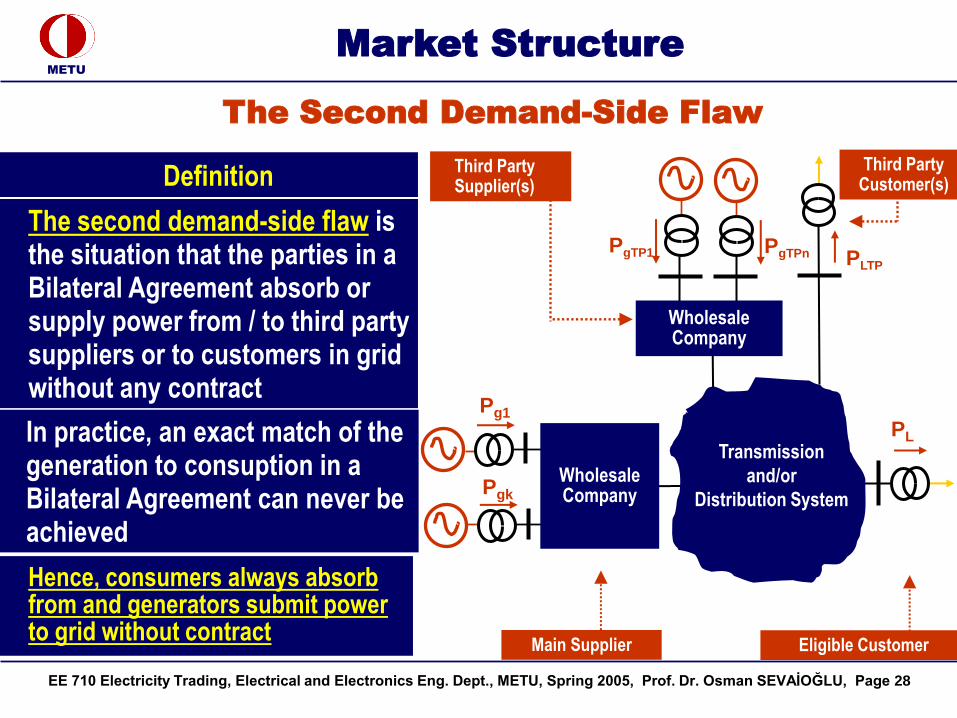
Definition
The second demand-side flaw is the situation that the parties in a Bilateral Agreement absorb or supply power from / to third party suppliers or to customers in grid without any contract
In practice, an exact match of the generation to consuption in a Bilateral Agreement can never be achieved
PgTPn
WholesaleCompany
PgTP1
Third Party Supplier(s)
Main Supplier Eligible Customer
PL
Transmission
and/or
Distribution System
Third Party Customer(s)
Pg1
PLTP
Pgk
WholesaleCompany
Hence, consumers always absorb from and generators submit power to grid without contract

EE 710 Electricity Trading, Electrical and Electronics Eng. Dept., METU, Spring 2005, Prof. Dr. Osman SEVAİOĞLU, Page 29
METU
Market Structure
Daily Loading Curves
Daily Loading Curves
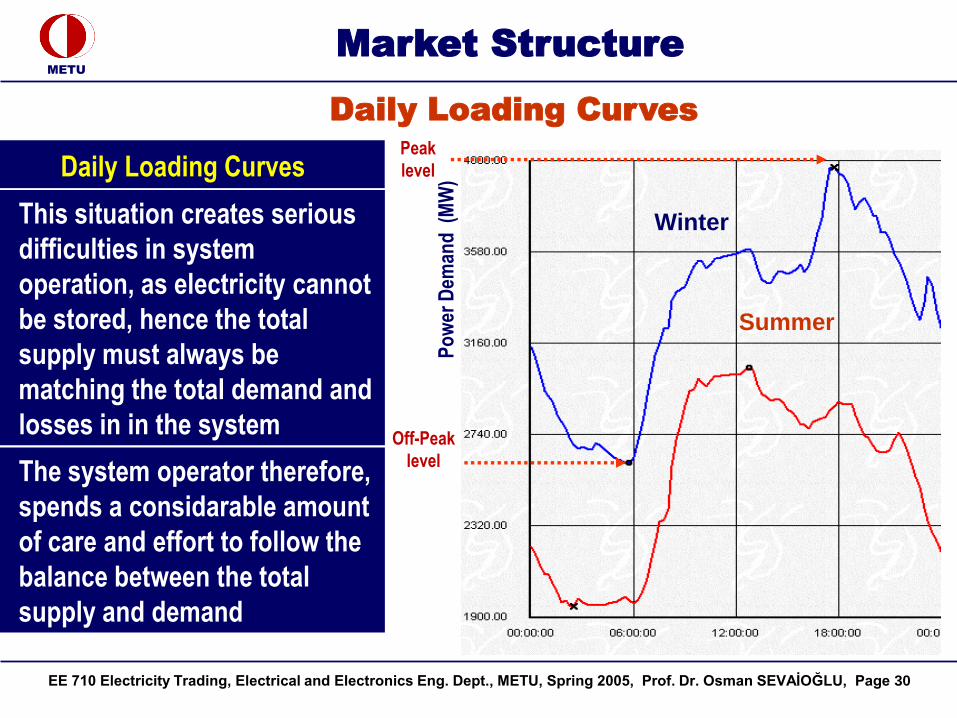
A basic characteristics of
electrical loads is that the
demand is not constant, but a
function of time. In other words
the demand varies wrt hours,
days, weeks and season.
As seen from the figure, the
peak level of demand in the
winter season is about 4000
MW, while the off-peak level is
2610 MW, which is 0.65 of the
peak level
Time (Hours)
Off-Peak
level
Peak
level
Po
wer
Dem
and
(M
W)
Summer
Winter
EE 710 Electricity Trading, Electrical and Electronics Eng. Dept., METU, Spring 2005, Prof. Dr. Osman SEVAİOĞLU, Page 30
METU
Market Structure
Daily Loading Curves
Daily Loading Curves
This situation creates serious
difficulties in system
operation, as electricity cannot
be stored, hence the total
supply must always be
matching the total demand and
losses in in the system
The system operator therefore,
spends a considarable amount
of care and effort to follow the
balance between the total
supply and demand
Off-Peak
level
Peak
level
Po
wer
Dem
and
(M
W)
Summer
Winter

EE 710 Electricity Trading, Electrical and Electronics Eng. Dept., METU, Spring 2005, Prof. Dr. Osman SEVAİOĞLU, Page 31
METU
Market Structure
The Second Demand-Side Flaw
where, PL is the power consumed by the customer,
Pg is the power generated by the supplier,
PgTP , PLTP is the power generated or absorbed by the third party
PL < Pg or PL > Pg
hencePL = Pg - PLTP or PL = Pg + PgTP
Mismatch between Supply and Demand
An exact match between supply and demand is never possible and hence, the customer sometimes absorbes power from third party supplier(s) through grid without any contract
Third Party Supplier(s)
Main Supplier Eligible Customer
PL
Transmission
and/or
Distribution System
Third Party Customer(s)
Pg1
PLTP
Pgk
WholesaleCompany
PgTPn
WholesaleCompany
PgTP1

EE 710 Electricity Trading, Electrical and Electronics Eng. Dept., METU, Spring 2005, Prof. Dr. Osman SEVAİOĞLU, Page 32
METU
Market Structure
The Second Demand-Side Flaw
Mismatch between Supply and Demand
Hence;
• An exact match of supply to demand in a Bilateral Agreement is never possible,
• Customer sometimes absorbes power from third party supplier(s) through grid without any contract,
• Customer sometimes absorbes less power than the written amount in the contract, hence the supplier may be supplying a third party customer in the system through grid,
• hence, an accounting mechanism is needed among the supplier, demand and the third party supplier(s) and the customers
Third Party Supplier(s)
Main Supplier Eligible Customer
PL
Transmission
and/or
Distribution System
Third Party Customer(s)
Pg1
PLTP
Pgk
WholesaleCompany
PgTPn
WholesaleCompany
PgTP1

EE 710 Electricity Trading, Electrical and Electronics Eng. Dept., METU, Spring 2005, Prof. Dr. Osman SEVAİOĞLU, Page 33
METU
Market Structure
The Second Demand-Side Flaw
Mismatch between Supply and Demand
Sometimes power consumed by the
customer from third party supplier(s)
through grid without any contract may be
so high that, the system operator may find
himself in a situation that he has no other
solution, except;
a) some consumers are to be blacked
out, hence, a rotating blackout
program is to be implemented without
regarding the contracts or
consumption levels of customers,
b) some extra power is to be purchased
at a very expensive price
Third Party Supplier(s)
Main Supplier Eligible Customer
PL
Transmission
and/or
Distribution System
Third Party Customer(s)
Pg1
PLTP
Pgk
WholesaleCompany
PgTPn
WholesaleCompany
PgTP1
EE 710 Electricity Trading, Electrical and Electronics Eng. Dept., METU, Spring 2005, Prof. Dr. Osman SEVAİOĞLU, Page 34
METU
Market Structure
The Second Demand-Side Flaw
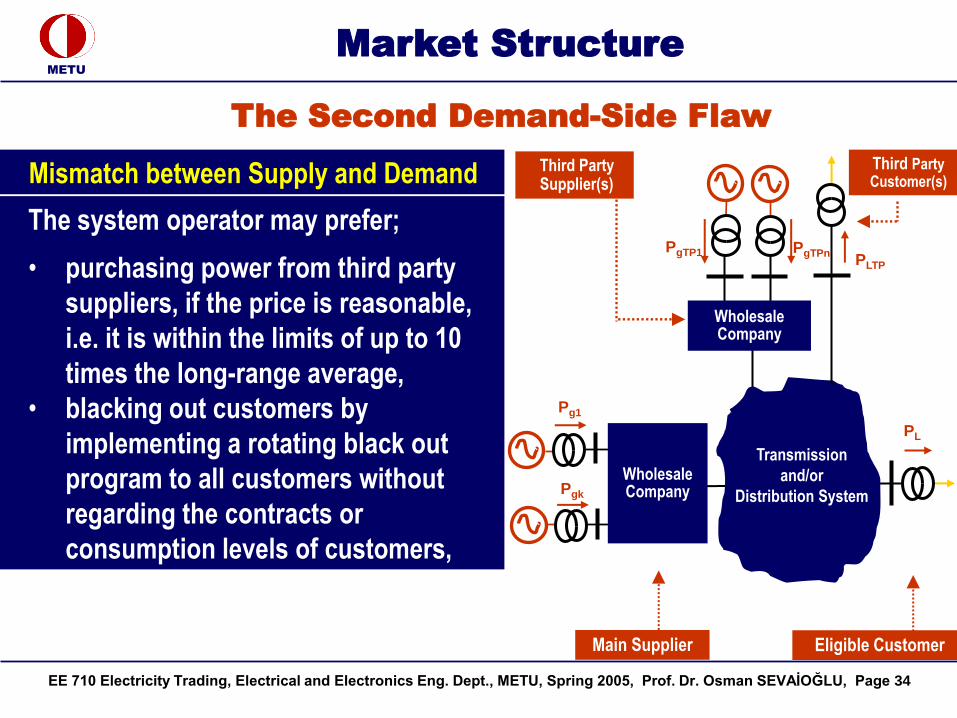
Mismatch between Supply and Demand
The system operator may prefer;
• purchasing power from third party
suppliers, if the price is reasonable,
i.e. it is within the limits of up to 10
times the long-range average,
• blacking out customers by
implementing a rotating black out
program to all customers without
regarding the contracts or
consumption levels of customers,
Third Party Supplier(s)
Main Supplier Eligible Customer
PL
Transmission
and/or
Distribution System
Third Party Customer(s)
Pg1
PLTP
Pgk
WholesaleCompany
PgTPn
WholesaleCompany
PgTP1

EE 710 Electricity Trading, Electrical and Electronics Eng. Dept., METU, Spring 2005, Prof. Dr. Osman SEVAİOĞLU, Page 35
METU
Market Structure
Remedies for The Second Demand-Side Flaw
Remedies
In principle remedies for the Second Demand Side Flaw are two folded:
• Flattening the daily loading Characteristics by;
a) wholesale trading,b) employing a Three-rate Tariff
structure, • Establishing a Balancing Market
The first remedy does not completely eliminate the flaw, but only reduces the amount of power taken / given from / to the third parties
Third Party Supplier(s)
Main Supplier Eligible Customer
PL
Transmission
and/or
Distribution System
Third Party Customer(s)
Pg1
PLTP
Pgk
WholesaleCompany
PgTPn
WholesaleCompany
PgTP1
EE 710 Electricity Trading, Electrical and Electronics Eng. Dept., METU, Spring 2005, Prof. Dr. Osman SEVAİOĞLU, Page 36
METU
Market Structure
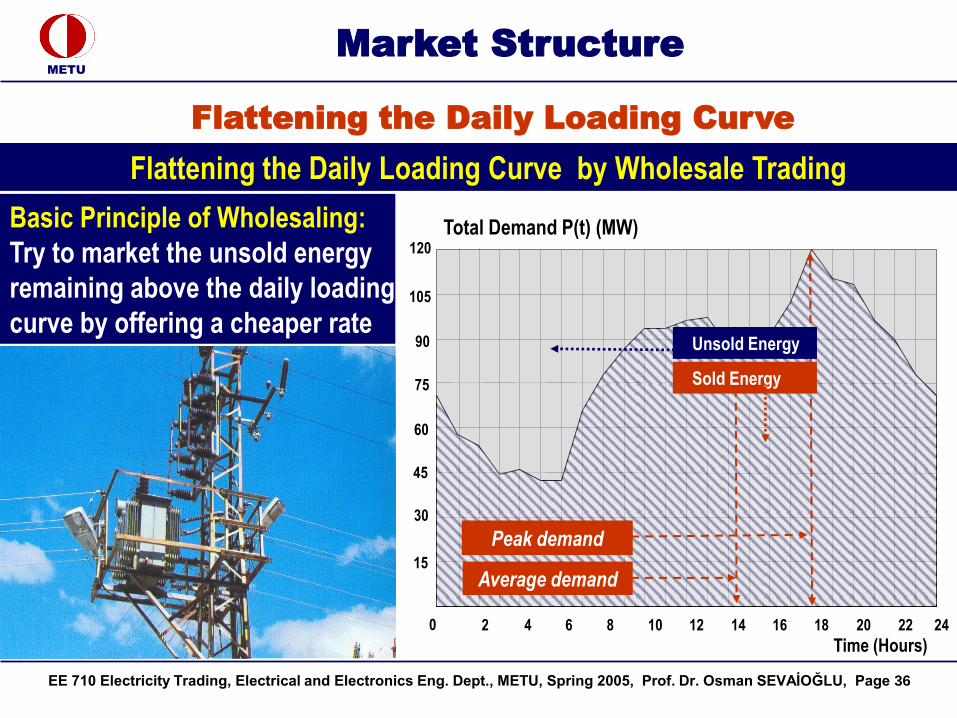
Basic Principle of Wholesaling:
Try to market the unsold energy
remaining above the daily loading
curve by offering a cheaper rate
Flattening the Daily Loading Curve
Flattening the Daily Loading Curve by Wholesale Trading
Time (Hours)24
Total Demand P(t) (MW)
0 2 4 6 8 10 12 14 16 18 20 22
Peak demand
Average demand15
30
45
60
75
90
105
120
Sold Energy
Unsold Energy

EE 710 Electricity Trading, Electrical and Electronics Eng. Dept., METU, Spring 2005, Prof. Dr. Osman SEVAİOĞLU, Page 37
METU
Market Structure
Flattening the Generation Characteristics
River Plants
Plants with irregular generation profile, such as river plants with no reservoir need to be regulated by the Balancing and Settlement Mechanism or by a third party plant
Regulation of Generation
Mo
nth
ly G
en
era
tio
n (
kW
h)
Months
Energy that can not be supplied by the river plant
Demand Characteristics
Supply Characteristics
EE 710 Electricity Trading, Electrical and Electronics Eng. Dept., METU, Spring 2005, Prof. Dr. Osman SEVAİOĞLU, Page 38
METU
Market Structure
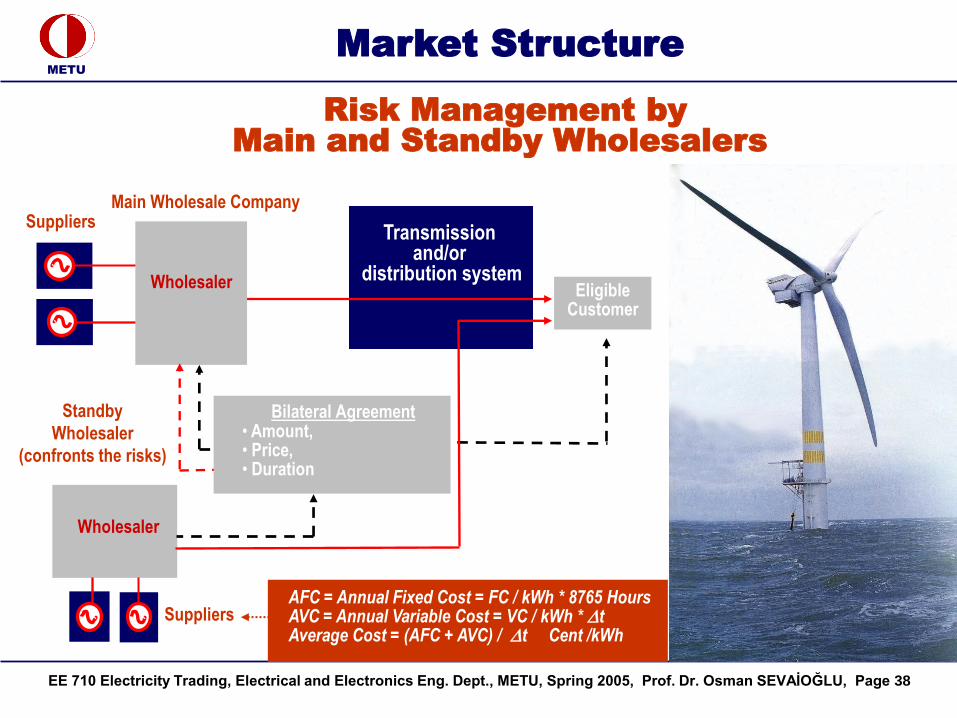
Risk Management by
Main and Standby Wholesalers
Transmission and/or
distribution systemEligible
Customer
Wholesaler
Wholesaler
Standby
Wholesaler
(confronts the risks)
Main Wholesale CompanySuppliers
Suppliers
Bilateral Agreement • Amount,• Price,• Duration
AFC = Annual Fixed Cost = FC / kWh * 8765 HoursAVC = Annual Variable Cost = VC / kWh * tAverage Cost = (AFC + AVC) / t Cent /kWh
EE 710 Electricity Trading, Electrical and Electronics Eng. Dept., METU, Spring 2005, Prof. Dr. Osman SEVAİOĞLU, Page 39
METU
Market Structure
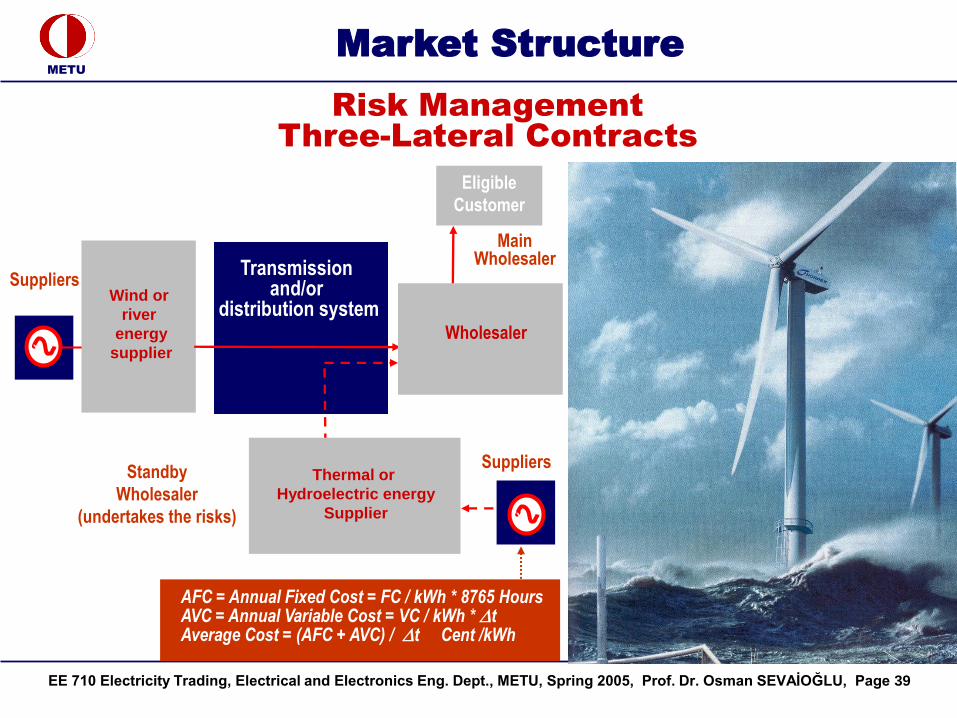
Risk Management
Three-Lateral Contracts
Wind or
river
energy
supplier
Transmission and/or
distribution system
Suppliers
SuppliersStandby
Wholesaler
(undertakes the risks)
MainWholesaler
Wholesaler
Eligible
Customer
Thermal or
Hydroelectric energy
Supplier
AFC = Annual Fixed Cost = FC / kWh * 8765 HoursAVC = Annual Variable Cost = VC / kWh * tAverage Cost = (AFC + AVC) / t Cent /kWh
EE 710 Electricity Trading, Electrical and Electronics Eng. Dept., METU, Spring 2005, Prof. Dr. Osman SEVAİOĞLU, Page 40
METU
Market Structure
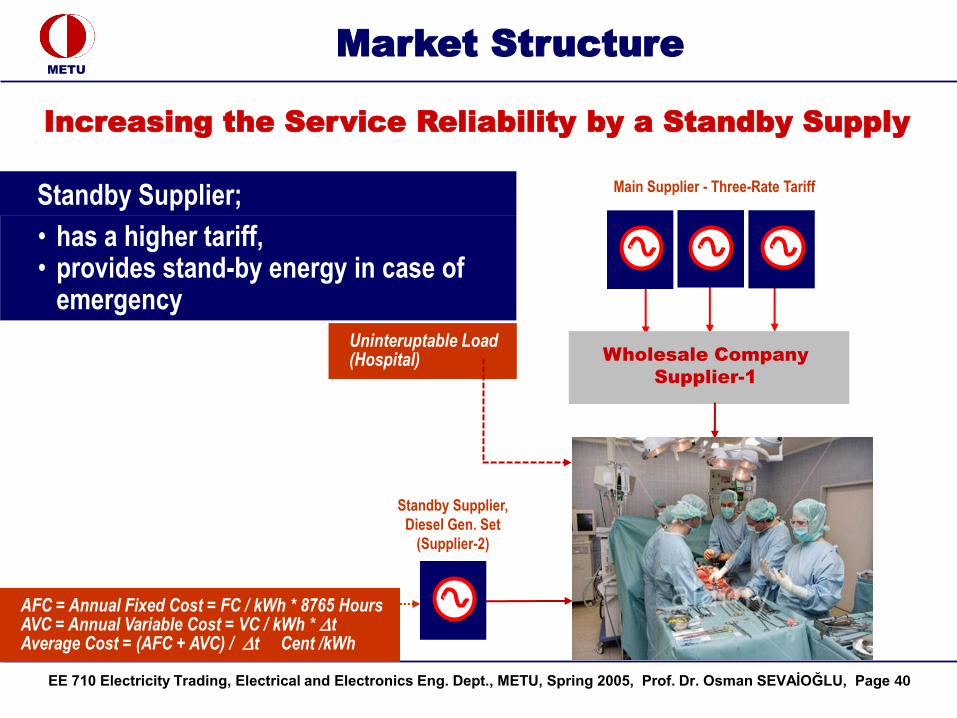
Increasing the Service Reliability by a Standby Supply
Wholesale Company
Supplier-1
Main Supplier - Three-Rate Tariff
Standby Supplier,
Diesel Gen. Set
(Supplier-2)
Uninteruptable Load(Hospital)
Standby Supplier;
• has a higher tariff,• provides stand-by energy in case of
emergency
AFC = Annual Fixed Cost = FC / kWh * 8765 HoursAVC = Annual Variable Cost = VC / kWh * tAverage Cost = (AFC + AVC) / t Cent /kWh
EE 710 Electricity Trading, Electrical and Electronics Eng. Dept., METU, Spring 2005, Prof. Dr. Osman SEVAİOĞLU, Page 41
METU
Market Structure
Wh
ole
sale
Co
mp
any
Suppliers
...
Eligible Customer-1
...4
8
12
16
20
0 4 8 12 16 20 24
4
8
12
16
20
0 4 8 12 16 20 24
4
8
12
16
20
0 4 8 12 16 20 24
P(t)
P(t)
P(t)
40
80
120
160
200
0 4 8 12 16 20 24
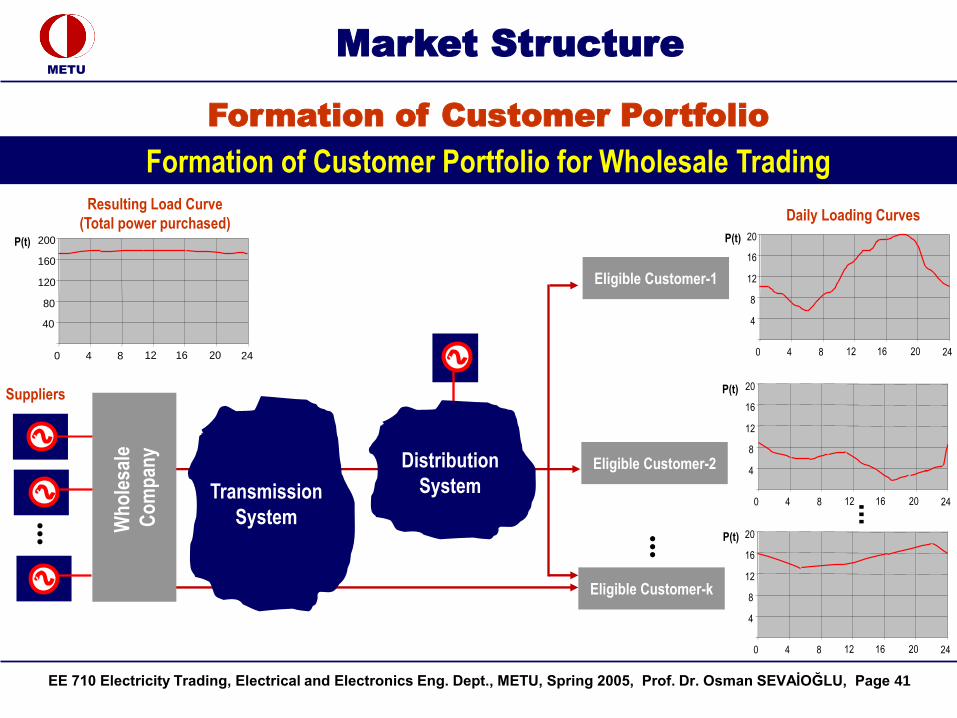
Resulting Load Curve
(Total power purchased)Daily Loading Curves
...
Transmission
System
Eligible Customer-2
Eligible Customer-k
Formation of Customer Portfolio
Formation of Customer Portfolio for Wholesale Trading
Distribution
System
P(t)
EE 710 Electricity Trading, Electrical and Electronics Eng. Dept., METU, Spring 2005, Prof. Dr. Osman SEVAİOĞLU, Page 42
METU
Market Structure
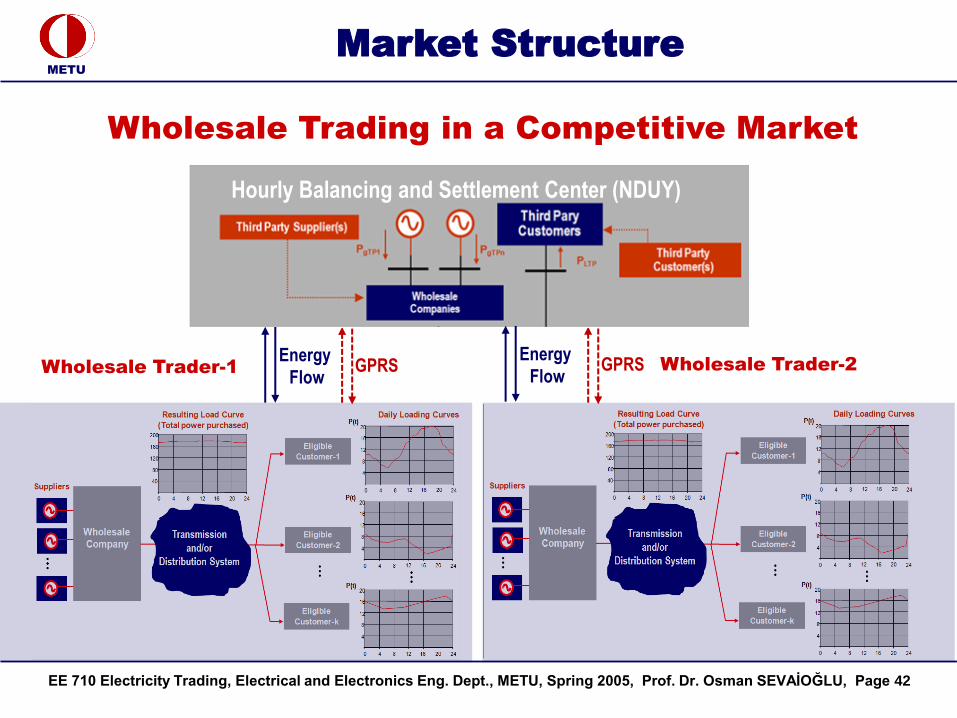
Wholesale Trading in a Competitive Market
Wholesale Trader-1 GPRS GPRS
Hourly Balancing and Settlement Center (NDUY)
Wholesale Trader-2Energy
Flow
Energy
Flow
EE 710 Electricity Trading, Electrical and Electronics Eng. Dept., METU, Spring 2005, Prof. Dr. Osman SEVAİOĞLU, Page 43
METU
Market Structure
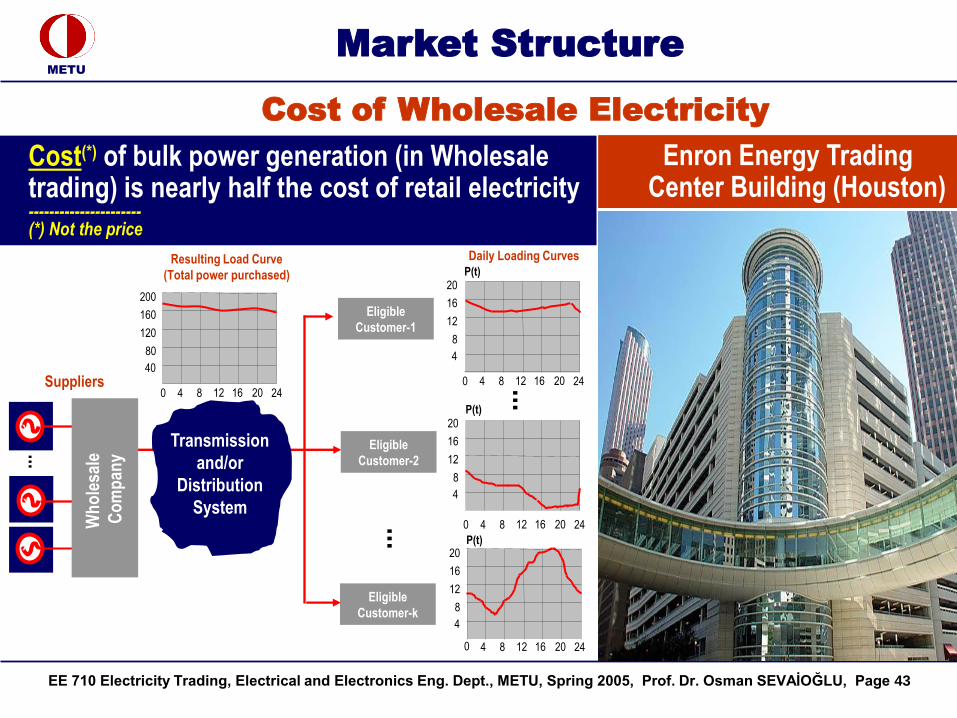
Cost of Wholesale Electricity
Enron Energy Trading Center Building (Houston)
Cost(*) of bulk power generation (in Wholesale trading) is nearly half the cost of retail electricity----------------------(*) Not the price
Suppliers
...
Eligible
Customer-k
...
P(t)
P(t)
P(t)
Daily Loading Curves
...Transmission
and/or
Distribution
System
Eligible
Customer-2
Eligible
Customer-1
Resulting Load Curve
(Total power purchased)
80
120
160
200
40
0 4 8 12 16 20 24
Wh
ole
sale
Co
mp
any
0 4 8 12 16 20 24
0 4 8 12 16 20 24
4 8 12 16 20 240
8
12
16
20
4
8
12
16
20
4
8
12
16
20
4
EE 710 Electricity Trading, Electrical and Electronics Eng. Dept., METU, Spring 2005, Prof. Dr. Osman SEVAİOĞLU, Page 44
METU
Market Structure
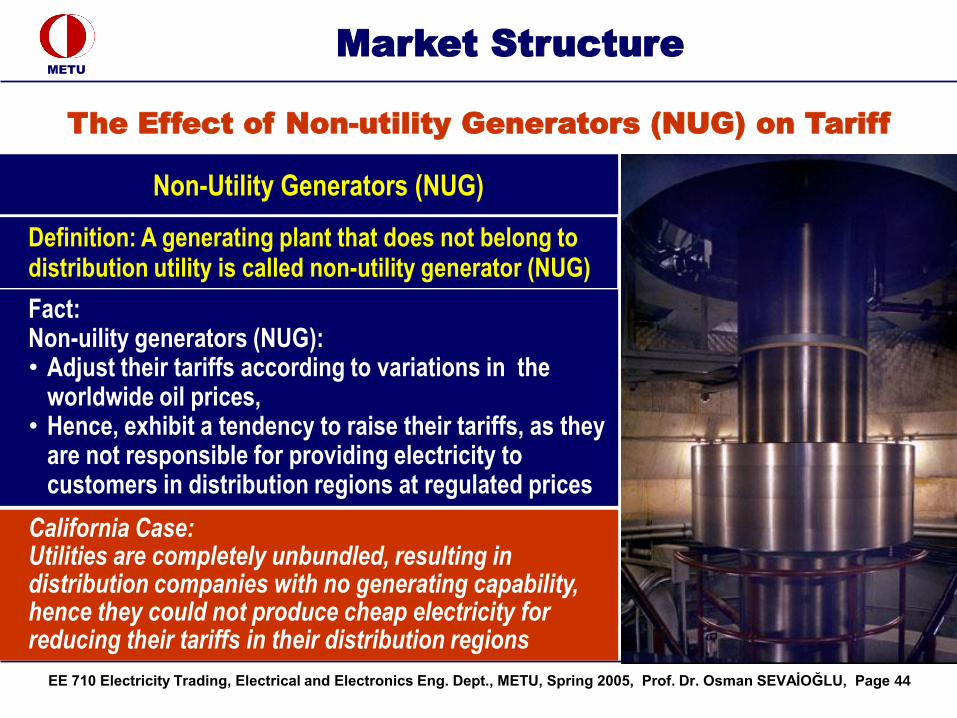
Non-Utility Generators (NUG)
Definition: A generating plant that does not belong to distribution utility is called non-utility generator (NUG)
The Effect of Non-utility Generators (NUG) on Tariff
Fact: Non-uility generators (NUG):• Adjust their tariffs according to variations in the
worldwide oil prices,• Hence, exhibit a tendency to raise their tariffs, as they
are not responsible for providing electricity to customers in distribution regions at regulated prices
California Case:Utilities are completely unbundled, resulting in distribution companies with no generating capability, hence they could not produce cheap electricity for reducing their tariffs in their distribution regions