no slide title ag... · imp ac ted wetlan d (int er na l) 9% ... cyanobacteria biomass: (-) ......
TRANSCRIPT

Agricultural eutrophication:
Notes from the upper edge
of the nutrient spectrum
John A. Downing
Iowa State University
Ecology, Evolution, & Organismal Biology
and
Agricultural & Biosystems Engineering

This is where I work (state of Iowa)
IOWA =
50%-99%
Agriculture
(average=
92% row-
crop)

Kansas v Iowa
Present v Future?
Larger, row-crop
farms have greater
debt
Corn production

A little prespective on the world
of intensive cropping you may
be entering…..
Dr. Rick Cruse, Director, Iowa Water
Center (IPR, 14 April 2011)
1” of annual soil erosion form farm land might
be sustainable if you have 36” of topsoil
If you have only 6”, it’s not.

1850’s 1990’s N
(GIS by Kelly Arbuckle, ISU Limnology Lab) Iowa’s landscape has changed.
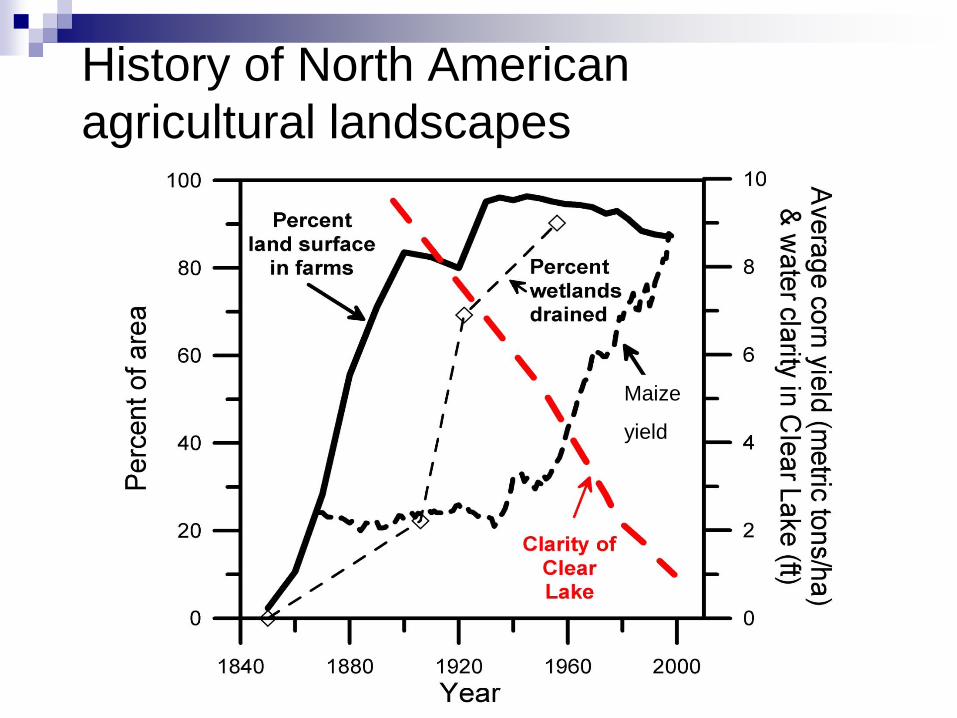
History of North American
agricultural landscapes
Maize
yield

(world data after Downing 1997, Biogeochemistry)
Nutrients
(X30=ppb)
(X12
=p
pb
)
(30 ppb) (300 ppb)
(1200 ppb)
(12000 ppb)
“iowa limnology”

..with a little help from my friends
Bob Diaz
Gene Turner
Nancy Rabalais
Jack
Jones
Jim
Baker

Fraction of Mississippi River (MS) input to
Gulf of Mexico
(After Howarth et al. 1997, Biogeochemistry)
11% of Gulf of Mexico N comes from Iowa
(2-3% of the N to the No Atlantic) 8-9% of Gulf of Mexico P comes from Iowa
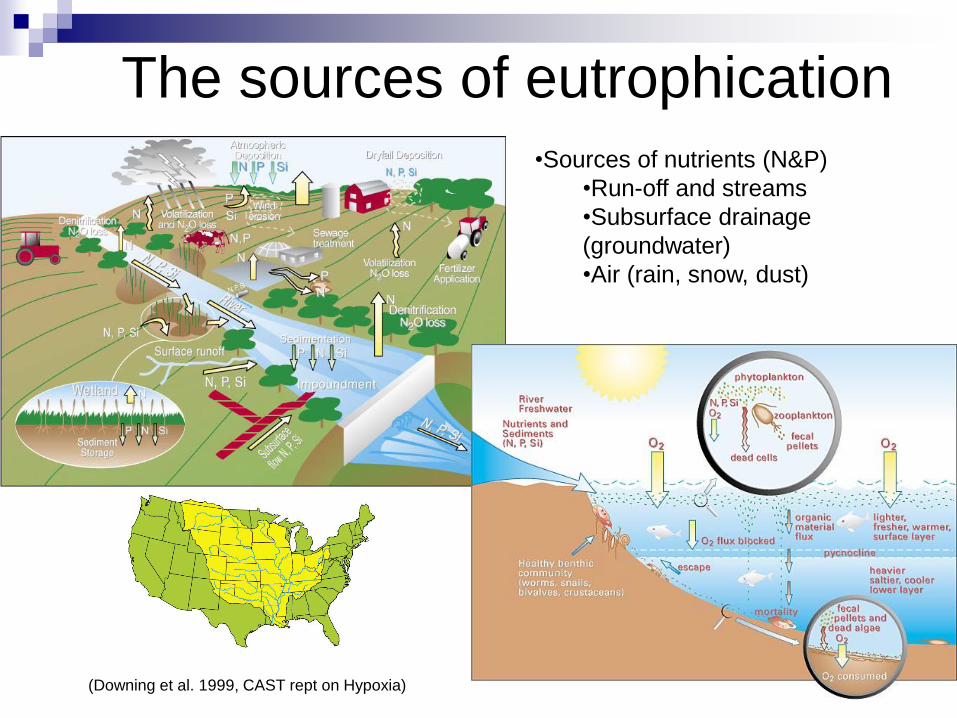
The sources of eutrophication
(Downing et al. 1999, CAST rept on Hypoxia)
•Sources of nutrients (N&P)
•Run-off and streams
•Subsurface drainage
(groundwater)
•Air (rain, snow, dust)

Contrasting views of agriculture:
hero or scoundrel?
Norman Borlaug on modern production
agriculture1: “Had we tried to produce the food of the year 2000 with the technology of 1960,
we would have had to have much more than double the area under cultivation,
which would have meant cutting down forests, plowing up lands that were
marginal …. So what would have happened to wildlife? “
Jared Diamond on modern production
agriculture2:
“The worst mistake in the history of the human race”
1. National Public Radio, Robert Siegel interview (2004)
2. Discover magazine (1987)

Iowa disturbance data: crops
~145,000 km2 (2X Ireland; 2X New Brunswick; ½ Italy, 1/3 Spain)
92% land area cultivated; most agriculture in US
N fertilizer: 94% maize, soybeans rotated Average = 130 kg/ha
P fertilizer: 72% maize, 7% soybeans Average = 3-65 kg/ha
25% of land has subsurface drainage >50% soils >optimum agronomic P
http://www.nass.usda.gov/ia/crops/rankcrop.txt; Dept. Agricultural & Biosystems Engineering, ISU

Iowa disturbance data: animals
16 million pigs (sow = 200 kg)
3.5 million cows (cow = 700 kg)
250k sheep (ewe = 65 kg)
37 million chickens (11 billion eggs/y) (hen = 1.8 kg)
Manure being spread on land as disposal
(masses from Byerly et al. 1967, Science)

A more common modern scene
Some things I’ve learned from repairing
and monitoring lakes like these….

Lesson 1. Some of the most critical “terrestrial”
and “marine” environments may be watersheds,
lakes, and rivers
60-80% of nutrients come from 5-10% of the watersheds
Watershed plumbing more important than land use
Fixing lake water quality (locally) for “P” also helps fix “N” (globally);
and lakes are very valuable to people – so is the sea
Iowa
Gulf of Mexico
(How it looks to me. From Downing
et al. 1999, CAST rept on Hypoxia)

Nutrient export spatially
localized
(60-80% of N & P can
come from <10% of the
land)
(5 cm rain)
Cell erosion (tons/ha)
(cell-level GIS application of AGNPS model)
P loss (tons/ha)
During 10cm rain

Surface
2m
4m
6m
4m
5m
Sub-bottom profile (Rock Creek Lake)
50% filling since construction (45 y)

Lesson 2. Limnological theory is
not just “theoretical”
A dozen diagnostic-restoration
studies and plans use off-the-shelf
models created by limnologists
Theories from limnologists you may
know:
Dillon, Rigler, Schindler, Jones,
Smith, Bachmann, Reckhow,
Nurnberg, Canfield, Walker, Kirchner,
Brandes, Chowdry, Cheng, Larsen,
Mercier, Ostrofsky, Uttormark,
Chapin, Green, etc.
Theories work and are bringing
improved water quality, recreation,
and economics to society

Lesson 3. Bacteria, sewage, and
manure are everywhere
Pattern-sampling of fecal coliforms in
Clear Lake to find levels and sources

Lesson 4. Nutrients move in
unexpected ways and forms
Rain and dust supply enough nutrient to make a lake
hypereutrophic
Groundwater supplies 2X enough nutrients for
hypereutrophy
Gaseous NHx is abundant and is absorbed by lakes and
rivers
Agriculture
43%
Urban
10%
Rain
31%
Groundwater
7%
Ag
impacted
wetland
(internal)
9%
P budget of Clear Lake

Lesson 5. People are important nutrient
sources, even in agricultural regions
Caffeine in storm drains in “sewered” urban land
Clear Lake run-off: 24 to 780 ng/L caffeine
Sewage dilution: 50- to 1700-fold

Lesson 6. Farm animal populations
should be counted, too!
3 million people live in my state, but….
POOP INDEX (Phosphorus Output Of People)
16 million pigs (4x sewage output of New York City)
3.5 million cows (1x sewage NYC)
250k sheep
37 million chickens (11 billion eggs/y)
POOP equivalent population: ~45 million
POOP equivalent human density = 300/km2
(Jamaica =230; India = 313; Spain = 85; Albany NY=269; Madison WI =305; Madrid = 675; Puerto Rico = 428)

Lesson 7. It isn’t just about farming,
plankton, and nutrients
Carp removed Control
Carp removed Control

Lesson 8. Some of our most valuable
“land” might be “water” Generally, $50k-$100k/ha/y
Hard to know the full value of water, because…
We rarely buy and sell whole lakes (or oceans)
….er, except in Canada
Even if we did, this value only represents a tiny part of small part of economic value of water bodies
Therefore, non-market valuation is important

Non-market valuation shows that limnologists and real humans value the same variables
Real-human values
Secchi transparency: (+) Total P & N: (-) Cyanobacteria biomass: (-) Suspended solids: (-) Lake size: (+) Dominance by non-Cyano phytoplankton: (+)
(several pubs by Kling, Herriges, Downing, Egan & Corrigan)

Summary
Agricultural landscapes and waterscapes are changing drastically with increased “production” Landscapes leak; hydrology accelerates
Landscapes drive biogeochemistry Land use and configuration alter flux
Biogeochemistry influences community interactions Phytoplankton dominance exacerbates nutrient problems
Communities feedback on biogeochemistry Exotic fish removal decreases nutrient transport; stimulates
macrophytes; holds sediments
Viable pathway to remediation underscores local values of water quality
When considering new agricultural initiatives, write lost value of water into the equation


Economists devise tricky ways of
finding value of “non-market goods”
Preserve water quality in a eutrophic lake
Stated preference
Revealed preference
130 lake study of revealed preference
Values determined by Travel cost (how much do they spend to get there)
Opportunity cost (how much income do they forego to go there)

Local economic activity suggests high value
• Clear Lake Iowa
– 80 ppb TP; 55 ppb chlorophyll a
– Secchi transparency 0.3 m;
decreased from ca 3 m in 1900
– Tourists spend >$100 million per
year.
– 2000 ha
– >$50,000 per ha each year

“Value” differs from local spending
“Local economic activity” poor indicator of value A burger bought here would probably have been bought
somewhere else w/o lake
Good indicators of value of non-market goods (e.g., lakes, oceans, etc.) are: revealed preference estimates
stated preference estimates
Called: “willingness to pay” or WTP
In USA, required for federal projects (e.g., dams), damage assessment payments (e.g., Exxon Valdez), prioritization for remediation (e.g., Clean H2O Act, TMDL)

Estimation of willingness to pay
Stated preference (Clear Lake) Find $ value of potential referendum on
lake water quality preservation
Revealed preference (Clear Lake) Comparison of:
Number of times people plan to visit with current water quality, vs.
Number of times they plan to visit degraded water body
(130 lakes) Comparison of: Number of times people visit good water quality lakes vs poor
Which limnological variables correlate with value estimates?

Methods
1
1
2 2
22
exp exp, | ,
! !
1 1 exp 2 ,
2 12 1
io icy y
io io ic icios io ic io ic
i io ic
o o c co c
o o c co c
yf y y x x
y y
d d
1 2
1,2, ; 0,1,2,i iy y
Pr Pr ,1 exp
ln
Pr .
ii i
i i
i ii
i
i
myes T
X
m TX
T
(papers in press in J. Agric. Econ. & another to be submitted to L&O
Methods any day now)

Stated preference (1000 surveys):
much are they willing to pay for
keeping current conditions? “Would you vote yes on a referendum to maintain the
current water quality of Clear Lake and avoid the
deteriorated water quality as described under Plan A? The
proposed project would cost you $X (payable in five [$X/5]
installments over a five-year period).”
The value of “X” was varied so that different respondents
were faced with different project costs.
Visitors
Water clarity objects distinguishable 6 inches to 1
foot under water Algae blooms 10 to 12 per year
Water color bright green to brown
Water odor mild odor, occasionally strong
Bacteria possible short-term swim advisories
Fish low diversity, good walleye
Overall, the current condition of Clear Lake can be summarized in terms of
general water color

Stated preference valuation of
current water quality in Clear Lake
Solution by probit analysis considering
influence of socio economic indicators
Non-resident visitors (454,000 y-1):
$148 over 5y
(95% CI $108-$236)
Residents (60,000):
$461 over 5y
(95% CI $272-$1490)

Revealed preference
(analyzing what people do)
Travel cost (recreational demand) modeling
Measure visitors’ costs to get there (fuel, lost salary, etc.)
Clear Lake: see how this would vary with altered water quality
130 Lakes: see how this covaries with observed water quality

Recreational Demand Modeling
Consumer’s surplus

Recreational Demand Modeling
Consumer’s surplus with changed number
of trips due to future poor water quality

Revealed preference (Clear Lake)
1000 surveys:
“trip behavior” now
“trip behavior” if water quality degraded
Travel cost at ¼ and 1/3 wage-rate
Used integral of bivariate Poisson-lognormal model estimated by maximum likelihood Estimated value in presence of socio-economic
indicators
Average visitors’ trip behavior revealed: Change from average 4.5 trips to 1.3
Value of maintaining current conditions: $148-$168 per person per year
500,000 annual visitors

Revealed preference
(130 lakes) 14,000 surveys:
“trip behavior” to lakes of differing water quality
Estimate partial effects of water quality on value
Travel cost at 1/3 wage-rate
Used mixed logit model to estimate significance and signs of water quality characteristics Estimated value in presence of socio-economic
indicators
Average visitors’ trip behavior revealed: Influences of socio-economic factors
Male (-), age (+, -, +), education (+), family size (-), income (+), fish (0)
Limnological characteristics had strong effects

Revealed preference (consumer’s
surplus) analysis showed that
limnologists DO think like humans Real-human values
Secchi transparency: (+)
Total P & N: (-)
Cyanobacteria biomass: (-)
Suspended solids: (-)
Lake size: (+)
Chlorophyll: (+)
Non-Cyano phytoplankton: (+)
(analogous to partial effects in regression analysis)