no more name-calling
TRANSCRIPT

14 January 2020
Macro
| F
X R
ese
arc
h &
Str
ate
gy
Glo
bal
SEE PAGE 13 FOR IMPORTANT DISCLOSURES
Global Markets Daily
No More Name-calling
US Drops China’s Currency Manipulator Label
US drops China’s currency manipulator label in its Treasury FX
report released overnight, signaling further positivity in relations
just shortly before the phase-1 deal signing tomorrow.
Improvement in market sentiments sent the USDJPY pair above
110 as a result. CNH also gained around 0.2% vs. the dollar. On
net, some positivity may be imparted to other EM Asia FX as well,
but we think it could be modest in magnitude, as it arises
indirectly through positive correlations with the yuan.
No Other Large Surprises From Treasury Report
Aside from the dropping of China’s currency manipulator label,
there were few other surprises from the US Treasury FX report. No
major trading partner met all three criteria the Treasury uses to
evaluate currency manipulation tendencies. The members of the
“watch list” (countries which partially violate the criteria and are
more closely monitored) also largely remained the same, with the
only change being the addition of Switzerland.
US CPI and China Trade Data on Tap
Key data releases today include US CPI (Dec), Real Average Weekly Earnings (Dec), China trade (Dec), Japan Current Account (Nov), India Wholesale Prices (Dec), New Zealand Building Permits (Nov) and House Sales (Dec). Fed’s Williams and George, ECB’s Yves Mersch will also be speaking.
Implied USD/SGD Estimates at 8.30am
Upper Band Limit Mid-Point Lower Band Limit
1.3415 1.3689 1.3963
Analysts
G7: Events & Market Closure
Date Ctry Event
13 Jan JP Markets Closure
AXJ: Events & Market Closure
Date Ctry Event
13 Jan PH Markets Closure
17 Jan KR BoK Meeting
Model-Implied USD/CNY midpoint estimated at 6.8955 for 14 Jan 2020
Saktiandi Supaat
(65) 6320 1379
Tan Yanxi
(65) 6320 1378
Christopher Wong
(65) 6320 1347
Fiona Lim
(65) 6320 1374
MajorsPrev
Close% Chg Asian FX
Prev
Close% Chg
EUR/USD 1.1134 0.12 USD/SGD 1.3466 -0.13
GBP/USD 1.2989 -0.57 EUR/SGD 1.4994 -0.03
AUD/USD 0.6904 0.04 JPY/SGD 1.2248 -0.59
NZD/USD 0.6631 0.00 GBP/SGD 1.749 -0.72
USD/JPY 109.95 0.46 AUD/SGD 0.9296 -0.12
EUR/JPY 122.42 0.63 NZD/SGD 0.8928 -0.25
USD/CHF 0.9707 -0.20 CHF/SGD 1.3871 0.04
USD/CAD 1.3057 0.05 CAD/SGD 1.0314 -0.21
USD/MYR 4.0625 -0.33 SGD/MYR 3.017 -0.15
USD/THB 30.22 -0.08 SGD/IDR 10152.85 -0.43
USD/IDR 13673 -0.72 SGD/PHP 37.4725 0.00
USD/PHP 50.735 0.00 SGD/CNY 5.1172 -0.28
FX: Overnight Closing Prices

14 January 2020 2
FX Research & Strategy
G7 Currencies
DXY Index – Softening on Stronger Risk-on. USD continued to
tread water while equities were rather supported. 10year treasury
yield was also a tad higher, last seen around 1.8530% as risk
appetite remains buoyed by the upcoming US-China trade deal with
sources cited by Bloomberg that the Trump administration is
removing the “currency manipulator” label off China. The DXY
index closed at 97.35. It decline was more obvious against the EM
AxJ currencies compared to DM peers as the precipitous decline in
the USDCNH continued to drag on the rest of USDAxJ. The DXY
itself was not able to show much decline with the
underperformance of the GBP. We continue to look for opportunity
to lean against the greenback’s strength. Growth convergence with
the rest of the world (weaker US data vs. signs of stabilization
China, global trade) could continue to undermine the USD. Data
that is of most concern for today should be the CPI. Price action is
still within a falling trend channel. Resistance at 97.75 levels (50,
200 DMAs) intact. Support at 97.20 (21-dma), 96.40, 95.80 levels.
Week ahead has CPI(Dec), Real Average Weekly earnings (Dec), Fed
Williams, George speak; Wed has PPI (Dec), Empire Manufacturing,
Fed Harker, Kaplan speak, Beige Book; Thu has Retail sales (Dec),
Philly Fed (Jan); Fri has Net TIC Flows (Nov), Building Permits,
housing starts (Dec), Fed Harker speaks, Capacity utilization and
industrial production (Dec). Separately, non-voter Fed Bostic said
he sees no impetus for the Fed to stimulate or cool activity. Also
non-voter Fed Rosengren, on the other hand, is more concerned
about the potential for above-target inflation and inflation asset
bubbles.
EURUSD – Rising Slowly. EURUSD was last seen around 1.1140, a
tad higher on USD weakness. We eye the breach of the 1.1145-
resistance that was tested yesterday. The area of resistnace
between 1.1145-1.1208 has to be cleared for the next leg of
upmove to come. Otherwise, this pair risk falling back beyond the
1.10=figure, a head and shoulders formation. 21-dma has crossed
the 200-dma to the upside, a bullish signal and underpins our
preference to buy dips. Immediate support at 1.1090 (50 DMA).
Week ahead has ECB's Yves Mersch Speaks on Tue; Wed has
Industrial Production (Nov), Trade balance (Nov); Fri has
Construction output (Nov); CPI (Dec).
GBPUSD – Biased to the Downside. GBP was last seen around
1.2990. GBPUSD players are now already concerned about the
transition phase (that lasts for the rest of the year) and whether
EU-UK can reach a trade deal. There is also increasing expectations
for a rate cut after Vlieghe spoke about voting for a cut if data
does not improve. The sudden revival of a rate action by the BoE
could add more volatility for the GBPUSD although we remain
constructive on GBP’s outlook and favor buying dips. Growth-wise,
recession is likely to be avoided as private investments,
government spending and consumption are expected to rebound.
Chancellor Javid had announced budget date on 11 Mar and pledges
to unleash decade of renewal, seizing opportunities on Brexit. He

14 January 2020 3
FX Research & Strategy
told MPs that innovative forms of finance could be considered to
pay for infrastructure investment. We do see the time challenges
(<1y) in ironing out a new FTA deal with EU as what von de Leyen
had warned. Fears of another no-deal brexit on 31 Dec 2020 (if UK
cannot forge a new trade deal with EU) could return intermittently
to keep bullish sentiment in check, and that could limit GBP
gains. Bullish momentum on weekly chart remains intact.
Resistance at 1.32, 1.3290 levels. Support at 1.3010 (50 DMA).
Accumulate GBP dips preferred. Week ahead has Trade (Nov),
industrial production, manufacturing production, construction
output (Nov), monthly GDP (Nov) on Mon; Wed has CPI, PPI, RPI
(Dec); Fri has Retail sales (Dec).
USDJPY – Still Buoyed. Pair broke through interim resistance at
109.70 yesterday, after multiple prior attempts. Last seen at
110.08. Modest boost this morning was seen as reports of US
removing China’s currency manipulator label led to optimism on
US-China relations. On the Middle East situation, we note that
Iran’s admission that it accidentally shot down a Ukrainian jetliner,
after its initial denial, has also brought along a wave of global
condemnation. In this instance, concerted international pressure
may actually lead Iran to be cautious in its next political steps, and
risk of immediate escalation in tensions could be relatively low at
the moment. This could lead demand for haven assets to be on the
backfoot in the interim. Current account balance for Nov came in
this morning at JPY1436.8bn, quite near the JPY1423.3bn
expected. Other key data releases this week include Nov Core
Machine Orders on Thurs as well as the Tertiary Industry Index on
Fri. Both indicators are expected to see mild sequential gains after
prior contractions, and could be indicative of some stabilization in
(soft) domestic growth momentum. Momentum on daily chart is
mildly bullish, while stochastics appear to be climbing towards
near-overbought conditions. Resistance at 110.50 (76.4% fibo
retracement from 2019 high to low). 109.70 (Dec high) has turned
from resistance to support. Further support may be found at 109.00
(21, 50 DMA), followed by 108.50-108.60 levels.
AUDUSD – Supported. AUDUSD is supported, last seen around
0.6906. We monitor the occurrence of the golden cross with the
50-dma close to crossing the 200-dma to the upside, a bullish
signal. Resistance at 0.6930 before 0.6990. Supports seen at 0.6830
(38.2% Fibonacci retracement of the Jul-Aug 2019 fall, also the
100-dma) before the next at 0.6770. Moves from this point could
be more consolidative with potential support eyed at the 100-dma
at 0.6830, also a key diagonal support level that is formed since
the low of Oct. Failure to break that can mean a rebound and
continuation of a gentle uptrend. Week ahead has Nov trade data,
Wespac consumer conf index (Jan) on Thu and retail sales on
Fri. At home, rate cut probability in the Feb meeting has risen
based on the Australian cash rate futures from 38% seen around the
last week of Christmas to 53% as of writing as the bushfire
continues to rage on in a scale never seen before. While fiscal
stimulus is already unleashed by the government, data is still
lacking on consumer sentiment and activity. We do not expect RBA

14 January 2020 4
FX Research & Strategy
to ease in a hurry. We expect RBA to reiterate the need for “an
extended period of low interest rates required in Australia to reach
full employment and achieve the inflation target” at the next
policy meeting in Feb. Melbourne Institute Inflation (Dec) on Wed;
Thu has Investor Loan Value (Nov).
NZDUSD – Buy on Dips. NZD was last seen at 0.6631, having traded
ranged yesterday and this morning. Building permits for Nov came
in at -8.5%m/m this morning, deteriorating from the revised -1.3%
prior. We note though that earlier consumer confidence and retail
indicators were still positive. Stochastics are in near-oversold
positions and a golden cross pattern – 50 DMA cutting 200 DMA to
the upside – bullish signal, has also occurred late last week.
Nonetheless, bearish momentum on daily chart remains intact.
Despite conflicting signals, bias to buy dips still. Support at 0.6520
(50, 200 DMAs). Resistance at 0.6720, 0.6760 levels. Food prices
(Dec) due Wed, Mfg PMI (Dec) due Fri.
USDCAD – Rising. USDCAD hovered around 1.3050 as USD softens
along with oil prices. USDCAD was last seen around 1.3060. Support
is seen around 1.3040 before the next at 1.2950. Momentum has
turned bullish and resistance at 1.3096 (21-dma, 38.2% Fibonacci
retracement of the Nov-Jan decline). Support is seen at around
1.2860 beyond the current 1.2950.
14 January 2020 5
FX Research & Strategy
Asia ex Japan Currencies
SGD trades around 1.66% above the implied mid-point of 1.3689
with the top estimated at 1.3415 and the floor at 1.3963.
USDSGD – Watch out for Swings Precipitated by Deal Signing.
Pair continued to head lower, benefiting from benign regional
sentiments as the trade deal signing nears. Reports of US removing
China’s currency manipulator label also likely helped. Last seen at
1.3460. We have been suggesting 1.3450 as a strong interim support
in our daily reports since early last week. Thus far this has held up
relatively well despite modest swings, but we’re cautious of
volatility associated with the actual trade deal signing tomorrow.
A bout of exuberance on Asian assets could bring the pair nearer
1.34, but we do not rule out reversal in momentum post the event.
Non-oil domestic exports for Dec due Fri is expected to contract by
a smaller extent (-2.0%) compared to prior (-5.9%), underscoring the
house view that the bottoming out in macro outcomes is near.
Momentum on daily chart is mildly bullish while stochastics are
inching lower. Besides 1.3450 (2019 lows in Feb, Mar, Dec), next
support some distance away at 1.3370. Resistance at 1.3560 (23.6%
fibo retracement from Sep high to Dec low), 1.3640 (38.2% fibo).
SGDMYR – Risk of Modest Rebound. SGDMYR moved lower again;
last seen at 3.0136. MYR continued to benefit more from
improvement in regional sentiments (compared to SGD), especially
as US-China trade deal signing nears. Bearish momentum on daily
chart remains intact but stochastics are in oversold conditions.
Modest rebound not ruled out. 3.00 should be a strong support.
Resistance at 3.03, 3.0420 (200 DMA), 3.0470 (100 DMA).
AUDSGD – Consolidative. AUDSGD traded sideways was last seen
around 0.9290. Stochastics seem to show signs of turning higher and
focus could be to the upside from here. Support is seen at 0.9230 –
a level that has been tested multiple times in the last six months
and held. Resistance at 0.9320 (23.6% fibo retracement of the Jul-
Aug fall, 50-dma).
USDMYR – Bearish but Oversold. USDMYR is now trading near 2019
low of 4.0540. Momentum on daily chart is still bearish, while
stochastics are flashing oversold signals. Support at 4.0540 (2019
low), 4.04, then 4.00. Resistances at 4.08, 4.10 levels.
1m USDKRW NDF – Still Bearish. NDF headed lower this morning as
news of US removing China’s currency manipulator label boosted
risk-on proxies. NDF was last seen at 1150. Besides actual trade
deal signing tomorrow, key event is BoK decision this Friday. We
expect BoK to be on Hold at 1.25% to allow for earlier rate cut in Oct to
work its way through the real economy. A headline GDP slipping below
2%, or sequential inflation momentum slipping below zero persistently
could portend a more dovish stance by BoK later on, but a rate cut this
round would be less likely. Confirmation of the rate pause by BoK could
help the 1m USDKRW NDF hang below 1160 levels. Support at 1154,
then 1148, then 1135. Resistance at 1160, 1169, 1178. Trade prices,
unemployment rate due Wed, BoK rate decision due Fri.

14 January 2020 6
FX Research & Strategy
USDCNH – Pressing Lower. USDCNH was last seen around 6.8744,
last seen around 6.8710. As we have said, the USDCNH is anchored
(relative to other USDAsians) by the upcoming US-China trade deal
on 15th Jan. Next support beyond the nearby 6.8710 is seen at
6.8170. Week ahead has liquidity numbers including aggregate
financing for Dec, money supply and new yuan loans from 10-15th
Jan, Dec trade is due today before new home sales on Thu and
retail sales, property investment , industrial production and FAI ex
rural and GDP on Fri. We continue to look for CNHPHP to head
towards 7.4850. The cross is last seen around 7.3020. Over the
weekend, Deputy Governor of PBoC Pan Gongsheng told the press
that China’s financial markets liberalization should provide
“relatively big room” for foreign capital inflows. High savings rate
and strong manufacturing industry should keep current account
balanced. The USTR released its semi-annual treasury report and
removed the “currency manipulator” label from China and added
Switzerland into the list of countries being monitored for currency
manipulation.
USDINR 1M NDF – Dragged lower by USDCNH. The return of risk
appetite and lower crude kept this pair under the 71.00. Next
support is seen around 70.75 while resistance levels seen around
71.10 before 71.75. CPI came in well above consensus at 7.35%y/y,
and well above RBI’s inflation target band of 4% (+/-2%). This
underscores the policy constraint that RBI faces in stimulating the
economy. Week ahead has WPI today, trade data on Wed.
1m USDIDR NDF – IDR Strength Still in View. NDF last seen at
around 13,680, having continued to decline yesterday and this
morning. Some residual positive effects of BI's recent signaling that
it will allow the IDR to gain further “in accordance with the market
mechanism, as long as the volatility is manageable”, still seems to
be in play, even as news of US removing China’s currency
manipulator label this morning further boosted sentiments.
Nonetheless, we think that further gains in IDR post the actual deal
signing tomorrow could be capped. Currency strength has to be
eventually aligned with fundamentals, and risks to the growth
outlook, concerns over fiscal deficits etc. are still intact for 2020.
Any short-run move below 13,600 might see some tentative
pullback. On the other hand, concerns over labor union protests
over Jokowi’s omnibus bill would likely not add excessively to
market concerns. Momentum on daily chart is modestly bearish
while stochastics are in oversold conditions. Support at 13,600,
then 13,400. Resistance at 13,860 (recent low), 14,040 (50 DMA).
Trade data due Wed.
14 January 2020 7
FX Research & Strategy
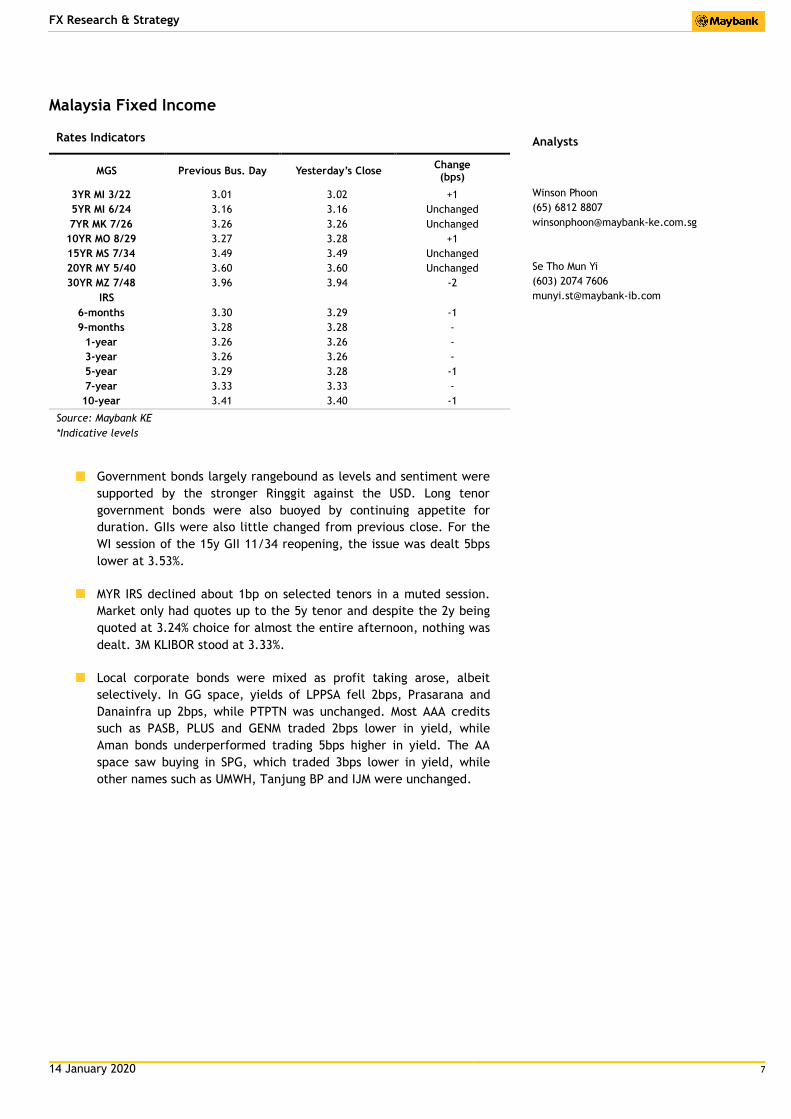
Malaysia Fixed Income
Rates Indicators
MGS Previous Bus. Day Yesterday’s Close Change (bps)
3YR MI 3/22 3.01 3.02 +1
5YR MI 6/24 3.16 3.16 Unchanged
7YR MK 7/26 3.26 3.26 Unchanged
10YR MO 8/29 3.27 3.28 +1
15YR MS 7/34 3.49 3.49 Unchanged
20YR MY 5/40 3.60 3.60 Unchanged
30YR MZ 7/48 3.96 3.94 -2
IRS
6-months 3.30 3.29 -1
9-months 3.28 3.28 -
1-year 3.26 3.26 -
3-year 3.26 3.26 -
5-year 3.29 3.28 -1
7-year 3.33 3.33 -
10-year 3.41 3.40 -1
Source: Maybank KE
*Indicative levels
Global: Export Growth (% YoY,
Government bonds largely rangebound as levels and sentiment were
supported by the stronger Ringgit against the USD. Long tenor
government bonds were also buoyed by continuing appetite for
duration. GIIs were also little changed from previous close. For the
WI session of the 15y GII 11/34 reopening, the issue was dealt 5bps
lower at 3.53%.
MYR IRS declined about 1bp on selected tenors in a muted session.
Market only had quotes up to the 5y tenor and despite the 2y being
quoted at 3.24% choice for almost the entire afternoon, nothing was
dealt. 3M KLIBOR stood at 3.33%.
Local corporate bonds were mixed as profit taking arose, albeit
selectively. In GG space, yields of LPPSA fell 2bps, Prasarana and
Danainfra up 2bps, while PTPTN was unchanged. Most AAA credits
such as PASB, PLUS and GENM traded 2bps lower in yield, while
Aman bonds underperformed trading 5bps higher in yield. The AA
space saw buying in SPG, which traded 3bps lower in yield, while
other names such as UMWH, Tanjung BP and IJM were unchanged.
Analysts
Winson Phoon
(65) 6812 8807
Se Tho Mun Yi
(603) 2074 7606

14 January 2020 8
FX Research & Strategy
Singapore Fixed Income
Rates Indicators
SGS Previous Bus. Day Yesterday’s Close Change (bps)
2YR 1.47 1.46 -1
5YR 1.55 1.54 -1
10YR 1.74 1.75 +1
15YR 1.85 1.85 -
20YR 1.93 1.93 -
30YR 2.09 2.09 -
Source: MAS
SGS prices opened higher in line with UST following the softer than
expected jobs report, but the long end quickly shed gains which
resulted in a marginally steeper yield curve. Market may continue to
see steepening bias as SGS auctions in the next 2 months are long
tenor 10y and 30y bonds. SGD IRS rates were little changed from
previous close.
Asian USD credit market was subdued given Japan market was closed
for a holiday and a packed primary pipeline with new issuances from
Korea, China, Indonesia and Hong Kong sidelined the secondary
market. Following the uninspiring jobs report, credit spreads broadly
widen by 1-2bps, especially for bonds that rallied last week. China
HY property sector saw some demand for the better quality names
as the PBOC easing and possible further RRR cuts lend support to the
sector.

14 January 2020 9
FX Research & Strategy
Indonesia Fixed Income
Rates Indicators
IDR Gov’t Bonds Previous Bus. Day Yesterday’s Close Change
(bp)
1YR 5.05 5.03 (0.03)
3YR 6.11 6.04 (0.07)
5YR 6.25 6.20 (0.05)
10YR 6.93 6.87 (0.06)
15YR 7.36 7.32 (0.04)
20YR 7.50 7.46 (0.04)
30YR 7.64 7.67 0.03
* Source: Bloomberg, Maybank Indonesia
Global: Export Growth (% YoY,signif
Indonesia government bonds sustained appreciation trends yesterday.
investors shifted their focus from Middle East tensions to the expected
signing of a trade deal between the United States and China. It triggered
money inflow to the emerging markets, such as Indonesia. The U.S.-
China Phase 1 agreement, due to be signed at the White House on
Wednesday, marks the first step toward ending a damaging 18-month
trade dispute between the world’s two largest economies. Today, local
investors will focus to government’s Sukuk auction. The government
targets Rp7 trillion of absorption from this sukuk auction. We believe
today’s Sukuk auction will get strong attention from investors that
seeking high investment yields. Several series that will be released for
this Sukuk auction are SPN-S 15072020 (new issuance), PBS002
(reopening), PBS026 (reopening), PBS005 (reopening).
Meanwhile, in early 2020, the Indonesian government has successfully
sold global bonds in US$ and Euro denomination. The government took a
good momentum in the global financial markets for optimizing its debt
facility for financing the state budget in early year. The government
released RI0230, RI0250, and RIEUR0227 by US$ 1.2 billion, US$0.8
billion, and EUR1 billion, subsequently, with coupon rates by 2.850%,
3.500%, and 0.900%, respectively. Those series of global bonds have
tenors by 10 year, 30-year, and 7-year tenor, respectively. It also
received a Baa2 rating from Moody's, BBB from Standard & Poor's, and
BBB from Fitch.
Analysts
Myrdal Gunarto
(62) 21 2922 8888 ext 29695

14 January 2020 10
FX Research & Strategy
Equity Indices and Key Commodities
Value % C hange
D o w 28,907.05 0.29
N asdaq 9,273.93 1.04
N ikkei 225 23,850.57 0.47
F T SE 7,617.60 0.39
A ustralia A SX 200 6,903.67 -0.37
Singapo re Straits
T imes3,251.07 -0.15
Kuala Lumpur
C o mpo site1,584.73 -0.42
Jakarta C o mpo site 6,296.57 0.34
P hilippines
C o mpo site7,776.77 -0.27
T aiwan T A IEX 12,113.42 0.74
Ko rea KOSP I 2,229.26 1.04
Shanghai C o mp Index 3,115.57 0.75
H o ng Ko ng H ang
Seng28,954.94 1.11
India Sensex 41,859.69 0.62
N ymex C rude Oil WT I 58.08 -1.63
C o mex Go ld 1,550.60 -0.61
R euters C R B Index 183.01 -0.61
M B B KL 8.65 0.00
Rates Current (%)Upcoming CB
MeetingMBB Expectation
MAS SGD 3-Month
SIBOR1.7710 Apr-20 Easing Bias
BNM O/N Policy Rate 3.00 22/1/2020 Easing Bias
BI 7-Day Reverse Repo
Rate5.00 23/1/2020 Easing
BOT 1-Day Repo 1.25 5/2/2020 Neutral
BSP O/N Reverse Repo 4.00 6/2/2020 Easing
CBC Discount Rate 1.38 19/3/2020 Neutral
HKMA Base Rate 2.00 - Neutral
PBOC 1Y Lending Rate 4.35 - Easing
RBI Repo Rate 5.15 6/2/2020 Easing
BOK Base Rate 1.25 17/1/2020 Easing
Fed Funds Target Rate 1.75 30/1/2020 Easing
ECB Deposit Facility
Rate-0.50 23/1/2020 Easing Bias
BOE Official Bank Rate 0.75 30/1/2020 Neutral
RBA Cash Rate Target 0.75 4/2/2020 Easing Bias
RBNZ Official Cash Rate 1.00 12/2/2020 Easing Bias
BOJ Rate -0.10 21/1/2020 Easing
BoC O/N Rate 1.75 22/1/2020 Neutral
Policy Rates
Foreign Exchange: Daily LevelsEUR/USD USD/JPY AUD/USD GBP/USD USD/CNH NZD/USD EUR/JPY AUD/JPY
R2 1.1165 110.28 0.6940 1.3108 6.9300 0.6667 123.0733 76.3467
R1 1.1150 110.12 0.6922 1.3048 6.9062 0.6649 122.7467 76.1233
Current 1.1139 110.15 0.6905 1.2995 6.8750 0.6627 122.6900 76.0620
S1 1.1116 109.62 0.6884 1.2945 6.8694 0.6617 121.8367 75.5633
S2 1.1097 109.28 0.6864 1.2902 6.8564 0.6603 121.2533 75.2267
USD/SGD USD/MYR USD/IDR USD/PHP USD/THB EUR/SGD CNY/MYR SGD/MYR
R2 1.3508 4.0762 13768 50.7403 30.3300 1.5028 0.5948 3.0264
R1 1.3487 4.0693 13720 50.7377 30.2750 1.5011 0.5920 3.0217
Current 1.3461 4.0580 13675 50.4760 30.2130 1.4994 0.5896 3.0149
S1 1.3452 4.0583 13649 50.5267 30.1600 1.4973 0.5861 3.0137
S2 1.3438 4.0542 13626 50.3183 30.1000 1.4952 0.5829 3.0104
*Values calculated based on pivots, a formula that projects support/resistance for the day.

14 January 2020 11
FX Research & Strategy
MYR Bonds Trades Details
MGS & GII Coupon Maturity
Date Volume (RM ‘m)
Last Done Day High Day Low
MGS 6/2012 3.492% 31.03.2020 3.492% 31-Mar-20 181 2.666 2.833 2.666
MGS 6/2013 3.889% 31.07.2020 3.889% 31-Jul-20 92 2.92 2.92 2.83
MGS 3/2015 3.659% 15.10.2020 3.659% 15-Oct-20 416 2.89 2.95 2.839
MGS 1/2011 4.16% 15.07.2021 4.160% 15-Jul-21 4 2.981 3.001 2.981
MGS 3/2014 4.048% 30.09.2021 4.048% 30-Sep-21 4 3.032 3.032 3.032
MGS 4/2016 3.620% 30.11.2021 3.620% 30-Nov-21 41 3.034 3.034 2.985
MGS 1/2017 3.882% 10.03.2022 3.882% 10-Mar-22 358 3.02 3.03 2.991
MGS 1/2012 3.418% 15.08.2022 3.418% 15-Aug-22 43 3.044 3.057 3.044
MGS 3/2013 3.480% 15.03.2023 3.480% 15-Mar-23 60 3.095 3.108 3.09
MGS 2/2018 3.757% 20.04.2023 3.757% 20-Apr-23 25 3.097 3.097 3.097
MGS 3/2019 3.478% 14.06.2024 3.478% 14-Jun-24 293 3.16 3.172 3.151
MGS 2/2017 4.059% 30.09.2024 4.059% 30-Sep-24 3 3.166 3.166 3.166
MGS 1/2015 3.955% 15.09.2025 3.955% 15-Sep-25 1 3.187 3.187 3.187
MGS 1/2019 3.906% 15.07.2026 3.906% 15-Jul-26 30 3.254 3.266 3.236
MGS 3/2016 3.900% 30.11.2026 3.900% 30-Nov-26 1 3.262 3.262 3.262
MGS 3/2007 3.502% 31.05.2027 3.502% 31-May-27 310 3.263 3.263 3.256
MGS 4/2017 3.899% 16.11.2027 3.899% 16-Nov-27 34 3.286 3.305 3.286
MGS 2/2019 3.885% 15.08.2029 3.885% 15-Aug-29 43 3.279 3.285 3.242
MGS 4/2011 4.232% 30.06.2031 4.232% 30-Jun-31 30 3.455 3.455 3.455
MGS 4/2013 3.844% 15.04.2033 3.844% 15-Apr-33 100 3.52 3.529 3.51
MGS 3/2018 4.642% 07.11.2033 4.642% 07-Nov-33 497 3.519 3.536 3.519
MGS 4/2015 4.254% 31.05.2035 4.254% 31-May-35 40 3.597 3.605 3.597
MGS 4/2018 4.893% 08.06.2038 4.893% 08-Jun-38 11 3.633 3.633 3.633
MGS 5/2019 3.757% 22.05.2040 3.757% 22-May-40 1 3.593 3.593 3.593
MGS 2/2016 4.736% 15.03.2046 4.736% 15-Mar-46 146 3.992 3.998 3.992
MGS 5/2018 4.921% 06.07.2048 4.921% 06-Jul-48 192 3.943 3.977 3.924 GII MURABAHAH 4/2016 3.226% 15.04.2020 3.226% 15-Apr-20 40 2.889 2.889 2.889
PROFIT-BASED GII 7/2012 15.05.2020 3.576% 15-May-20 5 2.962 2.962 2.962 GII MURABAHAH 3/2018 4.094% 30.11.2023 4.094% 30-Nov-23 160 3.155 3.163 3.155 GII MURABAHAH 4/2019 3.655% 15.10.2024 3.655% 15-Oct-24 90 3.192 3.192 3.186 GII MURABAHAH 1/2018 4.128% 15.08.2025 4.128% 15-Aug-25 220 3.25 3.25 3.24 GII MURABAHAH 3/2019 3.726% 31.03.2026 3.726% 31-Mar-26 40 3.277 3.277 3.274 GII MURABAHAH 3/2016 4.070% 30.09.2026 4.070% 30-Sep-26 140 3.307 3.307 3.304 GII MURABAHAH 2/2018 4.369% 31.10.2028 4.369% 31-Oct-28 5 3.359 3.359 3.359 GII MURABAHAH 1/2019 4.130% 09.07.2029 4.130% 09-Jul-29 10 3.361 3.361 3.361 GII MURABAHAH 3/2015 4.245% 30.09.2030 4.245% 30-Sep-30 280 3.424 3.446 3.424 GII MURABAHAH 6/2017 4.724% 15.06.2033 4.724% 15-Jun-33 330 3.545 3.549 3.545 GII MURABAHAH 5/2013 4.582% 30.08.2033 4.582% 30-Aug-33 60 3.556 3.56 3.556 GII MURABAHAH 6/2019 4.119% 30.11.2034 4.119% 30-Nov-34 30 3.553 3.553 3.53 GII MURABAHAH 2/2019 4.467% 15.09.2039 4.467% 15-Sep-39 20 3.659 3.663 3.659
Total 4,386
Sources: BPAM

14 January 2020 12
FX Research & Strategy
MYR Bonds Trades Details
PDS Rating Coupon Maturity
Date Volume (RM ‘m)
Last Done
Day High
Day Low
LPPSA IMTN 4.050% 21.09.2026 - Tranche No 4 GG 4.050% 21-Sep-26 10 3.369 3.372 3.369
PRASARANA IMTN 4.64% 22.03.2030 - Series 3 GG 4.640% 22-Mar-30 10 3.518 3.518 3.518
PRASARANA IMTN 4.75% 26.02.2031 - Series 9 GG 4.750% 26-Feb-31 25 3.57 3.57 3.568
PRASARANA IMTN 4.380% 12.03.2031 - Tranche 4 GG 4.380% 12-Mar-31 15 3.57 3.57 3.57
DANAINFRA IMTN 4.570% 02.05.2031 - Tranche No 45 GG 4.570% 02-May-31 10 3.569 3.569 3.569
PTPTN IMTN 13.03.2037 GG 4.950% 13-Mar-37 20 3.799 3.8 3.799
LPPSA IMTN 4.850% 29.10.2038 - Tranche No 25 GG 4.850% 29-Oct-38 50 3.819 3.821 3.819
LPPSA IMTN 4.580% 11.04.2039 - Tranche No 31 GG 4.580% 11-Apr-39 50 3.829 3.831 3.829
BPMB IMTN 4.28% 02.03.2022 - Issue No 10 AAA 4.280% 02-Mar-22 40 3.465 3.473 3.465
DANUM IMTN 3.960% 09.05.2023 - Tranche 3 AAA (S) 3.960% 09-May-23 20 3.422 3.422 3.422
GENM CAPITAL MTN 3651D 22.8.2025 AAA (S) 4.900% 22-Aug-25 50 3.821 3.859 3.817
DANUM IMTN 4.300% 13.02.2026 - Tranche 1 AAA (S) 4.300% 13-Feb-26 30 3.5 3.5 3.5
PLUS BERHAD IMTN 4.800% 12.01.2027 - Series 1 (11) AAA IS 4.800% 12-Jan-27 30 3.598 3.611 3.598
GENM CAPITAL MTN 3652D 31.3.2027 AAA (S) 4.980% 31-Mar-27 20 3.902 3.902 3.899
AMAN IMTN 4.400% 12.04.2027 - Tranche No. 18 AAA IS 4.400% 12-Apr-27 40 3.662 3.664 3.662
PLUS BERHAD IMTN 4.880% 12.01.2028 - Series 1 (12) AAA IS 4.880% 12-Jan-28 60 3.649 3.669 3.649
RP II IMTN 5.600% 16.06.2028 AAA IS (FG) 5.600% 16-Jun-28 10 4.03 4.051 4.03
STARBRIGHT ABSMTN 3288D 27.12.2028 - Tranche No. 9 AAA 4.550% 27-Dec-28 5 4.579 4.579 4.579
PASB IMTN 4.540% 23.02.2029 - Issue No. 12 AAA 4.540% 23-Feb-29 10 3.648 3.65 3.648
PLUS BERHAD IMTN 5.390% 12.01.2034 - Series 1 (18) AAA IS 5.390% 12-Jan-34 10 3.897 3.898 3.897
UMWH IMTN 4.650% 13.09.2023 AA2 4.650% 13-Sep-23 10 3.62 3.623 3.62
FPSB IMTN 5.050% 05.09.2025 AA IS 5.050% 05-Sep-25 10 3.859 3.863 3.859
FPSB IMTN 5.050% 31.10.2025 AA IS 5.050% 31-Oct-25 10 3.87 3.874 3.87
TANJUNG BP IMTN 5.280% 16.08.2027 AA2 5.280% 16-Aug-27 10 3.978 3.981 3.978
SEGI ASTANA MTN 2191D 08.1.2024 AA- 5.300% 08-Jan-24 1 5.201 5.201 5.201
IJM IMTN 5.050% 18.08.2028 AA3 5.050% 18-Aug-28 10 4.207 4.209 4.207
SPG IMTN 5.130% 31.10.2029 AA- IS 5.130% 31-Oct-29 10 3.909 3.911 3.909
AFFINBANK SUBORDINATED MTN 3652D 20.9.2027 A1 5.030% 20-Sep-27 10 3.814 3.818 3.814
CIMB 4.880% Perpetual Capital Securities - T4 A1 4.880% 25-May-16 2 4.201 4.507 4.201
UMWH Perpetual Sukuk Musharakah 6.35% - Tranche 1 A1 6.350% 20-Apr-18 10 4.486 4.492 4.486 IJM LAND 5.650% PERPETUAL SUKUK MUSHARAKAH -S1 T1 A2 (S) 5.650% 17-Mar-19 11 4.503 4.719 4.497 IJM LAND 4.730% PERPETUAL SUKUK MUSHARAKAH -S2 T3 A2 (S) 4.730% 17-Mar-19 10 4.617 4.619 4.617
Total 620
Sources: BPAM

14 January 2020 13
FX Research & Strategy
DISCLAIMER
This report is for information purposes only and under no circumstances is it to be considered or intended as an offer to sell or a solicitation of an offer to buy the securities or financial instruments referred to herein, or an offer or solicitation to any person to enter into any transaction or adopt any investment strategy. Investors should note that income from such securities or financial instruments, if any, may fluctuate and that each security’s or financial instrument’s price or value may rise or fall. Accordingly, investors may receive back less than originally invested. Past performance is not necessarily a guide to future performance. This report is not intended to provide personal investment advice and does not take into account the specific investment objectives, the financial situation and the particular needs of persons who may receive or read this report. Investors should therefore seek financial, legal and other advice regarding the appropriateness of investing in any securities and/or financial instruments or the investment strategies discussed or recommended in this report.
The information contained herein has been obtained from sources believed to be reliable but such sources have not been independently verified by Malayan Banking Berhad and/or its affiliates and related corporations (collectively, “Maybank”) and consequently no representation is made as to the accuracy or completeness of this report by Maybank and it should not be relied upon as such. Accordingly, no liability can be accepted for any direct, indirect or consequential losses or damages that may arise from the use or reliance of this report. Maybank and its officers, directors, associates, connected parties and/or employees may from time to time have positions or be materially interested in the securities and/or financial instruments referred to herein and may further act as market maker or have assumed an underwriting commitment or deal with such securities and/or financial instruments and may also perform or seek to perform investment banking, advisory and other services for or relating to those companies whose securities are mentioned in this report. Any information or opinions or recommendations contained herein are subject to change at any time, without prior notice.
This report may contain forward looking statements which are often but not always identified by the use of words such as “anticipate”, “believe”, “estimate”, “intend”, “plan”, “expect”, “forecast”, “predict” and “project” and statements that an event or result “may”, “will”, “can”, “should”, “could” or “might” occur or be achieved and other similar expressions. Such forward looking statements are based on assumptions made and information currently available to us and are subject to certain risks and uncertainties that could cause the actual results to differ materially from those expressed in any forward looking statements. Readers are cautioned not to place undue relevance on these forward looking statements. Maybank expressly disclaims any obligation to update or revise any such forward looking statements to reflect new information, events or circumstances after the date of this publication or to reflect the occurrence of unanticipated events.
This report is prepared for the use of Maybank’s clients and may not be reproduced, altered in any way, transmitted to, copied or distributed to any other party in whole or in part in any form or manner without the prior express written consent of Maybank. Maybank accepts no liability whatsoever for the actions of third parties in this respect. This report is not directed to or intended for distribution to or use by any person or entity who is a citizen or resident of or located in any locality, state, country or other jurisdiction where such distribution, publication, availability or use would be contrary to law or regulation.
14 January 2020 14
FX Research & Strategy
Published by:
Malayan Banking Berhad (Incorporated In Malaysia)
Foreign Exchange
Sales
Singapore Indonesia Malaysia
Saktiandi Supaat Juniman Azman Amiruddin Shah bin Mohamad Shah
Head, FX Research Chief Economist, Indonesia Head, Sales-Malaysia, GB-Global Markets
[email protected] [email protected] [email protected]
(+65) 6320 1379 (+62) 21 2922 8888 ext 29682 (+60) 03-2173 4188
Christopher Wong Myrdal Gunarto Singapore
Senior FX Strategist Industry Analyst Janice Loh Ai Lin
[email protected] [email protected] Co-Head of Sales, Singapore
(+65) 6320 1347 (+62) 21 2922 8888 ext 29695 [email protected]
(+65) 6536 1336
Fiona Lim
Senior FX Strategist Joanna Leong Wan Yi
[email protected] Co-Head of Sales, Singapore
(+65) 6320 1374 [email protected]
Yanxi Tan
(+65) 6320 1511
FX Strategist Indonesia
[email protected] Endang Yulianti Rahayu
(+65) 6320 1378 Head of Sales, Indonesia
(+62) 21 29936318 or
Fixed Income (+62) 2922 8888 ext 29611
Malaysia
Winson Phoon Wai Kien
Shanghai
Fixed Income Analyst
Joyce Ha
Treasury Sales Manager
(+65) 6231 5831
(+86) 21 28932588
Se Tho Mun Yi
Fixed Income Analyst Hong Kong
[email protected] Joanne Lam Sum Sum
(+60) 3 2074 7606
Head of Corporate Sales Hong Kong
(852) 3518 8790