no. 54 · however, due to capital rationing, it is not possible to include all the roads that...
TRANSCRIPT

ECONOMIC RESEARCH PAPER
No. 54
Economic Analysis and Prioritization of Feeder Road Rehabilitation
By
Chiji Ojukwu
Agriculture Division, Country Department, East.
The views and interpretations in this paper are those of the author and not necessarily
those of the African Development Bank
2
ECONOMIC RESEARCH PAPERS
No. 54
Economic Analysis and Prioritization of Feeder Road Rehabilitation
by
Chiji Ojukwu
Copyright © 2000
The African Development Bank
01 B.P. 1387
Abidjan 01
Côte d’Ivoire

3
Economic Analysis and Prioritization of Feeder Road Rehabilitation.
By
Chiji Ojukwu
ABSTRACT
Development studies demonstrate that agricultural projects and programmes which
exclude basic infrastructures in their design often fail to translate incremental production
into sufficient incomes for the intended beneficiaries. Creation of supplementary
infrastructure is an important factor in poverty reduction strategies. Both the Government
of Uganda and donors – the International Fund for Agricultural Development (IFAD) and
the African Development Fund (ADF) have realized this and have incorporated basic
infrastructure, including feeder road rehabilitation, in the design of the Area-based
Agricultural Modernisation Programme proposed to be implemented in the southwestern
Uganda and which is being co-financed by these institutions. However, due to capital
rationing, it is not possible to include all the roads that require rehabilitation in the
investment proposal. An acceptable and practical methodology was therefore imperative
to be able to analyse all the feeder roads prescreened and submitted to the donors for
financing of their rehabilitation. Given the low traffic volumes associated with roads of
this nature, most of the current methodologies which rely on traffic count data are not
adequate to address the issue. The objective of this paper is to review the current
practices as being used by the international donor agencies, in the context of an
agricultural based rural feeder road rehabilitation component in the Southwestern
Uganda, with a view to establishing a more practical methodology for feeder road
selection, ranking and prioritization. There is no dearth of theoretical underpinnings of
the principles. Yet the practice in the field is often the weak link. The paper is intended to
assist the work of development and project economists to address the problem of choice
among competing investment options, under capital rationing, with regards to feeder road
prioritization for rehabilitation.
1The paper was based on an initial concept paper and outcome of an appraisal mission of the Uganda Area-
based Agricultural Modernisation Programme during February, 2000.
2Chiji Ojukwu is a Principal Agricultural Economist in the Agriculture Division of the Country Operations
Department, East. His thanks go to L.I. Umeh, Manager, Agriculture Division, Country Department East
and colleagues Sam Onwona, Micah Ajijo, Ben Kanu and Esther Kasalu-Coffin who reviewed the initial
concept paper that was used for the mission, and to Dougou Keita and Paul Barnstein, members of the
mission, and to Fred Were of the Ugandan Ministry of Works, Housing and Communication and all the
Chairmen, District Engineers and Economists who participated in the stakeholders workshop and provided
most of the data used in this paper.

4
1. Introduction
With support from the International Fund for Agricultural Development (IFAD) and the
African Development Fund (ADF), the Government of Uganda (GOU) is implementing
an Area-based Agricultural Modernisation Programme (AAMP) in the southwestern
Uganda. The objective of the programme is to raise the income of more than 300,000
households or about 1.5 million persons living in the 10 districts comprising the region,
through a process of agricultural modernisatiom (shifting from subsistence to commercial
farming), community mobilization (through empowerment, training and interest group
promotion) and rural infrastructure development (improvement in rural feeder roads,
community access roads and other infrastructure, including irrigation, livestock,
marketing facilities and storage). The African Development Fund has agreed to finance
the rural feeder road rehabilitation component of the programme. This will comprise
improvement on about 700 km of over 2,680 km requiring rehabilitation in the region.
These roads deteriorated due to various causes in the past, including civil unrest, lack of
resources for development and insufficient institutional framework. Routine and periodic
maintenance were considered un-economical. Improvement in basic access roads in the
rural areas is acknowledged as one of the important steps towards poverty alleviation.
Improvement in feeder roads have been known to provide incentives for agricultural
commercialization and monetization of the rural sector through better access to more
competitive marketers and traders and improved farm gate prices for most commodities
(depending on their demand elasticities), increased export of farm produce outside the
region, reduction in passenger times and motorized vehicle operating costs and costs of
transportation of surplus produce. All these in turn stimulate further production at the
farm level, with a consequent boost in total food production capacity (Ojukwu, 1992).
Given limited external financing available and the absorptive capacity of both the GOU
and the district local administrations in terms of marching counterpart funds, it becomes
imperative that some sort of selection process and prioritization be employed to, apart
from ensuring equity in spatial distribution among districts, also ensures that only those
roads whose rehabilitation will maximize returns to investment are retained for
improvement. This methodology was applied in the selection of district roads included
for rehabilitation under the Area-based Agricultural Modernisation Programme in the
southwestern Uganda.
2. Concept and Issues
The underlying concept is that the resources that a country has for road improvement
expenditures are always insufficient for the total needs, and thus an economic evaluation
is necessary to determine the optimal allocation of the available resources, the priority
and timing of individual road improvement. A number of literature abound, especially
those published by the World Bank, enunciating methodologies for design and appraisal
of rural transport infrastructure. One of the earliest publications was that by Beenhakker
and Chammari (1979). This approach compares the aggregate benefits accruing from
farmers in the project’s road zone of influence and the transport costs savings accruing to

5
non-agricultural traffic under the “with project” situation, with the total costs of road
rehabilitation and maintenance and complimentary agricultural investments. This
methodology was used extensively in Nigeria for selecting rural feeder roads for
rehabilitation under the multi-state agricultural development projects (MSADPs)
implemented during the 1980s3. One of the drawbacks of this methodology is the
problem of isolating the exact effects of the rural feeder road. It tends to aggregate all
benefits irrespective of the contributing factors, such as agricultural technology or
cultural practices and farm management. It also limits the number of crops that can be
included in the analysis.
In a more recent Infrastructure notes, Liu (2000) working in Andhra Pradesh, India, tries
to aggregate savings in vehicle operating costs (VOC) and rural road user travel time
(TTC), even as the author admits the unsuitability of the methodology due to low traffic
volumes associated with rural access roads. Thus Schelling and Liu (2000) suggest
complimenting the analysis with a participatory cost-effectiveness approach. This
approach is data intensive and requires the existence of a rural road master plan. The
World Bank paper on Design and Appraisal of Rural Transport Infrastructure does indeed
recommend that for roads with traffic volume of less than 50 vehicles per day, the analyst
should use the cost-effectiveness criteria, while for traffic volumes of 50 to 200 per day,
it recommends the use of the Road Economic Decision Model. But this may not
necessarily be so as most rural roads can hardly achieve an average daily traffic (ADT) of
more than 50 vehicles. This would therefore mean the exclusion of all such rural roads
from the economic appraisal methodology.
In this paper, we can illustrate based on a recent study in the southwestern Uganda that it
is indeed possible to undertake a simplified economic analysis of individual rural feeder
roads by a combination of the VOC, TTC and the producer surplus transportation costs
savings (PSTC). It should be noted that the value of agricultural production is not
included in the analysis as in the Beenhakker and Chammari approach. Even though the
road rehabilitation will facilitate access of farmers to agricultural input and extension
services and thus impart the level of incremental production, the proposed methodology
takes these as given, and only focuses on benefits that will accrue outside the direct
production line.
3. Application of the Methodology
The first step in the analysis is to receive a shortlist of pre-screened roads from each of
the districts. The criteria for including roads in the shortlist is as follows4:
3 During the implementation of the MSADPs, each participating state was mandated to submit to the World
Bank for approval on annual basis a report of prioritized rural roads selected for implementation. 4 These criteria were agreed at a stakeholder workshop. It is important that if this study is to be replicated
elsewhere, a workshop of all the districts be held to agree on similar criteria.
6
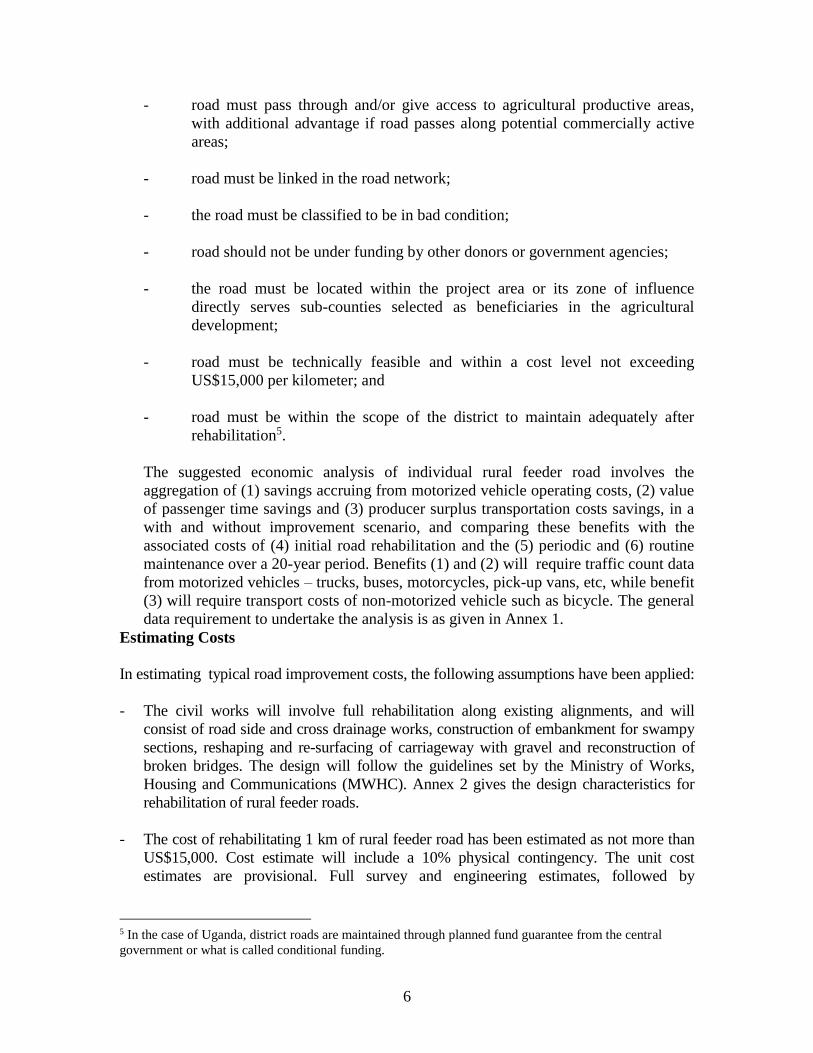
- road must pass through and/or give access to agricultural productive areas,
with additional advantage if road passes along potential commercially active
areas;
- road must be linked in the road network;
- the road must be classified to be in bad condition;
- road should not be under funding by other donors or government agencies;
- the road must be located within the project area or its zone of influence
directly serves sub-counties selected as beneficiaries in the agricultural
development;
- road must be technically feasible and within a cost level not exceeding
US$15,000 per kilometer; and
- road must be within the scope of the district to maintain adequately after
rehabilitation5.
The suggested economic analysis of individual rural feeder road involves the
aggregation of (1) savings accruing from motorized vehicle operating costs, (2) value
of passenger time savings and (3) producer surplus transportation costs savings, in a
with and without improvement scenario, and comparing these benefits with the
associated costs of (4) initial road rehabilitation and the (5) periodic and (6) routine
maintenance over a 20-year period. Benefits (1) and (2) will require traffic count data
from motorized vehicles – trucks, buses, motorcycles, pick-up vans, etc, while benefit
(3) will require transport costs of non-motorized vehicle such as bicycle. The general
data requirement to undertake the analysis is as given in Annex 1.
Estimating Costs
In estimating typical road improvement costs, the following assumptions have been applied:
- The civil works will involve full rehabilitation along existing alignments, and will
consist of road side and cross drainage works, construction of embankment for swampy
sections, reshaping and re-surfacing of carriageway with gravel and reconstruction of
broken bridges. The design will follow the guidelines set by the Ministry of Works,
Housing and Communications (MWHC). Annex 2 gives the design characteristics for
rehabilitation of rural feeder roads.
- The cost of rehabilitating 1 km of rural feeder road has been estimated as not more than
US$15,000. Cost estimate will include a 10% physical contingency. The unit cost
estimates are provisional. Full survey and engineering estimates, followed by
5 In the case of Uganda, district roads are maintained through planned fund guarantee from the central
government or what is called conditional funding.

7
competitive bidding will be undertaken prior to the implementation of each road work
and this is expected to result in more realistic, market-based, costing of civil works;
- According to the GOU 1999 Rural Road Strategy Report, US$3,700 (or 25%) of the
capital cost will be used for periodic maintenance6. This is assumed to take place every 5
years after construction and 5 years after every other periodic maintenance. Routine
maintenance is assumed to occur every year, except in the first year of capital
investment and the years when periodic maintenance is undertaken.
- Routine maintenance costs have been estimated at US$300 or 2% of capital costs for the
year following full rehabilitation; rising to 3% in PY3; 4% in PY4 and 5% in PY5. The
circle repeats after each periodic maintenance.
Estimating Benefits
Three types of benefits are estimated: (i) benefits accruing as a result of motorized vehicle
operating cost savings; (ii) benefits accruing to commuters as a result of road travel time
savings; and (iii) benefits accruing to non-motorized vehicle (bicycle) as a result of 50% of
the agricultural surpluses being hauled to market by bicycle and the resultant savings on the
cost of transportation following improved roads (Motorized vehicles – cars, pick-up and
trucks – are expected to haul the balance 50%7. However, only bicycle has been included in
the analysis to avoid double counting since the reduction in motorized vehicle operating
costs will also be transferred to reduced transport costs to non-agricultural vehicle users).
For estimation of the various benefits, the following assumptions have been made:
- assume 312 (26 days in a month) days per year traffic period;
- assume 5% annual growth rate of traffic after rehabilitation. For the purposes of this
analysis, the growth rate is assumed to peak in Project Year 6 8.
- For commuter time savings, assume a return trip (road length x 2)9. Time savings have
been converted to person-days and valued at their opportunity costs factored by the
shadow wage rate. Eight hours are assumed to constitute a worked day.
6 See the AFRICON 1999 Report 7 Without road improvement, it is assumed that almost 100% of the produce will be transported using
bicycles (or by head portage). With project, it is assumed about 50% of the produced will still be hauled
using bicycles, but at reduced fares. It is the savings in the fares of the 50% multiplied by the volume
hauled that is captured as benefit due to the road improvement. 8 VOC data are based on HDM-IV programme (as contained in the MOLG Report Manual for Evaluating
District Roads), adjusted to PY2000 constant prices; Traffic count data are taken for our typical model on
one of the roads in Ntungamu District. The data compare favourably with those estimated in the
WARDROP Report for MOLG p.47 for least traffic roads, and is in line with traffic count group 3 (11 – 20
veh/day). See MOLG Manual 11. 9 Change in transport costs between bad (typical operating speed of 20 km/hr) and good road condition
(operating speed of 60 km/hr), ie Before and After Rehabilitation, taken from WARDROP Report p.69, and
compares with mission observation.

8
- For estimation of benefits accruing as a result of producer surplus hauled by bicycles,
the following additional assumptions are made:
- Road Zone of Influence is assumed as 1 km either side and either end of road;
- Assume 70% of the arable land cultivated annually10.
- For the Uganda case a typical high altitude montane farm model is assumed11. Other
farming systems may be assumed under different road analysis.
- For the montane high altitude model, major crops are beans (30% area), banana (15%),
maize (10%) and irish potato (45%). This assumption will vary from place to place as
for the rest of the road analysis. Loss in consumer surplus (family consumption plus
waste) assumed between 30% to 50% for the typical crops. This will vary from crop to
crop and as to whether cash or food crop in individual road analysis. For typical cash
crops, only percentage associated with waste may be assumed.
- Costs of transportation on the roads are as estimated by the mission and compares with
the WARDROP Report12. Assume no price changes for the final consumer in the local
market.
Cost-Benefit Analysis
All financial costs and benefits are duly shadow priced to convert them to their economic
costs and benefits. By use of an excel spreadsheet, the layout is as given in Annex 3. The
spreadsheet is divided into 5 Sections. Section A gives the road’s basic data and parameters
for the economic analysis, including road name and length, initial capital cost of
rehabilitation, annual rate of traffic growth, standard conversion factor and shadow wage
rate.
Section B gives the estimation of benefits based on VOC savings for the first project year.
Information requirement here includes the Average Daily Traffic (ADT) for the motorized
vehicles that ply the road, the road length which cascades from Section A, the differential
VOCs from the improved and non-improved road respectively and the derived savings per
kilometer.
Section C is similar to Section B except that the basis of the analysis is the estimation of
time savings by commuters. Data requirement here includes vehicle differential speed on the
improved and non-improved road respectively, average vehicle occupancy rate and return
road length.
10 As agreed at the Stakeholder workshop held at Mbarara on 17 February, 2000 11 See IFAD Appraisal Report, Appendix 14 p2. Also yield estimates are based on the IFAD estimates
under improved condition and mission estimates. 12 Impact assessment of Rural Feeder Roads Rehabilitation and maintenance Programme, Final Report,
MOLG, November, 1999.

9
Section D estimates benefits from producer surplus transport cost savings through the
transportation of major commodities grown in the roads zone of influence. Data required
here include the list of the major crops grown, expected yield levels, hectarage allocated to
each crop, percentage of farm under cultivation in the zone of influence, percentage loss in
consumer surplus and storage losses and the differential costs of transportation on both the
improved and non-improved road.
Section E aggregates the economic costs and benefits and estimates the economic internal
rate of return (EIRR), the net present value (NPV) and the NPV-capital investment ration
(NPV/K) which is the basis of ranking.
Results of the Analysis
The economic internal rate of return (EIRR) for the road model over 20 years is estimated
at 38% and is very robust when compared with the opportunity cost of capital for Uganda
of 12%. The model produces an NPV of USH. 347.8 million and an NPV/K of 1.56.
Sensitivity analyses (Annex 4) show that the rate of return would decrease to 34% and
29% if benefits are down by 10% and 20% respectively. The EIRR will reduce to 34%
and 31% if costs are up by 10% and 20% respectively. A 2-year delay will reduce the
EIRR to 22%. It will take a simultaneous 20% reduction in benefits and 40% increase in
costs to reduce the EIRR to 18%, which is an unlikely scenario. When the Average Daily
Traffic (ADT) is reduced to only 5 vehicles a day, the EIRR is still robust at 33%. If
however, only 30% of the arable land were to be cultivated (Uganda national average is
30%, according to the PMA Report13), the EIRR will drop to 16%.
District Feeder Roads Prioritization
Based on the above model, each of the pre-screened roads submitted by 8 of the 10
districts present at a stakeholders workshop have been individually analysed and then
ranked in descending order of their NPV/K14 until the allocated kilometers for each
district is attained. The result of the analysis showing the ranking of prioritized roads is
given in Annex 5. Only those roads returning an EIRR equal to or greater than 12% are
retained for rehabilitation and included in the project costs. The EIRR of the individual
roads retained ranges from 14% to 54%.
4. Conclusion
13 Plan for Modernisation of Agriculture: Eradicating Poverty in Uganda, MAAIF and MFPED, 3 January,
2000, p.9 14 Where K is the initial capital investment.

10
The objective of the feeder road rehabilitation component is to provide all-weather and all-
year road access and to reduce agricultural input and output transport costs. Other benefits
include the derived transport operating cost savings accruing to non-agricultural traffic users
and the reduction in time for commuters compared to without project situation. These
objectives put together have enabled the analysis of a representative road rehabilitation
model, taken from a high altitude montane environment in the Southwestern Region of
Uganda. The investment package is computed by comparing total benefits accruing to an
improved road with total costs of road rehabilitation and assumed maintenance regimes
(routine and periodic). This methodology is then utilized to analyse all the shortlisted roads
submitted by each district. Those producing less than 12% economic rate of return are
eliminated from the investment basket. The qualifying roads are then ranked according to
their net present value-investment ratios and the investment package for each district is
determined by the a pre-determined allocated length of roads for rehabilitation. The roads
are included in descending order of their NPV/K until the threshold for that district is
attained.
This methodology has demonstrated that while the VOC method as applied to highways
(with large traffic volumes), or the combination of VOC and TTC may not generate
sufficient roads producing a rate of return over 12% due to their reliance on traffic volume,
the inclusion of a more important factor – the costs savings from producer surplus
transportation - will allow a majority of the roads to be analysed and included.
It is important to note that this analysis has been possible because, in the case of Uganda,
there is a good database, without which there could be some difficulties. The active
participation of the beneficiaries both in the pre-screening and in the provision of the data
requirement is an important factor for the successful application of the methodology.
Nonetheless, this methodology has been found useful and quite simplified and can easily be
adapted by Project Economists in the economic analysis and prioritization of rural feeder
roads to be included for rehabilitation under capital rationing. This approach is quite
practical and can be institutionalised. Where the database is poor, the understanding of the
methodology can also encourage the development economists to begin to build up the
necessary data requirement. It is important to note, however, that this methodology is not
required in justifying the project or programme as a whole, as that can be done by
aggregating the total project/programme incremental benefits against the corresponding
incremental costs. It is nonetheless, imperative, as earlier stated, when you have to make a
choice and prioritize the array of feeder roads for rehabilitation.

11
References:
African Development Fund, Appraisal Report, Uganda: Area-based Agricultural
Modernisation Programme, Feeder Road Rehabilitation Sub-component, OCDE, May,
2000.
Beenhakker, Henri L and Chammari Abdenrraouf (1979), Identification and Appraisal of
Rural Roads Projects, the World Bank Staff Working Paper, No. 362, October, 1979.
Dieter, Schelling and Liu, Zhi, “Designing a Rural Basic access Road Project – the case of
Andhra Pradesh, India”, the World Bank Infrastructure Notes No. RT-4, January, 2000.
International Fund for Agricultural Development, Appraisal Report, Uganda Area-based
Agricultural Modernisation Programme, December, 1999.
Liu, Zhi, “Economic Analysis of a Rural Basic Access Road Project – the case of Andhra
Pradesh, India”, the World Bank Infrastructure Notes No. RT-5, January, 2000.
Ojukwu, Chiji, The Economics of Force Account vs Contract System for Feeder Road
Improvement in the Agricultural Development Projects – A Cost-Effectiveness Analysis,
FACU Technical Bulletin, 1992.
Uganda Ministry of Local Government, Impact Assessment of Rural Feeder Roads
rehabilitation and Maintenance Programme, November, 1999.
Uganda Ministry of Works, Housing and Communication, Manual for Evaluating District
Roads,
Uganda Ministry of Works, Housing and Communication, Rural road Strategy Report,
AFRICON, 1999.
Uganda Ministry of Agriculture, Animal Industry and Fisheries, Plan for Modernisation of
Agriculture – Eradicating Poverty in Uganda, 3 January, 2000.
World Bank, Staff Appraisal Report Nigeria Multi-state Agricultural Development Project,
1986.

12
ANNEX 1:
GENERAL DATA REQUIRED FOR THE FEEDER ROAD MODEL COST-BENEFIT
ANALYSIS
These data are required for each road to be rehabilitated.
1. Name of Road
2. Initial Estimate of Road Rehabilitation Cost per km
3. Length of Road (km)
4. Maintenance Cost/km/yr perkm
5. Area served by Road (Zone of Road influence – ha) under production
6. Number of Agricultural Households (No.)
7. Types of major Crops Grown – With Project/Without Project; % grown per crop
8. Average journey to Local Market (km)
9. Yield/ha/year (per crop) – With Project/Without Project
10. Total Produce Hauled - aggregate in tons (5 x 9) (Assume 100% less wastage, if cash
crop and x% if food crop)/Without Project
11. Total Tonskm of Transport (10 x 8)/Without Project
Transport Costs (Cost of transporting I ton of produce to market)
12. Cost Bicycle (Without Project)
13. Bicycle (With Project – 50% Volume by System Assumed)
14. Average Cost Bicycle With Project
15. Savings per tonkm (12 -14)
16. Annual Savings (11x 15)
Other Costs
1. Periodic Maintenance Costs after every 5 years
2. Others – to decide as appropriate
Note that not all the data collected here may be used in the analysis but could be retained
as control.
13
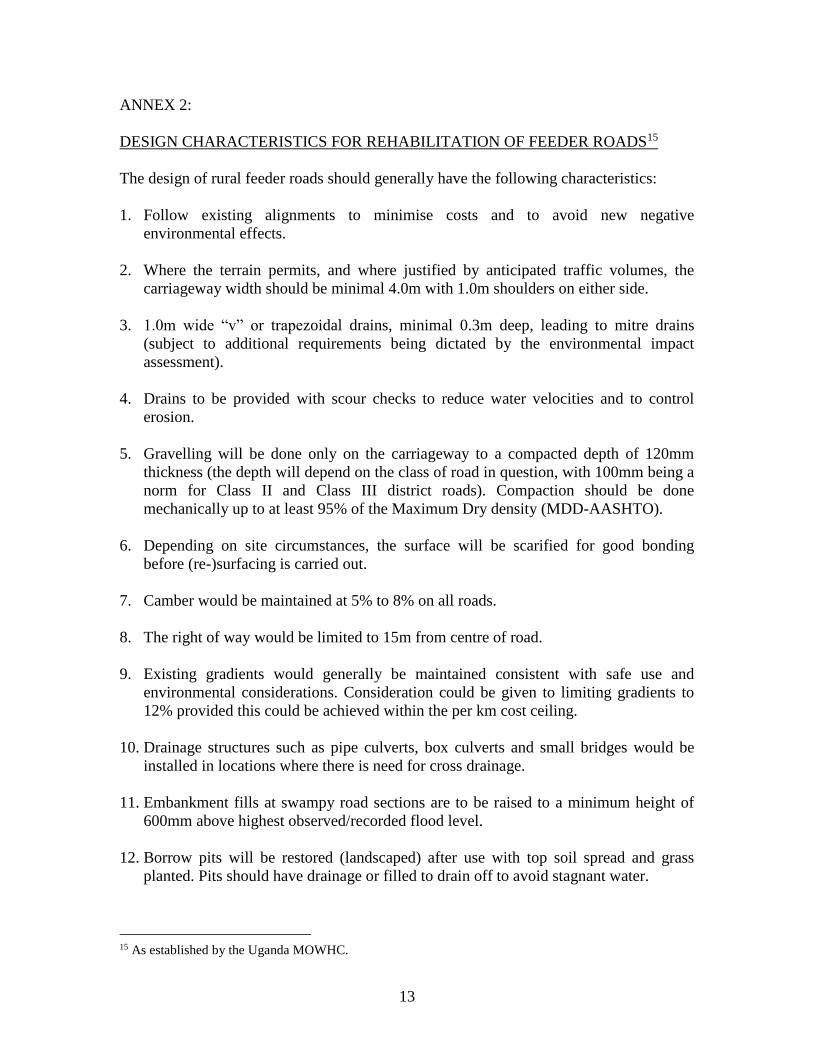
ANNEX 2:
DESIGN CHARACTERISTICS FOR REHABILITATION OF FEEDER ROADS15
The design of rural feeder roads should generally have the following characteristics:
1. Follow existing alignments to minimise costs and to avoid new negative
environmental effects.
2. Where the terrain permits, and where justified by anticipated traffic volumes, the
carriageway width should be minimal 4.0m with 1.0m shoulders on either side.
3. 1.0m wide “v” or trapezoidal drains, minimal 0.3m deep, leading to mitre drains
(subject to additional requirements being dictated by the environmental impact
assessment).
4. Drains to be provided with scour checks to reduce water velocities and to control
erosion.
5. Gravelling will be done only on the carriageway to a compacted depth of 120mm
thickness (the depth will depend on the class of road in question, with 100mm being a
norm for Class II and Class III district roads). Compaction should be done
mechanically up to at least 95% of the Maximum Dry density (MDD-AASHTO).
6. Depending on site circumstances, the surface will be scarified for good bonding
before (re-)surfacing is carried out.
7. Camber would be maintained at 5% to 8% on all roads.
8. The right of way would be limited to 15m from centre of road.
9. Existing gradients would generally be maintained consistent with safe use and
environmental considerations. Consideration could be given to limiting gradients to
12% provided this could be achieved within the per km cost ceiling.
10. Drainage structures such as pipe culverts, box culverts and small bridges would be
installed in locations where there is need for cross drainage.
11. Embankment fills at swampy road sections are to be raised to a minimum height of
600mm above highest observed/recorded flood level.
12. Borrow pits will be restored (landscaped) after use with top soil spread and grass
planted. Pits should have drainage or filled to drain off to avoid stagnant water.
15 As established by the Uganda MOWHC.

Annex 3: Spreadsheet CBA Analysis

15

16

ANNEX 5:
Ranking of Priority Roads – by District
1. BUSHENYI
Rank Link
No.
Name of Road Length
(Km)
EIRR
(%)
NPV
(USH.’000)
NPV/K
1
2
3
4
5
6
7
438
439
419
427
437
411
429
Kanuka - Butare
Bucuro - Rwankondo
Kitagata - Kasara - Kyarwera
Kakanju - Katunga - Kashasha
Rutoto - Ndangaro
Mitooma - Kabira
Kamurinda - Ryanmasya
5
6
20
7
8
10
13
54
52
50
50
48
47
45
286,016
329,513
1,019,654
359,338
388,500
475,660
568,366
2.57
2.47
2.30
2.30
2.18
2.14
1.96
Total Kilometres 69
2. KABALE
Rank Link
No.
Name of Road Length
(KM)
EIRR
(%)
NPV
(USH.’000)
NPV/K
1
2
3
4
5
9..?
9..?
937
912
927
Rugoma – Mucogo – Butambi
Muko – Kaara
Nfasha – Nyamiryango
Kabanyonyi – Kawereu – Maziba
Nyarutojo –Kitanga – Buhara
14
7
15
16
14
41
33
24
15
14
535,964
189,352
221,947
59,152
34,933
1.72
1.21
0.66
0.17
0.11
Total Length 66
3. KABAROLE
Rank Link
No.
Name of Road Length
(KM)
EIRR
(%)
NPV
(USH.’000)
NPV/K
1
2
3
4
5
1042
1015
1046
1002
1013
Nyabukara – Harugongo
Butebe – Mugusu
Rwimi – Kasenda
Nyarukoma – Kyakatwira
Butiti – Nyantungo
7.1
10.0
12.5
24.0
26.0
41
38
37
34
34
275,515
348,652
411,701
701,728
752,167
1.74
1.57
1.48
1.31
1.30
Total Length 79.6
4. KISORO
Rank Link
No.
Name of Road Length
(KM)
EIRR
(%)
NPV
(USH.’000)
NPV/K
1
2
3
4
5
1811
1822
1829
1815
1807
Kamonyi – Giseke – Nyakinama
Mwaro – Busengo – Kinanira
Nyarusiza – Rurembwe – Chanika
Gisorora – Mbonjero – Matinza
Mushungero – Rutaka – Mupaka
13
18
10
9.2
25
36
29
23
21
19
410,322
400,447
135,165
99,558
205,957
1.42
1.00
0.62
0.49
0.37
Total Length 75.2

18
5. MBARARA
Rank Link
No.
Name: From – To Length
(km)
EIRR
(%)
NPV
(USH.’000)
NPV/K
1
2
3
4
2760
2749
2722
2709
Nyakigera - Omukatoma
Nyamukana - Byanamira
Ruhamba - Bwengure
Kaberebere - Kyamiyonga
15
30
10
22
49
47
42
39
752,022
1,409,247
406,551
657,968
2.25
2.11
1.83
1.60
Total Length 77
6. NTUNGAMO
Rank Link
No.
Name: From – To Length
(km)
EIRR
(%)
NPV
(USH.’000)
NPV/K
1
2
3
4
5
3957
3901
3954
3925
3965
Rwentobo – Kaina – Rubaare
Butare – Buraro
Kacerere – Katungamo – Kyempene
Kagarama – Rukarango – Rwamabondo
Nombe – Rwemengo – Nyabihoko
13.7
9.5
14.0
14.3
16.0
41
36
32
19
18
530,431
300,948
355,165
126,936
107,089
1.74
1.42
1.14
0.40
0.30
Total Length 67.5
7. SEMBABULE
Rank Link
No.
Name: From – To Length
(km)
EIRR
(%)
NPV
(USH.’000)
NPV/K
1
3
2
4
5
2440
2420
2442
2427
2443
Mitete – Kyebongotoko
Bituntu – Kikoma
Lwebitakuli – Kitoro
Lwemiyago – Nabitanga
Lwebitakuli – Kisindi - Katwe
21
12
10
14
14
54
40
42
38
35
1,231,519
455,134
402,417
482,532
428,026
2.63
1.70
1.81
1.55
1.37
Total Length 71
8. RUKUNGIRI
Rank Link
No.
Name: From – To Length
(km)
EIRR
(%)
NPV
(USH.’000)
NPV/K
1
2
3
4
5
3614
3633
3622
3610
3620
Kebisoni – Mabanga – Kihanga
Katete – Kyeiyanga
Kihihi – Ishasha Junction
Bigongozo – Kerere
Rwerere – Bugangar
14.3
13
10
16
16
47
35
32
30
30
672,951
396,666
259,283
381,278
370,315
2.11
1.36
1.16
1.07
1.04
Total Length 69.3
UN-PRIORITIZED & UNANALYSED ROADS
9. BUNDIBUGYO 63 km
10. KASESE 63 km
TOTAL ROAD LENGTH = 700.6 KM