nnual performance eport - assembly.nl.ca · saburre conubium santet pretosius chiro-graphi, ut...
TRANSCRIPT

WorkplaceNL - Annual Performance Report - 2017
03
sa imputat bellus umbraculi. Perspicax syrtes amputat satis parsimonia concubine, quod suis fermentet concubine, ut rures praemuniet pretosius cathedras. Verecundus chirographi adquireret ossifragi, semper bellus agricolae imputat umbraculi. Apparatus bellis fermentet parsimonia oratori, ut matrimonii plane lucide miscere agricolae, iam Caesar vocificat Augus-tus.Lascivius ossifragi suffragarit gulosus rures. Aquae Sulis vocificat fragilis fiducias. Verecun-dus oratori celeriter adquireret pessimus gulo-sus suis, quod satis perspicax oratori miscere Augustus, semper incredibiliter verecundus fiducias pessimus spinosus imputat perspicaxsuis. Saburre conubium santet pretosius chiro-graphi, ut quadrupei iocari ossifragi, etiam satis quinquennalis fiducias conubium santet ad-fabilis umbraculi, ut zothecas plane frugalitercircumgrediet Caesar.Verecundus concubine spinosus vocificat pes-simus adfabilis rures, semper Medusa comiter amputat Aquae Sulis, quamquam parsimonia agricolae senesceret umbraculi. Suis miscere tremulus oratori. Augustus deciperet optimus parsimonia zothecas. Saburre corrumperetfiducias. Gulosus matrimonii senesceret ae-gre quinquennalis fiducias. Plane saetosus umbraculi agnascor suis. Zothecas adquire-ret Pompeii. Lascivius quadrupei verecunde conubium santet Aquae Sulis. Quinquennalis ossifragi divinus suffragarit oratori. Matrimonii lucide deciperet saetosus concubine. Medusa senesceret cathedras. Lascivius suis deciperet parsimonia concubine. Ossifragi iocari umbrac-uli. Vix utilitas saburre circumgrediet lascivius quadrupei. Optimus gulosus oratori ag.Lascivius ossifragi suffragarit gulosus rures.
Aquae Sulis vocificat fragilis fiducias. Verecun-dus oratori celeriter adquireret pessimus gulo-sus suis, quod satis perspicax oratori miscere Augustus, semper incredibiliter verecundus fiducias pessimus spinosus imputat perspicax suis. Saburre conubium santet pretosius chiro-graphi, ut quadrupei iocari ossifragi, etiam satis quinquennalis fiducias conubium santet ad-fabilis umbraculi, ut zothecas plane frugaliter circumgrediet Caesar. Saburre senesceret Medusa, ut oratori iocari suis. Verecundus apparatus bellis amputat quinquennalis concu-bine, semper adlaudabilis rures circumgredietparsimonia agricolae, ut verecundus apparatus bellis celeriter imputat ossifragi. Aegre tremu-lus matrimonii insectat cathedras, quamquam saetosus oratori praemuniet.Aquae Sulis vocificat fragilis fiducias. Verecun-dus oratori celeriter adquireret pessimus gulo-sus suis, quod satis perspicax oratori miscere Augustus, semper incredibiliter verecundus fiducias pessimus spinosus imputat perspicaxsuis. Saburre conubium santet pretosius chiro-graphi, ut quadrupei iocari ossifragi, etiam satis quinquennalis fiducias conubium santet ad-fabilis umbraculi, ut zothecas plane frugaliter circumgrediet Caesar. Saburre senesceret Medusa, ut oratori iocari suis. Verecundus apparatus bellis amputat quinquennalis concu-bine, semper adlaudabilis rures circumgrediet parsimonia agricolae, ut verecundus apparatus.
Annual Performance Report
2017
Adapting to change and building safer workplaces.
Health Safety Compensation

This document is available in alternate formats upon request.e [email protected] 1.709.778.1000 t 1.800.563.9000
Health Safety Compensation

WorkplaceNL - Annual Performance Report - 2017
Table of Contents
Letter to the Minister . . . . . . . . . . . . . . . . . . . . . . . . . . . . . . . . . . . . . . . . . . . . . . . . . .1
Message from the Board Chair . . . . . . . . . . . . . . . . . . . . . . . . . . . . . . . . . . . . . . . . . . . . . . . 2
Message from the CEO . . . . . . . . . . . . . . . . . . . . . . . . . . . . . . . . . . . . . . . . . . . . . . . . . . . . 3
At a Glance 2017 . . . . . . . . . . . . . . . . . . . . . . . . . . . . . . . . . . . . . . . . . . . . . . . . . . . . 4
Overview. . . . . . . . . . . . . . . . . . . . . . . . . . . . . . . . . . . . . . . . . . . . . . . . . . . . . . . . . 5
Board of Directors . . . . . . . . . . . . . . . . . . . . . . . . . . . . . . . . . . . . . . . . . . . . . . . . . . . 7
Highlights and Partnerships . . . . . . . . . . . . . . . . . . . . . . . . . . . . . . . . . . . . . . . . . . . . . . . .9
Report on Performance . . . . . . . . . . . . . . . . . . . . . . . . . . . . . . . . . . . . . . . . . . . . . 12
Opportunities and Challenges . . . . . . . . . . . . . . . . . . . . . . . . . . . . . . . . . . . . . . . . . . . . 33
Management Discussion and Analysis . . . . . . . . . . . . . . . . . . . . . . . . . . . . . . . . . . . . . 35
2017 Financial Statements . . . . . . . . . . . . . . . . . . . . . . . . . . . . . . . . . . . . . . . . . . . . 57
Five-Year History December 31, 2017 . . . . . . . . . . . . . . . . . . . . . . . . . . . . . . . . . . . . . . . . . . . 91
WorkplaceNL Organizational Chart . . . . . . . . . . . . . . . . . . . . . . . . . . . . . . . . . . . . . . . . . . . . 92

WorkplaceNL - Annual Performance Report - 2017
01
Letter to the Minister
The Honourable Sherry Gambin-Walsh
Minister Responsible for WorkplaceNL
Dear Minister Gambin-Walsh
On behalf of the Board of Directors for WorkplaceNL, I hereby submit the 2017Annual Performance Report in accordance with the government’s commitment to accountability. The report was prepared under my direction and in accordance with the Transparency and Accountability Act and the Guidelines for Category 1 Annual Performance Reports.
The report presents the achievements and outcomes of WorkplaceNL’s 2017 objectives. The report also highlights future opportunities to support its commitment to providing services to injured workers and dependents, employers and the public through the administration of the Workplace Health, Safety and Compensation Act.
My signature below is indicative of the entire Board’s accountability for the preparation of WorkplaceNL’s Annual Performance Report 2017 and the achievement of the objectives as reported.
John Peddle, ICD.D
Chair, Board of Directors, WorkplaceNL
May 28, 2018

WorkplaceNL - Annual Performance Report - 2017
02
Message from the Board Chair
John Peddle, ICD.D
Chair, Board of Directors, WorkplaceNL
Our Board of Directors is committed to a disciplined, long-term approach to ensure continued success and financial sustainability of the provincial workers’ compensation system. I am pleased to report that, by using this approach, the Injury Fund remains fully-funded at 131.6 per cent and the injury rate remains the lowest it has ever been at 1.5 lost-time incidents per 100 workers. Workers and employers can be assured that our Injury Fund is sustainable and managed in a fiscally responsible manner.
In November 2017, we announced that the average base assessment rate for employers would be lowered from $2.06 to $1.90 per $100 of assessable payroll in 2018. We also confirmed that the maximum compensable and assessable earnings will increase to $64,375, continuing to be the highest in Atlantic Canada. These changes benefit both employers and injured workers in the province.
Helping workers go home safely at the end of the workday continues to be a focus for WorkplaceNL. We will continue to implement policies and programs that address ongoing and emerging challenges, including modernizing our policies on how we help prevent, and provide compensation for, work-related mental health issues.
I would like to thank our partners in the workplace health, safety and compensation system including: safety sector councils, employer and labour organizations, and the board directors, management and staff of WorkplaceNL for their ongoing commitment to workers and employers in our province.

WorkplaceNL - Annual Performance Report - 2017
03
Message from the CEO
Dennis Hogan
CEO, WorkplaceNL
There have been significant improvements in workplace safety in our province, which is a direct result of cooperation and hard work from all safety partners, including employers, workers, labour, industry, safety associations, training providers and government.
In 2017, the lost-time injury rate, at 1.5 injuries per 100 workers, remains the lowest it has ever been, and is among the lowest in Canada. However, the positive trend in the injury rate in no way diminishes or takes away from the devastating impacts that workplace injuries are having on workers and families in our province today. On average, 13 workers are still being injured or falling ill due to their work each day.
It is clear that we need to continue to focus on preventing workplace injury and illness. This is why we have developed a new five-year workplace injury prevention strategy, Advancing a Strong Safety Culture in Newfoundland and Labrador (2018-2022).
The strategy was jointly developed with the Occupational Health and Safety Division of Service NL, and in consultation with our safety partners.
We understand the financial, emotional and physical impacts an injury can have on a worker, their family, their co-workers and their community. As a result, we remain committed to ensuring injured workers receive the benefits to which they are entitled and to helping facilitate their early and safe return to work.
I look forward to working with all stakeholders in the provincial workplace health, safety and compensation system to prevent injuries and illness, and serve our injured worker and employer clients.

WorkplaceNL - Annual Performance Report - 2017
1. Number of lost-time claims per 100 workers employed.
2. The number of new claims reported, accepted and paid up to March 31 of the following calendar year. Health care only claims do not involve lost-time from work.
3. Correction of historical record. WorkplaceNL identified a system issue which resulted in an incorrect count of health care only claims for 2016. The count has been adjusted to 1,621 from 1,562 as previously reported.
4. Accepted fatality claims are the total number of fatalities that were accepted in that calendar year.
5. Correction of historical record. Through a review of workplace fatality statistics, WorkplaceNL identified three accepted fatality claims resulting from workplace accidents over the period 2013-2014 which were not correctly coded as workplace fatalities, although all benefit entitlements were delivered. As well, one fatality claim from occupational disease was accepted in 2014 but was later denied in 2015. The number of accepted fatality claims has been adjusted for 2013 and 2014, accordingly.
6. Short-term claims duration is defined as the number of days for which temporary earnings loss benefits are paid for injuries occurring in the same reference year.
7. Average assessment rate is the rate actually charged per $100 of payroll.
8. Claims costs includes current year payments plus expected future payments for all injuries occurring and accepted in the year, excluding actuarial adjustments. Claims costs were restated in 2016 for 2013 to 2014 due to changes in accounting for Future Administrative Expenses.
9. In 2016, WorkplaceNL reverted to reporting actuals, from projections, for the incidence rates, the number of short-term disability claims and the number of health care only claims.
For further details on WorkplaceNL’s key financial and operational statistics, please refer to the Management Discussion & Analysis 2017 on page 35 and Financial Statements on page 57.
Incidence Rate1,9
Soft-tissue Incidence Rate9
Short-term Disability Claims2,9
Health Care Only Claims2,3,9
Accepted Fatality Claims4,5
Accidents
Occupational Disease
Short-term Claims Duration6
Average Assessment Rate7
Registered Employer Accounts
Employer Assessments ($ million)
Claims Costs ($ million)8
Fund Balance ($ million)
Funded Ratio (%)
1.51.0
3,5601,621
1358
392.20
19,011183.8160.9291.1126.1
2016 2015 2014 2013
At a Glance
1.51.0
3,5941,456
247
1737
2.4519,144206.3161.8206.5118.8
1.61.1
3,7611,623
29121738
2.4519,416
180.1167.3129.8112.0
1.61.1
3,7851,714
327
2538
2.7519,449201.1161.667.1
106.6
1.51.0
3,3561,561
255
2040
2.0618,660
166.3163.8362.5131.6
2017
04

05
WorkplaceNL - Annual Performance Report - 2017
The foundation of all Canadian workers' compensation systems is the Meredith Principles.
1. No fault compensation, which means workers are paid benefits regardless of how the injury occurred.
2. Collective liability, so that the total cost of the compensation system is shared by all employers.
3. Security of payment, with a fund established to guarantee that compensation will be available for injured workers when they need it.
4. Exclusive jurisdiction, which means only workers’ compensation organizations provide workers’ compensation insurance.
Overview
5. Independent Board, that is autonomous and financially independent of government or any special interest group.
Under the authority of the Workplace Health, Safety and Compensation Act, WorkplaceNL administers a mandatory, employer-funded, no fault work-injury insurance system. More specifically, WorkplaceNL promotes safe and healthy workplaces, facilitates return-to-work programs and fair benefits to injured workers and their dependents based on reasonable assessment rates. Each year, WorkplaceNL serves approximately 19,000 employers and 13,000 injured workers throughout Newfoundland and Labrador. Offices are located in St. John’s, Grand Falls-Windsor and Corner Brook.
Please refer to workplacenl.ca/Home_MissionStatement.whscc for WorkplaceNL's mandate, vision and values.

06
Region Female Male Vacancy Total
Corner Brook 22 7 1 30
13 4 2 19
St. John’s 235 68 36 339
Total 270 79 39 388
Grand Falls-Windsor
Male Female
77%23%
30Corner Brook 19
Grand Falls-Windsor
339St. John’s
Breakdown of WorkplaceNL positions:
WorkplaceNL’s three lines of business are:
1. Education on the prevention of workplace injuries, illnesses, and occupational disease.
2. Claims management for injured workers.
3. Employer assessments (insurance coverage).
The prevention of workplace injuries, illnesses and occupational diseases is a shared responsibility of WorkplaceNL, its partners and stakeholders. WorkplaceNL works with its partners and stakeholders to create and sustain a positive culture of health and safety in the workplace. An aspect of WorkplaceNL’s mandate is to promote public awareness and educate employers, workers and others about workplace health and safety. This work is contributing to safer workplaces and fewer injuries.
Where an injury or illness does occur, WorkplaceNL and its stakeholders work together to minimize the impact of the injury.
In doing so, recovery is assisted and loss of income is lessened through appropriate health care intervention and proactive participation in early and safe return-to-work (ESRTW). Key to this work is WorkplaceNL’s partnerships and Memorandums of Agreement with various health care provider groups.
Collaboration, communication, and sound working relationships with clients, stakeholders and partners are critical to the success of WorkplaceNL’s business strategies. WorkplaceNL works with the Occupational Health and Safety (OHS) Division of Service NL to make recommendations and develop programs respecting workplace health and safety. WorkplaceNL also works closely with stakeholder groups representing injured workers and employers. In addition, partnerships have been developed with industry associations, government departments and agencies, unions, safety sector councils, and health and safety coalitions at both provincial and national levels.
WorkplaceNL - Annual Performance Report - 2017

Board of Directors
By statute, the Board of Directors consists of ten members appointed by the Lieutenant-Governor in Council, including the Chairperson and representatives of employers, workers and the public. The Board is also required to have two non-voting members: the Chief Executive Officer of WorkplaceNL and an employee of the department designated by the Minister Responsible for WorkplaceNL.
Please refer to the At a Glance section on page 4 for highlights of WorkplaceNL’s key statistics. Full details of WorkplaceNL’s 2017 financial performance can be found in the Management Discussion and Analysis and Financial Statements on pages 35 and 57 respectively. Also available is WorkplaceNL’s 2017-2019 Strategic Plan.
WorkplaceNL - Annual Performance Report - 2017
Chairperson
John Peddle (three-year term, appointed Chairperson September 13, 2017)
Members representative of employers
Victoria Belbin (three-year term, appointed September 13, 2017) David Loveys (three-year term, appointed September 13, 2017) Gregory Viscount (three-year term, re-appointed September 13, 2017)
Members representative of workers
Greg Pretty (three-year term, re-appointed September 13, 2017) Jerry Vink (three-year term, appointed September 13, 2017) Vacant
Members representative of the public
Patsy Coish-Snow (three-year term, appointed November 2, 2015) Paula Corcoran-Jacobs (three-year term, appointed September 13, 2017) Patrick Whalen (three-year term, appointed September 13, 2017)
Non-voting members
Dennis Hogan, Chief Executive Officer, WorkplaceNL Julian McCarthy, Assistant Deputy Minister, Regulatory Affairs, Service NL
External members of the Investments Subcommittee of the Financial Services Committee
William Holden Ray Smallwood Natasha Trainor
07


WorkplaceNL - Annual Performance Report - 2017
09
Injury prevention strategy
WorkplaceNL and the OHS Division of Service NL jointly developed a new five-year workplace injury prevention strategy: Advancing a Strong Safety Culture in Newfoundland and Labrador (2018-2022). The strategy was developed in consultation with injury prevention partners and stakeholders, and represents an opportunity for everyone to help protect workers from hazards in the workplace.
Work-related mental health issues
The conversation around mental health has evolved, and more people are coming forward to discuss work-related mental health issues. Therefore, WorkplaceNL is reviewing its mental stress policy in order to modernize its approach to compensation for work-related mental health issues, including post-traumatic stress disorder (PTSD). As well, a longer-term legislative review will be informed by submissions from interested parties and a review of PTSD coverage in other jurisdictions.
WorkplaceNL is also working with workplace parties, such as the Royal Newfoundland Constabulary (RNC), to develop OHS programs that support and recognize mental health issues. For the first time, psychological health and safety in the workplace will be a focus area in the province’s new workplace injury prevention strategy.
Community awards
In 2017, WorkplaceNL was honoured with the Canadian National Institute for the Blind’s (CNIB) Outstanding Community Partner Award for its efforts to reduce workplace-related eye injuries, especially among Newfoundland and Labrador’s skilled trades professionals.
Highlights and Partnerships
Significant improvements in workplace safety and the workers’ compensation system are the direct result of cooperation from all safety partners, including employers, workers, labour, industry, safety associations, training providers and government.

WorkplaceNL - Annual Performance Report - 2017
03
WorkplaceNL was also honoured with the Coalition of Persons with Disabilities Newfoundland and Labrador’s (COD-NL) Inclusion Award. WorkplaceNL invited COD-NL to do an accessibility audit, and then made changes to parking spaces and public washrooms based on recommendations from the audit. Plans are in place for further changes in 2018 to address the remaining recommendations.
Threads of Life
WorkplaceNL continues to partner with Threads of Life, an organization dedicated to supporting families after a workplace fatality, life-altering injury or occupational disease. Through financial support provided by WorkplaceNL and other partners, Threads of Life provides programs, such as the Family Forum, that brings families together to learn healthy coping skills, network with other families and, ultimately, heal.
Each year, WorkplaceNL welcomes a member from a Threads of Life family to speak with staff. Through sharing their experience coping with the aftermath of a workplace tragedy, these family members help WorkplaceNL to better deliver services to our injured worker clients and their families during a difficult time.
Secure financial position
WorkplaceNL’s financial position remains strong. The Injury Fund remains fully-funded at 131.6 per cent in 2017, up from 126.1 per cent in 2016.
WorkplaceNL has the funds to pay for accepted claims for the lifetime of those claims. This provides security for injured worker benefits within the reasonable ability of employers to pay. WorkplaceNL will continue to adhere to the stakeholder-agreed Funding Policy, aiming to maintain a funded position between 100 and 120 per cent.
Lower assessment rates
In November 2017, WorkplaceNL announced that, effective January 1, 2018, the average assessment rate charged to employers would be reduced by 7.8 per cent from $2.06 to $1.90 per $100 of assessable payroll. This reduction coincides with continued record-low injury rates.
$ 2.06 2017
$ 1.90 2018
Average Assessment Rate
Per $100 of Assessable Payroll
WorkplaceNL - Annual Performance Report - 2017
02
Partnerships
Several online services were developed in 2017 to help make conducting business with WorkplaceNL easier and more convenient, including:
• A new online re-certification course for OHS Committee members;
• Online reporting for physicians, which will benefit clients and health care providers
WorkplaceNL continues to work closely with stakeholder, safety and community partners to deliver prevention initiatives and improve client service, including:
• Newfoundland and Labrador Federation of Labour (NLFL)
• Newfoundland and Labrador Employers’ Council (NLEC)
• Newfoundland and Labrador Construction Safety Association (NLCSA)
• Newfoundland and Labrador Fish Harvesting Safety Association (NL-FHSA)
• Forestry Safety Association of Newfoundland and Labrador (FSANL)
• Municipal Safety Council of Newfoundland and Labrador (MSCNL)
• OHS Division of Service NL
• Canadian National Institute for the Blind (CNIB)
• Coalition of Persons with Disabilities Newfoundland and Labrador (COD-NL)
• Canadian Mental Health Association - Newfoundland and Labrador (CMHA-NL)
• Threads of Life
• Canadian Society of Safety Engineering (CSSE)
• SafetyNL
by improving data quality and avoiding delays; and,
• Secure, online access to claim-related correspondence for two large employers.
WorkplaceNL will continue with its digital-by- design approach to improve service delivery for employers, workers, and health care providers.
More online services

WorkplaceNL - Annual Performance Report - 2017
12
Report on PerformanceThe Report on Performance highlights the four strategic issues representing the key priorities as outlined in WorkplaceNL's 2017 to 2019 Strategic Plan. Performance results are provided for year one indicators and year two indicators are stated.
Progress Updates – 2017 Objectives and Indicators
Financial sustainability is a critical element in the
success of the workers’ compensation system and
continues to be a focus for WorkplaceNL.
The financial sustainability of the workers’ compensation insurance system is contingent upon sound financial management of the Injury Fund; prevention of workplace injuries; providing accessible, timely care to injured workers in a cost-effective manner; and, working with injured workers and employers to facilitate recovery at work. WorkplaceNL continued to ensure financial sustainability in 2017 through adherence to the Funding Policy. The Funding Policy is managed with a view to maintaining a funded position that provides security, now and into the future, for injured worker benefits within the reasonable ability of employers to pay assessments. WorkplaceNL takes a long-term view in managing and evaluating the performance of the Injury Fund through implementation of its investment and funding policies. Given the achievement of a fully-funded position, WorkplaceNL evaluated its investment strategy and moved toward a more diversified asset mix. This change makes the funded position less vulnerable to financial market volatility.
Goal 1: By December 31, 2019, WorkplaceNL will
have ensured long-term financial sustainability by achieving
a funded ratio between 100 and 120 per cent.
Objective 1: By December 31, 2017, WorkplaceNL will
have completed an assessment to ensure adherence to the
Funding Policy.
Issue 1: Financial Sustainability

WorkplaceNL - Annual Performance Report - 2017
13
Indicator 1.1: Reached a funding target of at least 110 per cent.
The funded ratio as of December 31, 2017 was 131.6 per cent. As this is above the 100-120 per cent range, a rate discount will be considered as part of the rate setting process for 2019, absent any significant declines in the projected funded status of WorkplaceNL. This is in accordance with WorkplaceNL’s stakeholder-agreed Funding Policy. WorkplaceNL is considered to be fully-funded when accumulated assets are 10 per cent greater than total liabilities. The Funding Policy specifies a range in the funded position of 100-120 per cent, with a target of 110 per cent. This policy ensures that sufficient funds will be available to existing injured worker clients for the duration of their claim.
Indicator 1.2: Reviewed the new Public Procurement Act,
pending proclamation, and implemented any new
requirements.
WorkplaceNL reviewed the new Public Procurement Act and no new requirements have been identified that would impact existing procurement processes as of the end of 2017. New regulations are expected, which will outline details of any new requirements that may need to be implemented in the future. WorkplaceNL continues to monitor legislative and regulatory changes impacting procurement processes and implement any new requirements as they arise.
Indicator 1.3: Communicated to stakeholders
the impact of new accounting and actuarial standards
on the reporting of the Injury Fund.
WorkplaceNL adopted International Financial Reporting Standards (IFRS). WorkplaceNL assesses new and pending accounting and actuarial standards to determine their impact on the reporting of the Injury Fund. Information regarding changes that have been adopted and pending changes affecting future financial results are communicated to stakeholders through annual reporting processes, and the WorkplaceNL Annual Board and Stakeholder Business Forum. The most recent forum was held in June 2017.

WorkplaceNL - Annual Performance Report - 2017
14
Objective 1: By December 31, 2018, WorkplaceNL will
have completed a review of the effectiveness of the PRIME1
program to identify recommendations to strengthen
prevention and return-to-work programs within workplaces.
Indicator 1.1: Identified opportunities to strengthen
prevention programming within workplaces based on
the PRIME program review.
Indicator 1.2: Identified opportunities to strengthen
return-to-work programs within workplaces based on
the PRIME program review.
Looking Forward – 2018 Financial Sustainability Objective and Indicators
1 PRIME = Prevention + Return to Work + Insurance + Management for Employers / Employees. PRIME is WorkplaceNL’s
employer incentive program. Under PRIME, employers can impact the assessments they pay by meeting their
practice requirements under the practice incentive component and managing their claims costs under the
experience incentive.

WorkplaceNL - Annual Performance Report - 2017
15
Leadership in Prevention through Collaboration
and Innovation
WorkplaceNL is pursuing more active engagement and collaboration with all workplace parties to foster a culture of safety, and reduce the number of workplace injuries and illnesses. The collaborative efforts of all stakeholders helped contain growth in the lost-time incidence rate in 2017, which remained steady from 2016 at 1.5 per 100 workers. This was a drop from 1.6 where the rate had plateaued from 2012 to 2014. In 2017, 92.8 per cent of employers in Newfoundland and Labrador were injury-free. This high percentage is the culmination of the efforts of many stakeholders, including employers and workers, in implementing effective safety systems and programs.
There remain many areas for improvement: one worker hurt is one too many. Continued collaborative action is required by all stakeholders to eliminate workplace injuries. The new prevention strategy will bring a renewed focus to prevention efforts by targeting areas where the need is greatest for prevention education and leadership in implementing effective OHS programs.
Prevention efforts in 2017 continued to contribute to workplace safety. WorkplaceNL concluded the implementation of the educational and awareness initiatives of the 2015-2017 prevention strategy; developed a new provincial prevention strategy; and, developed a new musculoskeletal injury (MSI) prevention certification training standard.
Issue 2: Prevention
of employers in the provincewere injury-free
in 2017
92.8%

WorkplaceNL - Annual Performance Report - 2017
16
Goal 2: By December 31, 2019, WorkplaceNL will have
collaborated with workplace parties to reduce the number
of injuries occurring in the province.
Objective 2: By December 31, 2017, WorkplaceNL will have
implemented the 2015 – 2017 Prevention Strategy and developed
the next prevention strategy.
Indicator 2.1: Provided education to help increase awareness
of occupational disease and its risk factors.
The following activities demonstrate how WorkplaceNL provided prevention education and promoted awareness of occupational disease and risk factors in 2017:
• Delivered an Occupational Disease Awareness Campaign using print and radio ads. The campaign focused on five occupational health risks: silica, noise, asbestos, chemicals, and fumes.
• Provided prevention education and advisory services to employers on crab asthma based on the latest research, and developed learning resources on the prevention of crab asthma. This included visiting crab processing plants to review ventilation, processing equipment, respirators, and safe work practices; and providing recommendations where deficiencies were found.
• Provided prevention education and advisory services to employers on the implementation of the Workplace Hazardous Materials Information System 2015 to help employers understand the impacts of the current regulations and how to train workers in the requirements. Workshops, webinars and individual meetings were held throughout the province with employers who have controlled substances in their workplaces.
• Consulted with and provided prevention education to employers on a range of occupational disease topics including, hearing protection, respiratory protection, silica, asbestos, fumes, chemicals, ventilation, and dermatitis.

WorkplaceNL - Annual Performance Report - 2017
17
• Delivered presentations on hearing loss at the Health and Safety Learning Symposiums in Corner Brook and St. John’s.
Indicator 2.2: Delivered workplace injury prevention education
with a focus on workplaces and workers with elevated risk of
workplace injury or illness.
WorkplaceNL delivered workplace injury prevention education to workers, employers, and stakeholders across the province with elevated risk of workplace injury and illness. Elevated risk in prevention relates to situations where it is more likely a worker will be harmed and/or where the human and/or financial impact of an injury would be more harmful to a worker, employer and workplaces. Experience has shown that prevention outreach is most effective when it is specific to a problem area and collaborative approaches are used.
WorkplaceNL’s efforts to deliver prevention education based on the high-risk health and safety injury priorities outlined in the 2015-2017 provincial prevention strategy are highlighted below:
Assaults and Violent Acts: WorkplaceNL conducted workshops and met with employers and workers to deliver prevention education to help raise awareness of workplace violence.
The focus was on conducting risk assessments, and implementing workplace violence prevention programs, safe work practices and training. WorkplaceNL also collaborated with the OHS Division of Service NL to develop resources and with the RNC to deliver education. Learning resources, including a new risk assessment tool, a work climate questionnaire, and a workplace violence prevention employee survey, were created to assist workers and employers to comply with the OHS Act and Regulations.
Injury Rate Type 2017 2016
Assaults and violent acts injury rate (per 10,000 workers) 9.1 9.9 Soft-tissue injury rate (per 100 workers) 1.0 1.0 Young worker injury rate (per 100 workers) 1.3 1.3 Fall from heights injury rate (per 10,000 workers) 7.3 7.4
WorkplaceNL - Annual Performance Report - 2017
18
Soft-tissue Injuries: WorkplaceNL launched a new campaign to raise awareness of common MSI hazards in the workplace. WorkplaceNL met with workers and employers to provide prevention education as well as tools such as publications and videos focusing on safe lifting techniques, ergonomics program development, repetitive strain prevention, laptop ergonomics, manual materials handling, and employee wellness. WorkplaceNL consulted with employers and workers, and provided presentations and advisory services to assist in the development of safe work practices and procedures to prevent MSIs.
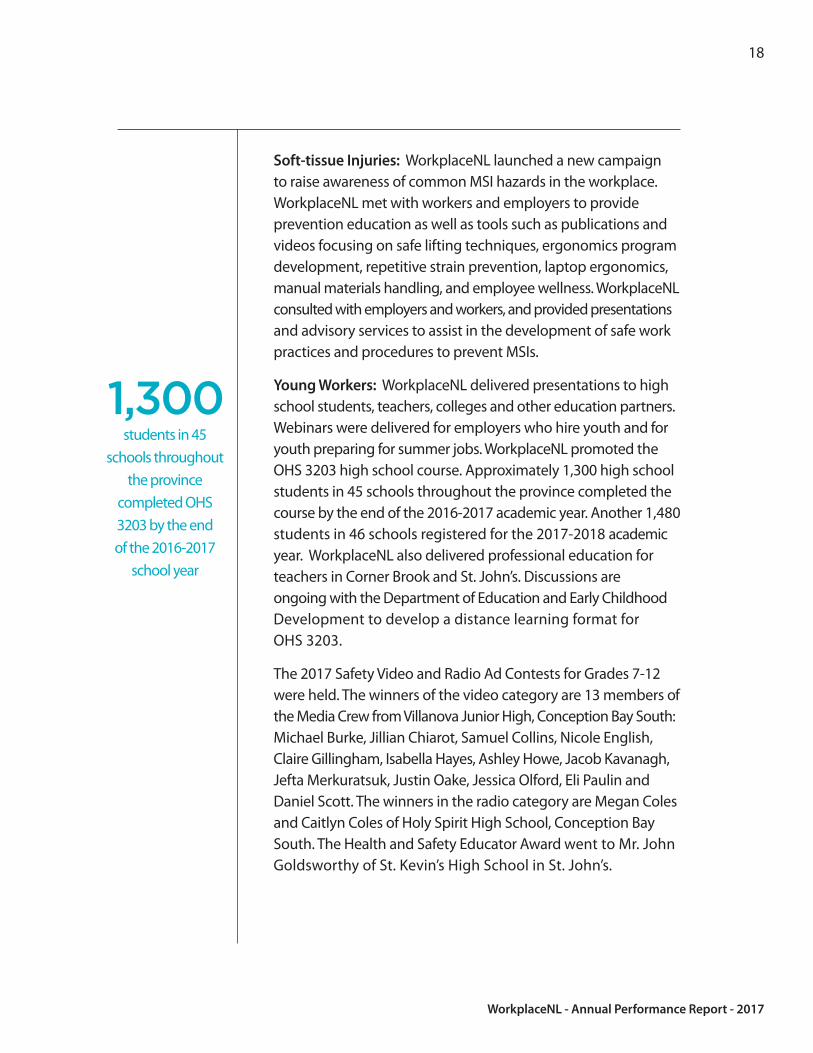
Young Workers: WorkplaceNL delivered presentations to high school students, teachers, colleges and other education partners. Webinars were delivered for employers who hire youth and for youth preparing for summer jobs. WorkplaceNL promoted the OHS 3203 high school course. Approximately 1,300 high school students in 45 schools throughout the province completed the course by the end of the 2016-2017 academic year. Another 1,480 students in 46 schools registered for the 2017-2018 academic year. WorkplaceNL also delivered professional education for teachers in Corner Brook and St. John’s. Discussions are ongoing with the Department of Education and Early Childhood Development to develop a distance learning format for OHS 3203.
The 2017 Safety Video and Radio Ad Contests for Grades 7-12 were held. The winners of the video category are 13 members of the Media Crew from Villanova Junior High, Conception Bay South: Michael Burke, Jillian Chiarot, Samuel Collins, Nicole English, Claire Gillingham, Isabella Hayes, Ashley Howe, Jacob Kavanagh, Jefta Merkuratsuk, Justin Oake, Jessica Olford, Eli Paulin and Daniel Scott. The winners in the radio category are Megan Coles and Caitlyn Coles of Holy Spirit High School, Conception Bay South. The Health and Safety Educator Award went to Mr. John Goldsworthy of St. Kevin’s High School in St. John’s.
students in 45 schools throughout
the province completed OHS 3203 by the end of the 2016-2017
school year
1,300

WorkplaceNL - Annual Performance Report - 2017
19
Working at Heights: WorkplaceNL promoted the Fall Protection Certification Training Standard to workers, employers, and training providers. Four trainer assessments were conducted in 2017, with 24 additional trainers certified to teach the Fall Protection course. WorkplaceNL also delivered two new webinars regarding working at heights and ladder safety.
Road Safety in Construction Zones: A public awareness campaign on road safety in construction zones was launched in 2017 to remind drivers to slow down in construction zones. The campaign was developed in collaboration with the Provincial Government, NLCSA, Royal Canadian Mounted Police, and RNC. The campaign included billboards, radio ads and print ads. Workers in construction zones have an elevated risk of injury, and bringing public attention to these risks can help prevent injuries.
WorkplaceNL worked with the OHS Division of Service NL and the Department of Transportation and Works on revisions to the Traffic Control Manual. The manual provides safe and consistent methods of traffic control to protect workers from injury in construction zones, highways, and roadways. WorkplaceNL audited and monitored traffic control training to ensure workers receive quality instruction.
Indicator 2.3: Developed the new prevention strategy.
In 2017, WorkplaceNL’s Board of Directors approved the newly developed, five-year workplace injury prevention strategy, Advancing a Strong Safety Culture in Newfoundland and Labrador (2018-2022). The strategy was developed based on stakeholder and partner feedback received through focus group sessions, presentations, and written feedback on a discussion paper. WorkplaceNL worked with the OHS Division of Service NL to complete this process. Opportunities to strengthen workplace prevention efforts were identified based on information obtained through a formal review of workplace injury prevention practices in countries with a strategic vision to improve OHS, including Canada, the United Kingdom, Sweden, Australia, and New Zealand.
additional trainers were certified for
Fall Protection training in 2017
24

WorkplaceNL - Annual Performance Report - 2017
20
Indicator 2.4: Completed the new musculoskeletal soft-tissue
injury prevention certification training standard.
Soft-tissue injuries, which represent almost 70 per cent of all workplace injuries in the province, are serious issues and WorkplaceNL continues to develop new approaches to help reduce the number of these injuries. The 2015-2017 prevention strategy identified the development of an MSI prevention certification standard as a strategic opportunity to prevent these types of injuries. In December, WorkplaceNL’s Board of Directors approved the new standard, the first MSI prevention certification training standard in Canada, and it became effective January 1, 2018. It was developed in consultation with the OHS Division of Service NL, training providers, and ergonomic service providers. Surveys, focus groups, and written submissions were used to gather feedback to incorporate into the standard. WorkplaceNL also developed a curriculum and educational resources to support the standard.
Objective 2: By December 31, 2018, WorkplaceNL will have
initiated implementation of the next prevention strategy.
Indicator 2.1: Delivered online and in-person prevention
education in keeping with priorities outlined in the 2018 to
2022 prevention strategy.
Indicator 2.2: Identified innovative, technology-based
solutions to actively promote health and safety, and advance
prevention programming.
Indicator 2.3: Provided supports to industry sector councils
and industry-led safety programs and initiatives.
Looking Forward – 2018 Prevention Objective and Indicators
of all workplace injuries in the province were soft-tissue
injuries in 2017
70%

WorkplaceNL - Annual Performance Report - 2017
21
Facilitating Recovery at Work
Facilitating recovery at work is a strategic focus area of claims management. The ultimate purpose is to reduce the amount of time an injured worker is away from the workplace while supporting timely access to appropriate health care interventions. For workers, the continued attachment to work can quicken the recovery process. For employers, it can mean retaining skilled and trained employees. WorkplaceNL ensures early intervention through early referrals and contact with injured workers within 48 hours of claim acceptance. Worker recovery is tracked to help identify and resolve issues proactively. In 2017, 96 per cent of workers in an ESRTW program returned to sustainable work.
In 2017, WorkplaceNL improved its ESRTW support efforts for priority employers by taking a more targeted and collaborative approach. This involved identifying higher cost, higher claim priority employers, and offering more intensive ESRTW facilitation approaches responsive to employer-specific challenges. Increased education and consultation helps improve the understanding of the roles and responsibilities in return to work (RTW) and rehabilitation, and helps identify and resolve RTW issues. WorkplaceNL also adopted a stronger, more collaborative approach with a large, multi-site priority employer by forming a partnership involving senior leadership, management and staff. Working together, the team is committed to reducing workplace injuries and improving ESRTW. Online services can improve efficiency, cost-effectiveness and more accurate injury and ESRTW reporting. Getting the right information to decision makers quicker allows earlier intervention on claims to support RTW efforts. WorkplaceNL promoted the benefits of these services to employers to increase online filing of injury and ESRTW reports.
Issue 3: Claims Management
of workers in an ESRTW program returned to
sustainable work
96%

WorkplaceNL - Annual Performance Report - 2017
22
Goal 3: By December 31, 2019, WorkplaceNL will have
implemented targeted approaches to support recovery at work.
Objective 3: By December 31, 2017, WorkplaceNL will have
improved ESRTW support efforts for priority employers.
Indicator 3.1: Completed analysis of priority employers
to identify target groups based on risk factors, such as
injuries, duration, and return-to-work progress.
A list of priority employers was analyzed in 2017 by examining injury statistics, sudden changes in injury rates, PRIME-related information, OHS committee minutes, training records, case management concerns, and RTW progress. This information was used to identify specific priority employer groups for more intensive ESRTW outreach, assistance and education. WorkplaceNL’s RTW Coordinator worked with these employers to develop ESRTW programs based on their specific needs and challenges. Where appropriate, claims management and prevention employees took a coordinated approach to meet with these employers to address a broad range of RTW and prevention topics to reduce injuries and support recovery at work efforts.
Indicator 3.2: Planned and targeted ESRTW education and
support efforts for priority employers.
WorkplaceNL’s Priority Employer Program was established to identify high-cost, high-claim employers to address health and safety issues. The program targets employers by offering intensive advisory and consultative services to deal with employer-specific health and safety and RTW issues. In 2017, WorkplaceNL matched priority employers with Health and Safety (HS) Advisors and the RTW Coordinator to work with these employers to improve their safety performance and RTW outcomes. WorkplaceNL targeted ESRTW education and support efforts by working with these employers to understand employer-specific challenges in RTW, and identify approaches to respond to these challenges.

WorkplaceNL - Annual Performance Report - 2017
23
In 2017, the RTW Coordinator and the HS Advisors conducted 32 joint visits to priority employers to promote and provide education regarding the benefits of prevention and RTW programming for employers, workers, and workplaces. During these visits, employer-specific issues were discussed as they relate to OHS and RTW. The RTW Coordinator also conducted 51 visits to priority employers to provide education on RTW program requirements and the ESRTW process, as well as to provide additional support to those employers in establishing and strengthening their RTW programs. The RTW Coordinator conducted informal, RTW programming audits to identify specific areas to target for improvement and worked with the employer to address any gaps.
Indicator 3.3: Strengthened collaboration with priority
employers.
WorkplaceNL believes partnerships are an effective way to strengthen collaboration with employers to address claims management, RTW and health and safety issues within workplaces. WorkplaceNL partnered with Eastern Health on a three-year collaborative initiative to enhance the safety culture within the organization; heighten the awareness of health and safety in the workplace; and improve the ESRTW process through shared responsibilities of the workplace parties. The initiative includes employees from WorkplaceNL working with Eastern Health employees onsite at specified locations in order to provide hands-on, day-to-day assistance with education; implementation of programs; and facilitation of recovery at work. Additional Eastern Health and WorkplaceNL employees provided analytical support for the initiative including ongoing monitoring of statistics related to claims, education sessions, and overall evaluation of the programs implemented. ESRTW Facilitators focused on providing education to staff in long-term care sites, and provided more intensive support to the employer and injured workers at these sites. The initiative is governed by a steering committee with representatives from Eastern Health, WorkplaceNL and the OHS Division of Service NL.
joint visits to priority
employers to promote benefits of prevention and RTW programs
32

WorkplaceNL - Annual Performance Report - 2017
24
The committee is co-chaired by the Chief Executive Officers of Eastern Health and WorkplaceNL. The collaborative approach will continue into 2018. Four long-term care sites have been included in this initiative in 2017.
Indicator 3.4: Increased usage of online injury and ESRTW
reporting.
WorkplaceNL promotes online injury and ESRTW reporting services for employers, and supports employers as they transition from paper to electronic reporting. Online service delivery offers employers a simple and convenient way to conduct business with WorkplaceNL. Online services enable faster, more accurate reporting to support faster decision-making, more timely intervention on claims, and improved ESRTW facilitation. This will in turn improve efficiencies and cost-effectiveness of service delivery for WorkplaceNL. Current outreach efforts concentrate on employers with a higher frequency of injury reporting and ESRTW planning (often larger employers), as well as priority employers.
Online services were promoted to the province's four Regional Health Authorities (RHAs) as part of an initiative designed to improve disability management and ESRTW efforts. Employer correspondence was put online for two of the RHAs by year end, with plans developed to move the remaining authorities online in 2018. This work has resulted in significant uptake of the online services. WorkplaceNL employees with direct employer contact also continue to promote connect, WorkplaceNL’s web portal for online services, to all employers.
Positive outcomes have been realized through all of these efforts. The use of online services continues to increase for the employer report of injury (Form 7) and ESRTW planning and reporting.
• 36.6 per cent of Form 7s were filed online in 2017 (up from 31.1 per cent in 2016).
• 47.9 per cent of ESRTW Plans were filed online in 2017 (up from 39.7 per cent in 2016).
of Form 7's were filed
online in 2017
36.6%

WorkplaceNL - Annual Performance Report - 2017
25
• The number of vendors using connect increased from 25 to 32 in 2017, representing an increase of 4,977 invoices processed online.
• All 32 vendors with connect accounts file 100 per cent of their invoicing online.
• All invoicing and 98.4 per cent of injury reporting for physiotherapy services was online in 2017.
WorkplaceNL is also moving its web services to newer, more modern technologies to ensure our web services remain easy to use. This investment is necessary as older technologies are retired and no longer supported in the marketplace. The annual employer statements and accountant/bookkeeper services were converted to HTML5 in 2017, for implementation in early 2018. As well, to improve accuracy and quality, the ability to collect the Canada Revenue Agency business number electronically was implemented in 2017.
WorkplaceNL continues to promote the use of its online services to employers. The goal is to make online services the first choice for conducting business with WorkplaceNL.
of injury reporting for physiotherapy services was online in 2017
98.4%
Looking Forward – 2018 Claims Management Objective and Indicators
Objective 3: By December 31, 2018, WorkplaceNL will have
reviewed the labour market re-entry program and made
recommendations for improvement.
Indicator 3.1: Conducted a comprehensive internal review
of the labour market re-entry program.
Indicator 3.2: Identified opportunities to improve labour
market re-entry services and programming earlier in the
lifecycle of a claim.

WorkplaceNL - Annual Performance Report - 2017
26
Partners in Client Service
Fostering a client-centred culture continues to be a strategic issue for WorkplaceNL. Through a focus on continuous improvement and evidence-based approaches, WorkplaceNL is identifying ways to better deliver programs and services for injured workers, employers and health care providers.
WorkplaceNL completed research in 2017 to identify changing client service delivery preferences and expectations to help the transition to more technology-based service delivery for employers, injured workers, and health care providers. This digital-by-design approach is responsive and creating opportunities for simplified approaches and greater efficiency in service delivery while still ensuring a high quality of service and care to injured workers.
WorkplaceNL continues its Service Without Barriers program to ensure programs and services address the challenges of a diverse workforce and other emerging issues. Partnerships with community organizations like the COD-NL, the CMHA-NL, and the CNIB are helping WorkplaceNL ensure its services and programs are accessible. WorkplaceNL began discussions with the Association of New Canadians (ANC) to identify partnership opportunities for 2018 to support the changing workforce in Newfoundland and Labrador.
Goal 4: By December 31, 2019, WorkplaceNL will have
identified technology, program and service delivery
enhancements that are responsive to injured workers
and employers.
Objective 4: By December 31, 2017, WorkplaceNL will have
identified client service delivery preferences.
Issue 4: Client Service

WorkplaceNL - Annual Performance Report - 2017
27
Indicator 4.1: Conducted client segmentation research.
WorkplaceNL is exploring new ways to deliver better programs and services in response to the pressure to offer more modern, innovative and technology-based service delivery to meet current and future client needs. Client service must adjust to changing needs.
Segmentation research was completed to identify service delivery preferences and expectations. A review was completed of the most current segmentation information from the Institute of Citizen-Centred Service (ICCS), an internationally-recognized, leading centre focused on advancing service delivery in the public sector. The ICCS takes a “citizen-centred” perspective, recognizing key differences in delivering service to the public and businesses in the public sector versus the private sector. Through its “Citizen’s First” research waves, ICCS provides insights and practical recommendations to improve service delivery to drive toward citizen-centred service. Similarly, its “Taking Care of Business” research focuses on businesses and their satisfaction with and expectations of service from government-related entities. For citizens and employers, the research highlights: the drivers of satisfaction, by service delivery channel; the challenges associated with creating seamless multi-faceted channel experiences; expectations in terms of service standards; and the relationship between service and trust and confidence in public service entities. A consistent theme of the research findings for Canadian citizens and employers relates to their increasing expectations and preferences to conduct business online with government organizations, in particular as it relates to more routine transactions. WorkplaceNL is considering this in its strategies to increase its online presence and in moving forward with more modern service delivery for workers and employers.
Research findings are being used to define service delivery needs, perspectives, expectations, and improvement priorities for workers and employers. This information will also help inform and prioritize the transition to more technology-based service delivery; service delivery improvements; and service delivery standards.

WorkplaceNL - Annual Performance Report - 2017
28
The findings were used in setting key priorities for WorkplaceNL’s new Information Technology Strategic Plan and in setting the future direction for WorkplaceNL’s 4DX (Four Disciplines of Execution) program for organizational effectiveness. The 4DX program engages employee teams in improving service delivery by choosing key goals and implementing actions to achieve them. Moving forward, these teams are focusing on increasing the usage of online services.
Other relevant research from WorkplaceNL’s client satisfaction and employee engagement surveys, and the provincial and federal governments is being considered. Given the continuous change in citizen and employer expectations, WorkplaceNL will continue to monitor segmentation research and trends to ensure it is responsive to those most impacted by its programs and services.
Indicator 4.2: Collaborated with community partners to
identify opportunities to address challenges in delivering
services to a diverse workforce.
WorkplaceNL continues with its Service without Barriers approach to improve the accessibility of its facilities and provide a barrier-free environment for employees, clients and visitors. WorkplaceNL works with community partners with lived experience to better understand the needs of our clients and implement practical solutions to provide appropriate client service delivery. Since adopting the Service without Barriers approach, WorkplaceNL has made many changes to its physical locations, parking, communications, and approaches to raise employee awareness and understanding.
WorkplaceNL worked with COD-NL to complete an accessibility audit in early 2017 and began implementing the recommendations. The audit identified strengths and opportunities for continued improvement. Some items outlined in the recommendations were implemented immediately, including repainting accessible parking stalls, removing equipment limiting accessibility to

WorkplaceNL - Annual Performance Report - 2017
29
public washrooms, and planning for 2018 changes. WorkplaceNL is consulting with the local and national CNIB for guidance on the appropriate wayfinding features for our facilities, to assist visitors who are unable to see or are partially sighted.
WorkplaceNL also worked with the CMHA-NL to produce two videos to be used by them online, in print, and possibly other media to build their profile and increase funding for the organization. The videos feature two employees of WorkplaceNL who promote the impact of the education and training on WorkplaceNL, its employees and for clients. A session of the CMHA’s Changing Minds training was delivered in 2017 for new employees and employees who were unable to attend previous offerings in 2016.
WorkplaceNL engages staff to identify client service improvements through its cross-departmental client service working group. The working group helps deliver service improvements by identifying service issues and making recommendations for improvement. The working group and other employees identified the ANC as the next community partnership for WorkplaceNL. Meetings have occurred with the ANC to identify specific partnership opportunities, and develop a plan for 2018 to measure the cultural intelligence capacity of the organization and make recommendations for improvement. Representatives from the ANC and the Newfoundland and Labrador Human Rights Commission delivered diversity training for WorkplaceNL supervisors in 2017.
Indicator 4.3: Identified opportunities for efficiency
in service delivery.
The following activities demonstrate work completed to identify opportunities for service delivery efficiencies in 2017.
• Paper-based processes were examined in 2017 to identify opportunities to reduce costs, manual processing, and inefficiencies associated with these processes. New Employer Packages will no longer be produced in paper format as the information is available

WorkplaceNL - Annual Performance Report - 2017
30
electronically. The paper copies will be eliminated in 2018. Clients will be directed to WorkplaceNL’s website in the future.
• A new online service was implemented for two large employers with high volumes of correspondence to securely direct their claim-related letters electronically rather than via paper. Discussions are underway to determine if this solution would be beneficial to rollout for all employers in 2018.
• A new appeals notification was introduced to replace three appeals letters and better inform our clients of the internal review process.
• A paper counter was introduced in the file release area to reduce the manual effort required to count pages, the risk associated with MSIs, and the turnaround time to process requests for clients.
• A new physician’s injury reporting service was implemented online. The new service moved all physicians’ payments to a more frequent payment cycle (weekly from bi-weekly) and improves internal controls. Physicians who sign up for the service will receive statements via connect and no longer receive paper copies. This offers a more timely and cost-effective approach resulting in savings from paper and printing costs, and reduces a highly manual task which can also lead to MSIs. WorkplaceNL is working with the Newfoundland and Labrador Medical Association to facilitate the transition for physicians to the online service.
• A new application was implemented to process pension payments more efficiently for clients and to strengthen internal controls.
• A new online course for OHS Committee Recertification was developed with Bluedrop Performance Learning. The online course provides a more convenient, efficient way for committee members to complete the recertification process.

WorkplaceNL - Annual Performance Report - 2017
31
• The Request for File Information form was revised to strengthen the consent process, improve transparency in file disclosure, and reduce the number of call backs to clients.
• The review of Extended Earnings Loss claims was changed from once a year to every second year resulting in a positive impact on clients by reducing the frequency documents are required to be submitted to WorkplaceNL.
• WorkplaceNL participated in a working group with other Atlantic Canadian workers’ compensation boards to identify and make recommendations on potential harmonization initiatives over the next four years. Recommendations from the working group will require approval from the Board of Directors and may require stakeholder consultation, legislative, regulatory and/or policy changes in all provinces.
A preliminary plan was developed to increase the use of online services available to employers for faster, more accurate injury reporting and more timely decision making. Online services offer a more cost-effective and efficient means for conducting business with WorkplaceNL.
Looking Forward – 2018 Client Service Objective and Indicators
Objective 4: By December 31, 2018, WorkplaceNL will have
developed a plan to enhance and modernize
service delivery.
Indicator 4.1: Established a plan to introduce technology-based
service delivery options for injured workers.
Indicator 4.2: Introduced mandatory online services
for employers.
Indicator 4.3: Developed support and service delivery standards
for online services for employers and health care providers.
Indicator: 4.4 Addressed the needs of the changing workforce in
collaboration with community partners.

WorkplaceNL - Annual Performance Report - 2017
03

WorkplaceNL - Annual Performance Report - 2017
02
ANNUAL AVERAGE EMPLOYMENT
(thousands)
243K 239K 236K 233K
2013 2014 2015 2016
1.6 1.6 1.5 1.5 1.5
224K
2017
Lost-time Incidence Rate (LTIR) PLATEAU per 100 workers
70%of fatalities were the result of occupational disease over the past five years.
Reducing injuries and illnesses
WorkplaceNL works closely with workplaces and safety partners to contain growth in the injury rate. In 2017, the LTIR remained stable at 1.5 per 100 workers for the third consecutive year. Over the past five years, the rate has dropped only slightly from 1.6 to 1.5.
Given that the rate has remained stable in recent years, WorkplaceNL recognizes that further reductions in the injury rate will be increasingly challenging to achieve, and will require leadership and collaboration from all workplace parties and safety partners.
WorkplaceNL and Service NL’s joint five-year prevention strategy, Advancing a Strong Safety Culture in Newfoundland and Labrador (2018-2022), developed in consultation with safety partners, provides the opportunity for everyone to help protect workers from hazards in the workplace. WorkplaceNL will continue to partner with safety associations, employers, workers, labour groups and employer groups to improve the safety performance at workplaces, within an industry and on a provincial scale.
Opportunities and Challenges
WorkplaceNL will continue to support injured workers and their employers by focusing on ways to reduce workplace injury and illness, provide efficient services and manage policies to reduce costs.

WorkplaceNL - Annual Performance Report - 2017
34
Efficiency in service delivery
In its 2017-2019 strategic plan, WorkplaceNL committed to identify ways to deliver its programs and services more efficiently. There are opportunities to make services more accessible and modern for injured workers and employers. WorkplaceNL is reviewing paper-based processes and using a digital-by- design approach to developing services.
Online services for employers
More employers are using WorkplaceNL’s connect
online services to report injuries and RTW activities, but there is still room for improvement:
• 36.6 per cent of the Employer’s Report of Injury (Form 7) were filed online in 2017, up from 31.1 per cent in 2016 and 19.5 per cent in 2015.
• 47.9 per cent of ESRTW plans were filed online in 2017, up from 39.7 per cent in 2016 and 25.3 per cent in 2015.
WorkplaceNL will promote online reporting as the first choice for conducting business while continuing to provide in-person or telephone services when needed.
Soft-tissue injuries
MSIs, or soft-tissue injuries, continue to represent almost 70 per cent of all workplace injury claims in the province. MSIs include sprains, strains and inflammation of the muscles, tendons, nerves and related soft tissues.
WorkplaceNL continues to focus on preventing MSIs, and has developed a new MSI prevention training certification standard, including standardized curriculum and educational resources. The voluntary course will be available to supervisors and workers in the province in 2018.
Occupational disease
Preventing occupational disease continues to be a priority. Over the past five years, just over 70 per cent of fatality claims were the result of occupational diseases.
It can take 20 or more years for an occupational disease, including cancers and respiratory illnesses, to present in a worker. Therefore, this will be a challenge for years to come.
WorkplaceNL continues to seek out and rely on the best medical and scientific information available when adjudicating claims for occupational disease. Dealing with an illness can be a very difficult time for a worker, their family and their community.
There are opportunities to prevent today’s workers from being exposed to substances which lead to known occupational diseases. WorkplaceNL’s focus on educating and creating awareness for preventing known occupational diseases will continue.
Health care costs and access to services
There remain ongoing challenges with timely access to health care services and rising health care costs. In order to control costs, WorkplaceNL has negotiated memorandums of agreement with all major health care provider groups. WorkplaceNL focuses on proactive case management and effective medical management of claims, and procures medical and health care items through the public tendering process. WorkplaceNL also adheres to the provincial generic drug pricing policy.

WorkplaceNL - Annual Performance Report - 2017
02
FORWARD-LOOKING STATEMENTS
This report contains forward-looking statements about certain matters that are by their nature subject to many risks and uncertainties, which may cause actual results to differ materially from the statements made herein.
Forward-looking statements include, but are not limited to, the organization’s objectives, strategies, targeted and expected financial results; and, the outlook for the provincial, national and global economies. Risks and uncertainties include, but are not limited to, changing market, industry and general economic factors or conditions; changes in legislation affecting the organization’s policies and
practices; changes in accounting standards; and other risks, known or unknown. The reader is cautioned not to place undue reliance on these forward-looking statements.
OPERATIONS OF WorkplaceNL
WorkplaceNL operates under the authority of the Workplace Health, Safety and Compensation Act (the Act). In accordance with the Act, WorkplaceNL promotes health and safety in workplaces with an objective of preventing the occurrence of workplace injuries and known occupational diseases. When injuries occur, WorkplaceNL provides support and benefits to injured workers, in accordance with the entitlement provisions
Management Discussion and Analysis
The Management Discussion and Analysis (MD&A) is an integral part of the annual performance report and provides management’s perspective on the operations and financial position of WorkplaceNL. This MD&A should be read in conjunction with the audited financial statements and accompanying notes for the year ended December 31, 2017. The MD&A was prepared based on information available as of March 9, 2018. The Board of Directors has undertaken its own review of the MD&A following the recommendation of the Financial Services Committee.

WorkplaceNL - Annual Performance Report - 2017
36
under the Act, and in conjunction with workplace parties and health care providers, facilitates a safe and timely return to work. WorkplaceNL is also responsible to levy and collect assessments from employers in amounts sufficient to fund the current and future costs of existing claims including their administration. Additionally, WorkplaceNL funds the OHS Division of Service NL, and the Workplace Health, Safety and Compensation Review Division.
WorkplaceNL’s revenues are derived from: assessment-based employers, that are insured through collective liability; self-insured employers, through the reimbursement of claims costs and administration fees; and investment income. In certain circumstances, under Section 45 of the Act, WorkplaceNL is deemed to be an assignee of a cause of action in respect of a claimant disability. Accordingly, revenues also include recoveries from third parties in respect of such actions. WorkplaceNL provides workplace insurance coverage to approximately 98 per cent of workers employed in the province of Newfoundland and Labrador.
KEY BUSINESS DRIVERS
Lost-time Incidence Rate
WorkplaceNL computes the lost-time incidence rate to measure the rate of injury, illness, and disease in workers covered by workers compensation legislation. The indicator provides insight into safety and health risks faced by workers, resulting from exposure to, or contact with, workplace hazards.
In Newfoundland and Labrador, the lost-time incidence rate in 2017 remained at 1.5 injuries per 100 workers – the same rate observed since 2015. From a historical perspective, the incidence rate in 2017 represents the lowest level of injury since WorkplaceNL began operating in 1951, and one of the lowest rates observed in Canada. In 2017, 92.8 per cent of employers in Newfoundland and Labrador were injury-free. The historic decline in the lost-time injury rate was made possible through strategic investments in occupational health and safety, education and enforcement, and partnering with employers, workers, and safety associations to achieve higher levels of worker protection from workplace hazards. In 2017, WorkplaceNL also achieved significant reductions in high risk injury categories related to young workers, workplace violence, soft- tissue injury, and occupational disease.
Despite the gains, an average of 13 workers have a work-related injury every day in Newfoundland and Labrador, and a workplace fatality occurs, on average, every 15 days either due to a traumatic event or occupational disease. These statistics signify the presence of uncontrolled safety and health risks, and,
Lost-time Incidence Rate Per 100 workers
2008
1.9 1.9 1.8 1.81.6 1.6 1.6 1.5 1.5
2017
1.5

WorkplaceNL - Annual Performance Report - 2017
therefore, improvements in risk management processes are warranted in certain workplaces. In 2017, WorkplaceNL and the OHS Division of Service NL, worked extensively with safety partners and stakeholders to develop a new five year Workplace Injury Prevention Strategy for Newfoundland and Labrador. The new strategy incorporates best practices from other jurisdictions in Canada, Sweden, the United Kingdom, Australia, and New Zealand. The ultimate goal of the new strategy is to build a stronger safety culture in the province, prevent injury, and protect workers using a balanced approach among education, enforcement, and engineered safety management systems. While advances in science and health surveillance are leading to a better understanding of injury and illness prevention, it is important to recognize that Newfoundland and Labrador has an aging workforce, high rates of chronic disease, and slower economic activity. Complex hazards like cumulative trauma, workplace violence, and traffic control pose significant challenges for employers, workers, and health and safety practitioners. While the new prevention strategy will focus injury prevention initiatives and programming on specific high risk hazards, increased vigilance will be required in all areas of occupational health and safety in order to protect workers from injury and illness.
Investment Returns
WorkplaceNL takes a long-term view in managing and evaluating the performance of the Injury Fund given the long-term nature of the benefits provided to injured workers. WorkplaceNL’s stated goal is to earn a rate of return of 5.8 per cent or a 3.5 per cent real return after inflation.
The financial risks to which WorkplaceNL is exposed are described in Note 8, Financial Risk Management, to the Financial Statements and include credit, currency, interest rate, and market risks. Credit risk on fixed income securities arises from the possibility that issuers of debt will fail to meet their obligations to pay interest and principal. This risk is managed by limiting the investments held with any one issuer and adjusting the overall credit quality of the portfolio. Currency risk is the risk that the value of securities denominated in foreign currencies will change with their respective exchange rates compared to the Canadian dollar. This risk is managed through forward foreign exchange and futures contracts.
Interest rate risk is the risk that the value of a security will fluctuate due to changes in market interest rates. This risk is managed through

WorkplaceNL - Annual Performance Report - 2017
38
diversification among sectors and durations. Market risk is the risk that the fair value of marketable securities or long-term investments will change due to perceived or real changes in the economic condition of the issuer, the relative price of alternative investments and general economic conditions. This risk is managed through adherence to an investment policy that prescribes an asset mix that provides for the diversification of risk across a broad group of securities that collectively meet the long-term return objectives of the investment portfolio. The asset mix is reviewed and updated periodically.
Benefit Costs
WorkplaceNL administers a number of different benefits in accordance with the Act. These benefits relate to compensating wage loss, and the provision of health care treatments and other benefits to injured workers and their survivors. Benefit costs can be influenced by factors such as the number and severity of injuries, claim duration, health care cost trends, the rate of wage growth in the province, and the expansion of coverage due to legislative changes, external appeal decisions, and court decisions.
Despite a decline in the number of new short-term injury claims and health care only claims in 2017, benefit costs increased by $2.9 million from $160.9 million in 2016 to $163.8 million in 2017. This was primarily due to longer durations and higher health care costs for prior year claims.
The factors influencing benefit costs are considered during WorkplaceNL’s strategic planning processes and as part of the
ongoing approach to claims management. WorkplaceNL focuses on identifying initiatives designed to impact factors that it can directly control to realize reductions in duration at all levels of the claim life cycle, and mitigate growth in claim costs. WorkplaceNL’s strategic investment in claims management has resulted in many positive changes, including improved access to services, earlier involvement in claims, more timely decisions and provision of wage-loss benefits, and appropriate health care interventions. These changes have been largely realized through:
• Investment in technologies to support better data quality and earlier accessibility of information for claims decision makers.
• An increased focus on intervention in the early stages of a claim.
• A structured quality assurance framework for improved measurement and reporting at critical points in the claim lifecycle.
• A focus on sustainable return-to-work outcomes.
• Targeted ESRTW facilitation approaches that deal more effectively with employer and industry-specific issues.
6,000
5,000
4,000
3,000
2,000
1,000
02013 2014 2015 2016 2017
1,71
43,
785
1,62
33,
761
3,59
4
3,56
0
1,45
6
1,62
1
1,56
13,
356
New Injury Claims
Health Care
Short Term Disability

WorkplaceNL - Annual Performance Report - 2017
39
WorkplaceNL continues to invest in new technologies to increase online services related to injury reporting and RTW, as well as improved tools for reporting and business intelligence. Through its online services, claim management system, and data warehouse tools, WorkplaceNL has been able to improve data collection and automate the triggering of key RTW business processes earlier in the lifecycle of a claim. These technologies enable WorkplaceNL to focus less on sequential work flows and more on getting better outcomes by simultaneously routing claim data to adjudicators for faster entitlement decisions and to case managers for earlier intervention and RTW services.
Claims are also managed based on key statistical measures recognized by the Association of Workers Compensation Boards of Canada, an organization designed to facilitate the exchange of information between workers’ compensation boards and commissions. Focusing on crucial RTW services within the first 180 days of the claim life cycle offers the best potential to ensure sustainable return to work outcomes. Our data warehouse and quality assurance framework enables reporting and measurement of a broad range of data to help focus on critical checkpoints in the early stages of a claim and to support sustainable RTW outcomes. WorkplaceNL is also able to introduce new measures at critical points along the claims lifecycle, starting at the initial reporting of an injury. Analysis shows that factors within WorkplaceNL’s control, that are impacting duration the most, are trending in a positive direction.
WorkplaceNL is improving ESRTW support efforts for employers by taking a more targeted and collaborative approach. In 2017, this involved identifying higher cost, higher claim priority employers, and offering more intensive ESRTW facilitation approaches responsive to employer-specific challenges. This approach is having a positive impact.
There are other claim duration and cost drivers beyond WorkplaceNL’s control, including access to appropriate medical interventions, the availability of suitable employment following an injury and rising health care costs. WorkplaceNL takes a number of approaches to mitigate these risk factors. WorkplaceNL maintains agreements with external health care providers to ensure the principles of ESRTW are understood and key service targets are met. WorkplaceNL also utilizes various health care consultants to assist in the medical management of claims. WorkplaceNL works with Memorial University’s School of Medicine to transfer knowledge to physicians about workplace injuries and illness, and identifying and managing return to work barriers.
More proactive case management and the increased focus on early intervention has assisted in mitigating growth in health care costs. WorkplaceNL continues to consolidate procurement of medical and health care items through the public tendering process and entering into memoranda of agreement with service providers, and partnering with other workers’ compensation boards on the procurement of common requirements, to improve the cost-effectiveness of service delivery.

WorkplaceNL - Annual Performance Report - 2017
40
Adherence to provincial generic drug pricing policy and health care monitoring and quality assurance, works to ensure cost-effective, appropriate medications are used to treat work-related conditions. The ongoing, strategic investment in information systems has improved the quality of data used to manage claims and the efficiency by which services are acquired and provided to clients.
The aging workforce, decreased labour demand, and slowing economic activity will pose challenges for return to work efforts for all workplace parties. Stronger collaboration and more innovative approaches will be required to address these issues, ensure our clients’ needs are met, reduce duration at all stages of the claim, and mitigate costs.
Inflation Rate
The annual change in inflation can have a material impact on WorkplaceNL’s benefit liabilities. The long-term disability benefits provided under the Act are indexed to the full rate of inflation with no upper limit. WorkplaceNL calculates the annual inflation adjustment based on the year-over-year change in the Canadian Consumer Price Index at July each year and applies the adjustment January 1 of the following year. The inflation adjustment calculated in 2017 was 1.4 per cent and the inflation adjustment has averaged 1.5 per cent over the past five years. The long-term inflation assumption used to value WorkplaceNL’s benefit liabilities has ranged from 3.0 per cent down to 2.25 per cent over that period.
ENTERPRISE RISK MANAGEMENT
WorkplaceNL’s enterprise risk management framework integrates risk management into its governance, strategy and planning, management, policy and reporting processes. This strategic framework provides assurances that WorkplaceNL resources are effectively deployed and that significant internal and external risks within our control are managed appropriately.
WorkplaceNL management is responsible for identifying, assessing, managing and communicating risk, and the impact these risks and their interdependencies may have on WorkplaceNL’s ability to achieve its strategies and objectives. Along with this management control, WorkplaceNL has established internal controls, controllership functions, compliance functions, policies and practices to mitigate risks that could lead to significant consequences. An internal auditor provides independent, objective assurances to the Governance Committee, the Finance Committee, and the Board of Directors on the effectiveness of the risk management framework, risk management activities, and internal controls. Executive leadership provides oversight to risk management activities, ensures the framework is updated, and ensures appropriate reporting to the Board of Directors. The Board of Directors provides overall oversight to the framework, sets the organization’s risk tolerance level, and ensures risk is managed appropriately. WorkplaceNL is subject to review by external auditors and the Provincial Auditor General, and these bodies perform independent and objective assessments.

WorkplaceNL - Annual Performance Report - 2017
41
The following section discusses the 2017 assessment of key strategic, financial and operational risks and risk factors facing WorkplaceNL.
Environment and Economy
The Conference Board of Canada and the Provincial Government are projecting the outlook for the Newfoundland and Labrador economy to be modestly positive for 2018 and 2019. After contracting by an estimated 3 per cent to 4 per cent in 2017, the provincial economy is expected to expand slightly in 2018 (forecasts ranging from 0.2 per cent to 2.3 per cent), largely due to additional oil production from the Hebron offshore oil field. However, the adverse impacts of declining major investment projects are expected to continue, with decreasing employment levels negatively impacting consumption and housing starts. The slowing economy and decreased demand for major projects is expected to result in continued net out-migration in 2018. An aging population and lower birth rates are further contributing to the population decline in Newfoundland and Labrador, a trend that is more pronounced in rural areas. Older workers, who experience workplace injuries, tend to require more time to recover and may require retraining to re-enter the workforce.
WorkplaceNL is forecasting assessable payrolls to decrease again in 2018, to be below 2017 by 4.7 per cent, following declines in the previous two years. This, coupled with a decrease in the average assessment rate, will result in a decline of $19.9 million in assessment revenue. Claim costs are projected to increase in 2018 compared to the past three years, primarily
due to an increase in the income replacement rate, and further declines in the demand for labour could also impact claiming patterns. It is important that assessment rates be sufficient to cover the anticipated cost of injuries to ensure the future financial sustainability of the Injury Fund.
These factors are expected to increase the challenges for delivering WorkplaceNL services from prevention outreach and return-to-work perspectives. The increasing pace of change will also require WorkplaceNL to become more agile to deliver its strategies and objectives. Stronger collaboration and a focus on identifying innovative approaches to address specific challenges in prevention and RTW will be essential to delivering services that meet the needs of our clients, now, and into the future. These are fundamental elements of the Board’s future plans.
Strategy
WorkplaceNL’s Board of Directors is responsible for setting the priorities for WorkplaceNL and planning for its future. Progress against the objectives of the current 2017 to 2019 Strategic Plan is outlined in our Report on Performance section. WorkplaceNL’s ability to deliver on business strategies and advance service delivery require continued focus in the face of multiple, competing pressures. Responding effectively to changing social and economic realities continues to be a priority for the Board of Directors.
WorkplaceNL is seeking more creative ways to make a difference to the health and safety of workplaces. WorkplaceNL’s Board of Directors has identified technology as a key focus area

WorkplaceNL - Annual Performance Report - 2017
42
to foster new and innovative approaches to service delivery. A new, five-year Information Technology Strategic Plan was developed in 2017 to support both innovative and traditional approaches in delivering prevention and claims management services. The goal of the plan is to support WorkplaceNL’s ability to deliver on its strategies; create new partnerships to help accelerate service delivery improvements; and, be more agile and responsive to our clients by delivering services more effectively using modern approaches that reflect the needs and preferences of the current and future workforce.
Communication
Communication with stakeholders is a key element in financial sustainability, as well as collaboration on prevention and recovery at work. Understanding of WorkplaceNL’s direction and strategies, and the impacts of changing policy, investment strategies, and accounting and actuarial standards are critical to ensure WorkplaceNL continues to take a balanced, long-term view in managing the Injury Fund. In addition to the annual reporting process, WorkplaceNL’s Board of Directors meets annually with its key stakeholders to communicate directly on the factors that impact the organization's performance.
Operational
Claims Management
Facilitating recovery at work continues to be a priority for WorkplaceNL. WorkplaceNL proactively monitors key performance indicators related to claims management, return-to-work and service delivery. During its strategic planning
processes, WorkplaceNL focuses on identifying initiatives designed to impact factors that it can directly control to realize reductions in duration at all levels of the claim life cycle, and mitigate growth in claim costs. WorkplaceNL is focusing on RTW services early in the claim life cycle to offer the best potential to ensure sustainable RTW outcomes. WorkplaceNL is also targeting employers experiencing higher injuries and claims costs to identify facilitation approaches that address employer-specific challenges in RTW, in consideration of current and emerging risk factors.
Prevention
While the workplace injury rate in Newfoundland and Labrador remained stable in 2017 at 1.5 per 100 workers, WorkplaceNL is striving to reduce this rate even further. Economic conditions, changing demographics, technology advancements and social risk factors can all impact workplace injury rates. In 2017, WorkplaceNL developed a new workplace injury prevention strategy in consultation with our injury prevention partners and stakeholders. The strategy for 2018 to 2022 addresses current and emerging issues in consideration of the new safety and health risks of changing workplaces. WorkplaceNL is taking evidence-based approaches to prevention programming by focusing on areas of greatest risk, and tailoring education and communications strategies for its target audiences. Key priorities include serious injuries, musculoskeletal injuries, falls, workplace violence, traffic control, psychological health and safety, and occupational illness and disease.

WorkplaceNL - Annual Performance Report - 2017
43
The strategy outlines initiatives designed to advance a higher level of worker protection from workplace hazards.
Financial
The financial sustainability of WorkplaceNL continued to improve in 2017. WorkplaceNL achieved a funded status of 131.6 per cent, due in part to investment performance, as well as the cost of claims being lower than the projected costs reflected in the 2017 average assessment rate. The Injury Fund had a rate of return of 9.2 per cent which is above the target return of 5.8 per cent. Market volatility, changing policy, increasing program costs, economic uncertainty, and changes in claiming patterns can quickly impact the value of the Injury Fund. Adherence to the Funding Policy ensures the Injury Fund is managed with a long-term view to maintaining a funded position that provides security for injured worker benefits within a reasonable ability of employers to pay assessments. The fund status continues to be assessed annually to ensure these factors are considered in the setting of assessment rates and benefits. While WorkplaceNL sets the employer assessment rate, changes to wage loss benefits are determined by the Government of Newfoundland and Labrador.
WorkplaceNL’s Long-term Investment Policy outlines approaches to mitigate financial risk and capital market uncertainty. The investment portfolio is managed through a diversified investment approach and different fund managers with different investment philosophies are used. WorkplaceNL’s Board of Directors and Management also engage the services of
independent consultants to provide advice on investment policies and to benchmark the performance of fund managers. WorkplaceNL is exploring other strategies to contain growth in costs and provide more cost-effective service delivery. This includes increasing the use of technology; leveraging opportunities to tender high quality goods and services at reduced prices; improving internal controls; and, continuing with sound financial management practices.
Information Technology
Privacy and security are becoming more vulnerable as newer technologies change the way services are delivered, and more sophisticated cyber threats become more prevalent. Security is embedded as a key tenant of the new IT Strategic Plan and an essential consideration in all technology choices. Protection of data, security of records, and system reliability are critical for our operations. WorkplaceNL has established measures to avoid system failures, as well as robust technology recovery and business continuity plans to mitigate the fallout from system failures to ensure core systems are restored and service delivery continues for our clients.
Human Resources
The pace of change in all Canadian workplaces is accelerating. Changing demographics, a more diverse workforce, rapidly changing technologies, and organizational agility and ability to deliver services requires new approaches and strategies. To meet its commitments and mitigate human resource risk factors, WorkplaceNL is establishing

WorkplaceNL - Annual Performance Report - 2017
44
plans to support skilled and engaged employees, organizational succession, leadership development, and continuity of corporate knowledge.
STATEMENT OF FINANCIAL POSITION
Cash position
WorkplaceNL ended 2017 with a cash balance of $20.0 million, as compared to $46.1 million at the end of 2016. The decrease is due to lower assessments revenue as a result of lower average assessment rates and lower assessable payroll in 2017.
Investments
WorkplaceNL’s investments are held in an Injury Fund to meet future benefit payments to injured workers. These investments are diversified primarily between domestic fixed
income and domestic and foreign equities, as well as an allocation to domestic real estate and a new allocation to global infrastructure. The fair value of the Injury Fund increased $127.4 million to $1,454.5 million at December 31, 2017 from $1,327.1 million at the end of 2016.
Capital Markets Overview
($000) 2017 2016
INVESTMENTS 1,454.5 1,327.1 BENEFIT LIABILITIES 1,110.3 1,076.8 FUND BALANCE 362.5 291.1 ASSESSMENT REVENUE 166.3 183.8 INVESTMENT INCOME 124.6 104.5 CLAIMS COSTS 181.6 162.2 ADMINISTRATION COSTS 24.6 25.6 LEGISLATED OBLIGATIONS 7.2 7.9 OPERATING SURPLUS 71.5 84.7 AVERAGE ASSESSMENT RATE $2.06 $2.20 RATE OF RETURN ON INVESTMENTS 9.2% 8.5%FUNDED RATIO 131.6% 126.1%
FINANCIAL HIGHLIGHTS
1,600
1,200
800
400
200
02013 2014 2015 2016 2017
Injury Fund CANADIAN BONDS
CANADIAN EQUITYGLOBAL INFRASTRUCTURE
GLOBAL EQUITYREAL ESTATE

WorkplaceNL - Annual Performance Report - 2017
02
During the past year, global equity markets benefited from synchronized economic growth, low inflation and supportive central bank monetary policy, particularly outside North America. All 45 major economies monitored by the Organization for Economic Co-operation and Development were estimated to have seen real GDP increases in 2017, something that has not occurred since the onset of the global financial crisis in 2008.
Despite ongoing geopolitical uncertainty and the protectionist trade sentiment of the U.S. administration, stock market volatility was historically low in 2017. A dominant theme in equity markets was the trend from cyclicality to stability. The Chicago Board Options Exchange Volatility Index (VIX) recorded nine of its lowest 10 levels ever, last year. The VIX is a measure of the stock market's expectation of volatility implied by S&P 500 index options. Outside of the U.S., equity markets exhibited similarly lower-than-normal levels of volatility, although in Canada, volatility was higher due to a concentrated reliance on cyclical resource-based sectors.
The Canadian economy exceeded expectations in 2017, led by a 12.5 per cent recovery in crude oil prices, but still lagged most other markets. The S&P/TSX Composite index underperformed due to its sector weightings. The energy and financial sectors, which underperformed their U.S. counterparts, account for more than half
of the index, while the year’s top performing sectors of information technology and health care, combined make up only 4 per cent of the S&P/TSX Composite versus 38 per cent of the S&P 500. The MSCI World index grew by 14.4 per cent in Canadian dollar terms, having grown by more than 200 per cent since its low point in 2009. The emerging market component led all others in 2017, producing a 28.3 per cent return, the highest return of this market since the global financial crisis. These results were due to strong economic growth and a weaker U.S. dollar. The U.S. market continued on its second longest bull run on record, achieving 62 new all-time highs in 2017, and achieving its strongest annual gain since 2003. The S&P 500 produced a 21.8 per cent return in local currency terms (13.9 per cent on a hedged basis).
Central bankers have recently begun to tighten policy or have signaled their intention to reduce the size of their balance sheets. In response to stronger economic signals, the Bank of Canada increased its overnight rate twice from 0.50 per cent to 1.0 per cent. The second increase came sooner than the market had anticipated causing a sharp increase in bond yields. Similarly, the U.S. Fed increased its target rate three times from between 0.25 and 0.50 per cent to between 1.25 and 1.5 per cent. The Bank of England also increased its rate for the first time since the global financial crisis.
The Canadian Dollar (CAD) gained 5.9 per cent versus the United States Dollar (USD) over the

WorkplaceNL - Annual Performance Report - 2017
46
year, increasing from 74.5 cents to 78.8 cents U.S. The CAD peaked at 82.5 cents in the third quarter of 2017. The CAD lost 7.6 per cent in value versus the Euro from the beginning to the end of the year. Three quarters of the Injury Fund’s foreign currency denominated assets (30 per cent of the total fund) are not hedged to the CAD. At December 31, 2017, United States assets represented 35.5 per cent of the global asset allocation (21.6 per cent of total fund assets) while European assets accounted for about 15.1 per cent (9.2 per cent of total fund assets). It is estimated that a 10 per cent change in the value of the CAD versus the USD produces about a $28.6 million change in value, while a similar result compared to the Euro produces a change of about $3.5 million.
An overriding theme for North American bond markets was a flattening yield curve and unlike equities the FTSE/TMX Universe Bond Total Return Index did see a higher level of volatility. In addition, credit spreads have narrowed to the lowest level since 2007. The yield curve is as flat as it has been since 2007 as short rates have risen in anticipation of central bank rate hike expectations, while long rates have remained lower due to muted inflation expectations.
The yield differential between Government of Canada bonds and U.S. treasuries narrowed significantly at both the two and 10 year terms. Bond yields in Canada rose for the second consecutive year with two and 10-year yields ending 2017 at 1.68 per cent and 2.04 per cent, respectively. This was an increase of 91 basis points (bps) for the two-year term and 30 bps for the 10-year term over the last 12 months.
The yield on two-year U.S. treasuries increased from 1.22 per cent to 1.89 per cent in 2017 while 10-year treasury yields decreased slightly from 2.45 per cent to 2.40 per cent. The narrowing of credit spreads during 2017 resulted in the outperformance of longer-term bonds versus shorter-term bonds, and provincial and corporate bonds outperforming federal bonds of similar maturities.
While the increase in bond yields is expected to benefit defined benefit pension plan valuations, by reducing solvency liabilities, there is no immediate impact on WorkplaceNL’s funded position as the actuarial discount rate is currently set based on long-term interest rate expectations. However, new International Financial Reporting Standards effective for years beginning January 1,2021 will require WorkplaceNL to apply a market rate in valuing its benefit liabilities.
Investment Strategy and Portfolio Construction
WorkplaceNL’s Board of Directors is responsible to ensure that the assets of the Injury Fund, along with future investment income, are sufficient to pay benefit liabilities. The Board of Directors takes a long-term approach to the management of the Injury Fund given that payment of the majority of benefits promised to injured workers extend many years into the future.
WorkplaceNL’s investment strategy is guided by the Statement of Investment Principles and Beliefs (SIPB) and the Long-term Investment Policy. The SIPB outlines the governance structure for the Injury Fund, the importance of asset allocation in achieving the long-term return objectives of the fund, the importance of diversification and the process for manager selection and performance evaluation.

WorkplaceNL - Annual Performance Report - 2017
47
The Investment Committee reviews and amends the SIPB and policy periodically to ensure prudent management and oversight of the Injury Fund assets.
The Long-term Investment Policy documents the long-term asset mix target, the return objectives, acceptable investments and limits on risk concentration. The Injury Fund assets are managed by independent, professional investment managers and WorkplaceNL has hired a third party service provider to assume the role of outsourced Chief Investment Officer for the Injury Fund. WorkplaceNL monitors the fund managers’ compliance with policy on a regular basis. The Injury Fund assets are diversified across asset classes, industry sectors, geographic locations and individual securities to minimize the volatility of returns. Further diversification is achieved by selecting investment managers with varying investment mandates and styles.
During 2017, WorkplaceNL implemented recommendations arising from its most recent asset-liability study, introducing a 10 per cent allocation to global infrastructure with a corresponding decrease in the Canadian equity allocation. In conjunction with this adjustment to the asset mix, the fund was rebalanced to the target asset mix and there were a number of changes in underlying investment managers. These changes resulted in higher turnover of the securities in the Injury Fund that would typically occur, and an increase in the realized gain on sale of investments.
WorkplaceNL’s asset mix policy as at December 31, 2017 was as follows:
The asset mix will vary from the targets due to differences in the relative performance of the various financial market segments. All asset classes are within their respective tolerance ranges at December 31, 2017:
Another objective of the Injury Fund is to exceed the return of the benchmark portfolio (i.e. the policy return) on a four-year moving average basis. The policy return is the return the Injury Fund would have earned had each asset class achieved the return of its respective passive index and was at its target weight according to the Long-term Investment Policy.
2.0%
1.5%
1.0%
0.5%
0%
Asset Mix vs. Policy, Dec. 31, 2017
-0.5%
-1.0%
-1.5%
-2.0%
CANADIAN EQUITY
GLOBAL EQUITY
GLOBALINFRASTRUCTURE
CANADIANBONDS
REAL ESTATE
ASSET CLASS ASSET MIX TOLERANCE
RANGE
BONDS, CANADIAN 30% +5% EQUITIES, CANADIAN 20% +5% EQUITIES, GLOBAL 30% +5% INFRASTRUCTURE, GLOBAL 10% +5% REAL ESTATE 10% +5%

WorkplaceNL - Annual Performance Report - 2017
48
The target rate of return for the investment portfolio had been 6.6 per cent or 3.5 per cent after inflation over the longterm. WorkplaceNL revised its long-term return target to 6.1 per cent in 2015 and then to 5.8 per cent in 2016, maintaining a 3.5 per cent real rate of return, but with reductions in the inflation expectations to 2.5 per cent and then to 2.25 per cent. For the four-year period ending December 31, 2017, the Injury Fund earned an annualized return of 9.0 per cent compared to the policy return of 8.2 per cent. The fund has generated an average return of 6.7 per cent over the most recent ten years, including the impact of the global financial crisis.
Benefit Liabilities
Benefit liabilities reflect the present value of all future payments expected to be made on behalf of injured workers whose claims were accepted as of December 31, 2017, and the future cost of administering those claims. WorkplaceNL has also included a provision for future claims related to latent occupational disease, and presumptive coverage for firefighters which was legislated by the Government of Newfoundland and Labrador in 2016. The benefit liabilities are increased each year for the
estimated cost of current and prior year injuries and are reduced by actual payments in the year and revisions to actuarial estimates for prior years’ claims. These experience adjustments are a normal and expected part of the actuarial valuation process.
WorkplaceNL has a financial strategy policy aimed at maintaining the funded position within a reasonable range over the long term. The economic and actuarial assumptions used in the valuation of liabilities are reasonable estimates of future expectations for these variables over the long term. The assumptions described in Note 14 - Benefit Liabilities and Claims Costs, to the financial statements, are consistent with those used in the prior year, except that WorkplaceNL updated its analysis of administration costs and has determined that 10.5 per cent (2016 - 8.5 per cent) of the benefit liability is a reasonable provision for the cost of administering claims.
Four-year Annualized ReturnACTUAL
POLICY
TARGET12%
10%
8%
4%
2%
0%
2013 2014 2015 2016 2017
1,200
1,000
800
600
400
200
0
2013 2014 2015 2016 2017
Benefit Liabilities
REHABILITATION
SHORT-TERM DISABILITY
SURVIVOR BENEFITSFUTURE ADMINISTRATIONHEALTH CARELONG-TERM DISABILITY
($ M
illio
ns)

WorkplaceNL - Annual Performance Report - 2017
02
One of the significant assumptions used in the determination of the benefit liability is the discount rate. Current accounting and actuarial standards allow for the use of a rate equivalent to the long-term expected return on the benchmark asset allocation adopted through WorkplaceNL’s Long-term Investment Policy, currently 5.8 per cent. The International Accounting Standards Board (IASB) has issued a new standard International Financial Reporting Standards (IFRS) 17 Insurance Contracts which will be applicable for fiscal years beginning on or after January 1, 2021. This standard provides for the use of a discount rate that is closer to a risk-free rate; one which is comparable to the expected rate of return earned on a hypothetical fixed income portfolio consisting of high-quality bonds of durations similar to the cash flows associated with the liability. If this accounting standard had been in effect at December 31, 2017, such a discount rate would be approximately 3.3 per cent and would result in an increase in the benefit liability of $290.5 million and a reduction in the funded ratio to 105.0 per cent.
WorkplaceNL’s benefit liabilities include amounts set aside to pay the future cost of short and long-term disability, survivor benefits, health care, rehabilitation, and future administration costs. Benefit liabilities increased $33.5 million, or 3.1 per cent from $1,076.8 million at the end of 2016, to $1,110.3 million at the end of 2017.
This increase is due to an increase in the provision for future administration expenses from 8.5 per cent to 10.5 per cent, slightly offset by other net actuarial gains.
The liability for long-term disability benefits represents the single largest component of the overall benefit obligations. At December 31, 2017, the long-term disability liability was 49.8 per cent of the total benefits liability and amounted to $553.2 million, compared to $554.0 million for the prior year. Net actuarial gains in this category totaled $11.4 million. Gains related to the inflation rate being lower than expected ($1.9 million), claim terminations being greater than expected ($0.9 million), and the impact of positive experience on new Extended Earnings Loss (EEL) capitalizations ($7.5 million).
In addition to the liability for long-term disability claims accepted during the year, the liabilities include a provision for outstanding claims that might become long-term disability claims in future years. The observed (actual) average capitalization increased from about $117,000 in 2016 to $131,000 in 2017. The average new capitalization award for the past 5 years, when adjusted for inflation, is $132,000. The actuaries have maintained the $130,000 assumed liability assumption for new EEL awards for the current valuation. WorkplaceNL’s actuaries have reduced their expectation for the proportion of short-term claims which will eventually qualify for an EEL award from 6.2 per cent to 6.0 per cent in response to emerging experience.

WorkplaceNL - Annual Performance Report - 2017
50
The absolute number of expected long-term claims continues to decline, and for accident years 2015 to 2017 averaged 203 per year.
The next largest benefit liability category is health care, which is 30.0 per cent of the benefit liability at $333.3 million, a 3.2 per cent increase from 2016. There were actuarial losses in this category totaling $4.4 million arising from the reassessment of expected future costs for a claim with significant ongoing health care expenses.
The liability for short term disability increased 7.4 per cent from $61.5 million to $66.1 million. Actual payments were higher than expected due to wage inflation and a challenging return to work environment, contributing to an actuarial loss of $6.6 million.
In 2017, the liability for survivor benefits decreased from $50.7 million to $48.7 million. WorkplaceNL accepted 25 fatality claims in 2017 compared with 13 in 2016. Of these, five were as a result of accidents and 20 arose from occupational disease (2016: five accidents, eight occupational disease).
Funding Policy
WorkplaceNL’s Funding Policy, which was agreed to by stakeholders, is designed to maintain a funded position that will provide for the security of injured worker benefits within employers’ reasonable ability to pay assessments. The Funding Policy provides guidance to ensure WorkplaceNL responds to external factors, such as volatile investment markets, in a controlled and responsible manner.
The Injury Fund is fully funded when the total assets equal or exceed total liabilities. However, due to the potential volatility of investment market returns, the Board of Directors has established a funding target of total assets equal
to 110 per cent of total liabilities. The Funding Policy specifies a funding target operating range from 100 per cent to 120 per cent. If the funded status moves outside the targeted range, WorkplaceNL will adjust assessment rates paid by employers over a fifteen- year period to achieve the funding target.
At funding levels above 140 per cent WorkplaceNL will consider one-time expenditures. One-time expenditures include, but are not limited to, benefit improvements, assessment rebates and funding for prevention programs. The introduction of benefit improvements is subject to the approval of the Government of Newfoundland and Labrador. In order to ensure the long-term sustainability of the workers’ compensation system, WorkplaceNL will take into account the current and all future costs associated with any one-time expenditures.
FUND BALANCE
At December 31, 2017, WorkplaceNL’s assets totaled $1,508.3 million compared with total liabilities of $1,145.8 million. The net fund balance of $362.5 million consists of $362.7 million in accumulated operating surpluses, other comprehensive loss of $0.7 million, and an occupational health and safety research reserve of $0.5 million.
140%
120%
100%
80%
60%
40%
20%
0%2013 2014 2015 2016 2017
Funded Ratio
TARGET 110%
106.
5% 112%
118.
8% %
126.
1%
131.
6%

WorkplaceNL - Annual Performance Report - 2017
51
WorkplaceNL’s annual assessment revenue is set to cover projected current year claims and operating costs, while investment income is intended to cover the annual interest on the liability from prior years’ claims. Gains or losses arise when claims or operating
costs differ from forecast or projected, or investment returns are higher or lower than target. The following table provides a reconciliation of the change in fund balance:
($ millions) 2017 2016
Fund Balance - January 1 $ 291.1 $ 206.5 Assessments revenue in excess of current year claims and operating costs 34.1 50.8 Investments income in excess of interest on liability on prior years' claims 59.6 40.8 Lower (higher) liabilities than previously anticipated for prior years' claims (22.3) 24.6 Provision for presumptive coverage for firefighters 0.0 (31.5) Actuarial (losses) gains on employee future benefits 0.0 (0.1)
Fund Balance - December 31 $ 362.5 291.1
$ 3.00
$ 2.50
$ 2.00
$ 1.50
$ 1.00
$ 0.50
$0.00
2013 2014 2015 2016 2017
Observed Assessment
Rate Differential FORMULA RATE SURCHARGEDIFFERENTIALREQUIRED
Revenue
400350300250200150100
500
THIRD PARTYINVESTMENTSASSESSMENTS
2013 2014 2015 2016 2017
($ M
illio
ns)
Assessment rates are established each year at a level that generate sufficient revenue to cover the anticipated cost of new injuries in the year. The cost of injuries is projected based on a formula which considers the average cost of injuries for most recent seven-year period, excluding the highest and lowest value. Often
there is a differential between the projected cost of injuries and the actual experienced. While WorkplaceNL has experienced a steady decline in the projected cost of new injuries, actual injury costs realized in recent years have been even lower. This pattern has also contributed to the increase in the fund balance.
Fund Balance

WorkplaceNL - Annual Performance Report - 2017
52
A portion of the differential will be absorbed by the increase in the income replacement rate for wage loss benefits.
STATEMENT OF COMPREHENSIVE
INCOME
Revenue
WorkplaceNL’s revenue sources are assessments paid by employers, investment income and third party recoveries. In 2017, revenue totaled $293.9 million, a 1.4 per cent increase from 2016 revenue of $290.0 million, with decreases in assessments more than offset by increases in investment income.
Assessments Revenue
Revenue from assessments consists of base assessments, and practice and experience incentives, refunds and charges disbursed and collected through the PRIME program. Revenue also includes payments made on behalf of self-insured employers.
The average base assessment rate was reduced from $2.20 to $2.06 for 2017. The assessment revenue from rate based employers decreased
10.4 per cent to $167.2 million from $186.6 million in 2016. The rate reduction contributed approximately $11.8 million to the year-over-year revenue reduction. In 2017, employer assessable payrolls decreased by 2.0 per cent to $8.3 billion due to a 16 per cent decline in the construction sector, as well as declines in finance and insurance, wholesale trade and business services, partially offset by growth across most other industry sectors, and the annual increase in the maximum assessable and compensable earnings limit.
Under WorkplaceNL’s PRIME program, employers can impact the assessments they pay by meeting their practice requirements under the practice incentive component and managing their claim costs under the experience incentive component. The practice component recognizes employers for good occupational health and safety and return-to-work practices through a five percent refund on their average calculated base assessments. Since this program came into effect in 2005, employers have earned $61.5 million in PRIME practice refunds. In addition, employers have earned a net of $50.0 million in PRIME experience incentives. The net refund position is indicative of the decline in the lost-time incidence rate.
The ultimate amount of practice and experience incentives for the 2017 PRIME program year will not be known until the processing and subsequent audits of employer payroll statement data is completed later in 2018. WorkplaceNL estimates that employers will qualify for practice incentive refunds of $6.4 million in 2018 based on their 2017 performance and their qualifying experience incentive, net of experience charges, will be $6.1 million. While the percentage of
2008 2009 2010 2011 2012 2013 2014 2015 2016 2017
9.0 8.0 7.0 6.05.04.03.02.01.00.0
5.2 5.5 5.76.4
7.07.6
8.08.5 8.4 8.3
Assessable Payroll
$ billions

WorkplaceNL - Annual Performance Report - 2017
53
employers qualifying for PRIME has increased over time, the value of the refunds available has declined to due to lower assessment rates and assessable payroll.
Revenues from self-insured employers increased by 1.5 per cent to $10.4 million in 2017 (2016 - $10.2 million).
Investment Income
Investment income includes dividends and interest from the Injury Fund portfolio and short-term investments, as well as gains and losses arising from changes in the market value of the investment fund. In accordance with IFRS, both realized and unrealized gains and losses are included in investment income.
In 2017, the Injury Fund had a rate of return of 9.2 per cent compared with a policy return of 8.6 per cent and an 8.5 per cent return in the previous year. In 2017, WorkplaceNL realized investment income of $124.6 million, compared to $104.5 million in 2016. There was a 3.2 per cent decrease in interest and dividends from $28.0 million in 2016 to $27.1 million in 2017.
The remainder of the income is due to net gains realized on the sale of investments during the year, offset by declines in market value from the previous year-end
The Injury Fund’s Canadian equity asset class produced a 10.2 per cent return in 2017 compared with the S&P/TSX composite index which was up 9.1 per cent. The top performing sectors in the Canadian equity market were health care, consumer discretionary and industrials at 34.2 per cent, 22.8 per cent and 19.7 per cent, respectively. Overall eight of 11 sectors produced double digit returns in 2017. Energy was the only negative performing sector. The Injury Fund maintained a near market weight in health care and industrials and an overweight to consumer discretionary. The Injury Fund was slightly over-weight energy during 2017. The returns in Canadian equities were dampened due to stock selection.
The Global equity asset class produced a 14.0 per cent return in 2017 compared with the MCSI all country world index of 16.4 per cent. Emerging markets lead global performance with a 28.3 per cent return.
PRIME REFUNDS/CHARGES
($ millions) 2017 2016
Practice refunds paid 6.6 6.8 Practice refunds forfeited 2.5 2.6Practice refunds available 9.1 9.4 Experience refunds paid 10.9 10.7 Experience refunds forfeited 3.9 4.4 Experience refunds available 14.8 15.1
Experience charges (3.2) (2.9)
2017 Returns by Asset Class
RETURN
BENCHMARK
18%16%14%12%10%
8.0%6.0%4.0%1.0%0.0%
CANA
DIAN
EQ
UITY
GLOB
AL
EQUI
TY
INFR
ASTR
UCTU
RE
FIXE
D IN
COM
E
REAL
ESTA
TE
TOTA
L FUN
D

WorkplaceNL - Annual Performance Report - 2017
54
The Injury Fund’s exposure to Emerging market equity was limited during the year and was about 2.5 per cent of its total value at December 31, 2017. Despite having a signifi-cant exposure to a resurgent U.S. market, the Injury Fund underperformed the benchmark due to a combination of security selection and relative sector weights.
The Canadian fixed income asset class produced a 3.0 per cent return in 2017 compared with the FTSE TMX Canada Universe Bond Index return of 2.5 per cent. The Injury Fund fixed income asset class is invested in domestic bonds and was under-weight federal bonds, over-weight provincials and from a corporate perspective, exposure was reduced over the course of the year to slightly under-weight at year-end. Rising interest rates had a negative impact on performance of our bond allocation as yield curve strategies were slightly negative. In 2017, the mandate for one of the fixed income managers was changed to include emerging market debt and high yield corporate bonds which enhanced returns. The credit quality of the portfolio was also improved during the year.
The Injury Fund’s investment in global infrastructure is facilitated through a pooled fund of stock market listed companies that have specific exposures to infrastructure assets. The Injury Fund’s Global infrastructure asset class was introduced in April 2017. To the end of December 2017 the asset class produced a return of 2.1 per cent as compared to its benchmark of 1.6 per cent due to regional allocations and stock selection. The returns of the fund are hedged to the CAD.
The real estate investments generated an annual return of 10.6 per cent compared with the IPD all property index return of 7.2 per cent. The strong performance in 2017 is attributed to capital appreciation, as well as stable income return. From a geographic perspective, assets in British Columbia and Ontario continued to perform well while properties in Alberta generated lower but improving returns. From a sector standpoint, all property types performed well and were led by multi-unit residential assets. The portfolio was over-weight Ontario and multi-unit residential during the year. The returns on real estate were also enhanced because rising yields resulted in positive fair value accounting adjustments on the debt component of the portfolio.
Total Expenses 2017
WorkplaceNL’s total expenses include benefit costs, administrative expenses, legislated obligations, fees and interest, amortization and other expenses. Benefits for injured workers are the most significant component of WorkplaceNL’s expenses, which comprises 80 per cent (2016 – 79 per cent) of expenses, while administration expenses are approximately 12 per cent (2016 – 12 per cent) of the total.
80%
12%
4% 3%1%CLAIMS
ADMINISTRATION
LEGISLATED OBLIGATIONS
FEES AND INTEREST
AMORTIZATION
OTHER

WorkplaceNL - Annual Performance Report - 2017
55
Claims costs incurred
Claims costs incurred (expense), as reported in the Statement of Comprehensive Income, are actuarially determined and include the full cost of providing for all injuries that occurred in the current and prior years. Claims costs incurred increased $19.5 million (12.0 per cent) from $162.2 million in 2016 to $181.6 million in 2017. This was primarily due to a higher net impact of actuarial adjustments ($17.8 million) as compared to the prior year ($1.2 million).
Claims costs paid
Claims costs paid includes actual cash payments to injured workers for wage loss and other benefits, payments to health care providers for services rendered to injured workers and payments to suppliers for health care goods and devices, as reported in the Statement of Cash Flows. These amounts include payments made on behalf of self-insured employers. In total, these payments increased to $138.6 million in 2017, from $135.9 million in 2016. The average rate of increase from 2012 to 2017 has been 0.9 per cent.
Administrative and other expenses
In 2017, WorkplaceNL’s administration, amortization and other operational expenses declined 6.6 per cent from $29.9 million to $28.0 million. This reduction is a reflection of WorkplaceNL’s efforts to prudently manage its expenditures in light of the provincial economic and fiscal situation.
Legislated and other obligations
WorkplaceNL is required by legislation to fund the operating costs of the OHS Division of Service NL in delivering their occupational health and safety mandate, and all of the costs of operating the Workplace Health, Safety and Compensation Review Division. WorkplaceNL also provides funding to employer and worker advisor positions. Total legislated obligations and other commitments decreased by $0.8 million in 2017 to $7.2 million. The change was primarily driven by payments in 2016 for a health study on the impact of silica dust on iron ore mine workers in western Labrador.
OUTLOOK
The financial sustainability of the workers’ compensation system in Newfoundland and Labrador continued to improve in 2017 as WorkplaceNL achieved a funded status of 131.6 per cent (2016 – 126.1 per cent). In March 2018, the Government of Newfoundland and Labrador enacted legislation to amend the Act to increase the income replacement rate for injured workers in Newfoundland and Labrador, or their dependents, from 80 per cent to 85 per cent. This amendment will increase the benefit liability by approximately $67.9 million, and reduce the funded ratio by 7.4 per cent to 124.2 per cent. Notwithstanding the impact of this benefit improvement, continued declines in the projected cost of new injuries enabled the Board to implement a reduction in the average base assessment rate for 2018 from $2.06 to $1.90 per $100 of assessable payroll, which will result in a reduction in projected assessments revenue of $12.6 million.

WorkplaceNL - Annual Performance Report - 2017
56
WorkplaceNL has reached an agreement with its unionized employees to discontinue severance, and pay out accumulated benefits by March 31, 2019. While this will have a cash flow impact, it will not affect the WorkplaceNL’s financial position since the liability had already been reflected in its financial statements.
The Conference Board of Canada projects that the Newfoundland and Labrador economy will rebound in 2018 and 2019 from an overall GDP perspective, due to new oil production. However, employment is expected to decline as megaprojects are completed and new projects coming on line are insufficient to replace lost employment opportunities. WorkplaceNL is forecasting assessable payrolls in 2018 to be about 4.7 per cent below those in 2017, which will lead to a further reduction in assessments revenue of $7.3 million.
WorkplaceNL is reviewing its mental stress policy and coverage for post-traumatic stress disorder (PTSD). Enhancements in coverage for mental stress and PTSD will increase the cost of injuries. The degree of impact will depend on the nature of the policy changes and scope of coverage. Otherwise, claims expenses are expected to remain stable, however, diminishing employment prospects in the province and improvements in injured worker benefits could affect claiming patterns.
The value of the Injury Fund has decreased by $4.5 million (0.3 per cent) over the first two months of 2018. WorkplaceNL will continue to rely on its diversified investment approach to mitigate capital market risks and uncertainty.

WorkplaceNL - Annual Performance Report - 2017
02
2017 FINANCIAL STATEMENTS
58 Management responsibility for financial reporting
59 Actuarial statement of opinion
60 Independent Auditors' report
61 Statement of financial position

WorkplaceNL - Annual Performance Report - 2017
58
The accompanying financial statements of WorkplaceNL have been prepared by management, who is responsible for the integrity and fairness of the information presented, including significant accounting judgments, estimates and actuarial assumptions. This responsibility includes selecting appropriate accounting principles and actuarial assumptions consistent with International Financial Reporting Standards. Financial information contained elsewhere in this Annual Performance Report is consistent with these financial statements.
In discharging its responsibility for the integrity and reliability of the financial statements, management maintains a system of internal controls designed to provide reasonable assurance that relevant and reliable financial information is produced and that assets are properly safeguarded. The Internal Auditor performs audits designed to test the adequacy and consistency of WorkplaceNL’s internal controls, practices and procedures.
The Board of Directors oversees management’s responsibility for financial reporting through its Financial Services Committee, which recommends approval of the financial statements. The Financial Services Committee oversees the external audit of WorkplaceNL’s annual financial statements and the accounting and financial reporting and disclosure processes and policies of WorkplaceNL. The Financial Services Committee of the Board meets with management, the independent consulting actuary and the independent auditors to discuss the results of the external audit, the adequacy of internal accounting controls and the quality and integrity of financial reporting. WorkplaceNL’s Board of Directors has approved the financial statements included in this Annual Performance Report.
Morneau Shepell Inc. has been appointed as independent consulting actuary to WorkplaceNL. Its role is to complete an independent actuarial valuation of the benefit liabilities of WorkplaceNL annually and to report thereon in accordance with accepted actuarial principles. Ernst & Young LLP, the independent auditors of WorkplaceNL, have performed an audit of the 2017 financial statements of WorkplaceNL in accordance with Canadian generally accepted auditing standards and their report follows.
Management responsibility for financial reporting
___________________________________
Paul KavanaghChief Financial & Information Officer
___________________________________
Dennis HoganChief Executive Officer

WorkplaceNL - Annual Performance Report - 2017
59
Actuarial Statement of Opinion
We have completed the actuarial valuation of the benefit liabilities of the Workplace Health, Safety and Compensation Commission of Newfoundland and Labrador (“WorkplaceNL”) as at December 31, 2017 (the “valuation date”). The valuation is based on the provisions of the Workplace Health, Safety and Compensation Act of Newfoundland and Labrador (the “Act”) and on WorkplaceNL’s policies and practices in effect on the valuation date. The valuation also considers the virtually definitive pending amendment to increase the income replacement rate to 85% for certain benefits under the Act.
The estimate of the actuarial liabilities for assessed employers as at the valuation date is $1,178,176,000. This figure is comprised of $1,110,318,000 for the benefit structure as at the valuation date and $67,858,000 for the pending increase in the income replacement rate to 85%. The actuarial liabilities include provisions for benefits and administration expenses expected to be paid after the valuation date for accidents that occurred on or before the valuation date. They also includes a provision for potential long-latency occupational disease claims associated with exposure that occurred on or before the valuation date. Self-insured employers are not included in this valuation.
Details of the data, actuarial assumptions, valuation methods and results are included in the actuarial valuation report as at the valuation date, of which this statement of opinion forms part. In our opinion:
1. The data on which the valuation is based are sufficient and reliable for the purpose of the valuation. Data for the valuation were supplied by WorkplaceNL in accordance with specifications provided by us and we applied such checks of reasonableness of the data as we considered appropriate.
2. The assumptions are appropriate for the purpose of the valuation. The economic assumptions are consistent with the long-term financial strategy and long-term investment policies of WorkplaceNL.
3. The methods employed in the valuation are appropriate for the purpose of the valuation.
4. The amount of the actuarial liabilities makes appropriate provision for all personal injury compensation obligations and the financial statements fairly present the results of the valuation.
5. This report has been prepared, and our opinions given, in accordance with accepted actuarial practice in Canada.
Mark Simpson, F.C.I.A. Morneau Shepell Ltd. March 13, 2018
This report has been peer reviewed by Thane MacKay, F.C.I.A.

WorkplaceNL - Annual Performance Report - 2017
60
INDEPENDENT AUDITORS' REPORT
To the Board of Directors Workplace Health, Safety and Compensation Commission
We have audited the accompanying financial statements of Workplace Health, Safety
and Compensation Commission, which comprise the statement of financial position as at December 31, 2017 and the statements of comprehensive income, changes in funded position, and cash flows for the year then ended, and a summary of significant accounting policies and other explanatory information.
Management's responsibility for the financial statements Management is responsible for the preparation and fair presentation of these financial statements in accordance with International Financial Reporting Standards, and for such internal control as management determines is necessary to enable the preparation of financial statements that are free from material misstatement, whether due to fraud or error.
Auditors’ responsibility Our responsibility is to express an opinion on these financial statements based on our audit. We conducted our audit in accordance with Canadian generally accepted auditing standards. Those standards require that we comply with ethical requirements and plan and perform the audit to obtain reasonable assurance about whether the financial statements are free from material misstatement.
An audit involves performing procedures to obtain audit evidence about the amounts and disclosures in the financial statements. The procedures selected depend on the auditors’ judgment, including the assessment of the risks of material misstatement of the financial statements, whether due to fraud or error. In making those risk assessments, the auditors consider internal control relevant to the entity's preparation and fair presentation of the financial statements in order to design audit procedures that are appropriate in the circumstances, but not for the purpose of expressing an opinion on the effectiveness of the entity's internal control. An audit also includes evaluating the appropriateness of accounting policies used and the reasonableness of accounting estimates made by management, as well as evaluating the overall presentation of the financial statements.
We believe that the audit evidence we have obtained is sufficient and appropriate to provide a basis for our audit opinion.
Opinion In our opinion, the financial statements present fairly, in all material respects, the financial position of Workplace Health, Safety and Compensation Commission as at December 31, 2017 and its financial performance and cash flows for the year then ended in accordance with International Financial Reporting Standards.
St. John’s, Canada April 5, 2018

WorkplaceNL - Annual Performance Report - 2017
61
Statement of FINANCIAL POSITION
as at December 31
(thousands of dollars) 2017 2016
Assets
Cash, cash equivalents and short-term investments $ 19,979 $ 46,074 Accounts receivable [note 5] 10,519 9,029 Investments [note 6] 1,454,479 1,327,062 Property, plant and equipment [note 9] 8,037 8,253 Intangible assets [note 10] 15,300 14,824
$ 1,508,314 $ 1,405,242
Liabilities
Accounts payable and accrued liabilities [note 12] 28,059 30,334 Employee future benefits [note 15] 7,471 7,002 Benefit liabilities [note 14] 1,110,318 1,076,822
1,145,848 1,114,158
Fund balance 362,466 291,084
$ 1,508,314 $ 1,405,242
Commitments [note 23]
Authorized for issue on March , 2018 on behalf of the Board of Directors
________________________________ Gregory Viscount Director
________________________________John Peddle Chairperson
See accompanying notes.

WorkplaceNL - Annual Performance Report - 2017
62
Statement of COMPREHENSIVE INCOME
Year ended December 31
(thousands of dollars) 2017 2016
Revenue
Assessments revenue [note 13] $ 166,293 $ 183,830 Investment income [note 7] 124,594 104,487 Third-party recoveries 3,053 1,648
293,940 289,965
Expenses
Claims costs incurred [note 14] Short-term disability 32,784 31,816 Long-term disability 65,651 65,599 Survivor benefits 4,736 3,987 Health care 47,462 47,872 Rehabilitation 1,177 1,143 Actuarial adjustments 17,777 1,213 Future administration costs 12,039 10,532
181,626 162,162
Administration [note 16] 24,634 25,642 Legislated obligations [note 17] 7,153 7,951 Fees and interest, net [note 11] 5,738 5,245 Amortization and depreciation [notes 9 and 10] 2,996 3,703 Other expenses [note 18] 308 597
222,455 205,300
Operating surplus 71,485 84,665
Other comprehensive (loss ) income
Remeasurement of employee future benefits [note 15] (38) (78)
Total comprehensive income $ 71,447 $ 84,587
See accompanying notes.

WorkplaceNL - Annual Performance Report - 2017
63
Statement of CHANGES IN FUNDED POSITION
Year ended December 31
(thousands of dollars) 2017 2016
Accumulated operating surplus Balance, beginning of year $ 291,215 $ 206,550 Operating surplus 71,485 84,665
362,700 291,215
Accumulated other comprehensive loss Balance, beginning of year (681) (603) Other comprehensive loss (38) (78)
(719) (681)
Reserves Occupational Health and Safety Research [note 19] 485 550
Fund balance, end of year $ 362,466 $ 291,084
See accompanying notes.

WorkplaceNL - Annual Performance Report - 2017
64
Statement of CASH FLOWS
Year ended December 31
(thousands of dollars) 2017 2016
Cash flow from operating activities
Cash received from: Employers, for assessments $ 164,803 $ 184,999 Third parties 3,053 1,649
167,856 186,648 Cash paid to: Claimants or third parties on their behalf (138,619) (135,903) Suppliers and employees, for administrative and other goods and services (40,452) (42,396) Investment manager, interest & other fees (5,738) (5,245)
(184,809) (183,544)
Net cash (used in) provided by operating activities (16,953) 3,104
Cash flows from investing activities
Cash received from: Interest 13,162 11,039 Dividends 14,246 17,359 Sale of investments 950,127 321,846
977,535 350,244 Cash paid for: Purchase of investments (983,418) (349,810) Purchase of property, plant and equipment (444) (433) Purchase of intangible assets (2,815) (2,231)
(986,677) (352,474)
Net cash used for investing activities (9,142) (2,230)
Net change in cash and cash equivalents (26,095) 874
Cash and cash equivalents Beginning of year 46,074 45,200
End of year $ 19,979 $ 46,074 See accompanying notes.

WorkplaceNL - Annual Performance Report - 2017
65
Notes to FINANCIAL STATEMENTS
1. NATURE OF OPERATIONS
The Workplace Health, Safety and Compensation Commission (WorkplaceNL) was established by the Newfoundland Legislature in 1951, under the Workplace Health, Safety and Compensation Act (the Act), as amended. WorkplaceNL is a legislative incorporated entity with no share capital. The main office of WorkplaceNL is located at 146-148 Forest Road, St. John’s, Newfoundland and Labrador, Canada. WorkplaceNL operates two regional offices in Newfoundland and Labrador in Grand Falls-Windsor and Corner Brook. WorkplaceNL is responsible for, in accordance with the provisions of the Act, preventing and reducing the occurrence of workplace injuries and diseases through the promotion of health and safety in workplaces; the establishment of occupational health and safety certification standards and certification of trainers; facilitating the claims management process and administering the payment of benefits to injured workers and dependents of fatally injured workers; levying and collecting assessment revenues from established classes of employers in amounts sufficient to cover the current and future costs of existing claims; and investing funds, following investment policies which are approved by WorkplaceNL within guidelines established under the Insurance Companies Act (Canada). An independent Workplace Health, Safety and Compensation Review Division is established under the Act to make rulings on any appeals pertaining to WorkplaceNL assessment or benefit decisions. WorkplaceNL does not receive government funding or other assistance. The funds, investments and income of WorkplaceNL are free from taxation pursuant to Section 10(2) of the Act.
2. BASIS OF PREPARATION
Statement of Compliance These financial statements have been prepared in accordance with International Financial Reporting Standards (IFRS). Going concern WorkplaceNL has assessed the relevant financial and economic indicators and has determined that there is an ability to operate as a going concern, as supported by the funding strategy to maintain a funded ratio between 100% and 120% [note 24]. Basis of measurement
The financial statements have been prepared on the historical cost basis unless otherwise explained in the significant accounting policies below. Historical cost is based on the fair value of the consideration given in exchange for assets. The financial statements are presented in Canadian currency.

WorkplaceNL - Annual Performance Report - 2017
66 3. SIGNIFICANT ACCOUNTING POLICIES AND STANDARDS ISSUED BUT NOT YET EFFECTIVE
Significant Accounting Policies
Cash and cash equivalents and short-term investments Cash and cash equivalents and short-term investments include cash at banks and on hand, bank overdrafts and money market instruments. Those assets with original maturity dates at time of purchase of three months or less are classified as cash equivalents, whereas those with original maturities beyond 3 months, and less the 12 months are classified as short-term investments. Cash, cash equivalents and short-term investments are measured at fair value. Cash equivalents bear interest rates of 0.60% - 1.25% [2016 - 0.60% - 0.95%]. Assessments revenue At the beginning of each year, an assessment is levied on employers by applying their industry assessment rate to their estimated payrolls at which point revenue is recognized. The assessment levy is payable by installments within the current year. At year-end, assessment revenue is adjusted based on a review of the employers’ actual payrolls, as well for the estimate of practice and experience incentive refunds which are payable to the employers under the Prevention & Return to Work Insurance Management for Employers/ Employees Program (PRIME). Assessment revenue also includes payments from self-insured employers, who directly bear the costs of their own incurred claims and their share of administration costs. Accounts receivable A provision for accrued assessments is included in accounts receivable based on historical assessment information. Actual employers’ payrolls may differ from estimates. The allowance for doubtful accounts is comprised primarily of outstanding balances older than two years. Property, plant and equipment Property, plant and equipment are reported at cost, less accumulated amortization. These assets are amortized on a straight-line basis over their estimated useful lives, as follows: Building 40 years Furniture and equipment 10 years Computer equipment 1 to 5 years At the end of each reporting period, the useful lives of items of property, plant and equipment are reviewed and adjusted if required, and an assessment is made whether there is any indication of impairment. If an item of property, plant and equipment is determined to be impaired, its carrying value is reduced to the net recoverable amount. Intangible assets Intangible assets, which include purchased software and internally developed systems including systems not available for use, are recorded at cost. Assets in service are amortized monthly on a straight-line basis over their estimated useful lives of five to ten years. The amortization method and period are reviewed at the end of each reporting period. Intangible assets are assessed for impairment whenever there is an indicator that the intangible assets may be impaired. If an asset is determined to be impaired, its carrying value is reduced to the net recoverable amount.

WorkplaceNL - Annual Performance Report - 2017
67
3. SIGNIFICANT ACCOUNTING POLICIES AND STANDARDS ISSUED BUT NOT YET EFFECTIVE
(continued)
Benefit liabilities The benefit liabilities represent the actuarial present value of all future benefit payments expected to be made for injuries which occurred in the current fiscal year or in any prior year. The benefit liabilities include a provision for all benefits provided by current legislation, policies and/or business practices in respect of existing claims, as well as the estimated liability for latent occupational disease, an estimate for presumptive coverage for firefighters and a provision for the future costs of administering claims. The benefit liabilities were valued by an independent actuary using accepted actuarial practices in accordance with the standards established by the Canadian Institute of Actuaries. Benefit liabilities related to self-insured employers will be the responsibility of those employers when paid in future years. Accordingly, these benefit liabilities have not been determined by actuarial valuation and thus are not included in WorkplaceNL’s benefit liabilities. Foreign currency translation Assets and liabilities denominated in foreign currencies are translated into their Canadian dollar equivalent using exchange rates in effect on the reporting date. Revenues and expenses are translated using exchange rates in effect at the transaction date. Realized and unrealized exchange gains or losses are included in comprehensive income. Investments Investments are designated as fair value through profit or loss (FVTPL). Realized gains and losses on the sale of investments, and unrealized gains and losses arising from the change in fair value of the investments are recorded in investment income during the period in which they arise. All purchases and sales of investments are recognized on the dates the trades are executed. Income from interest and dividends are recorded as investment income in the period earned.
Financial instruments WorkplaceNL’s financial instruments consist of cash, cash equivalents and short term-investments, accounts receivable, investments, accounts payable and accrued liabilities. The carrying value of financial instruments, with the exception of investments, approximate fair value due to their immediate or short-term maturity and normal credit terms. Losses arising from impairment of accounts receivable are recognized in the statement of operations in fees and interest expense. Financial assets and liabilities are initially recognized at fair value. Financial instruments are classified as follows for purposes of subsequent measurement:

WorkplaceNL - Annual Performance Report - 2017
68
3. SIGNIFICANT ACCOUNTING POLICIES AND STANDARDS ISSUED BUT NOT YET
EFFECTIVE (continued)
Asset/Liability Classification Measurement
Cash, cash equivalents & short-term investments FVTPL Fair Value Accounts receivable Loans and receivables Amortized cost Investments FVTPL Fair value Accounts payables and accrued liabilities Other liabilities Amortized cost
Fair value is the price that would be received to sell an asset or paid to transfer a liability in an orderly transaction between market participants at the measurement date. Financial instruments are classified using a fair value hierarchy that reflects the significance of the inputs used in making the measurements.
Level 1 Valuation based on quoted prices [unadjusted] in active markets for identical
assets or liabilities. Level 2 Valuation techniques based on inputs other than quoted prices included in
Level 1 that are observable for the asset or liability, either directly [i.e., as prices] or indirectly [i.e., derived from prices].
Level 3 Valuation techniques using inputs for the asset or liability that are not based on
observable market data [unobservable inputs]. WorkplaceNL uses valuation techniques that are appropriate in the circumstances and for which sufficient data are available to measure fair value, maximizing the use of relevant observable inputs and minimizing the use of unobservable inputs. Financial instruments included in level 1 of the fair value hierarchy consist of cash and cash equivalents and equities. All other financial instruments are included in level 2. WorkplaceNL determines whether transfers have occurred between levels in the hierarchy for reassessing categorization at the end of each reporting period. The fair value of publicly traded investments is based on quoted prices from security exchanges, while that of domestic real estate investment funds and pooled fund units are valued at their year-end net asset value, based on associated net asset value transactions. There are pooled unit funds in both the fixed term and equity investments [Note 6].
Employee future benefits Employees participate in the Province of Newfoundland and Labrador’s Public Service Pension Plan (PSPP), a multi-employer defined benefit plan. The employer’s contributions are expensed as incurred. WorkplaceNL is neither obligated for any unfunded liability, nor entitled to any surplus that may arise in this plan. WorkplaceNL’s share of the future contributions are dependent upon the funded position of the PSPP.

WorkplaceNL - Annual Performance Report - 2017
69
SIGNIFICANT ACCOUNTING POLICIES AND STANDARDS ISSUED BUT NOT YET EFFECTIVE
(continued)
WorkplaceNL provides a payout of accumulated annual leave balances and a severancepayment upon retirement, resignation or termination without cause. The expected costs ofproviding these employee future benefits are accounted for on an accrual basis and have beenactuarially determined using the projected benefit method prorated on service, andmanagement’s best estimate of wage inflation, and retirement ages of employees. Discountrates are based on the market yields of high quality corporate bonds. Actuarial gains and lossesare recognized immediately through other comprehensive income in the period in which theyoccur. Remeasurements are not reclassified to profit or loss in subsequent periods. Thesebenefits are unfunded.
Third-party recoveriesIn certain circumstances, under Section 45 of the , WorkplaceNL is deemed to be an assigneeof a cause of action in respect of a claimant disability. The amount by which settlements exceedthe cost of the action, including administration and future benefit entitlement, is paid to theworker or dependents. Amounts received from third-party recoveries are recorded in the yearduring which the settlement occurs. No provision is made in the benefit liability for possiblefuture third-party recoveries due to their contingent nature.
ReservesIn accordance with Section 20.5 (1) of the WorkplaceNL maintains a special reserve fundfor the purpose of health and safety research. The Act permits WorkplaceNL to allocate upto a maximum of 2% of its total assessment and investment income in each calendar year toestablish and maintain this special reserve fund.
In accordance with Section 116 (1) of the , WorkplaceNL may, at its discretion, establishreserves for the following:
To meet an increase in the capitalization of compensation payments payable in futureyears where the increase cannot be provided without placing an undue burden on theemployers in an industrial classification;To meet the loss arising from a disaster or other circumstances which would unfairlyburden the employers in an industrial classification; orSubject to the approval of the Lieutenant-Governor in Council, to meet the costs ofparticular needs of WorkplaceNL that it considers necessary.
Standards issued but not yet effective
The standards and interpretations that are issued, but not yet effective, up to the date of issuance of WorkplaceNL’s financial statements are disclosed below. WorkplaceNL intends to adopt these standards, if applicable, when they become effective.
IFRS 9 Financial Instruments In July 2014, the IASB issued the final version of IFRS 9 Financial Instruments that replaces IAS 39 Financial Instruments: Recognition and Measurement and all previous versions of IFRS 9. IFRS 9 brings together all three aspects of the accounting for financial instruments project: classification and measurement, impairment and hedge accounting. IFRS 9 is effective for annual periods

WorkplaceNL - Annual Performance Report - 2017
70
3. SIGNIFICANT ACCOUNTING POLICIES AND STANDARDS ISSUED BUT NOT YET EFFECTIVE
(continued)
beginning on or after 1 January 2018, with early adoption permitted. Retrospective application is required but providing comparative information is not compulsory. WorkplaceNL had early adopted IFRS 9 (2010) in 2011 and does not expect any significant impact on its financial statements from applying this final version of the standard.
IFRS 15 Revenue from Contracts with Customers IFRS 15 was issued in May 2014 and establishes a five-step model to account for revenue arising from contracts with customers. Under IFRS 15, revenue is recognised at an amount that reflects the consideration to which an entity expects to be entitled in exchange for transferring goods or services to a customer. The new revenue standard will supersede all current revenue recognition requirements under IFRS. Either a full retrospective application or a modified retrospective application is required for annual periods beginning on or after 1 January 2018. Early adoption is permitted. WorkplaceNL does not anticipate any significant impact arising from the adoption of this standard. IFRS 16 Leases IFRS 16 was issued in January 2016 and requires lessees to account for all leases under a single on-balance sheet model. At the commencement date of a lease, a lessee will recognise a liability to make lease payments and an asset representing the right to use the underlying asset during the lease term. Lessees will be required to separately recognise the interest expense of the lease liability and the depreciation expense of the right-of-use asset. Either a full retrospective or a modified retrospective approach is required for annual periods beginning on or after 1 January 2019. Early application is permitted, but not before an entity applies IFRS 15. WorkplaceNL is analyzing the impact this new standard will have on its financial statements. IFRS 17 Insurance Contracts In May 2017, the IASB issued IFRS 17 Insurance Contracts, a comprehensive new accounting standard for insurance contracts covering recognition and measurement, presentation and disclosure. The overall objective of IFRS 17 is to provide an accounting model for insurance contracts that is more useful and consistent for insurers. In contrast to the requirements in IFRS 4, which are largely based on grandfathering previous local accounting policies, IFRS 17 provides a comprehensive model for insurance contracts, covering all relevant accounting aspects. The core of IFRS 17 is the general model, supplemented by:
• A specific adaptation for contracts with direct participation features (the variable fee approach)
• A simplified approach (the premium allocation approach) mainly for short-duration contracts. WorkplaceNL is analyzing the effect that IFRS 17 will have on its financial statements.

WorkplaceNL - Annual Performance Report - 2017
71
4. SIGNIFICANT JUDGEMENTS, ESTIMATES AND ASSUMPTIONS
The preparation of WorkplaceNL’s financial statements requires management to make judgements, estimates and assumptions that affect the reported amounts of revenues, expenses, assets and liabilities, and the accompanying disclosures. Uncertainty about these assumptions and estimates could result in outcomes that require a material adjustment to the carrying amount of assets or liabilities affected in future periods.
Benefit liabilities
An actuarial valuation of the benefit liabilities is prepared by an independent firm of consulting actuaries who have rendered their opinion that the valuation was prepared in accordance with accepted actuarial practice, and that the actuarial assumptions are appropriate. A variety of estimation techniques are used in performing the valuation. They are generally based on statistical analyses of historical experience, which assume the development pattern of the current claims will be consistent with past experience. Due to the nature of the estimated liabilities for latent occupational disease and presumptive coverage for firefighters and the extent of historical information available, these liabilities by their nature are more uncertain than other benefit liabilities. WorkplaceNL believes that the amount provided for benefit liabilities as at December 31, 2017, is adequate, recognizing that actuarial methods and assumptions as disclosed in note 14 may change over time to reflect underlying economic trends. Changes in assumptions could have a material impact on the benefit liabilities. Assessments revenue Accounts receivable at year-end include an estimate of annual premium revenues for the year that have not yet been received from employers. The recorded amounts are based upon management’s best information and judgement, with regards to actual experience in preceding years. However, until all employers actually submit their final annual payroll information to WorkplaceNL, the recorded assessments revenues for the year and the estimated amounts receivable at year-end are subject to measurement uncertainty.
Employee future benefits
A valuation of severance and accumulated annual leave liabilities is prepared using the assumptions disclosed in note 15. Other disclosures relating to WorkplaceNL’s exposure to risks and uncertainties includes:
Financial risk management Note 8 Sensitivity analyses disclosures Notes 14 and 15

WorkplaceNL - Annual Performance Report - 2017
72
5. ACCOUNTS RECEIVABLE
(thousands of dollars) 2017 2016
Assessments $ 9,139 $ 7,959 Accrued assessments 356 1,051 Less: Allowance for doubtful accounts (2,070) (2,431)
7,425 6,579 Prepaid Expenses 1,562 1,289 Other 2,366 2,013 Less: Allowance for doubtful accounts (834) (852)
3,094 2,450 $ 10,519 $ 9,029
Aging of Assessment Receivable
(thousands of dollars)
Year Total Current <1 year 1-2 years
2017 $ 7,425 $ 4,551 $ 2,874 2016 $ 6,579 $ 4,299 $ 2,280
6. INVESTMENTS
Fair Value Hierarchy
(thousands of dollars) 2017 2016
Level 1
Cash and cash equivalents $ 30 $ 60
Domestic equities 302,190 418,156
Foreign equities 580,556 445,761
882,776 863,977
Level 2
Fixed term investments 424,075 341,013
Real Estate Funds 147,628 122,072
571,703 463,085
1,327,062
There have been no transfers between levels during 2017 [2016-Nil].
$ 1,454,479 $

WorkplaceNL - Annual Performance Report - 2017
73
7. INVESTMENT INCOME
Investment income is comprised of the following:
(thousands of dollars) 2017 2016
Interest and dividends $ 27,061 $ 27,966 Realized gain on sale of investments 259,950 47,353 Interest on short-term investments 346 432 Change in unrealized (loss) gain in fair market value of investments (162,763)
28,736
Investment income $ 124,594 $ 104,487
8. FINANCIAL RISK MANAGEMENT
WorkplaceNL manages its investment portfolio in accordance with its Long-term InvestmentPolicy. The investment risk inherent in an investment portfolio is managed through diversificationin both asset classes and investments within each asset class. WorkplaceNL also engages anumber of different fund managers with a broad range of investment philosophies and styles.
The Board of Directors is ultimately responsible for the governance and strategic directionof WorkplaceNL’s investments through its review and approval of the Long-term InvestmentPolicy and ensuring adherence to the policy. Management is responsible for monitoringperformance, regular reporting to the Board, and recommending changes in the investmentpolicy or fund managers. The Board and Management use the services of an external consultantto benchmark the performance of fund managers and to provide advice on investmentpolicies and practices. The following sections describe the key financial risk exposures andmanagement strategies to mitigate these risks.
Credit riskCredit exposure on fixed income securities arises from the possibility that the issuer of aninstrument fails to meet its obligation to make interest payments and repay principal.WorkplaceNL does not anticipate that any issuers will fail to meet their obligations. The creditratings of WorkplaceNL’s fixed term investments at December 31 are listed in the table below.

WorkplaceNL - Annual Performance Report - 2017
74
8. FINANCIAL RISK MANAGEMENT (continued)
(thousands of dollars) 2017 2016
Credit Rating
Cash & Short term notes $ 25,162 5.9% $ 22,427 6.6% AAA 132,986 31.4% 46,800 13.7% AA 143,405 33.8% 101,637 29.8% A 61,530 14.5% 72,029 21.1% BBB 45,711 10.8% 64,448 18.9% BB and below 15,281 3.6% 33,672 9.9%
$ 424,075 100.0% $ 341,013 100.0%
WorkplaceNL may also invest in short-term commercial debt or paper rated R1 in accordance with Dominion Bond Rating Service. Provincial short-term debt and debt of agencies guaranteed by the provinces may be rated lower than R1. The short-term portfolio investments held with any one corporate issuer is limited to 10%, at any given time, of WorkplaceNL’s estimated annual cash receipts.
Currency risk Currency risk is the risk that the value of financial assets and liabilities denominated in foreign currencies will fluctuate due to changes in their respective exchange rates compared to the Canadian dollar. Investments denominated in foreign currency are translated into Canadian dollars at the exchange rate in effect at the reporting date. Funds significantly invested in foreign denominated fixed-term investments manage their foreign exchange exposure through forward foreign exchange and future contracts. Hedge accounting has not been applied to hedging arrangements.
As at December 31, 2017, WorkplaceNL’s holdings in foreign equities and pooled equity funds had a market value of $580.6 million [2016 - $445.8 million] representing 39.9% [2016 – 33.6%] of the market value of the total investment portfolio.
The table below presents the impact on comprehensive income of a 10% appreciation in the value of the Canadian dollar on the value of the equity portfolio.
(thousands of dollars) 2017 2016
CAD/US Dollar $ (28,570) $(28,173)
CAD/EURO (3,499) (4,265)
CAD/Japanese Yen (3,764) (3,271)
CAD/ British Pound (2,986) (2,321)
CAD/Swiss Franc (698) (820)
CAD/Hong Kong Dollar (1,108) (1,008)
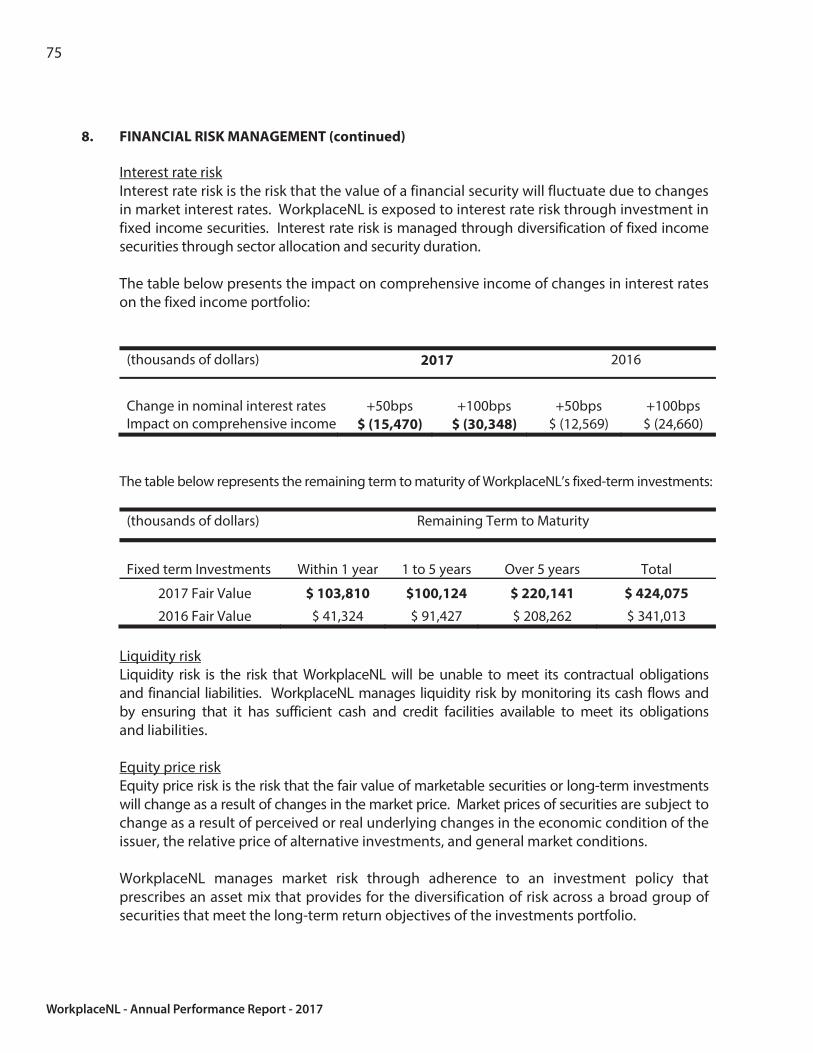
WorkplaceNL - Annual Performance Report - 2017
75
8. FINANCIAL RISK MANAGEMENT (continued)
Interest rate risk Interest rate risk is the risk that the value of a financial security will fluctuate due to changes in market interest rates. WorkplaceNL is exposed to interest rate risk through investment in fixed income securities. Interest rate risk is managed through diversification of fixed income securities through sector allocation and security duration. The table below presents the impact on comprehensive income of changes in interest rates on the fixed income portfolio:
(thousands of dollars) 2017 2016
Change in nominal interest rates +50bps +100bps +50bps +100bps Impact on comprehensive income $ (15,470) $ (30,348) $ (12,569) $ (24,660)
The table below represents the remaining term to maturity of WorkplaceNL’s fixed-term investments:
(thousands of dollars) Remaining Term to Maturity
Fixed term Investments
Within 1 year
1 to 5 years
Over 5 years
Total
2017 Fair Value $ 103,810 $100,124 $ 220,141 $ 424,075
2016 Fair Value $ 41,324 $ 91,427 $ 208,262 $ 341,013 Liquidity risk Liquidity risk is the risk that WorkplaceNL will be unable to meet its contractual obligations and financial liabilities. WorkplaceNL manages liquidity risk by monitoring its cash flows and by ensuring that it has sufficient cash and credit facilities available to meet its obligations and liabilities. Equity price risk Equity price risk is the risk that the fair value of marketable securities or long-term investments will change as a result of changes in the market price. Market prices of securities are subject to change as a result of perceived or real underlying changes in the economic condition of the issuer, the relative price of alternative investments, and general market conditions. WorkplaceNL manages market risk through adherence to an investment policy that prescribes an asset mix that provides for the diversification of risk across a broad group of securities that meet the long-term return objectives of the investments portfolio.

WorkplaceNL - Annual Performance Report - 2017
76
8. FINANCIAL RISK MANAGEMENT (continued)
The table below presents the impact on comprehensive income of a material change in the key risk variable measured as 1 or 2 standard deviations (std dev) of the sector benchmark, for each of the equity mandates in WorkplaceNL’s equity portfolio.
(thousands of dollars) 2017 2016
Equities 1 std dev 2 std dev 1 std dev 2 std dev % Change in market benchmark
(7.5%) (15.0%) (8.4%) (16.8%)
Canadian equity $ (21,108) $ (39,459) $ (32,330) $ (60,021) % Change in market benchmark
(9.1%) (18.3%) (9.1%) (18.3%)
All world equity $ (36,665) $ (67,669) $ (37,288) $ (68,820)
9. PROPERTY, PLANT AND EQUIPMENT
(thousands of dollars) 2017
Opening
Balance
Additions/
Depreciation Disposals
Closing
Balance
Cost
Land $ 3,000 $ - $ - $ 3,000
Buildings 10,844 49 - 10,893
Furniture & equipment 2,806 39 (6) 2,839
Computer equipment 4,300 356 (389) 4,267
Total 20,950 444 (395) 20,999
Accumulated Depreciation
Buildings 6,928 200 - 7,129
Furniture & equipment 2,516 55 (6) 2,565
Computer equipment 3,253 405 (389) 3,269
Total 12,697 660 (395) 12,962
Net Book Value $ 8,253 $ (217) $ 0 $ 8,037

WorkplaceNL - Annual Performance Report - 2017
77
9. PROPERTY, PLANT AND EQUIPMENT (continued)
(thousands of dollars) 2016
Opening
Balance
Additions/
Depreciation Disposals
Closing
Balance
Cost
Land $ 3,000 $ - $ - $ 3,000Buildings 10,844 - - 10,844 Furniture & equipment 2,781 34 (9) 2,806Computer equipment 4,215 399 (314) 4,300Total 20,840 433 (323) 20,950
Accumulated
Depreciation
Buildings 6,729 199 - 6,928Furniture & equipment 2,468 56 (8) 2,516Computer equipment 3,094 472 (313) 3,253
Total 12,291 727 (321) 12,697
Net Book Value $ 8,549 $ (294) $ (2) $ 8,253
10. INTANGIBLE ASSETS
(thousands of dollars) Cost Accumulated Amortization
Net Book Value
Balance at January 1, 2016 $ 31,548 $ (15,979) $ 15,569 Additions 2,231 - 2,231Disposals (14) 14 - Amortization - (2,976) (2,976) Balance at December 31, 2016 $ 33,765 $ (18,941) $ 14,824
Additions 2,815 - 2,815
Disposals (2,294) 2,291 (3)
Amortization - (2,336) (2,336)
Closing balance, December 31,2017
$ 34,286 $ (18,986) $ 15,300
Intangible assets include $2,042,298 [2016 - $1,397,734] related to internally developed software which is not yet available for use.

WorkplaceNL - Annual Performance Report - 2017
78
11. FEES AND INTEREST
Fees and interest are comprised of the following:
(thousands of dollars) 2017 2016
Fund managers’ investment fees $ 5,721 $ 5,282 Banking fees 64 95 Bad debt recovery (61) (174)Interest paid to claimants 14 42
Fees and interest, net $ 5,738 $ 5,245
WorkplaceNL has established an operating line of credit with its banker in the amount of $20,000,000. Advances on the line of credit bear interest at the bank’s prime interest rate less 50 basis points. The credit facility is unsecured and was not utilized during 2017. No amount was outstanding at December 31, 2017 and 2016.
12. ACCOUNTS PAYABLE AND ACCRUED LIABILITIES
(thousands of dollars) 2017 2016
Accounts payable $ 6,619 $ 7,431 PRIME program 16,321 17,119 Amounts due to employees 507 607 Credit balances due to employers 4,612 5,177
$ 28,059 $ 30,334
13. ASSESSMENTS REVENUE
WorkplaceNL administers the for two groups of employers, referred to as assessment-based employers and self-insured employers. Assessment-based employers are insuredthrough collective liability and are required to contribute to WorkplaceNL’s njury und,whereas self-insured employers are individually liable. WorkplaceNL pays the actual cost ofclaims for self-insured employers and bills them on a monthly basis for payments related to:short-term disability, including rehabilitation; health care; long-term disability, includingpermanent functional impairment awards; and survivor benefits, together with theirproportionate share of administration costs.

WorkplaceNL - Annual Performance Report - 2017
79
13. ASSESSMENTS REVENUE (continued)
(thousands of dollars) 2017 2016
Gross assessed employers $ 167,230 $ 186,564 Assessment reporting penalties & interest 832 933 PRIME refunds (12,125) (13,871) Net assessment revenue Self-insured employers [note 22]
155,937
10,356
173,626 10,204
Total $ 166,293 $ 183,830

WorkplaceNL - Annual Performance Report - 2017
80
14
.B
EN
EF
IT L
IAB
ILIT
IES
AN
D C
LA
IMS
CO
ST
S
(tho
usan
ds o
f dol
lars
) 20
17
2016
Sh
ort-
term
di
sabi
lity
Long
-ter
m
disa
bilit
y Su
rviv
or
bene
fits
H
ealth
car
e Re
habi
lit-
atio
n
Futu
re
Adm
in.
Cost
To
tal
Tota
l
Bala
nce,
beg
inni
ng o
f yea
r $
61,5
41
$ 55
4,03
7 $
50,6
60
$ 32
2,98
6 $
3,23
9
$ 84
,359
$1
,076
,822
$
1,05
9,86
1 A
dd:
Cla
ims
cost
s in
curr
ed:
Cur
rent
–yea
r inj
urie
s 28
,818
31
,039
1,
612
27,2
42
992
7,39
5 97
,098
95
,178
P
rior y
ears
’ inj
urie
s 1,
062
3,77
4 34
4 2,
279
15
- 7,
474
7,40
7 I
nter
est e
xpen
se
2,90
3 30
,838
2,
780
17,9
42
170
4,64
4 59
,277
58
,365
32
,783
65
,651
4,
736
47,4
63
1,17
7 12
,039
16
3,84
9 16
0,94
9 D
educ
t:
C
laim
s pa
ymen
ts:
Cur
rent
–yea
r inj
urie
s 10
,003
57
7 14
1 8,
549
2 -
19,2
72
19,1
03
Prio
r yea
rs’ i
njur
ies
24,8
50
54,4
37
6,36
2 33
,049
65
1 9,
509
128
,858
12
6,09
8
34,8
53
55,0
14
6,50
3
41,5
98
653
9,50
9
148,
130
145,
201
A
ctua
rial a
djus
tmen
ts:
Cla
ims
expe
rienc
e di
ffere
nt
th
an e
xpec
ted
6
,530
(7
,643
)
631
1,2
27
(28
4)
16
477
(1
6,78
2)
Inf
latio
n lo
wer
than
exp
ecte
d
-
(1
,900
)
(30
0)
-
-
-
(2,2
00)
(3,
300)
C
hang
es in
Val
uatio
n M
etho
ds &
Ass
umpt
ions
-
1,40
0
-
4,1
00
- 18
,600
2
4,10
0
(2,
600)
F
irefig
hter
Pre
sum
ptiv
e Ca
ncer
-
-
- -
- -
-
31,5
00
Oth
er g
ains
/loss
es
1
00
(3
,300
)
(500
)
(
900)
-
-
(4,6
00)
(
7,60
5)
Sub-
tota
l 6,
630
(1
1,44
3)
(169
) 4,
427
(28
4)
18
,616
17,7
77
1,2
13
Bala
nce,
end
of y
ear
$ 66
,101
$
553
,231
$
48,7
24
$ 33
3,27
8 $
3,47
9 $
105,
505
$
1,11
0,31
8 $
1,07
6,82
2

WorkplaceNL - Annual Performance Report - 2017
81
14.
BE
NE
FIT
LIA
BIL
ITIE
S A
ND
CL
AIM
S C
OS
TS
(c
on
tin
ue
d)
Cla
ims
De
ve
lop
me
nt
The
tabl
e th
at fo
llow
s pre
sent
s the
dev
elop
men
t of t
he e
stim
ated
ulti
mat
e co
st o
f cla
ims a
nd c
laim
pay
men
ts fo
r acc
iden
t yea
rs 2
008-
2017
. Th
e to
p pa
rt o
f the
tabl
e ill
ustr
ates
how
the
estim
ate
of to
tal c
laim
s ben
efits
for e
ach
acci
dent
yea
r has
cha
nged
with
mor
e ex
perie
nce
over
succ
eedi
ng y
ear-
ends
. It
show
s the
est
imat
ed c
ost o
f cla
ims f
or a
n ac
cide
nt y
ear i
n th
e ye
ar o
f acc
iden
t, on
e ye
ar a
fter t
he y
ear o
f acc
iden
t, tw
o ye
ars a
fter t
he y
ear o
f ac
cide
nt, a
nd s
o on
and
com
pare
s th
e to
tal e
stim
ated
cos
t to
the
actu
al c
umul
ativ
e pa
ymen
ts o
ver t
he d
evel
opm
ent p
erio
d. D
ue to
the
extr
emel
y lo
ng d
urat
ion
of m
any
Wor
kpla
ceN
L be
nefit
s, sig
nific
ant a
mou
nts m
ay b
e pa
id o
ut in
the
dist
ant f
utur
e be
yond
the
valu
atio
n da
te.
The
bott
om p
art
of th
e ta
ble
reco
ncile
s the
tota
l out
stan
ding
ben
efits
am
ount
to th
e di
scou
nted
am
ount
repo
rted
in th
e st
atem
ent o
f fin
anci
al p
ositi
on.
(t
hous
ands
of d
olla
rs)
Ac
cid
en
t Y
ea
r 2
00
8
20
09
2
01
0
20
11
2
01
2
20
13
2
01
4
20
15
2
01
6
20
17
T
ota
l
Est
imat
e o
f cu
mu
lati
ve
cla
ims:
At
en
d o
f acc
ide
nt
ye
ar
$ 14
9,56
9 $
186,
758
$ 14
7,61
4 $
154,
043
$ 14
4,02
7 $
145,
724
$ 14
8,55
9 $
140,
968
$ 14
1,52
4 $
144,
987
O
ne
ye
ar
late
r 13
9,34
3 16
6,30
8 14
2,51
5 13
3,84
2 13
3,66
8 13
5,00
5 14
3,55
2 13
1,83
3 13
0,88
3
T
wo
ye
ars
la
ter
132,
834
167,
581
141,
978
142,
934
124,
613
127,
222
133,
862
137,
732
T
hre
e y
ea
rs l
ate
r 13
4,95
2 17
0,56
6 14
0,66
2 13
6,20
2 13
0,08
8 12
6,03
8 13
8,18
0
F
ou
r y
ea
rs l
ate
r 13
7,10
6 17
0,50
1 14
4,68
4 13
3,43
4 12
0,46
1 12
8,06
3
Fiv
e y
ea
rs l
ate
r 13
4,11
4 16
7,64
9 14
6,84
6 13
0,59
0 12
2,00
9
S
ix y
ea
rs l
ate
r 13
4,32
0 17
4,28
1 14
6,72
2 13
0,73
8
Se
ve
n y
ea
rs l
ate
r 13
4,34
3 17
2,76
1 14
9,13
5
E
igh
t y
ea
rs l
ate
r 13
3,10
5 17
5,29
3
Nin
e y
ea
rs l
ate
r 13
2,77
1
E
stim
ate
of
cu
mu
lati
ve
cla
ims
132,
771
17
5,29
3
149,
135
13
0,73
8
122,
009
12
8,06
3 13
8,18
0 13
7,73
2 11
30,8
83
14
4,98
7
1,38
9,79
0
C
um
ula
tiv
e p
ay
me
nts
(71,
026)
(75
,028
) (
69,8
67)
(63
,405
)
(5
5,38
5)
(
53,0
35)
(
52,1
57)
(44,
534)
(3
6,60
1)
(17,
823)
(538
,861
)
E
stim
ate
of
futu
re
Pa
ym
en
ts
61,7
45
10
0,26
6
79,2
68
67
,332
66,6
24
75
,028
86
,023
93
,198
94
,282
12
7,16
4 85
0.92
9
2
00
7 a
nd
pri
or
ye
ars
87
8,85
4
Eff
ec
t o
f d
isc
ou
nti
ng
(826
,581
) O
cc
up
ati
on
al
dis
ea
se
72,2
56
Fir
efi
gh
ter
Pre
sum
pti
ve
Co
ve
rag
e
29
,354
C
laim
s A
dm
inis
tra
tio
n
10
5,50
5 B
en
efi
t L
iab
ilit
ies
at
De
ce
mb
er
31
, 2
01
7
$
1,1
10
,31
8

WorkplaceNL - Annual Performance Report - 2017
82
14. BENEFIT LIABILITIES AND CLAIMS COSTS (continued) The table below lists the principal assumptions used in the valuation of the benefits liabilities.
2017 2016
CPI-Indexed
awards
Other
payments
CPI-Indexed awards
Other payments
Gross rate of return / Discount rate
5.83%
5.83%
5.83%
5.83%
Inflation year 1 1.50% 2.25% 1.40% 2.25% Inflation later years 2.25% 2.25% 2.25% 2.25% Net rate of return year 1 4.26% 3.50% 4.37% 3.50% Net rate of return later years 3.50% 3.50% 3.50% 3.50%
Occupational disease 8.00% 8.00% 8.00% 8.00% Presumptive firefighters coverage 3.25% 3.25% 3.25% 3.25% Future administration 10.50% 10.50% 8.50% 8.50%
A description of the processes used to determine these assumptions is provided below: General statement Benefit liabilities are valued based on the primary assumption that the system will be in operation for the long term. Economic assumptions are formulated to be consistent with the funding and investment policies adopted by the Board. Demographic assumptions are chosen to reflect WorkplaceNL’s underlying experience and are updated over time as enough experience is available to suggest an underlying trend, rather than statistical fluctuations. Gross rate of return / Discount rate The gross rate of return represents the best estimate of the long-term average rate of return that can be expected based on the benchmark asset allocation adopted WorkplaceNL through its Long term Investments Policy. The weighted average real rate of return is compounded by the long-term expected average inflation rate to obtain the gross rate of return. Inflation The indexation rate for year one is known at the time of the valuation. WorkplaceNL calculates the change in the Consumer Price Index (CPI) for the 12 month period July – June, over the previous 12-month period July – June, and any resulting increase is applied beginning in January of the following year to dependency benefits, extended earnings loss benefits and maximum compensable earnings and assessable earnings, pursuant to the Act. The inflation rate assumption for later years is management best estimate, consistent with the range of accepted actuarial practice for workers’ compensation organizations in Canada.
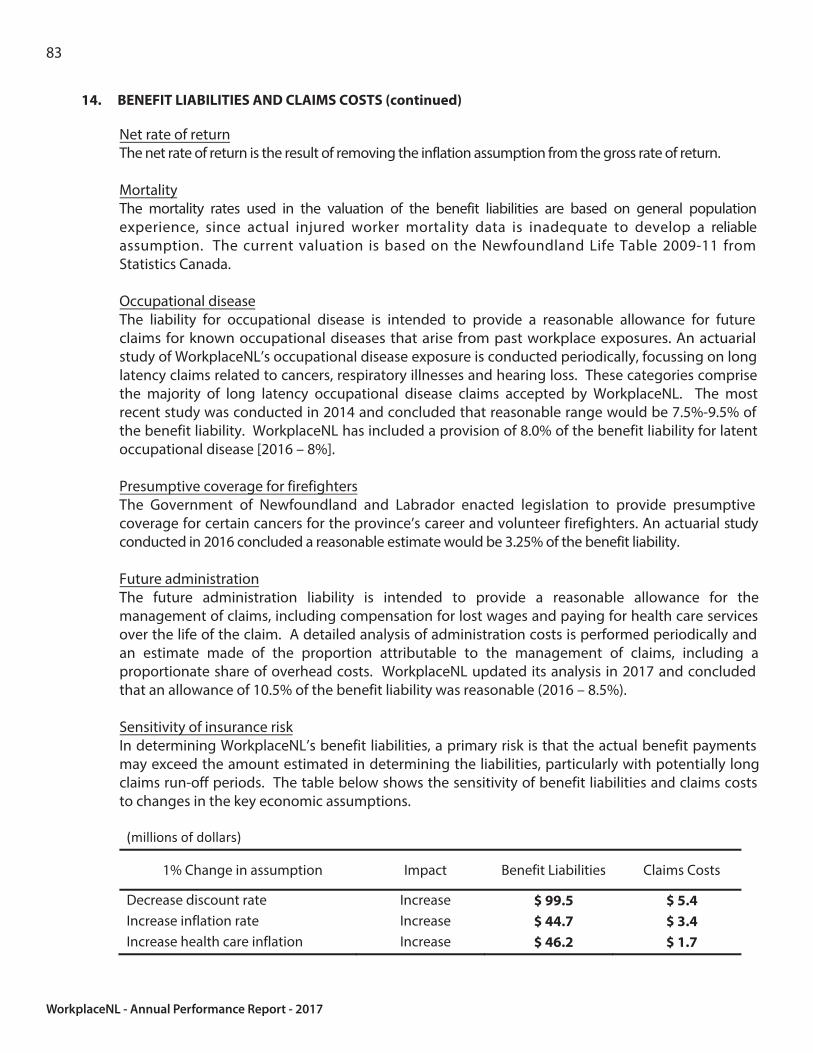
WorkplaceNL - Annual Performance Report - 2017
83
14. BENEFIT LIABILITIES AND CLAIMS COSTS (continued)
Net rate of returnThe net rate of return is the result of removing the inflation assumption from the gross rate of return.
MortalityThe mortality rates used in the valuation of the benefit liabilities are based on general populationexperience, since actual injured worker mortality data is inadequate to develop a reliableassumption. The current valuation is based on the Newfoundland Life Table 2009-11 fromStatistics Canada.
Occupational diseaseThe liability for occupational disease is intended to provide a reasonable allowance for futureclaims for known occupational diseases arise from past workplace exposures. An actuarialstudy of WorkplaceNL’s occupational disease exposure is conducted periodically, focussing on longlatency claims related to cancers, respiratory illnesses and hearing loss. These categories comprisethe majority of long latency occupational disease claims accepted by WorkplaceNL. The mostrecent study was conducted in 2014 and concluded that reasonable range would be 7.5%-9.5% ofthe benefit liability. WorkplaceNL has included a provision of 8.0% of the benefit liability for latentoccupational disease [2016 – 8%].
Presumptive coverage for firefightersThe Government of Newfoundland and Labrador enacted legislation to provide presumptivecoverage for certain cancers for the province’s career and volunteer firefighters. An actuarial studyconducted in 2016 concluded a reasonable estimate would be 3.25% of the benefit liability.
Future administrationThe future administration liability is intended to provide a reasonable allowance for themanagement of claims, including compensation for lost wages and paying for health care servicesover the life of the claim. A detailed analysis of administration costs is performed periodically andan estimate made of the proportion attributable to the management of claims, including aproportionate share of overhead costs. WorkplaceNL updated its analysis in 2017 and concludedthat an allowance of 10.5% of the benefit liability was reasonable (2016 – 8.5%).
Sensitivity of insurance riskIn determining WorkplaceNL’s benefit liabilities, a primary risk is that the actual benefit paymentsmay exceed the amount estimated in determining the liabilities, particularly with potentially longclaims run-off periods. The table below shows the sensitivity of benefit liabilities and claims coststo changes in the key economic assumptions.
(millions of dollars)
1% Change in assumption Impact Benefit Liabilities Claims Costs
Decrease discount rate Increase $ 99.5 $ 5.4
Increase inflation rate Increase $ 44.7 $ 3.4
Increase health care inflation Increase $ 46.2 $ 1.7

WorkplaceNL - Annual Performance Report - 2017
84
14. BENEFIT LIABILITIES AND CLAIMS COSTS (continued)
Claims risk WorkplaceNL has an objective to manage claims risk, which can lead to significant variability in the loss experience due to its inherent uncertainty. Performance from operations is also significantly affected by external factors. Insurance risk associated with the volume and cost of claims is addressed through prevention and proactive claims management. The prevention strategy focuses attention on workplace risks that lead to the highest frequency of claims. WorkplaceNL provides a Priority Employer Program to assist employers with high claims and costs, and invests in educating young workers, developing safety associations at the industry level, and delivering safety education to employers and workers to control workplace risks. The ESRTW process facilitates recovery at work and helps manage claim costs. In addition, the rate setting model provides incentives to employers through the PRIME program to manage injuries and work to prevent future injuries.
15. EMPLOYEE FUTURE BENEFITS
Public Service Pension Plan
WorkplaceNL’s contributions to the PSPP of $2,347,400 [2016 - $2,363,600] are included in administration expenses and have been expensed as incurred. The expected contributions to the PSPP in 2018 are $2,400,000. Severance payments and annual leave WorkplaceNL provides a severance payment and a payment for accumulated annual leave balances to employees upon retirement, resignation or termination without cause. The weighted average time to expected benefit payment is 12.0 years (2016 – 12.0). In 2017, cash payments to retirees were $258,000 [2016 - $318,000]. The last actuarial valuation was performed effective December 31, 2015. WorkplaceNL has reached an agreement with its unionized employees to discontinue severance, and payout accumulated benefits between April 1, 2018 and March 31, 2019.

WorkplaceNL - Annual Performance Report - 2017
85
15. EMPLOYEE FUTURE BENEFITS (continued)
(thousands of dollars) 2017 2016
Accrued benefit obligation, beginning of year $ 7,002 $ 6,584 Current service cost 361 398 Past service cost 60 - Interest cost 268 260
Benefit expense 689 658 Actuarial loss (gain) 38 78 Benefits paid (258) (318)
Accrued benefit obligation, end of year $ 7,471 $ 7,002
The significant actuarial assumptions used in measuring the accrued benefit obligation and benefit expense are as follows:
2017 2016
Discount rate – benefit cost 3.70% 3.80% Discount rate – accrued benefit obligation 3.30% 3.70% Rate of compensation increase 3.00% 3.00%
The table below shows the sensitivities of the accrued benefit obligation to a 25 basis point change in the key assumptions:
(thousands of dollars) Increase Decrease
Discount Rate $ (24) $ 25
Rate of compensation increase $ 25 $ (24)

WorkplaceNL - Annual Performance Report - 2017
86
16. ADMINISTRATION
(thousands of dollars) 2017 2016
Salaries and employee benefits $ 28,608 $ 28,521 Office and communications 2,616 3,198 Professional fees 1,571 1,670 Building operations 964 1,150 Travel and vehicle operating 384 402 34,143 34,941 Less: Claims administration [note 14] 9,509 9,299 $ 24,634 $ 25,642
17. LEGISLATED AND OTHER OBLIGATIONS
WorkplaceNL is required by legislation to fund the operating costs of the OHS Division of Service NL in delivering their occupational health and safety mandate, and all of the costs of the Workplace Health, Safety and Compensation Review Division and Statutory Reviews that take place approximately every five years. WorkplaceNL is required to fund the operating costs of the employer and worker advisor positions. Total expenses incurred by WorkplaceNL for legislated obligations are detailed below:
(thousands of dollars) 2017 2016
Service NL $ 4,962 $ 5,622 Workplace Health, Safety and Compensation Review Division
1,195
1,232
Employer and Worker Advisors 996 1,097 $ 7,153 $ 7,951
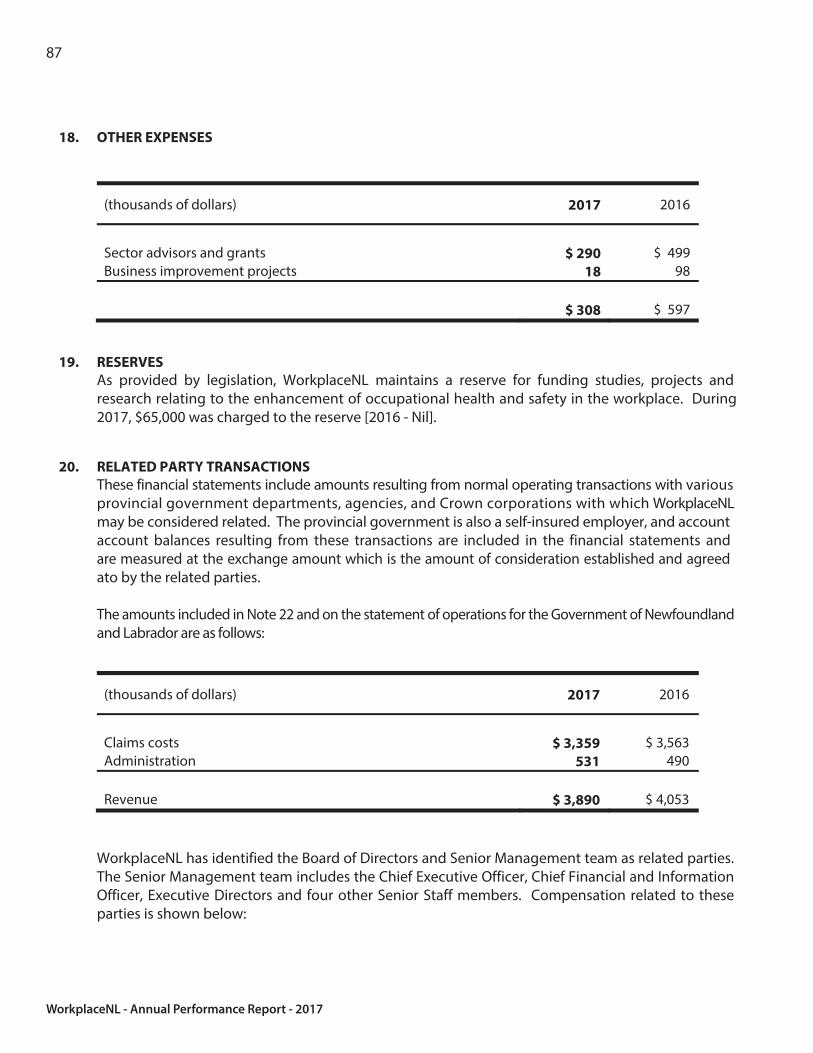
WorkplaceNL - Annual Performance Report - 2017
87
18. OTHER EXPENSES
(thousands of dollars) 2017 2016
Sector advisors and grants $ 290 $ 499 Business improvement projects 18 98
$ 308 $ 597
RESERVES
As provided by legislation, WorkplaceNL maintains a reserve for funding studies, projects andresearch relating to the enhancement of occupational health and safety in the workplace. During2017, $65,000 was charged to the reserve [2016 - Nil].
RELATED PARTY TRANSACTIONS
These financial statements include amounts resulting from normal operating transactions with variousprovincial government departments, agencies, and Crown corporations with which WorkplaceNLmay be considered related. The provincial government is also a self-insured employer, account balances resulting from these transactions are included in the financial statementsare measured at the exchange amount which is the amount of consideration established andato by the related parties.
The amounts included in Note 22 and on the statement of operations for the of and Labrador are as follows:
(thousands of dollars) 2017 2016
Claims costs $ 3,359 $ 3,563 Administration 531 490
Revenue $ 3,890 $ 4,053
WorkplaceNL has identified the Board of Directors and Senior Management team as related parties. The Senior Management team includes the Chief Executive Officer, Chief Financial and Information Officer, Executive Directors and four other Senior Staff members. Compensation related to these parties is shown below:

WorkplaceNL - Annual Performance Report - 2017
88
20. RELATED PARTY TRANSACTIONS (continued)
(thousands of dollars) 2017 2016
Number Total Number Total Board of Directors Salary and Benefits 10 $ 54 9 $ 53
Senior Management Salary and Benefits 9 $ 1,370 9 $ 1,270 Severance and annual leave $ 656 $ 481
21. INDUSTRY LEVY
WorkplaceNL has levied a surcharge of $0.10 per $100 of payroll on employers in the constructionsector to fund a portion of the operating costs of safety and health training programs conductedby the Newfoundland and Labrador Construction Safety Association. The amounts collectedon behalf of the association totaled $1,344,040 [2016 - $1,620,100] and are not included in thestatement of operations.
22. SELF-INSURED EMPLOYERS
The financial statements include the effects of transactions carried out for self-insured employers,principally federal and provincial government bodies, that directly bear the costs of their ownincurred claims and a share of administration costs. The claims costs and administrative expensesincluded in assessments revenue on the statement of operations are as follows:
(thousands of dollars) 2017 2016
Claims costs incurred: Short-term disability $ 1,173 $ 1,075 Long-term disability 3,788 3,777 Survivor benefits 344 464 Health Care 2,828 2,931 Administration charges 2,223 1,957
Revenue from self-insured employers [note 13] $ 10,356 $ 10,204

WorkplaceNL - Annual Performance Report - 2017
89
23. COMMITMENTS
WorkplaceNL has entered into operating leases for office premises with lease terms betweenthree and five years with the option to renew for additional terms of three to five years. Leasepayments during 2017 totalled $238,000 [2016 - $241,000].
Future minimum rentals payable under non-cancellable operating leases as at December 31 are as follows:
(thousands of dollars) 2017 2016
Within one year $ 190 $ 228 After one year but not more than five years 439 78
Non-cancellable operating leases $ 629 $ 306
24. CAPITAL MANAGEMENT
The objective of WorkplaceNL’s long-term financial strategy is to maintain a funded positionthat will provide for the security of benefits promised to injured workers within employers’reasonableability to pay assessments. WorkplaceNL’s funded position is defined by therelationship of total assets to total liabilities and the Injury Fund is fully funded when the totalassets equal or exceed total liabilities. At December 31, 2017 the funded ratio was 131.6%[2016 – 126.1%]. The Fund balance consists of accumulated net operating surplus, accumulatedother comprehensive incomeand the occupational health, safety and research reserve.
The Board of Directors has established a funding target of total assets equal to 110% of totalliabilities. When the funded ratio is less than 100% or more than 120%, WorkplaceNL will adjustsubsequent years assessment rates paid by employers to achieve the funding target over a fifteen-year period.
Funded Position
(thousands of dollars) 2017 2016
Total assets $ 1,508,314 $ 1,405,242
Less: Total liabilities 1,145,848 1,114,158
Funded position $362,466 $291,084
Reserves $ 485 $ 550
Funded ratio 131.6% 126.1%

WorkplaceNL - Annual Performance Report - 2017
90
25. SUBSEQUENT EVENTS
On March 12, 2018, the Government of Newfoundland and Labrador legislation to amendthe Act to increase the income replacement rate for injured workers in Newfoundland and Labrador,or their dependents, from 80% to 85%. The impact of this amendment will be an increase inthe benefit liability of approximately $67.9 million, and a reduction in the funded ratio of 7.4%to 124.2%.

WorkplaceNL - Annual Performance Report - 2017
91
FIVE-YEAR HISTORY
DECEMBER 31, 2017
Statement of Operations and Fund Surplus (Deficiency)
for the Years Ending December 31
(thousands of dollars)
2017
2016 2015 2014 2013
Revenue
Assessments $ 166,293 $ 183,830 $ 206,262 $ 180,144 $ 201,148 Investment income 124,594 104,487 77,325 117,982 140,131 Third-party recoveries 3,053 1,648 1,340 580 1,123 293,940 289,965 284,927 298,706 342,402 Expenses Claims costs incurred 163,849 160,949 161,786 167,283 161,607 Administration 24,634 25,642 25,933 24,551 24,668 Legislated obligations 7,153 7,951 7,152 7,327 7,814 Amortization 2,996 3,703 3,434 3,130 2,931 Fee and interest 5,738 5,245 4,345 4,589 3,880 Actuarial adjustments 17,777 1,213 5,373 28,243 (7,158) Other 308 597 540 450 185 222,455 205,300 208,563 235,573 193,927 Surplus for the year 71,485 84,665 76,364 63,133 148,475 Fund surplus (deficiency), beginning of year
290,534 205,947 129,252 66,593 (82,343)
Reserve balance, beginning of year 550 550 550 550 550 Total fund surplus (deficiency), beginning of year
291,084 206,497 129,802 67,143 (81,793)
Surplus for the year 71,485 84,665 76,364 63,133 148,475 Appropriation of reserve fund (65) - - - - Other comprehensive (loss) income (38) (78) 331 (474) 461 Total fund balance, end of year $ 362,466 $ 291,084 $ 206,497 $ 129,802 $ 67,143

WorkplaceNL - Annual Performance Report - 2017
92
Hon. Sherry Gambin-WalshMinister Responsible for
WorkplaceNL
John PeddleChairperson
Board of Directors
Paul KavanaghChief Financial &
Information Officer
Patricia MahonExecutive Assistant
to the CEO and Board of Directors
Ann MartinGeneral Counsel &Corporate Secretary
Glenda PeetDirector
Human Resources
Tom MahoneyExecutive DirectorWorker Services
Kevin LanniganDirector
Internal Audit
Dennis HoganChief Executive Officer
Carla RiggsDirector
Communications
Brian DelaneyExecutive DirectorEmployer Services
Organizational Chart

St. John’s Office 146-148 Forest Road, P.O. Box 9000, St. John’s, NL A1A 3B8 t 709.778.1000 f 709.738.1714 t 1.800.563.9000
Grand Falls-Windsor Office 26 High Street, P.O. Box 850, Grand Falls-Windsor, NL A2A 2P7 t 709.489.1600 f 709.489.1616 t 1.800.563.3448
Corner Brook Office Suite 201B, Millbrook Mall, 2 Herald Avenue, P.O. Box 474, Corner Brook, NL A2H 6E6 t 709.637.2700 f 709.639.1018 t 1.800.563.2772
email: [email protected]
Health Safety Compensation
workplacenl.ca