nnoottee ddee ll’’iiffrrii - ifri · nnoottee ddee ll’’iiffrrii gouvernance européenne et...
TRANSCRIPT

______________________________________________________________________
Global Coal Trade From Tightness to Oversupply
__________________________________________________________________
Sylvie Cornot-Gandolphe
Février 2013
.
NNoottee ddee ll ’’ II ff rr ii
Gouvernance européenne et géopolitique de l’énergie

The Institut français des relations internationales (Ifri) is a research center and a forum for debate on major international political and economic issues. Headed by Thierry de Montbrial since its founding in 1979, Ifri is a non-governmental and a non-profit organization. As an independent think tank, Ifri sets its own research agenda, publishing its findings regularly for a global audience. Using an interdisciplinary approach, Ifri brings together political and economic decision-makers, researchers and internationally renowned experts to animate its debate and research activities. With offices in Paris and Brussels, Ifri stands out as one of the rare French think tanks to have positioned itself at the very heart of European debate.
The opinions expressed in this text are the responsibility of the author alone.
ISBN: 978-2-36567-132-3 © All rights reserved, Ifri, 2011
Website: Ifri.org
Ifri-Bruxelles Rue Marie-Thérèse, 21
1000 – Brussels – BELGIUM Tel: +32 (0)2 238 51 10 Fax: +32 (0)2 238 51 15
Email: [email protected]
Ifri 27, rue de la Procession
75740 Paris Cedex 15 – FRANCE Tel: +33 (0)1 40 61 60 00 Fax: +33 (0)1 40 61 60 60
Email: [email protected]

1 © Ifri
Table of contents
INTRODUCTION ................................................................................... 2
KEY FINDINGS ..................................................................................... 4
GLOBAL COAL TRADE ......................................................................... 7
Thirty years of sustained growth ............................................... 7
Still a small share of global production .................................. 10
Steam coal trade: a structural shift to the Asian/Pacific basin .......................................................................................... 12
Coking coal trade: a global market ......................................... 13
MAJOR COAL IMPORTERS .................................................................. 16
China ......................................................................................... 17
India ........................................................................................... 24
Japan/South Korea/Taiwan ...................................................... 26
Europe ....................................................................................... 29
MAJOR COAL EXPORTERS ................................................................. 34
Australia .................................................................................... 35
Indonesia ................................................................................... 39
United States ............................................................................. 42
South Africa .............................................................................. 49
Russia........................................................................................ 52
Colombia ................................................................................... 55
New exporting countries .......................................................... 59
CONCLUSION .................................................................................... 62
BIBLIOGRAPHY ................................................................................. 63

2 © Ifri
Introduction
Over the past four years, international coal trade has been reshaped by China’s surging imports. China, which was still a net exporter in 2008, became the world’s first coal importer in 2011, taking over the position that Japan has occupied for three decades. Its imports have continued their rising trend and reached a record level in 2012, despite the country’s economic slowdown. China imported 289 million tons of coal in 2012, up 30% over 2011. It now accounts for 23% of global imports. Although China is the world’s largest coal producer, several factors have contributed to the sudden rise in its imports, including the higher cost of domestic coal relative to international prices and bottlenecks in transporting domestic coal to south-eastern provinces.
More recently, another event shook the international coal business: the United States have been back on the market. The collapse of U.S. gas prices, to $4/million Btu in 2011 and even $2.75/million Btu in 2012, linked with the “shale gas revolution”, has made coal uncompetitive in the electricity sector, its main outlet on the U.S. market. U.S. coal demand dropped 4% in 2011 and 11% in 2012. The reduction in domestic demand has forced U.S. miners to look for overseas outlets. Their exports surged by 31% in 2011 and 16% in 2012. They reached 112 million tons in 2012, more than twice the level of 2009. The United States, which almost disappeared from the international steam coal market in the 2000s, have regained a larger share of the total coal export market, 9% in 2012, against 6% in 2009.
These developments, although not directly linked, have a huge impact on the global market and pricing of coal. Chinese imports have helped the market to quickly recover from its low level of 2008-2009. The speed and magnitude of China’s coal imports even shifts the market from a sluggish to a tight situation. Prices started to rise after their collapse in the second half of 2008 caused by the economic and financial crisis. Competition between buyers developed. In 2011, the market was very tight, and prices jumped by 18% in Asia and 32% in Europe relative to their average in 2010. The surge of U.S. exports in the past two years removed the shortfall of coal on the global market. Despite a robust 12% growth in imports in 2012, the global market has rapidly moved from tightness to oversupply. Prices dropped by 19% in Asia and 24% in Europe in 2012. Major mining companies all around the world struggle with cost pressures and poor or negative financial results. Is this situation sustainable? Will China continue to import at the same pace? Will the

Sylvie Cornot-Gandolphe / Global Coal Trade
3 © Ifri
United States play their traditional role of a swing supplier and withdraw from the market?
This report looks at these issues and reviews recent developments in global coal trade. Chapter 1 provides an overview of steam and coking coal trade at the worldwide level and explains the evolution of steam and coking coal prices. Chapter 2 looks at major coal importing countries and analyses recent changes in their import patterns. The key role of China is emphasized. Chapter 3 provides an overview of major exporting countries and analyses their export strategies. A special focus is put on the U.S. market.

4 © Ifri
Key findings
International hard coal1 trade has increased continuously over the past three decades. It rose from 385 million tons2 in 1982 to an estimated 1 276 million tons in 2012. The growth has been driven by a sustained rise in steam coal trade, especially since 1995. Steam coal trade rose from 304 million tons in 1995 to 985 million tons in 2012, an average annual growth rate of 7.2%. The large increase in coal demand by power utilities all around the world, but even more so in the Asia/Pacific region, explains this spectacular growth. Coking coal trade rose from 172 million tons in 1995 to 291 million tons in 2012, an average annual growth rate of 3.1%. Demand for coking coal is driven by the needs of the iron and steel industry and has been very volatile in recent years, reflecting the vagaries of the industry.
Despite its robust growth, total international trade3 still represents a small share of coal production. Only 17% of hard coal production is traded internationally, whereas this share is above 60% for oil and 33% for natural gas. The global coal market remains a thin market dominated by few players. Small changes are able to shake and reshape the market. This is exactly what happened in the past four years.
The steam coal market, which is the main focus of this report, is traditionally divided into two basins, the Pacific basin and the Atlantic basin. Each basin is supplied from suppliers within the basin and very little flows occur between the two basins. However, this situation has changed dramatically with the surge in Asian imports. It actually started in 2007 when demand in the Pacific basin exceeded available supply from the basin. This imbalance pushed Asian buyers to compete with Atlantic ones for supplies from Atlantic suppliers. It first led to a shift in South African trade patterns. Whereas the country exported 80% of its coal to Europe in 2007, more than half of its exports are now directed to Asia, India and China mainly. The move has extended to all Atlantic suppliers which all developed Asian-oriented export strategies, attracted by the surge in Asian and Chinese imports. The robust growth in Asian imports
1 Hard coal includes steam coal (used by the power sector mainly) and coking coal (used by the iron and steel industry). 2 All data in this report are in metric tons. U.S. short tons are converted in metric tons with the following equivalence: 1 short ton = 0.9072 metric ton. 3 Total trade refers to steam coal trade plus coking coal trade.

Sylvie Cornot-Gandolphe / Global Coal Trade
5 © Ifri
has shifted the center of gravity in international coal trade to the Pacific basin. The Pacific basin, which accounted for 56% of global steam coal imports in 2007, now accounts for 69%.
This change has profoundly affected the market. The influence of Asia on coal pricing has become determinant. The international price of steam coal is now largely determined by China, which has become the largest coal importer since 2011. China’s coal imports have risen rapidly since 2009. They reached 289 million tons in 2012. The country now accounts for 23% of global imports. It thus has considerable power on the international market, and policy decisions taken in Beijing affect the price of coal delivered to other Asian countries and European buyers.
While China has retained the attention of all exporters, India appears as the next area of surging coal imports. Although the country is the world’s third producer of coal, its production is insufficient to cover its fast-growing needs, both for electric power producers and steel manufacturers. Consequently, India increasingly calls on the international market to make up the deficit of its internal coal market. In 2012, the country imported a record 134 million tons, up 15% over 2011. Ultimately, India could overtake China as the world's largest importing country, and it would be the decisions taken in New Delhi that would become paramount on the international coal market.
The Atlantic basin, which includes European/Mediterranean, U.S. and Latin American importers, could appear as a dying market in view of its shrinking share in global imports and stronger buying power of Asian customers. However, this is not the case with the revival of European imports in the past two years. European coal imports rose by 14% in 2011 and 11% in 2012, driven by increasing demand by power utilities. Following the abundance of coal at low price and the collapse of CO2 prices, coal has regained its competitiveness in the power sector. While coal suffered from the decline of European power consumption and increased renewable generation, it gained a price advantage over gas in 2011. This effect was stronger in 2012 due to decreasing coal and CO2 prices and the abundance of U.S. coal. U.S. steam coal exports to Europe (including Turkey) jumped 124% to 18 million tons in 2011 and 90% to 31 million tons in 2012. Coal, therefore, gained a larger share of European electricity generation, at the expense of natural gas, whose prices still predominantly indexed to oil remained high. In the United Kingdom and Spain, markets with sufficient gas and coal-fired generation capacity to enable significant switching, producers have been moving away from natural gas to coal. In the future, European coal consumption and imports will mainly be driven by national policies and are contrasted among countries. While the United Kingdom and Spain absorbed most of the U.S. and Colombian tonnages made available on the market in 2012, the trend may be short-lived as new regulations unfavorable to coal burning are put in place in both countries. In Germany, at the opposite, the phase-out of nuclear power, leads to resurgence in coal consumption, which so far

Sylvie Cornot-Gandolphe / Global Coal Trade
6 © Ifri
has benefited to domestic lignite. However, the building of new hard coal-fired power plants will increase imports.
During the past three years, coal export projects flourished all over the world, based on expectations of an insatiable demand by China. Although Chinese and global imports recorded strong growth rates, the growth was not sufficient to absorb the tonnage made available on the market. The global market rapidly moved from tightness to oversupply. The supply glut eventually drove prices down. In 2012, imported steam coal prices fell by 19% in Asia to $108.8/t and by 24% in Europe to $92.5/t. Coking coal prices dropped 27% to $209/t. Exports have become unprofitable for most producers. Highest quality coal mines with low costs have been depleted in several exporting countries. Miners have to move into new areas located farther away from existing infrastructure, with more difficult geological conditions and lower coal qualities. This move means rising costs that current prices cannot cover. Under these market conditions, major companies in Australia, Russia and the United States cut coal output at their highest-cost mines and postpone or even cancel new investment to reduce costs and sustain prices. The cut so far has not allowed a sufficient recovery of coal prices and more cuts are expected in 2013. The rebalancing of the market depends to some extent on the behavior of U.S. mining companies. In response to lower international coal prices and a recovery in domestic coal demand, the United States are expected to play their traditional role of a swing supplier and decrease their exports. Already in the fourth quarter of 2012, a slowdown in U.S. steam coal exports was observed as export margins were squeezed by lower export prices. But above all, the balance of the market depends on China. After all, China is now responsible for 23% of global coal imports. Yet, Chinese imports, even at record levels, account for 7% only of the Chinese market. A small change in Chinese consumption or production is able to transform the status of the country from the number one importing country to a self-sufficient country. China’s 12th Five-Year Plan foresees a diversification of the electricity mix away from coal. An increase of the share of non-fossil fuels is planned to reduce carbon emissions by unit of GDP. The recent five-year energy policy of China confirms the willingness of the government to cap coal production and consumption at 3.9 billion tons by 2015. If the government manages to actually cap coal consumption, Chinese imports would drop dramatically by 2015 and be limited to selected qualities of coal (coking coal, high calorific thermal coal). This development would drive down global coal trade. This is with that uncertainty that global suppliers, already struggling with cost pressures amid current low prices, have to prepare the next wage of investments in mining and infrastructure. Needless to say, investment decisions are selective and cautious.

7 © Ifri
Global coal trade
Thirty years of sustained growth
International hard coal trade has increased continuously over the past three decades driven by a sustained growth in steam coal trade (Figure 1). Total trade is estimated at 1,276 million tons in 2012, of which seaborne trade accounts for 1,166 million tons and cross-border trade between neighboring countries for 110 million tons. The traded volumes are divided into two types of coal (see box 1):
Steam coal, used by the power utilities and some industries, such as the cement, fertilizer, glass and paper industries; and
Coking coal, used by the iron and steel industry to make steel.
Figure 1: International coal trade, 1982-2012
Source: International Energy Agency (IEA) from 1982 to 2011, 2012: estimates
The large increase in coal demand by power utilities around the world, but especially in the Asia/Pacific basin, explains the spectacular increase in steam coal trade since the middle of the 1990s. Coal demand by the power sector increased from 2,900 million tons in 1995 to 4,700 million tons in 2010. Steam coal

Sylvie Cornot-Gandolphe / Global Coal Trade
8 © Ifri
trade rose from 304 million tons in 1995 to 985 million tons in 2012, an average annual growth rate of 7.2%. The financial and economic crisis in 2009 reduced coal demand in some regions, but even that year traded volumes continued growing thanks to rising Chinese imports. China became a net importer in 2009 and has continued to increase its coal imports steeply. In 2011, it became the first largest coal importer, outpacing Japan. In 2012, Chinese imports (steam and coking coal) again increased to a new record, an estimated 289 million tons, up 30% over 2011. China now accounts for 23% of global coal trade. This steep increase in four years only has reshaped the international coal business. Today international coal prices are largely determined by Chinese coal supply and demand. The international coal mining companies have adapted their export strategies and developed new mining capacities and infrastructure logistics to answer this new demand. The growing flows from traditional suppliers to China (mainly Australia and Indonesia), combined with new exports from Atlantic suppliers, the United States in particular, resulted in a supply glut which drove a fall in steam coal prices (Figure 2). Import prices in Asia decreased by 19% in 2012 to US$108.8/t. On the European market, following the abundance of U.S. coal, import prices dropped 24% to US$92.5/t. Therefore despite a healthy 14% growth in steam coal trade in 2012, the year was a disappointed one for major coal exporters. Today all of them are trying to eliminate the oversupply. They are shutting down their highest cost mines and postpone or even shelve new coal investment. BHP announced the indefinite postponement of a US$20 billion investment in Australia’s Port Hedland. The economic slowdown in China fears a slowdown in coal imports.
Figure 2: Evolution of international steam coal prices, CIF Europe and Asia, January 2007-December 2012
Note: Spot CIF Price, basis 6,000 kcal/kg NAR (Net As Received). CIF: Cost, Insurance, Freight. Source: International Coal Report
Demand for coking coal is driven by the needs of the iron and steel industry. Traded volumes increased slightly from 1990 to the first half of the 2000s. They collapsed in 2009 following the decrease in steel production caused by the economic and financial

Sylvie Cornot-Gandolphe / Global Coal Trade
9 © Ifri
crisis. In 2010, a strong upturn in trade (+17%) was observed partly explained by a catch-up effect, but also by China’s growing imports and, to a lesser extent, India’s. In 2011, trade declined (down 1.7% compared to 2010). Although steel production rose 6.8% to 1.49 billion tons that year, coking coal supplies were constrained by reduced export capacity in Australia. The torrential rains, which devastated the State of Queensland at the beginning of 2011, flooded coal mines and ports and forced coal producers/exporters to declare force majeure. This resulted in a large supply shortage as the State represents about 50% of global coking coal exports. It led to a surge in coking coal prices which reached astronomic levels in the second quarter of 2011 (US$330/t for premium hard coking coal). Japanese, Korean and European buyers turned to North American suppliers to make up the deficit. The United States and Canada were able to compensate most of the Australian lost tonnage, although the market remained very tight. In 2012, coking coal trade resumed growth as Australian tonnage was available again. However, the recession in Europe and the slowdown in China reduced steel production growth. Global steel production increased by a meager 1.2% in 2012 and decreased in several countries, limiting coking coal imports. Imports reached 291 million tons, up 5% over 2011. Fierce competition has developed between Australia and North America, although Australia has a freight advantage over its competitors when supplying Asian customers. The opposite applies for U.S. exports from the Gulf Coast to European customers.
Coking coal prices reflected these market conditions: after their peak in the second quarter of 2011, they started to decline (Figure 3). The fall was particularly marked in 2012 as supplies exceeded buyers’ demand for imported tonnage.
Figure 3: Evolution of international coking coal prices, FOB Australia, 2007-013
Note: Benchmark prices of Australia’s premium hard coking coal (annual benchmark up to FY 2010, quarterly benchmark from Q2 2010). Source: International Coal Report, Mc Closkey Coal Report

Sylvie Cornot-Gandolphe / Global Coal Trade
10 © Ifri
Still a small share of global production
Despite a sustained growth over the past three decades, international coal trade is less developed than that of competing fuels: it accounts for 17% of hard coal production (Figure 4), a much lower share than oil (more than 60%) and natural gas (33%). This is mainly due to the difficulties and costs associated with its inland and international transportation, although the latter has decreased dramatically since the economic and financial crisis and the collapse in maritime freight rates.
Figure 4: Traded coal in global hard coal production, 2011
Note: Only hard coal is traded internationally. Mt: Million tons. Source: data from IEA

Sylvie Cornot-Gandolphe / Global Coal Trade
11 © Ifri
Box 1 Different types of coa
Coal is a complex matter, and not a uniform one. It is divided into two categories:
HARD COAL
Hard coal is subdivided into two types of coal:
Steam (or thermal) coal, used primarily for power generation and for industrial applications; and
Coking coal, used by the iron and steel industry to make coke.
Hard coal has energy content above 4,500 kcal/kg and water content lower than 35%.
Only hard coal is traded internationally.
Inside the two categories of hard coal, the physical and chemical qualities of the different coals will be important factors to determine their use and price (% of volatile matters, ash, sulphur, moisture, Fixed Carbon, grinding index HGI, calorific value for steam coal, and coke strength - CSR value - for coking coal)
LIGNITE or BROWN COAL
Lignite has energy content lower than 4,500 kcal/kg, and water content above 35%. Therefore it is mainly used on regional/local markets and almost exclusively for power generation.

Sylvie Cornot-Gandolphe / Global Coal Trade
12 © Ifri
Steam coal trade: a structural shift to the Asian/Pacific basin
The global seaborne steam coal market is split between the Atlantic and Pacific basins. Whereas Japan and the European Union have long been the world’s largest steam coal importers, China and India are now emerging as top importers. This surge has shifted the center of gravity in international coal trade to the Pacific basin. With imports of 681 million tons in 2012, up 18% compared to 2011, the Pacific basin strengthened its leading position in the international market: it now accounts for 69% of the steam coal trade, against 28% only in 1990 (Figure 5). The strengthening was remarkable in the past five years, with an increase of the basin’s share of 13 points during 2007-2012.
Figure 5: Steam coal imports by basin, 1980-2012
Notes: includes cross-border over-land trade. The Atlantic basin includes the eastern seaboards of North, Central and South America, Europe, including the countries bordering the Mediterranean, and the northern and western coasts of Africa. Source: calculated from IEA data, 2012: estimated
“Low rank” coal trade The growth of low rank steam coal is a new trend in global seaborne trade. Low rank coal also designed as “off-spec” consists of sub-bituminous coal with a low calorific value (4,900 kcal/kg in the case of Indonesia, 5,500 kcal for Australia) and a high ash content (up to 24%). Indonesia was initially the source of most of low rank coal exports, with South Korea and Taiwan the major importers. Indonesia’s low calorific value coal is sold at a discount compared with benchmark coal with a calorific value of 6,000 kcal/kg. With growing imports by China and India, demand for low rank coal has grown and its global trade surged in 2011 (an estimated 200 million

Sylvie Cornot-Gandolphe / Global Coal Trade
13 © Ifri
tons) with the emergence of new suppliers in Australia, South Africa, Colombia and the United States. Australia is now a regular supplier of low rank coal on the spot market. This trend is expected to continue with even lower calorific value coal offered on the market. The suppliers save money as they don’t have to wash the coal. The buyers get lower prices. In the importing countries, low rank coal is blended with other coals. It therefore requires that buyers invest in blending facilities and adapt their buying strategies. They also have to adapt the boilers at their power plants to burn low calorific value coal. Since 2000, most of coal power plants have been designed with the possibility to burn coals with a wide range of calorific value.
As more tonnage is needed to produce the same unit of energy, this new trend explains part of the high growth in steam coal imports by some countries (China, South Korea). The low price of low rank coal is attracting new buyers, among them Japan. The country, which traditionally imports high-quality steam coal only, plans to buy low rank coal to cut fuel costs and introduce more competition among its suppliers.
In Indonesia, the effective utilization of low rank coal, which accounts for about half of coal reserves in the country, is an important policy issue. The country aims at upgrading the quality of its low rank coal, as the government intends to introduce a ban on export of the material, although the new regulation is challenged by the Indonesia’s Supreme Court. Technologies for an efficient use of low rank coal include upgrading technologies, such as Coal Upgrading – Briquette (CUB), liquefaction of coal or its gasification. The Indonesian company PT Kaltim Supacoal, a subsidiary of White Energy and PT Bayan Resources, commissioned the first upgrading plant of the country in 2012. The plant at the Tabang coal mine, East Kalimantan, has a capacity of 1 million tons a year and upgrades run of mine coal of approximately 4,200 kcal/kg GAR (gross as received) to approximately 6,000 kcal using White Energy’s Binderless Coal Briquetting process.
Coking coal trade: a global market
Whereas the steam coal trade is divided into two basins, the coking coal market is a global one. This is mainly due to the concentration of exports in one country, Australia, which accounts for half of global coking coal trade. Australia is therefore responsible for supplying customers all around the world with its high-quality coking coals (Box 2). The other exporters include the United States, Canada, Mongolia and Russia (figure 6). Coking coal exports amounted to 291 million tons in 2012, of which 254 million tons were seaborne trade. Whereas steam coal trade accounts for 15% only of steam coal production, coking coal trade reaches 29% of coking coal production (2011 figures).

Sylvie Cornot-Gandolphe / Global Coal Trade
14 © Ifri
While demand for imported coking coal was traditionally sustained by developed countries – European Union, Japan, and South Korea – this has not been the case for the last four years. This role now falls to China and India.
Figure 6: Major coking coal exporting countries, 2011
Source: IEA

Sylvie Cornot-Gandolphe / Global Coal Trade
15 © Ifri
Box 2 The main categories of coking coal
There are three main categories of coal used by the steel industry:
Hard coking coal (HCC) that forms high-strength coke;
Semi-soft coking coal (SSCC) that produces coke of lesser quality; and
PCI coal. PCI (pulverized coal injection) coal is not really a coking coal; rather it is used primarily for its heat value and is injected into a blast furnace to replace expensive coke.
Coking coal includes HCC and SSCC. Metallurgical coal includes the three categories.
Hard coking coals (HCC) are a necessary input in the production of strong coke. Only certain types of coking coal have the necessary characteristics required to make coke. These characteristics include caking properties (the ability to melt, swell and re-solidify when heated) and low impurity levels (e.g. moisture, ash, sulphur, etc.). Hard coking coals trade at a premium to other coals due to their importance in producing strong coke and because they are limited resources.
Semi-soft coking coal (SSCC) or weak coking coal is used in the coke blend, but results in a low coke quality with a possible increase in impurities. There is scope for interchangeability between thermal coal and SSCC, and thus SSCC prices have a high correlation with thermal prices.
Coal used for pulverized coal injection (PCI) reduces the consumption of coke per ton of pig iron as it replaces coke as a source of heat and, at high injection rates, as a reductant. PCI coal tends to trade at a premium to thermal coal, depending on its ability to replace coke in the blast furnace. Integrated steel mills optimize the use of semi-soft and PCI coals in order to reduce overall costs. However, there are technical limits to the ability of integrated steel mills to substitute semi-soft and PCI coals for hard coking coal in their coking coal blend.

16 © Ifri
Major coal importers
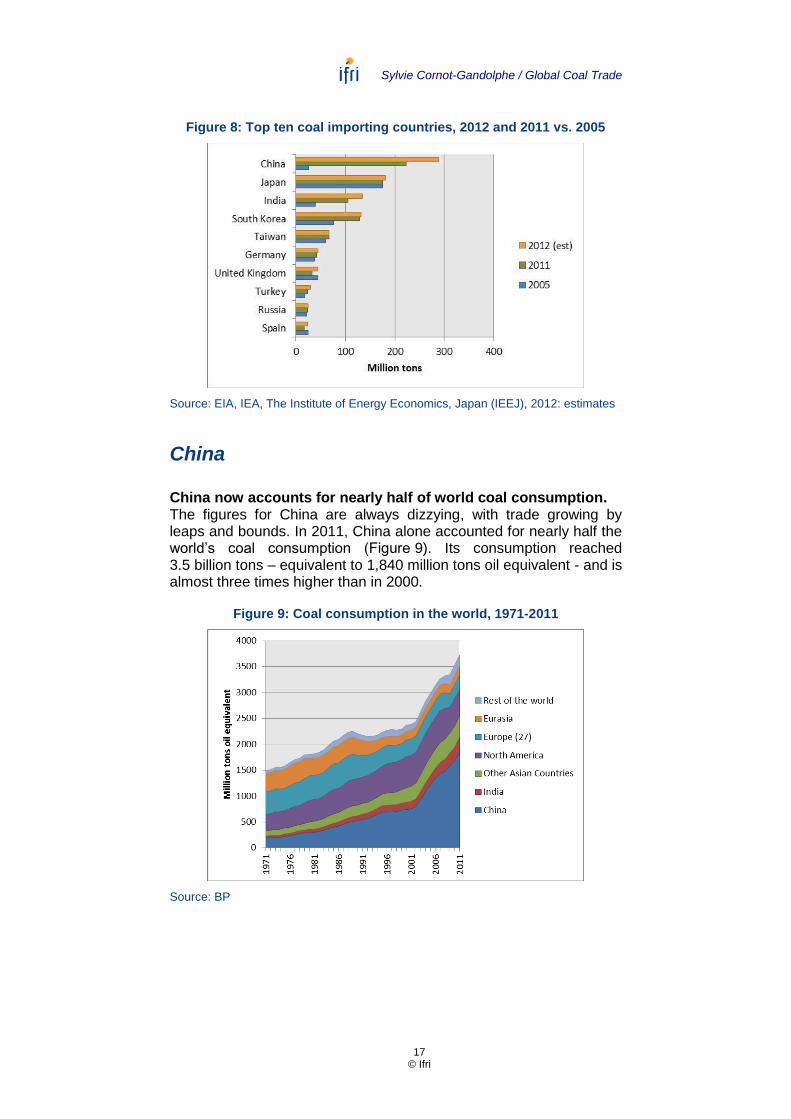
Four countries/regions dominate coal imports: China, India, the grouping Japan/South Korea/Taiwan which constitutes the traditional Asian buyers, and Europe (Figure 7). Together they account for 84% of total coal imports. The surge in China’s and India’s imports has changed the hierarchy of importers. China became the world’s top importer in 2011, taking over the position that Japan has occupied for three decades. India became the third largest importer in 2012, overtaking South Korea (Figure 8).
This chapter looks at major coal importers and analyses recent changes in their import patterns.
Figure 7: Development of coal trade by major importing country/region, 1992-2012
Note: Includes cross-border overland trade. Europe includes western and central European countries and Turkey. Eurasia’s trade is cross-border overland trade between countries of the Former Soviet Union. Source: EIA, IEA, 2012: estimates
Sylvie Cornot-Gandolphe / Global Coal Trade
17 © Ifri
Figure 8: Top ten coal importing countries, 2012 and 2011 vs. 2005
Source: EIA, IEA, The Institute of Energy Economics, Japan (IEEJ), 2012: estimates
China
China now accounts for nearly half of world coal consumption. The figures for China are always dizzying, with trade growing by leaps and bounds. In 2011, China alone accounted for nearly half the world’s coal consumption (Figure 9). Its consumption reached 3.5 billion tons – equivalent to 1,840 million tons oil equivalent - and is almost three times higher than in 2000.
Figure 9: Coal consumption in the world, 1971-2011
Source: BP

Sylvie Cornot-Gandolphe / Global Coal Trade
18 © Ifri
The power generation sector is by far the largest coal user in China accounting for more than 50% of total consumption (Figure 10). Power demand is strongly linked with economic activity which resulted in the high growth observed over the past decade. The second largest user, the iron and steel industry, also increased its coal consumption tremendously driven by the boom in steel production. Chinese crude steel production increased from 490 million tons in 2007 to 716.5 million tons in 2012 and China now accounts for almost half of global crude steel production. Other large users include the cement and chemical industries.
Figure 10: China’s coal use by major sectors, 2005-2011
Source: IEA
The 12th Five-Year Plan (2011-2015) foresees a diversification of the electricity mix away from coal. Nuclear, hydro and renewable energy sources are expected to increase their share, while the share of coal is expected to decrease to 65% by the end of 2015. However, the increase in total electricity demand – even at a slower rate than those experienced in the past 10 years – means that in absolute terms, coal consumption will continue to rise.
China became the largest coal importer in 2011, overtaking Japan China’s coal imports have risen rapidly since 2009. Imports surged from 41 million tons in 2008 to 223 million tons in 2011 and an estimated 289 million tons in 2012. At the same time, China reduced its coal exports from 47 million tons in 2008 to 15 million tons in 2011 (9 million tons estimated in 2012). The country, which was still a net exporter in 2008, has become a net importer since 2009 and in significant quantities: 208 million tons in 2011 and 280 million tons in 2012 (Figure 11). Despite abundant domestic coal, several factors contributed to the sudden rise in imports, including the higher cost of domestic coal relative to international prices, bottlenecks in transporting domestic coal, coking coal resource restraints and environmental and safety concerns. Yet China remains the world's

Sylvie Cornot-Gandolphe / Global Coal Trade
19 © Ifri
largest coal producer (3.7 billion tons produced in 2012). Its imports are only a small part of its consumption, 7%, but on the narrow international coal market, China now represents 23% of total global trade (2012 figures). It thus has considerable power on the international market, and policy decisions taken in Beijing affect the price of coal delivered to other Asian countries and European buyers.
Figure 11: Chinese international coal imports and exports, 1992-2012
Source: IEA, 2011 and 2012: China Customs data
Imports mostly driven by price arbitrage The reliance on international trade stems from commercial and logistical considerations. The bulk of China’s production comes from the north of the country, while major consumption centers are located in the south-eastern provinces. Logistical constraints in this huge country restrict the transportation of coal to centers of consumption.
But above all, Chinese coal imports are driven by coal price arbitrage between domestic and international coal prices. Over the last four years, the price differential between the price of domestic coal (encumbered by high transportation costs) and the international price has favored imports (Figure 12). Low maritime freight rates have reinforced the competitiveness of international coal.

Sylvie Cornot-Gandolphe / Global Coal Trade
20 © Ifri
Figure 12: Comparison of coal prices in China (Qinhuangdao) with export prices from Indonesia and Australia, January 2009-
December 2012
Note: FOB (Free on Board) prices, at 6,000 kcal/kg. Qinhuangdao is the largest port for the transport of coal from northern to southern China. In the Bohai Bay, there are seven major coal terminals with a handling capacity of 600 million tons a year. These ports “export” more than 500 million tons a year to the south-eastern provinces. Source: International Coal Report
As the figure shows, prices of Chinese coal at Qinhuangdao were higher than Indonesian and Australian prices for almost all the past four years, leading to the strong growth in coal imports experienced during that period.
China has become the “swing buyer” of the coal market, buying on the international market when international prices are lower than domestic prices and withdrawing from the market when the reverse occurs. In early 2011, when Australian coal prices exploded following floods and supply cuts in Queensland, China was a net exporter, with Chinese traders reselling their coal cargoes to markets affected by the Australian flooding. In 2012, imports grew sharply (up 30%) driven by low international prices.
Australian imports displaced by Mongolia’s The strong growth in imports has benefited all exporting countries, except Australia in 2010 and 2011 (Table 1). Australia exports both steam and coking coal to China. Australian coking coal, whose price peaked at US$330/t in the second quarter of 2011 after the flooding in Queensland, was displaced by much cheaper Mongolian, and to a less extent Canadian and U.S., coking coal. First data for 2012 show a strong rise in Australian imports, mainly explained by rising supplies of Australian low rank coal.

Sylvie Cornot-Gandolphe / Global Coal Trade
21 © Ifri
Table 1: China’s coal imports by source, 2007-2011
Note: Chinese coal imports data include “lignite” imports supplied by Indonesia mainly. Whereas lignite is not usually traded on the international market due to its very low calorific value, Indonesia exports large quantities of low calorific coal falling under this sub-category. Source: National Development and Reform Commission (NDRC), China’s Customs Statistics
Strong imports led to oversupply The strong coal buying combined with the slowdown of the economic activity and higher hydropower generation resulted in an oversupply on the Chinese market. During the first half of 2012, imports surged 60% compared to the same period in 2011. At the same time, the economic activity started to slow down. Moreover, strong rainfalls resulted in high hydropower availability. Electricity produced from hydropower expanded 20.6% during the first eight months of 2011. Thermal power generation declined to below 80% of total generation in the same period. Coal demand by power utilities decreased accordingly and the continued arrival of new coal cargoes just exacerbated the supply glut. At the end of June 2012, coal stocks at ports and power plants’ yards, reached record highs: about 380 million tons, the equivalent of more than one month of consumption.
The government has tried to solve the oversupply by proposing a cap on China’s coal production. In July, the National Development and Reform Commission (NDRC) announced that national production would be capped at 3.65 billion tons in 2012, a 3.7% increase over 2011 - a very small increase by Chinese standards. In September, Chinese banks cut lending to coal traders and tightened credit terms due to worries about defaults.
The expected outcome of the measures has not been reached however: first data show that coal imports reached a record level in 2012 and production increased by 5% to above 3.7 billion tons.
Million tons 2007 2008 2009 2010 2011
Indonesia 14,1 11,6 30,5 56,3 101,2
Australia 4,5 3,5 44,6 37,0 32,6
Vietnam 24,6 16,9 24,1 18,1 22,1
Mongolia 3,2 4,0 6,0 16,6 20,2
North Korea 3,7 2,5 3,6 4,6 11,1
Russia 0,3 0,8 11,8 11,6 10,6
South Africa 0,0 0,0 0,8 7,0 10,5
USA 0,0 0,2 0,8 4,5 4,9
Canada 0,2 0,6 4,1 5,5 4,5
Others 0,3 0,7 0,4 5,1 4,9
TOTAL 51,0 40,8 126,6 166,3 222,4

Sylvie Cornot-Gandolphe / Global Coal Trade
22 © Ifri
Curbing future coal output Nevertheless, there is a strong willingness to curb production growth. The 12th Five-Year Plan indicates a cap on domestic production at 3.9 billion tons by 2015. As coal demand (in absolute terms) is expected to continue its rise, the future of coal imports in the country could therefore be very bright provided that import prices remain below domestic prices and infrastructure bottlenecks are not lifted. There are plans to develop huge coal mines and infrastructure in the north-western part of the country. If realized according to the 12th Five-Year Plan, the north western Xinjiang region could become one of the largest coal mining provinces leading to more competition between national and imported coal. These issues are further discussed in box 3.
Box 3 Will China remain a strong importer?
The energy policy of China, published in October 2012, and the Energy Five-Year plan, published in January 2013, foresee a major change in the energy mix of the country compared to previous trends. China intends to transform its energy production and utilization modes, to curb CO2 emissions by unit of GDP. The country will increase the share of non-fossil fuels in primary energy consumption to 11.4% (up from 8.3% in 2010) by the end of the 12th Five-Year Plan and to 15% by 2020. The share of non-fossil fuels in generating capacity is expected to increase to 30% by 2015 (up from 20% currently).
Efforts are focused on the development of hydropower, which allows more than half of the increase in non-fossil energy consumption by 2020, and nuclear. The country's installed hydropower generating capacity is expected to reach 290 GW by 2015 (230 GW in 2011). About 40 GW is expected to come from nuclear power by 2015. The installed generating capacity of wind power is expected to reach 100 GW and solar energy to exceed 21 GW by the end of 2015. Non-fossil energy capacity would therefore reach 451 GW, 30% of the 1,450 GW capacity installed by the end of 2015. China will continue to source a majority of its power from coal, and plans to add 300 GW of coal capacities by 2015, though coal’s share in total capacity is expected to fall to 64% by 2015. China will also continue to phase out inefficient coal plants.
Although this new policy marks a key change from past policies, coal consumption in absolute terms is expected to increase by 2015, reflecting the growth in total energy consumption, albeit at a much smaller rate than the ones experienced in the 2000s. A key difference however between the 11th and 12th plans is that the government will control the growth of the coal industry. The intention is to cap domestic production and consumption at 3.9 billion tons by 2015. Most analysts forecast a growth in coal consumption to 4.3 billion tons by 2015, requiring a large call on imports (almost 400 million tons depending on the actual level of production). However, if the government manages to actually cap coal

Sylvie Cornot-Gandolphe / Global Coal Trade
23 © Ifri
consumption at 3.9 billion tons, China could regain its self-sufficiency and almost withdraw from the international market. Imports in that case would be limited to specific coal qualities, mainly coking coal and high caloric value thermal coal, which are not widely available on the Chinese market.
This situation requires that the government also manages to develop coal mining capacity and logistics in West China as planned in the 12th Five-Year Plan. The plan foresees a huge development of coal production in western regions (the Xinjiang region mainly), which account for 72% of the new capacity to be added during the five-year plan. This corresponds to a capacity of an added capacity of 530 million tons per year.
The development of coal production in Xinjiang is a major challenge: the Uygur Autonomous Region is located in the extreme northwest of the country, nearly 3,000 km away from major northeastern ports. Xinjiang holds 40% of the country's coal resources (2.19 trillion tons), but produced only 120 million tons in 2011 (an estimated 140 million tons in 2012). The government aims to build 17 super-large coal mines in the region, boosting annual coal output to 400 million tons by 2015. It remains to be seen, however, if this development is feasible. The region of Xinjiang is extremely dry. Water management will be a key issue for coal miners. Transportation of coal to the east of the country is another major bottleneck. The railway from the west to the east is still very limited. To tackle this issue, a railway line is under construction between the Xinjiang region and the Gansu Province which will be able to transport 50 million tons a year by 2015.
The government also intends to increase the use of coal by wire, whereby energy from coal is transformed into electricity at mine-mouth thermal power plants and then delivered long-distance to demand centers. The major benefit of coal by wire is the potential reduction of coal transport requirements. However, coal by wire also has energy losses associated with transmission line losses in delivering the electricity. Another major challenge to coal by wire in Xinjiang is the high water requirement of thermal power plants. This is a major issue given the existing water shortage concerns in the Western region.
All in all, there are a large number of challenges to be tackled before China regains a self-sufficiency status. In the short to medium term, China is therefore expected to remain a large importer provided that international prices are right. However, imports are expected to peak around 2014-2015 and then gradually decrease in line with increased production, logistics development and slower demand growth. This expected development does not make investment decisions in coal exporting countries an easy task.

Sylvie Cornot-Gandolphe / Global Coal Trade
24 © Ifri
India
Although India is the third largest producer of coal (588 million tons in 2011), domestic production is insufficient to cover the country’s fast-growing needs, both for electric power producers and steel manufacturers. This was again illustrated by the large-scale blackout the country experienced in July 2012. Consequently India increasingly calls on the international market to make up the deficit of its internal coal market. In 2012, imports totaled 134 million tons, up 15% over 2011. While this figure is much lower than China’s imports, recourse to imports is crucial in a country where shortages of coal and electricity are recurrent. As 40% of the population still lacks access to electricity, the government has embarked on an extensive construction program of large power plants, most often located on the coast and powered by coal, resulting in a high demand for imported coal.
Booming coal demand India has an ambitious electrification program and in 2006 launched an initiative for the construction of 14 coal-based UMPPs (Ultra Mega Power Projects), each with a capacity of 4,000 MW. Although most plants were delayed, India’s power capacity reached 182 GW at end 2011, with 54% based on coal (100 GW). The new 12th Five-Year Plan (FY2012/13-2016/17) has confirmed this program, with the aim of adding 64 GW of thermal capacity in the next five years, almost entirely powered by coal (63 GW). The problem, however, is not capacity addition, but fuel availability. Coal consumption could reach 842 million tons by 2016-2017, in a base case scenario, and even 980 million tons in a high case scenario, a huge increase compared with demand in 2011 (650 million tons).
Securing coal supply Although India has large coal reserves, estimated at 113 billion tons (IGU, 2012), they are of poor quality (with a high ash content) and mainly confined to eastern and south central parts of the country, far away from centers of consumption. The inefficient inland transport puts regular pressure on domestic supply.
The national company, Coal India Limited (CIL), produces 80% of domestic coal. In FY2011/12, its production reached 434 million tons. The company has difficulties to increase its coal production which has stagnated since 2010. The government regularly introduces new reforms to improve the efficiency of the coal sector, but these have so far not borne fruit, due to the many hurdles to be surmounted. In order to secure domestic supply, the

Sylvie Cornot-Gandolphe / Global Coal Trade
25 © Ifri
government is pursuing a threefold strategy: increasing production, establishing a coordinated import policy, and acquiring mines abroad.
To increase domestic production, the government has introduced the so-called captive mines policy to open State mines to private investment. For various reasons, this policy failed: out of over 200 coal blocks, containing coal reserves of over 50 billion tons, only some thirty mines have started production and contributed merely 36.3 million tons in FY 2010-2011 against a target of 104 million tons. In 2010, the government introduced a radical reform in allocating licenses for the captive mines. Licenses are now auctioned to avoid discretionary allocation. However, a fierce battle has developed between the Ministry of Coal and the Ministry of the Environment. This latter ministry insisted on the need to protect dense forest areas and at-risk populations, and has therefore set up “no go” zones where all mining development is forbidden. The 12th Five-Year Plan foresees an increase of coal production from 550 million tons in 2011-2012 to 640 to 795 million tons in 2016-2017. However a large part of the increase is expected to come from the captive mines, which contribution to domestic supply is very uncertain.
Greater reliance on coal imports India has increasingly turned to the international market to fill the widening gap between domestic production and growing demand. Imports surged from 54 million tons in 2007 to 116 million tons in 2011 and an estimated 134 million tons in 2012 (Table 2). The Indian steel industry is also contributing to the growth. India is the world’s fourth largest producer of steel (77 million tons produced in 2012), and this is only the beginning, given the current low level of steel consumption per capita. Its reserves of coking coal are also of poor quality, leaving steel producers, whether public or private, with no other option than turning to imports (34 million tons in 2011).
Table 2: India’s coal imports by source, 2007-2011
Source: IEA, VDKI, Bureau of Resources and Energy Economics (BREE), Australian Government, 2011 estimated.
Million tons 2007 2008 2009 2010 2011
Indonesia 23,1 22,5 31,0 43,9 65,5
Australia 19,6 24,2 24,3 31,4 30,9
South Africa 6,3 8,1 17,1 22,7 17,0
United States 0,7 1,2 1,5 1,7 2,4
China 0,9 0,9 0,0 0,0 0,0
Others 2,0 0,7 2,1 1,0 0,6
TOTAL 52,6 57,6 76,0 100,7 116,4

Sylvie Cornot-Gandolphe / Global Coal Trade
26 © Ifri
India: catching up with China in coal imports Given the gap between future domestic production and demand, imports could reach and certainly exceed 200 million tons by 2016-2017. Ultimately, India could overtake China as the world's largest importer and it would be the decisions taken in New Delhi that would become paramount on the international coal market. This heavy reliance would be costly for India as the price of international coal is higher than domestic coal and would add an additional burden on power utilities and India’s trade balance.
Japan/South Korea/Taiwan
Japan, South Korea and Taiwan constitute the traditional Asian buyers’ group. The three countries, which do not produce coal, rely on imported coal to fuel coal-based power generation and to manufacture steel products. In the past four years, they had to face a dramatic decline in China’s coal exports which were replaced by Australian, Indonesian and U.S. tonnages mainly.
Japan was the largest global coal importer until 2011 Japan was the largest global coal importer until 2011, ahead of China. In 2011, the country imported 175 million tons, a decrease by 9 million tons compared with 2010 (Table 3), mainly due the impact of the tragic Fukushima accident. The earthquake not only destroyed the Fukushima nuclear power plant, but also damaged five coal plants (with a capacity of 7 GW), as well as port reception capacities for coal. Power utilities, Tokyo Electric Power Company and Tohoku Power Company, declared force majeure on their imports. It was not until the summer 2011 that the restarting of three plants allowed Japan to increase its imports, which were nevertheless 5% lower over the year. Lower import demand by steel buyers also contributed to the decrease. In 2012, Japanese imports recovered and are estimated at 182 million tons. All the power plants damaged by the earthquake resumed operations, except the Haramachi plant expected to re-start in 2013.

Sylvie Cornot-Gandolphe / Global Coal Trade
27 © Ifri
Table 3: Japan’s coal imports by source, 2007-2011
Source: IEEJ, 2012 (Trade Statistics of Japan)
Japanese imports are dominated by steam coal imports (107 million tons in 2011). These imports fuelled the coal-fired power plants of the country, as well as some industries. Today coal accounts for 25% of electricity generation. Coking coal imports accounted for 39% of total imports in 2011 (68 million tons). Crude steel production amounted to 108 million tons in 2011, a slight decrease compared with 2010, and was stable – except in 2009 – at around 110-120 million tons a year over the past decade. Australia and Indonesia are the major exporters to Japan accounting for 80% of the total imports. In the past three years, Chinese coal was replaced by U.S. imports mainly.
Japan’s new energy policy, announced in September 2012, aims to boost the use of coal-fired plants for base-load power generation to reduce reliance on nuclear power. Tokyo Electric Power Company expects to double its coal imports to 6.2 million tons in 2013, to feed a doubling in the capacity of its coal-fired power plants to 3,200 MW. Its imports are expected to double again by 2021. The company could hold auctions in 2013 for the construction of three coal-fired power plants with a total capacity of 2,600 MW.
South Korea also holds a large share in coal trade South Korea has a similar situation than Japan. It does not produce any coal and heavily relies on coal imports for its electricity and industrial needs. The country imported 129 million tons in 2011 and has continuously increased its coal imports to meet growing demand from the power sector (Table 4). Despite that, the demand is not fully covered and the country experiences recurrent electricity shortages. South Korea also imports large quantities of coking coal. Its crude steel production reached 69 million tons in 2012, a similar level than in 2011.
Like for Japan, Australia and Indonesia accounts for the lion’s share of Korean imports (66% in 2011). The decreasing supplies from China have been replaced by rising imports from Canada, the United
Million tons 2007 2008 2009 2010 2011
Australia 113,4 117,7 102,9 117,5 104,8
Indonesia 32,7 35,5 31,3 33,8 35,5
Russia 11,5 10,0 8,9 10,7 11,4
Canada 10,6 10,5 9,2 10,5 9,6
United States 0,0 1,6 0,8 3,1 6,3
China 15,2 13,3 6,2 6,3 5,0
Vietnam 2,2 2,0 1,3 1,7 1,3
Others 1,0 1,0 1,0 0,9 1,4
TOTAL 186,6 191,6 161,6 184,5 175,3

Sylvie Cornot-Gandolphe / Global Coal Trade
28 © Ifri
States, Russia and South Africa. South Korean imports have increased rapidly over the past few years as a large part of coal imports comes from Indonesia and is constituted by low rank coal, requiring more tonnage for the same calorific value. This trend is not confined to Korea but to all buyers of Indonesian low rank coal.
Table 4: South Korea’s coal imports by source, 2007-2011
Source: IEEJ, 2012 (South Korean Trade Statistics)
Taiwan Taiwan imported 66 million tons in 2011 (Table 5). The largest part is steam coal (62 million tons) mostly used in Taipower’s coal-fired power plants. The country also imported 3.8 million tons of coking coal. China’s exports to Taiwan have decreased markedly since 2009. The decrease was compensated by rising imports from South Africa.
Table 5: Taiwan’s coal imports by source, 2007-2011
Source: IEA
Million tons 2007 2008 2009 2010 2011
Australia 29,2 38,2 42,9 43,0 44,8
Indonesia 25,3 26,6 33,6 40,8 40,3
Canada 6,1 6,5 7,7 9,9 14,5
Russia 6,4 7,5 4,7 8,6 12,7
United States 0,3 1,0 1,6 2,7 6,1
China 19,9 17,9 9,7 7,3 5,2
South Africa 0,3 0,6 0,6 2,4 3,0
Vietnam 0,7 1,2 1,8 1,8 1,7
Others 0,1 0,1 0,4 2,2 1,0
TOTAL 88,3 99,5 102,9 118,5 129,2
Million tons 2007 2008 2009 2010 2011
Australia 27,3 26,1 25,9 28,8 26,4
Indonesia 23,7 25,9 27,8 24,2 27,3
China 13,3 11,3 4,6 4,2 2,2
South Africa 0,6 0,0 2,3 2,7 4,4
Others 4,0 2,8 3,2 4,9 6,0
TOTAL 68,9 66,1 63,8 64,8 66,3

Sylvie Cornot-Gandolphe / Global Coal Trade
29 © Ifri
Europe4
Although Europe (EU 27) is still a large coal producer (576 million tons in 2011 for hard coal and lignite), it supplements its coal production with rising coal imports to compensate the decline in domestic coal production and feed the recent increase in demand by power utilities.
The European “coal revolution” EU coal consumption reached its lowest level in 2010 at 715 million tons (of which 297 million tons were hard coal and 418 million tons lignite, Figure 13). Since then, consumption has resumed a growing trend: an increase of 7.2% was recorded in 2011 and an estimated 2.3% in 2012 (all on a tonnage basis).
Figure 13: EU coal consumption, 2000-2012
Note: gross consumption. All data on a tonnage basis, i.e. without taking into account the calorific value of the different types of coal. 2012 data are based on the first eight months of the year. Source: EUROSTAT, estimates
Whereas the economic crisis in the Eurozone has reduced total electricity demand and cut output at industrial facilities, coal demand by power utilities is increasing and the share of coal in total electricity generation is rising while the share of gas is decreasing (Figure 14). This paradox is due to the competitiveness of coal in the power sector, where its main competitor, natural gas, is disadvantaged by its high price and the collapse of the price of CO2.
4 See the previous report published in October 2012: The European Coal Market: Will
Coal survive the EC's Energy and Climate Policy?, note de l’IFRI.

Sylvie Cornot-Gandolphe / Global Coal Trade
30 © Ifri
The situation is the opposite in the United States (see Chapter 3) where coal consumption by power plants has fallen. U.S. coal is displaced by cheaper natural gas, which prices have come down with the “shale gas revolution”. The continued downward trend in European coal prices is largely explained by the availability of large amounts of U.S. and Colombian coal (see Table 6).
Figure 14: The coal paradox
Note: The United Kingdom is given as an illustration for Europe as monthly data for the EU27 are not yet available. Sources: Department of Energy and Climate Change (DEEC), United Kingdom, EIA, United States
A surge in coal imports
After two years of contraction, European imports rose 14.5% from 165 million tons in 2010 to 189 million tons in 2011 (Table 6). While imports of coking coal remained stable (48 million tons), steam coal imports grew under the combined effect of restocking, decline of European production, mainly in Germany and Poland, and above all low coal prices which boosted its demand by power utilities. The cold winter during the first quarter of 2011 also contributed to increased consumption of electricity and coal.

Sylvie Cornot-Gandolphe / Global Coal Trade
31 © Ifri
Table 6: Europe’s hard coal imports by source, 2007-2011
Source: EUROSTAT
In 2012, despite the Eurozone crisis, coal trade has continued to progress. Imports are estimated at 210 million tons, boosted by the fall in import prices and the competitiveness of coal in the power sector. Imports increased faster than consumption and stockpiles of coal at major ports and power plants remained high.
As shown in Table 6 and Figure 15, the surge in coal imports in 2011-2012 mainly benefited to Colombia and the United States. The structure of hard coal imports changed significantly during the past five years:
Russia and Colombia remain the two leading sources, with shares of 27.5 % and 24.2 % respectively in 2011. But the United States in third position, has gained a higher share of the European market (18.4 % in 2011 vs. 15.6 % in 2010). U.S. steam coal supplies to Europe more than doubled in 2011 (from 8 to 18 million tons, including exports to Turkey) and again almost doubled in 2012 (to an estimated 31 million tons).
Declining steam coal exports from Indonesia and South Africa were replaced by greater supplies from Colombia and the United States.
Declining Australian imports is mainly due to competition from North American exporters. These exported 25 million tons of coking coal to Europeans buyers in 2011.
Million tons 2007 2008 2009 2010 2011
Russia 54,9 55,0 53,5 46,6 52,1
Colombia 29,1 26,9 31,8 34,2 45,7
United States 20,3 29,0 22,8 25,7 34,9
Australia 29,9 26,2 15,0 17,5 16,8
South Africa 46,0 37,1 28,3 16,2 15,7
Indonesia 16,8 14,6 12,6 9,4 9,7
Canada 6,9 5,6 2,5 3,7 4,6
Ukraine 3,8 3,2 2,2 3,1 3,9
Others and non specified 12,4 12,7 10,4 9,0 5,8
TOTAL 220,1 210,3 179,1 165,4 189,2

Sylvie Cornot-Gandolphe / Global Coal Trade
32 © Ifri
Figure 15: EU hard coal imports (index, January 2009 = 100)
Source: EUROSTAT
Major EU importing countries In 2012, the major European coal markets registered significant growth in consumption and imports, however at different rates. The most dramatic change occurred in the United Kingdom and Spain. They absorbed most of the excess tonnage supplied into Europe in 2012, particularly the oversupply of cargoes from the United States and Colombia.
In the United Kingdom, the falling price of imported coal increased its competitiveness and led to a surge in coal use. Generators switched from gas to coal to reduce costs. Steam coal imports reached 20 million tons in the first half of 2012, a 66% rise over the same period of 2011, and are expected to reach 36 million tons, up 10 million tons over 2011. This new trend may be short-lived. The introduction of a carbon price floor (CPF) in 2013 will add £11.88/t in 2013 rising to £23.69/t in 2015. This is an increase on current coal prices of 15% and 30% respectively. An increase of 15% would still favor coal over gas, so the rising coal burning should last until 2015. By that date, the increased rate of the CPF may result in switching from coal to gas. However, it largely depends on the development of prices of the two fuels.
In Spain, coal also benefited from increased competitiveness in the power sector, helped by low hydro levels during summer 2012. According to data from grid operator Red Electrica, the share of coal in power generation increased to 20% in 2012, against 15% in 2011. Coal use by power plants increased 29% during the year. Coal exporters largely benefited from this increase. Steam coal imports surged in the first three quarters of 2012 and are expected to reach 18 million tons in 2012, from 13.5 million tons in 2011. Spanish imports have traditionally come mostly from South Africa and Russia, with some plants burning Indonesian coal. But utilities added new supplies from the United States and Colombia in 2012. A radical change in coal imports is expected in 2013 as new regulations and

Sylvie Cornot-Gandolphe / Global Coal Trade
33 © Ifri
levies unfavorable to coal burning are introduced in the country. A tax on carbon-based fuels, ranging from €0.0279 per cubic meter of natural gas to €14.97 per ton of coal, will apply.
In Germany, imports fell 7% in 2012 to 45 million tons although coal consumption by power plants increased. The country produces its own lignite which fuels a 6.1% increase in coal consumption by power plants. The world’s biggest lignite-fired power plant was opened in July 2012 in Neurath. It is one of eleven coal-fired plants being built in Germany today. In the coming years, the role of coal will be reinforced by the phasing out of nuclear power. Exactly how Germany will replace generation from nuclear plants remains uncertain, but clearly, for now, coal is part of the answer. The decline in domestic production coupled with the start-up of new hard coal-fired plants will drive imports up.
Italy’s coal imports increased to an estimated 19 million tons in 2012, up 12% over 2011, boosted by demand from Enel’s Torrevaldaliga Nord power plant, which saw its first calendar year at full capacity. Future imports of steam coal are expected to rise sharply, following the construction of two new coal-fired power stations – one in Saline Joniche in southern Italy, the other in Vado Ligure in the north.

34 © Ifri
Major coal exporters
Six countries dominate coal exports: Indonesia, Australia, Russia, the United States, Colombia and South Africa (Figures 16 and 17). Altogether they account for 84% of total trade. The eastward shift of coal markets is strongly and structurally affecting the business of major exporting countries and companies. They are all developing new Asia-focused trading patterns. The increase in Chinese and Indian demand and imports has resulted in a high growth of exports from traditional suppliers of the Pacific basin (Indonesia and Australia). It has also attracted suppliers of the Atlantic basin (Russia, Colombia, the United States and South Africa) which have re-oriented their exports towards the growing Asian market (Figure 18). The growth of Atlantic supplies to the Pacific basin has increased the linkage between the two basins and reinforced competition in the market. On the Atlantic basin, the availability of large U.S. tonnage has triggered a surge in European imports. Intense competition has also developed between suppliers for a share of the European market.
This chapter looks at major exporting countries and analyses their export strategies.
Figure 16: Development of coal trade by major exporting country, 1992-2012
Source: EIA, 2012: estimates

Sylvie Cornot-Gandolphe / Global Coal Trade
35 © Ifri
Figure 17: Top ten exporting countries, 2012 and 2011 vs. 2005
Source: IEA, 2012: estimates
Figure 18: Atlantic coal supplies to Pacific buyers
Source: VDKI and own calculations
Australia
Australia is a major player on the international coal market. It was the largest global exporter until 2011, overtaken by Indonesia that year. However, Australia remains the largest exporter of coking coal and to a large extent: the country accounts for half of global exports. Australia is well endowed with coal resources and has a strategic position close to major Asian countries (however farther than Indonesia, its major competitor on the steam coal market). Coal is of strategic importance for Australia. It is the second largest commodity export after iron ore, with earnings of around Australian dollar (AUD) 45 billion in 2011.
Sylvie Cornot-Gandolphe / Global Coal Trade
36 © Ifri
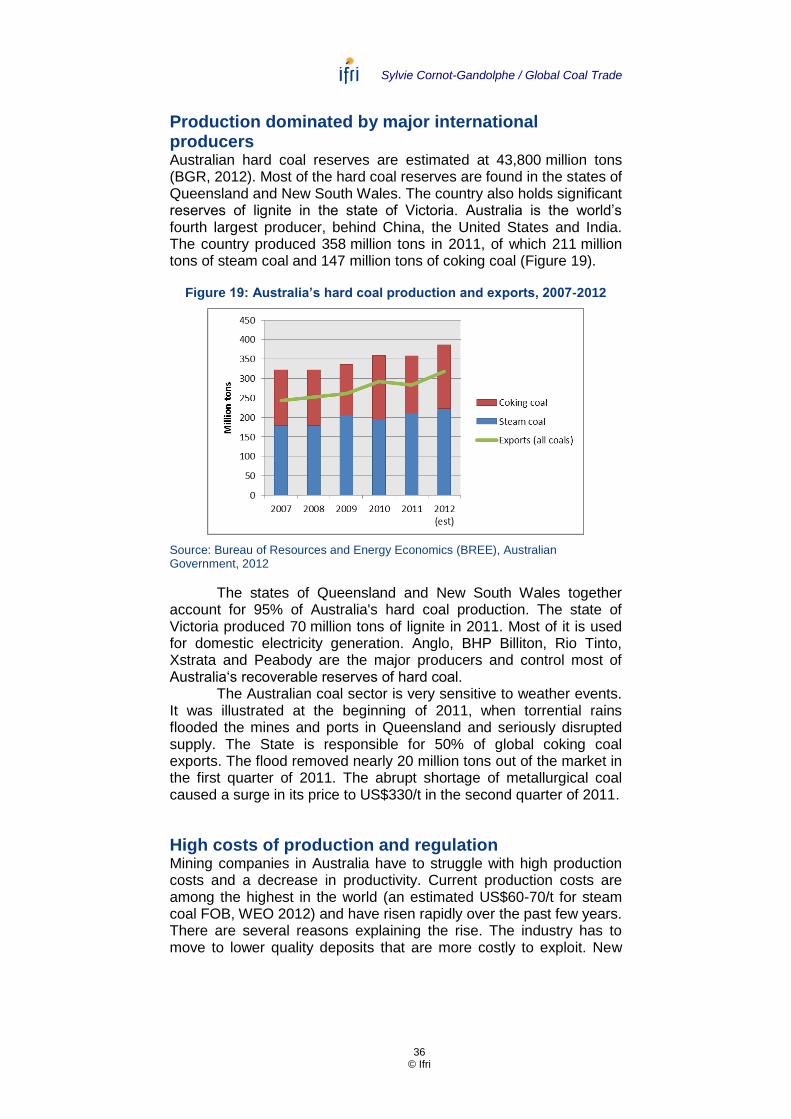
Production dominated by major international producers Australian hard coal reserves are estimated at 43,800 million tons (BGR, 2012). Most of the hard coal reserves are found in the states of Queensland and New South Wales. The country also holds significant reserves of lignite in the state of Victoria. Australia is the world’s fourth largest producer, behind China, the United States and India. The country produced 358 million tons in 2011, of which 211 million tons of steam coal and 147 million tons of coking coal (Figure 19).
Figure 19: Australia’s hard coal production and exports, 2007-2012
Source: Bureau of Resources and Energy Economics (BREE), Australian Government, 2012
The states of Queensland and New South Wales together account for 95% of Australia's hard coal production. The state of Victoria produced 70 million tons of lignite in 2011. Most of it is used for domestic electricity generation. Anglo, BHP Billiton, Rio Tinto, Xstrata and Peabody are the major producers and control most of Australia‘s recoverable reserves of hard coal.
The Australian coal sector is very sensitive to weather events. It was illustrated at the beginning of 2011, when torrential rains flooded the mines and ports in Queensland and seriously disrupted supply. The State is responsible for 50% of global coking coal exports. The flood removed nearly 20 million tons out of the market in the first quarter of 2011. The abrupt shortage of metallurgical coal caused a surge in its price to US$330/t in the second quarter of 2011.
High costs of production and regulation Mining companies in Australia have to struggle with high production costs and a decrease in productivity. Current production costs are among the highest in the world (an estimated US$60-70/t for steam coal FOB, WEO 2012) and have risen rapidly over the past few years. There are several reasons explaining the rise. The industry has to move to lower quality deposits that are more costly to exploit. New

Sylvie Cornot-Gandolphe / Global Coal Trade
37 © Ifri
developments are further away from major rail and port infrastructure. Input costs such as labor, machinery, equipment’s hire and diesel fuel have all increased dramatically. Margins are further squeezed by the rising cost of infrastructure access, the appreciation of the Australian dollar against the U.S. dollar and escalation in capital costs.
Moreover, the increasing cost of regulation and the introduction of new taxes also elevate the production costs. Australia introduced a carbon tax in July 2012. The tax applies to the country’s 500 most polluting companies and amounts to AUD23 (about €19) per ton of CO2 emitted. The tax applies to the mining of coal, as opposed to the burning of coal for electricity generation. It adds a new burden to the coal mining industry, estimated at AUD18 billion by 2020. The government also introduced a new tax on profit of coal and iron ore companies in July 2012 (the Minerals Resource Rent Tax).
Growing exports to traditional and new customers Australia’s coal exports totaled 284 million tons in 2011. Thermal coal exports declined 3%, relative to 2010, to 144 million tons. Projections for 2012 see an increase of 10% to 158 million tons, driven by growing demand in Asia. Australia’s exports of metallurgical totaled 141 million tons in 2011, down 11% due to the flooding. They rebounded to 160 million tons in 2012 as production returned to normal operation at flood-affected mines.
Japan is the largest importer with 112 million tons (i.e. a share of 39%), followed by South Korea, India and Taiwan. Together they account for 88% of hard coal exports with a further 28 countries taking the remaining 12%. Europe is a large importer of coking coal (17 million tons). In the past three years, China has become a major buyer of Australian steam and coking coal. India has become a large buyer of coking coal (Table 7).

Sylvie Cornot-Gandolphe / Global Coal Trade
38 © Ifri
Table 7: Australia’s steam and coking coal exports by destination, 2007-2011
Million tons 2007 2008 2009 2010 2011
Brazil 3,1 3,9 4,2 4,2 2,9
China 3,0 1,5 14,8 27,3 15,7
Taiwan 8,0 6,4 2,7 5,4 8,1
European Union 27 24,9 24,5 14,7 15,6 17,1
India 19,6 24,2 24,3 31,4 30,9
Japan 48,9 50,2 42,2 48,5 42,6
South Korea 6,3 8,4 13,1 15,9 16,4
Others 18,3 17,8 9,4 9,1 6,8
World 132,0 136,9 125,2 157,3 140,5
China 3,2 1,5 8,4 13,9 16,7
Taiwan 16,2 18,6 20,3 19,6 20,1
European Union 27 3,8 2,2 3,7 0,3 0,1
Japan 58,6 66,9 62,6 66,4 67,0
South Korea 15,1 18,6 30,1 24,8 28,2
Others 14,7 7,4 11,2 10,0 11,2
World 111,6 115,1 136,4 135,0 143,3
Total coal 243,6 252,0 261,6 292,3 283,8
Metallurgical coal
Thermal coal
Source: BREE 2011, Resources and Energy Statistics 2011
Shortage of port capacity has limited exports Australia’s coal exports have been plagued by a structural shortage of rail and port capacity over the past six years. Port bottlenecks have been a recurrent issue, with dry bulk vessels queuing for weeks before loading. The coal industry was hurt by high demurrage costs and loss of revenue. As a result, Australia has started to lose its competitive edge and its share of the world thermal coal trade has declined since 2006.
Coal exports are serviced by nine major coal ports and export terminals located in the states of Queensland and New South Wales. These terminals had a combined handling capacity of 393 million tons a year in 2011 (BREE, 2012). Recent expansions to capacity at Hay Point and Abbot Point ports added some 50 million tons a year and relieved the country’s shortage in port capacity. Australia is further increasing infrastructure capacity to match long-term demand. Several new projects are in various stages of development and are expected to add about 60 million tons a year to annual coal export capacity by 2015. An additional capacity of 200 million tons a year is planned in the medium term.

Sylvie Cornot-Gandolphe / Global Coal Trade
39 © Ifri
Production and job cuts However, the reduced margins coupled with the recent fall in coal prices have moderated Australia’s coal industry expansion. Mining companies have announced reviews of their investment plans. BHP Billiton, Xstrata, Rio Tinto, Anglo and Peabody all cut output at their highest cost mines or even close them. Workforce reduction amounted to 3,500 jobs from April to September 2012. In August 2012, BHP announced that it would not proceed with its major investment in the Olympic Dam uranium mine (AUD30 billion) and an AUD20 billion expansion of Western Australia's Port Hedland. In September 2012, Peabody Energy Corp deferred an AUD500 million sale of its Willkie Creek thermal coal mine in Queensland after failing to attract a worthwhile bid. Other big deals shelved in 2012 are the AUD5 billion failed privatization of Whitehaven Coal Ltd, the AUD4.5 billion cancelled auction of New Hope Corp Ltd and Vale's sale of its AUD500 million Integra Mine in New South Wales.
The future expansion of Australian coal exports is strongly linked with gains in productivity and a recovery in international coal prices. Development in competing countries, Indonesia and the United States for steam coal, Mongolia, Mozambique, the United States and Canada for coking coal, will be a determining factor as well as the evolution of demand in importing countries, China and India particularly.
Indonesia
Over the past two decades, Indonesia's coal industry has transformed itself from being an unknown, minor player in Asia's coal markets to the world's largest exporter of steam coal. The country has significant reserves of bituminous and sub-bituminous coal, which is particularly well-suited to the needs of Indian and Chinese power stations, Indonesia’s two main markets. It also enjoys a strategic geographical position, at the center of the Pacific basin, and very favorable production costs and internal transport logistics (mainly by barge).
A fast development of production Indonesia is well endowed with coal resources. It holds 21 billion tons of coal reserves at end 2011 and its resources are huge. To promote mining development, a new Law on Mineral and Coal Mining was enacted in 2009. It simplifies licensing and clarifies responsibilities among central, provincial, and district authorities. Coal production reached 376 million tons in 2011 and an estimated 409 million tons in 2012. Indonesia has been able to increase its production by 50% over the period 2007-2011 (Figure 20). The country produces a large quantity of sub-bituminous coal, as well as “off-spec” coal with a calorific value under 4,100 kcal/kg, lignite and PCI. Reserves and

Sylvie Cornot-Gandolphe / Global Coal Trade
40 © Ifri
production are spread within two States: Kalimantan and Sumatra. Most production today comes from East and Central Kalimantan. New mines development is focused on South Sumatra and Central Kalimantan. The big five Indonesian companies – Bumi, Adaro, Banpu, Kideco, Berau – have ambitious plans to develop their production and invest further in port capacity, helped by foreign investors.
Figure 20: Indonesia’s coal production and exports, 2007-2012
Source: IEA, 2012: estimates
Indonesia enjoyed one of the lowest costs of production in the world (between US$18 and US$37/t in 2007). However as the much easiest mines are depleting, the country has to turn to more difficult mines, located farther from the ports, and deeper. The cost of production, including domestic transportation cost, almost doubled in the past five years and reached between US$38 and US$55/t in 2012. Indonesia nevertheless remains one of the lowest cost producers in the world.
A surge in steam coal exports over the past five years Thanks to low production costs and proximity to major customers, Indonesia’s coal exports have increased by more than 100 million tons over the past five years from 195 million tons in 2007 to 310 million tons in 2011 (Table 8). The major importers are China, India, South Korea, Japan and Taiwan.

Sylvie Cornot-Gandolphe / Global Coal Trade
41 © Ifri
Table 8: Indonesia’s coal exports by destination, 2007-2011
Note: Export data defer greatly from one source to another. One reason may be that Indonesia exports large volumes of “off spec” low calorific value coal, which is closer to lignite than hard coal, and not accounted for in the hard coal statistical exports. Another reason is that there are still numerous illegal mines in Indonesia, whose production/exports are not accounted for in the official data. Data for exports to China include 36 million tons of lignite in 2011. Sources: IEA, VDKI, Mc Closkey, own calculations
Although coal exports were expected to continue their strong growth in 2012, rising costs and falling export prices slowed down the growth. Coal exports increased by 18 million tons only to 327 million tons in 2012. Small coal mines, often operated illegally, were shut down in response to lower prices. The major producers, such as Bumi and Adaro, which operate some of the country’s least expensive mines, also saw their margins squeezed. Bumi, the first producer, posted a net loss in the first half of 2012. Adaro, the second largest producer cut its 2012 production target. All companies have announced costs reductions and cut in coal output and miners are reconsidering expansion plans.
Many challenges ahead In the future, the country‘s large reserves should enable a big increase in coal production and exports. Indonesia has nevertheless many challenges to face. Its domestic consumption is booming as the country enjoys high economic growth (6.5% in 2011). Coal consumption, which reached 60 million tons in 2011, is expected to increase fast with the construction of 13 GW of new thermal capacity by 2015. The uncontrolled rise in coal exports has led the government to prioritize the domestic use of coal over its exports and to introduce more regulation in the sector. A ban on exports of low calorific value coal was planned from 2014. But the government decided in January 2013 not to proceed with the proposed ban and instead to control coal output by giving each producing region an annual mining quota. The government has also mandated producers to set aside part of their production for domestic consumption (20-25%). A tax on the export of unprocessed coal is also under consideration, although no date has been fixed yet.
Million tons 2007 2008 2009 2010 2011China 14,1 11,6 30,5 56,3 101,2
India 23,1 22,5 31,0 43,9 65,5
South Korea 25,3 26,6 33,6 40,8 40,3
Japan 32,7 35,5 31,3 33,8 35,5
Taiwan 24,6 26,0 24,1 21,3 26,6
Other Asia 52,6 60,4 67,3 59,3 29,3
EU27 16,8 14,6 12,6 9,4 9,7
Americas 5,3 2,7 3,1 2,4 1,4
TOTAL 194,5 199,9 233,4 267,2 309,5

Sylvie Cornot-Gandolphe / Global Coal Trade
42 © Ifri
The upstream regulation is also challenging. The government plans to raise coal mining royalties and a new regulation, announced in March 2012, requires foreign investors in mining companies to divest 51% of their shares by the tenth year of production, but uncertainties remain over applicability and pricing.
Despite the current slowdown and regulatory uncertainties, Indonesia will need heavy investment in new mining and infrastructure to ensure rising domestic and export needs. Its potential remains enormous: production could exceed 680 million tons by 2020 (Sastrawinata T., 2012), sufficient to serve domestic demand and growing exports.
United States
The decline in domestic coal consumption linked to the “shale gas revolution” and low natural gas prices, has given U.S. miners greater incentive to find alternative outlets. U.S. coal exports to Europe and Asia surged in 2011 and 2012. Intense competition has developed between global coal suppliers and eventually drove prices down. This creates a tricky situation for U.S. exporters for whom exports are profitable to some price level only.
Shale gas competition is evicting coal on the domestic market The fast increase of gas production, up 6% in 2011 and 4.5% in 2012, resulted in a collapse of gas prices on the U.S. market to $2.75/million Btu in 2012. This made coal uncompetitive and limited its use in the electricity sector, its main outlet on the U.S. market (92% of total coal demand). Demand for coal by power utilities dropped 11% in 2012 and the share of coal in power generation fell to 37%, displaced by cheap gas, which increased its share to 31% (Figure 21).

Sylvie Cornot-Gandolphe / Global Coal Trade
43 © Ifri
Figure 21: U.S. electricity generation by fuel, 2004-2012
Source: EIA, Short-Term Energy Outlook, November 2012
In addition, stricter environmental standards in terms of coal production and its consumption in power plants cloud the future of coal in the country. In 2010, the Environmental Protection Agency (EPA) issued new regulatory guidelines and reviewed new mining permits, in particular, those that involve “mountaintop removal” mining, the practice of blowing the tops of mountains to get at the coal seams underneath. The guidelines aim at limiting or eliminating such mining practice. On the consumption side, new regulations proposed in July 2011 on air pollution (the Cross-State Air Pollution Rule) require a drastic reduction in SO2, NOx and mercury emissions from power plants in twenty-seven East Coast states. In December 2011, the EPA decreed that all coal-fired power plants must meet new regulation for pollution reduction by 2016. The expected outcome of the new regulation is the retirement of 27 GW of capacity between 2012 and 2016 (IEA, 2012).
The decrease in coal demand has triggered a decrease in domestic production to 926 million tons in 2012, down 6.8% from 2011. The situation may improve in 2013 as gas prices are expected to rise from their low level which makes shale gas unprofitable for most producers of dry gas. The EIA projects power sector coal consumption to grow by 6% in 2013 as higher natural gas prices lead to a reduction in natural gas‐fired generation.

Sylvie Cornot-Gandolphe / Global Coal Trade
44 © Ifri
U.S. exports at historical record levels To offset the loss on the internal market, U.S. coal mining companies turned to the export market. They achieved a record level of exports in 2011: 97 million tons, up 31% compared to 2010. They set a new record in 2012 with an estimated 112 million tons exported during the year (Figure 22).
Figure 22: U.S. coal exports, 2007-2012
Source: EIA
In 2011, the very attractive prices on the international market allowed exporters to increase their income by more than US$6 billion to US$16.5 billion. The year 2012 was not the same story. Although coal exports increased to a new record, the price on the international market was much lower squeezing the margins of coal producers already in a difficult situation on the domestic market. Most of them announced very poor and most often negative financial results. Consol, Arch, Alpha and Peabody all announced heavy cuts in coal output. One major company, Patriot Coal, even sought for bankruptcy protection in summer 2012.
The increase in exports was driven by both steam and coking coal exports The United States produces both steam and coking coal and has traditionally exports large quantities of coking coal to Europe and some steam coal to South American and African countries. Major changes in trade patterns were observed in the period 2010-2012.
- First, a very high increase in coking coal exports was experienced in 2010 and 2011 (Figure 23). Exports surged 50% in 2010, boosted by the recovery of the iron and steel industry after its collapse in 2009. In 2011, buyers of Australian coking coal had to replace the lost tonnage due to the flooding in Queensland. They all turned to North American suppliers. U.S. coking coal exports surged

Sylvie Cornot-Gandolphe / Global Coal Trade
45 © Ifri
to 63 million tons in 2011, an increase of 13 million tons compared with 2010. In 2012, a similar level of exports is expected.
- The second new trend observed during the past three years is the growing exports of steam coal (Figure 24). The first destination was Europe where the “coal renaissance” has benefitted U.S. exporters. U.S. exports to Europe (EU and Turkey) increased from 8 million tons in 2010 to 18 million tons in 2011, and an estimated 31 million tons in 2012. U.S. exporters were also able to capture new market shares in Asia. Steam coal exports to Asia rose from 0.8 million tons in 2009 to 7.4 million tons in 2011 and an estimated 9.4 million tons in 2012. This was a completely new business allowed by the high international steam coal prices which prevailed in 2011, and helped by low freight rates.
Figure 23: U.S. coking coal exports by destination, 2009-2012
Source: EIA, 2012: estimated
Figure 24: U.S. steam coal exports by destination, 2009-2012
Source: EIA, 2012: estimated

Sylvie Cornot-Gandolphe / Global Coal Trade
46 © Ifri
Since there are no large coal ports on the U.S. West coast, steam coal (as well as coking coal) has to be exported from the Gulf coast. It thus suffers a large maritime freight disadvantage compared with Australian or Indonesian coal. Steam coal prices therefore have to be sufficiently high to cover production, internal transportation, handling costs, and maritime freight. This was clearly the case in 2011. The fall in steam coal prices since February 2012 makes this new business unprofitable. Even trade to Europe at current prices (US$90/t beginning of December 2012) is not profitable for most mines. The cost of production in the United States is relatively high. Additionally, transportation costs are quite expensive, making U.S. steam coal at the top of the global cost curve (almost US$80/t FOB, WEO 2012). Therefore although exports were at record levels in 2012, they should decrease in the short term (see Box 4).
Box 4 The United States: still a swing supplier?
Traditionally, the United States are the swing supplier of the coal market. They enter the international coal market when prices are high and withdraw when prices come down. In this way, they play the role of “regulator” of the market. Figure 25 shows the development of monthly U.S. coal exports since 2000 in relation with European steam coal import prices.
It shows that coal exports have followed the trend in international coal prices, rising when coal prices rose and decreasing in line with coal prices. Although coal prices fell by 24% in 2012, coal exports rose by 16%. One explanation for the resilience of the still high level of coal exports is the signature of contracts for several shipments when prices were higher. This is the case for some U.S. producers which are tied with their contracts even if they lose money at current international coal prices. Exports nevertheless have started to decrease compared with their peak level reached in June and July 2012 and the scale back is expected to continue in 2013. The EIA expects that coal exports will decline in 2013 but remain above 90 million tons for the third straight year (EIA, 2012).

Sylvie Cornot-Gandolphe / Global Coal Trade
47 © Ifri
Figure 25: Monthly U.S. coal exports vs. European steam coal import prices, January 2000-December 2012
Source: EIA, International Coal Report
PRB coal and the export hub for the Pacific Northwest The situation however is quite contrasted among regions and producers. The netback calculation is different for coal from the Powder River Basin (PRB), located in the Wyoming and Montana states, which enjoys lower production costs (around US$10/t) and would be competitive in Asia provided that export capacity on the West coast is available. In 2011, almost 5 million tons of PRB coal was exported through the port of Seattle, Washington. But this represents a fraction of the PRB production. Wyoming is the top producing coal state, with 2010 production of 400 million tons — 41% of total U.S. production and approximately the same as the next seven largest coal producing states combined (EIA, 2012).
The next challenge therefore is to export PRB coal to the lucrative markets of Asia. Since the key factor here is port access, U.S. producers are planning to develop an “export hub for the Pacific Northwest”. There are several projects of new ports and railways under the planning stage. Two large port projects have been proposed in Washington State, Longview Terminal and Gateway Pacific Terminal. Along with three smaller projects in Oregon State, the proposals would add between 115 and 138 million tons a year in total export capacity (Table 9). In addition, 10 proposed terminals, although each small in scale, would together add 86 to 138 million tons a year in port capacity along the Gulf Coast.

Sylvie Cornot-Gandolphe / Global Coal Trade
48 © Ifri
Table 9: Proposed coal ports in U.S. Northwest
Source: Platt’s, companies’ websites
However, projects on the West coast face strong local opposition and challenging permitting issues. Community and environmental groups are concerned about coal dust from increased train traffic and the broader climate impacts from the coal being burned overseas. The impact of higher coal exports on domestic coal prices has not been discussed yet, although the issue is highly debated for LNG exports. U.S. steam coal exports to China would likely narrow the gap between U.S. domestic coal prices and international prices and may result in higher coal prices for U.S. power utilities.
Local opposition delays coal export projects and may even stop some of them. Originally expected to start construction in 2013, the Gateway Pacific Terminal at Cherry Point has suspended its timetable pending an environmental impact statement (EIS) from the Army Corps of Engineers. The Millennium Bulk Logistics Terminal at Longview has delayed its exports by one year pending an internal environmental assessment. Kinder Morgan's terminal at the Port of St. Helens was put on indefinite hold in August 2012 after Portland General Electric, which holds a sublease on the construction site, raised concerns over the impact of coal dust on electricity production. And in perhaps the clearest sign of uncertainty about the feasibility of the projects, Rail America scrapped its proposal to build a 5.5 million tons a year export terminal at Grays Harbor, Washington, in August 2012.
The future level of U.S. coal exports is strongly linked to the level of international prices and the building of new export capacities on the West coast enabling the country to remain competitive on the

Sylvie Cornot-Gandolphe / Global Coal Trade
49 © Ifri
Asian coal market. Challenging permitting issues and the recent fall in international coal prices do not suggest a quick realization of the export hub for the Pacific Northwest.
Pending construction of new ports on the West coast of the United States, the port capacity of the West coast of Canada is being used. Three Canadian ports, Westshore, Neptune (both near Vancouver) and Ridley (near Prince Rupert), have a current capacity of 49 million tons a year and are expanding to 75 million tons a year. This will allow more exports of Canadian and U.S. coal. There is also a plan to add a coal terminal at the Fraser River port, near Vancouver, with an initial capacity of 4 million tons a year, raised to 8 million tons a year later.
South Africa
South Africa, a large coal resource holder and producer, is the sixth largest coal exporting country in the world. Coal is vital to the national economy. It provides some 80% of total primary energy supply, 93% of electricity generation and is used as a feedstock to manufacture 30% of total liquids fuel requirements. Around 25% of total production is exported. South Africa was a major exporter to Europe but is more and more diverting its exports to the Asian market. Growing coal consumption and an inefficient transportation network have limited export growth in the past few years.
A large coal producer South Africa holds significant hard coal reserves, 27,981 million tons (BGR 2012) and also significant lignite reserves. The bulk of the reserves and the mines are in the Central basin, which includes the Witbank, Highveld and Ermelo coal fields. Other coal reserves are located in the Limpopo Province (Waterberg coal fields). Production totaled 253 million tons in 2011, making South Africa the world’s seventh largest producing country (Figure 26). A similar level is expected in 2012. Almost all production is thermal coal. The biggest coal producers are BHP Billiton, Anglo-American, Xstrata/Glencore, Exxaro and Sasol. They account for about 80% of total South African coal production.

Sylvie Cornot-Gandolphe / Global Coal Trade
50 © Ifri
Figure 26: South Africa’s coal production and exports, 2007-2012
Source: IEA, VDKI, Richards Bay Coal terminal, own calculations
The Central basin has been producing coal for many decades and, with the best seams now depleted, production is expected to reach a peak within the next few years and then begin to decline. This decline is likely to be offset by higher production from the northern Waterberg coal field, though significant investment in mining, processing and transport infrastructure will be needed (EIA, 2012). An investment of approximately ZAR90 billion (US$10 billion) will be required to develop 40 new mines, in order to meet the anticipated increase in both domestic demand and exports.
Increasing domestic demand South Africa’s economy is highly dependent on coal. Coal accounts for 80% of total primary energy supply and 93% of electricity generation. Coal also provides feedstock for the country's synthetic fuels manufacturing plants (Coal-to-Liquids). Total coal consumption reached 183 million tons in 2011. Rapidly rising electricity demand has led to severe power shortages in parts of the country. To meet growing electricity demand, Eskom, the national power utility, is restarting three mothballed coal-fired power plants with a combined capacity of 3,800 MW. The company has also begun the construction of two 4,800 MW coal-fired power plants at Medupi and Kusile. Eskom’s coal consumption is likely to increase by an additional 50 million tons by the end of the decade. Consumption by Sasol for the manufacture of liquids is also going to expand with plans to increase CTL production and reduce oil imports.
Coal production and demand in South Africa has remained fairly unbalanced, with rising coal consumption and exports on one hand and constrained supply sources on the other. Growing demand from Eskom and for exports has led the government to introduce more regulation in the sector although nationalization of the mines, as proposed by the African National Congress’s (ANC) Youth League, does not seem a likely option. A state-owned mining company was created in 2011 to develop a mine in the northeast of Mpumalanga

Sylvie Cornot-Gandolphe / Global Coal Trade
51 © Ifri
province and so help the government ensure adequate supplies to the country’s electricity sector.
Shifting trade patterns Exports totaled 72 million tons in 2011. They slightly increased in recent years but remained constrained by internal logistics. The main export port, the Richards Bay terminal, has a capacity of 91 million tons a year, but the railway line is limited to 78 million tons a year. To overcome this bottleneck, South African exporters fell back on the ports of Durban and Maputo.
South Africa’s coal export patterns have changed significantly in response to global demand. A rising share of exports to Asia (India and China particularly) from 15% in 2007 to 55% in 2011, has been accompanied by a decline in exports to Europe, from 80% in 2007 to 38% in 2011 (Table 10).
Table 10: South Africa’s coal exports by destination, 2007-2011
Sources: IEA, VDKI, McCloskey, own calculations
Transportation bottleneck Transportation bottleneck is a major issue. Railing capacity on the line to Richards Bay is insufficient and there are no railways from the Waterberg coal fields to the ports. To tackle the issue, in April 2012, Transnet launched an investment program of ZAR300 billion (US$35 billion) for the next seven years to upgrade rail and port infrastructure. Part of the plan is to build a railway line linking the ports with the Waterberg coal fields. The new line, to be built by 2015, will initially carry around 23 million tons a year. The plan also foresees to raise capacity of the rail line to Richards Bay to 98 million tons by 2019.
With these new investments, South Africa will be in a position to serve its domestic market as well as demand for exports. However, pending realization of these new projects, exports will remain constrained by inadequate transport infrastructure.
Million tons 2007 2008 2009 2010 2011
EU 27 46,0 37,1 28,3 16,2 15,7
Other Europe and Mediterranean countries 8,4 10,5 10,4 10,4 11,3
Total Europe and Mediterranean countries 54,4 47,6 38,7 26,6 27,0
Asia 10,1 11,1 22,9 37,7 39,1
of which China 0,0 0,0 0,8 7,0 10,5
of which India 6,3 8,1 17,1 22,7 17,0
of which South Korea 0,3 0,6 0,6 2,4 3,0
Americas 1,6 2,5 1,4 2,0 1,9
Africa 1,8 1,5 3,3 3,1 3,7
TOTAL 67,9 62,7 66,3 69,4 71,7
Share in total exports (%)
Europe and Mediterranean countries 80% 76% 58% 38% 38%
Asia 15% 18% 35% 54% 55%
Americas 2% 4% 2% 3% 3%
Africa 3% 2% 5% 4% 5%
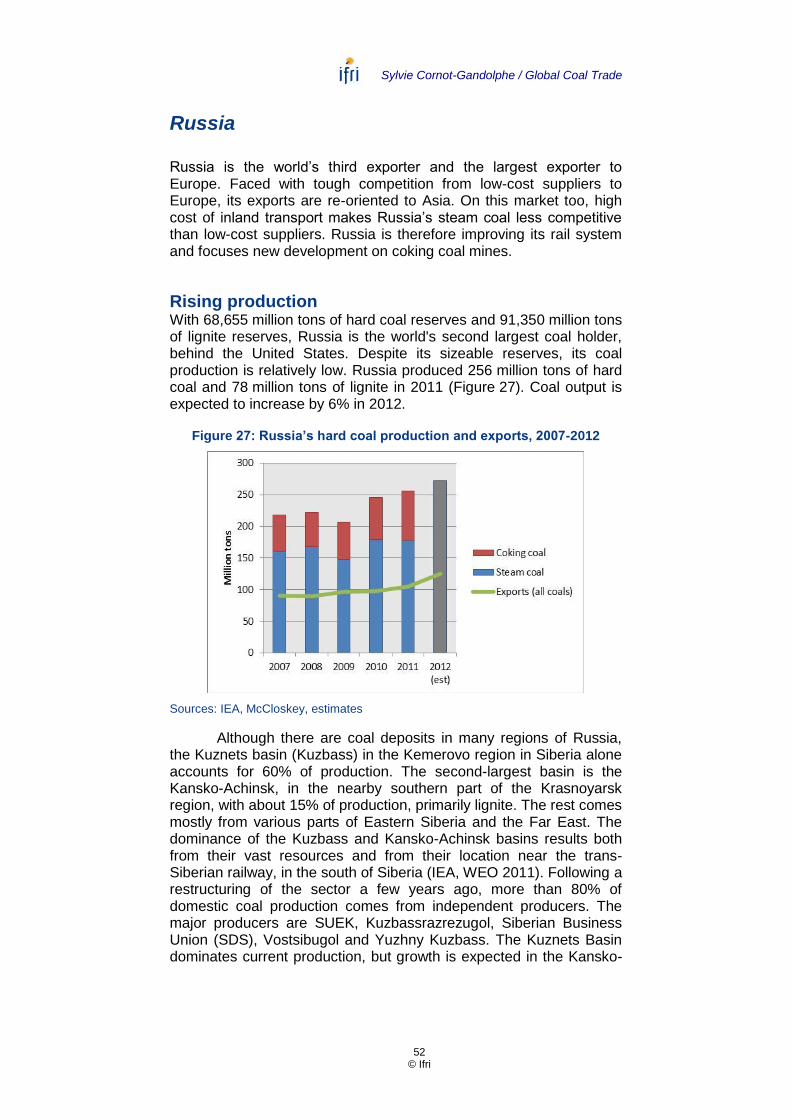
Sylvie Cornot-Gandolphe / Global Coal Trade
52 © Ifri
Russia
Russia is the world’s third exporter and the largest exporter to Europe. Faced with tough competition from low-cost suppliers to Europe, its exports are re-oriented to Asia. On this market too, high cost of inland transport makes Russia’s steam coal less competitive than low-cost suppliers. Russia is therefore improving its rail system and focuses new development on coking coal mines.
Rising production With 68,655 million tons of hard coal reserves and 91,350 million tons of lignite reserves, Russia is the world's second largest coal holder, behind the United States. Despite its sizeable reserves, its coal production is relatively low. Russia produced 256 million tons of hard coal and 78 million tons of lignite in 2011 (Figure 27). Coal output is expected to increase by 6% in 2012.
Figure 27: Russia’s hard coal production and exports, 2007-2012
Sources: IEA, McCloskey, estimates
Although there are coal deposits in many regions of Russia, the Kuznets basin (Kuzbass) in the Kemerovo region in Siberia alone accounts for 60% of production. The second-largest basin is the Kansko-Achinsk, in the nearby southern part of the Krasnoyarsk region, with about 15% of production, primarily lignite. The rest comes mostly from various parts of Eastern Siberia and the Far East. The dominance of the Kuzbass and Kansko-Achinsk basins results both from their vast resources and from their location near the trans-Siberian railway, in the south of Siberia (IEA, WEO 2011). Following a restructuring of the sector a few years ago, more than 80% of domestic coal production comes from independent producers. The major producers are SUEK, Kuzbassrazrezugol, Siberian Business Union (SDS), Vostsibugol and Yuzhny Kuzbass. The Kuznets Basin dominates current production, but growth is expected in the Kansko-

Sylvie Cornot-Gandolphe / Global Coal Trade
53 © Ifri
Achinsk Basin and Eastern Siberia, to accommodate increasing demand from Asia. In August 2011, Mechel started production at the Elga coking coal mine, located in the south-east of Yakutia. Annual production is expected to reach 7 million tons in 2015 and 27 million tons by 2021. SUEK, the largest Russian producer, is also targeting Eastern markets. In 2011, the company secured a license for development of the Apatskoe coking coal fields, located in Russia’s Trans-Baikal region about 700 km from the Chinese border.
A small domestic market Coal plays a relatively modest role in Russia’s energy mix, meeting only 13% of its total primary energy needs and fuelling about one-fifth of its electricity generation. The country consumed 235 million tons in 2011. The Russian government's strategy aims at increasing coal production and building more coal-fired plants to reduce demand for natural gas, thus allowing for more natural gas exports. Given the large reserves of coal in the country, Russia has the ability to feed its domestic market and any growing export market. The bottleneck does not lie in mining capacity but in transportation infrastructure.
Rising exports to the Pacific basin Russia is the world’s third largest coal exporter, but it is the top exporter in the Atlantic market. More than half of Russian coal is currently sold to the European Union but exports are shifting to the Pacific market, especially China and South Korea (Table 11). The share of Europe in total exports decreased from 79% in 2007 to 62% in 2011, while that of Asia increased from 21% to 36%. The rise in Russian exports (105 million tons in 2011 and 125.7 million tons in 2012) was possible thanks to increased exports to the Pacific Basin while the Atlantic basin imports slightly decreased. Russia targets to more than double coal exports to Asia to an annual 85 million tons by 2030.
Table 11: Russia’s coal exports by destination, 2007-2011
Note: Excludes exports to other FSU countries. Sources: IEA, VDKI, NDRC, Trade Statistics of Japan, South Korean Trade Statistics
Million tons 2007 2008 2009 2010 2011
EU 27 54,9 55,0 53,5 46,6 52,1
Other Europe and Mediterranean countries 16,5 14,5 16,5 18,1 13,5
of which Turkey 11,2 7,5 8,1 12,1 8,3
Total Europe and Mediterranean countries 71,4 69,5 70,0 64,7 65,6
Asia 19,1 19,1 26,4 32,4 38,3
of which China 0,3 0,8 11,8 11,6 10,6
of which Japan 11,5 10,0 8,9 10,7 11,4
of which South Korea 6,4 7,5 4,7 8,6 12,7
Americas 0,3 0,8 0,3 0,4 1,2
TOTAL 90,8 89,4 96,7 97,5 105,1
Share in total exports (%)
Europe and Mediterranean countries 79% 78% 72% 66% 62%
Asia 21% 21% 27% 33% 36%
Americas 0% 1% 0% 0% 1%

Sylvie Cornot-Gandolphe / Global Coal Trade
54 © Ifri
The bulk of coal exports consist in steam coal (109 million tons in 2011, including exports to other FSU countries). However, coking coal exports are of strategic importance. Russia exported 13.8 million tons of metallurgic coal in 2011, far behind Australia, but in the small international coking coal market, these supplies enable a degree of diversification for coking coal buyers. Coking coal exports to the Asian market have been increasing, reflecting strong demand from emerging economies and subdued demand from Europe. This trend is expected to continue. In addition to the Elga mine developed by Mechel, Severstal, Russia’s second-largest steel producer also develops new coking coal mines targeting China and other Asian countries. The company plans mines development at the Ulug-Khem basin, which contains 16 billion tons of coal reserves, and a state-backed railroad in the Siberian region of Tyva that would raise metallurgic coal exports to 40 million tons by 2020.
Rising Pacific ports capacity Exports are mainly seaborne exports from the Baltic and Black Seas, North Russian and Pacific ports. Some exports to other FSU countries and Poland are transported by rail. The current port capacity is 100 million tons a year. The bulk of capacity is located on the Baltic coast and the Black Sea. Far Eastern capacity amounts to 40 million tons. To respond to strong demand growth in China and India, port capacity in the Far East will be further enhanced. Vanino, the second largest coal port in Russia, will increase its handling capacity from 13.5 to 18.5 million tons a year by 2013. The port of Posiet is also expanding. A new port is planned at Murmansk by coal miner SDS. With a capacity of 18 million tons a year by 2015, the port could mark the start of an alternative route for shipping coal to Asia through the Arctic if price is right. A new coal terminal with a capacity of 15 million tons a year is also planned in Wrangel Bay on the Sea of Japan.
But in this huge country, port capacity is not the bottleneck. Inland transport is.
Long distance transportation is a major bottleneck, making coal a high cost fuel The bulk of production and exports comes from the Kemerovo region in Siberia and is transported by rail to western or eastern ports. Coal has to travel 4,000 to 5,000 km to reach western or eastern markets. Although the cost of production is low, transportation cost on such distances puts Russia at the top of the international cash-cost curve for internationally traded steam coal. Costs are estimated at US$80 to 90/t FOB. Such costs limit the ability of Russia’s coal to compete in steam coal export markets.
Additionally, Russia’s main rail transportation, the Trans-Siberian Railway, operates at close to full capacity which constrained

Sylvie Cornot-Gandolphe / Global Coal Trade
55 © Ifri
exports to Asia. Most of the increase in exports to Asia is therefore from the East Siberian mines, which produce a lower energy content and higher ash coal than the Kuzbass region. To address this issue, new investments are planned in order to increase rail capacities. The Trans-Siberian Railway and Baikal Amur Mainline (BAM) are to be modernized and their capacity expanded over the next few years. Moreover, in 2010, China agreed to a US$6 billion loan to develop coal mines and logistics in Russia’s Far East. The two countries will jointly develop the Ogodzhinskoye coal deposit in the Amur region, which borders China. Russia agreed to supply 475 million tons of coal over the next 25 years.
While exports to Europe are expected to continue their decline, Asian/Chinese demand will drive the expansion and direction of Russian coal exports. On-going infrastructure development and Chinese investment in mining and infrastructure will facilitate the move.
Colombia
Colombia is the world’s fifth largest coal exporter. Coal exports are an important part of the country’s economy. Coal is the second largest export, behind oil (EIA, 2012). Until recently coal exports were mainly dedicated to Europe, the United States and South American countries. Falling demand by U.S. customers has led the country’s major producers to look for new markets, China and South Korea mainly. Although exports to Asia are rising, the major customer remains Europe. Maritime transportation costs to Asia are high since vessels have to sail a long journey around the Cape of Good Hope. The opening of the Panama Canal expansion will remove this bottleneck.
Recent expansions in coal production despite difficult conditions Colombia has 4,945 million tons of hard coal proved reserves (BGR, 2012), the largest in South America. Reserves are concentrated in the Guajira peninsula in the north and the Andean Foothills in the interior. The country produced 86 million tons in 2011 and an estimated 90 million tons in 2012 (Figure 28). The majority of Colombia's coal production and export infrastructure is located on the Caribbean coast. The main producing regions are La Guajira and Cesar. The coal industry is dominated by big producers with their own ports and railways such as Glencore, Drummond and Cerrejon, which is jointly owned by BHP Billiton, Anglo American and Xstrata. The consortium operates the Cerrejon Zona Norte (CZN) project, the largest coal mine in South America and the largest open-pit coal mine in the world. The country exports most of its production. Production

Sylvie Cornot-Gandolphe / Global Coal Trade
56 © Ifri
has increased by 29% since 2007 and could reach 150 million tons by 2020 if producers’ expansion plans are all carried out as reported.
Figure 28: Colombia’s coal production and exports, 2007-2012
Source: IEA (until 2010), 2011 and 2012: various estimates
Production and exports are regularly limited by weather-related events and labor unrests. In 2010, heavy rains reduced production by 5 million tons. In 2012, major strikes disturbed production and exports. In July-August 2012, a strike paralyzed the railway that carries much of the nation's coal exports. The country had also to face big strikes at major mines which reduced output. Altogether the strikes removed 7 million tons from the 2012 expected production. Coal mines and railways also suffered repeated FARC’s attacks, despite the sending of troops by the Government.
Almost all production and exports are thermal coal, although Colombia has started to produce coking coal. It is likely to increase its exports of metallurgical coal, which until now has played a marginal role (1.2 million tons exported in 2012). A new greenfield project for the development of four coking and thermal coal mines with an export capacity of 28 million tons a year is planned by the Brazilian company, MPX.
Exporters testing new markets … and flooding Europe Colombia exported 79 million tons in 2011 (83 million tons expected in 2012), mainly to Europe, other South American countries, and the United States. Following decreasing demand by U.S. customers, Colombia has looked for new outlets. First flows to Asia (China and South Korea) started in 2010 but so far the major customer remains Europe, with a market share of 76%, against 3% for Asia (Table 12). In 2011 and 2012, Colombia increased its exports to Europe despite fierce competition from U.S. exporters.

Sylvie Cornot-Gandolphe / Global Coal Trade
57 © Ifri
Table 12: Colombia’s coal exports by destination, 2007-2011
Sources: IEA, VDKI, McCloskey Coal Report, own calculations
Internal logistics remains a major obstacle Internal logistics remains the major obstacle to increase coal exports. The bulk of coal from the main producing regions in the northwest of the country is transported by rail, whereas coal from the center and east of the country is transported by truck. Most part of the existing
infrastructure for transport and export is utilized at a high level of capacity. Colombia owns six coal export harbors on the Atlantic coast and one on the Pacific coast. Several projects are under construction to increase the ports capacity. According to the IEA, port capacity is to increase by 28 million tons a year by 2016. In addition to expansions at existing ports, a new port near Dibulla, Puerto Brisa (on the Caribbean shoreline), is going to be built by the Brazilian company MPX.
Million tons 2007 2008 2009 2010 2011
EU 27 29,1 26,9 31,8 34,2 45,7
of which Germany 6,9 5,9 5,2 7,4 10,6
of which Netherlands 5,6 6 10,7 9,1 7,4
of which United Kingdom 3 4 4,5 5,4 7,3
of which Danemark 2,3 1,9 1,9 1,4 5
of which Spain 2,2 2,3 2,4 2,6 3,3
Other Europe & Mediterranean countries 8,2 7,5 8,4 6,5 14
Total Europe & Mediterranean countries 37,3 34,4 40,2 40,7 59,7
Americas 28 32,7 23,2 24,6 16,9
of which United States 24,9 22,3 14,9 13 8,3
Asia 0 1,4 0 5,6 2,4
of which China 0 0 0 3,9 1,4
TOTAL 65,3 68,5 63,4 70,9 79
Share in total exports (%)
Europe & Mediterranean countries 57% 50% 63% 57% 76%
Americas 43% 48% 37% 35% 21%
Asia 0% 2% 0% 8% 3%

Sylvie Cornot-Gandolphe / Global Coal Trade
58 © Ifri
Additionally, expansion of the railway network is foreseen. The capacity of the railway that links the César deposits to the ports near Ciénaga and Santa Marta will be enhanced from 42 to 44 million tons a year, to 88 million tons a year by the end of 2013. By 2016, a new rail line would be built to link the four newly developed mines by MPX with the new port at Puerto Brisa. Moreover the Colombian government intends to open an international bidding process on a rail project that could increase coal exports by 20 million tons a year. The project includes the construction of the Carare rail line, which will transport coal (coking coal mainly) from central Colombia to ports on the Atlantic.
Expansion of the Panama Canal will change the dynamics of trade Many of Colombia's port expansion projects lie on the Caribbean near the eastward opening of the Panama Canal. Slated for completion by 2015, the Panama Canal expansion should enhance opportunities for coal exports to Asian markets. The freight cost will be largely reduced as it will then be possible for smaller Capesize ships (the so-called "Post-Panamax" vessels) to use the canal instead of having to sail around the Cape of Good Hope.
Additionally, a 220 km railway line between the port of Cartagena and the Pacific Ocean is under consideration by the Chinese Development Bank. Besides facilitating the import of Colombian coal, the new line would also make the export of Chinese
manufactured goods to the Americas easier. China and Colombia are
also considering an 800 km railway from central Colombia to the Pacific and expansion of the port of Buenaventura on the Pacific coast. The US$2.7 billion project would be funded by the Chinese Development Bank and would facilitate coking coal exports to China.
China is not the only Asian country to invest in Colombia. In November 2012, India’s Aditya Birla Group announced its plan to purchase a US$1 billion stake in Drummond's Colombian coal mines. The coal would be used by the Indian major to make aluminium in India at its various plants.
Both the expansion of the Panama Canal, Chinese-backed transportation infrastructure projects and India’s investment in mining could generate greater exports of Colombian coal to Asia in the future.

Sylvie Cornot-Gandolphe / Global Coal Trade
59 © Ifri
New exporting countries
Two new exporting countries, Mongolia and Mozambique, are emerging on the international coal scene. Their reserves, especially coking coal, are of interest to international mining companies, steel producers around the world and, of course, Chinese and Indian investors.
Mongolia The new coal Eldorado
Mongolia possesses huge reserves that make it look like the Saudi Arabia of coal. Total coal resources are estimated at 162 billion tons. Although until now the bulk of foreign investment in Mongolia has been by Chinese companies, its resources are attracting worldwide interest. Since 2005, the coal mines of southern Mongolia have exported exclusively to China. Coal is now Mongolia’s number one export commodity.
In 2011, the country produced 33 million tons of coal and exported 22 million tons, mainly coking coal. South Gobi Company, Mongolyn Alt Corp. (MAK) and state-owned Erdenes-Tavan Tolgoi, are the major producers/exporters. China is the single export destination for Mongolian coal and the country has increasingly overtaken Australia as the main supplier of coking coal to China. In 2011, Mongolia represented 45% of Chinese coking coal imports, compared with 23% from Australia. Mongolia expects to increase its exports to 30-50 million tons by 2015. Currently the country has no infrastructure to transport coal to destinations other than China.
Development of Tavan Tolgoi The largest development is yet to come: Tavan Tolgoi, the world’s biggest coking coal deposit, with resources of 6.4 billion tons, of which a quarter is coking coal. The mine is located 200 km from the Chinese border. Erdenes-Tavan Tolgoi holds the license of the deposit which has been divided into two blocks, eastern and western. The eastern block is developed by Erdenes-Tavan Tolgoi. The government intends to sell 29% of the company on the stock exchange in 2013, although the IPO was announced and postponed several times in the past two years. The western block will be handed over to strategic investors who will assume entire responsibility for the block’s development, mine infrastructure and coal marketing. The government put out an international tender for the western block in January 2011. Fifteen companies and consortia expressed interest to participate. They included companies from China, Japan, Korea, India and Russia, as well as ArcelorMittal, Vale, Xstrata, Rio Tinto, BHP Billiton and Peabody. In July 2011, the Mongolian government selected the consortium composed of Shenhua (40%), Peabody (24%) and a group of Russian companies (36%). But faced with

Sylvie Cornot-Gandolphe / Global Coal Trade
60 © Ifri
complaints by Korean and Japanese companies as to the make-up of the consortium, the government retracted, and as of end 2012, we still do not know which companies will be selected to develop the western part of the mining basin. This is a so sensitive political issue that this key decision may take some time. In the meantime, Erdenes-Tavan Tolgoi has opened a mine on the western block and expects to export 1-2 million tons in 2013, rising to 20 million tons in 2017.
Uncertain foreign investment climate Efforts to raise money for the development of Tavan Tolgoi and the launching of an IPO for shares in Erdenes-Tavan Tolgoi have faced repeated delays, bringing uncertainties on the future development of the deposit. Additionally, the government blocked an attempt by Chalco, China’s biggest aluminium producer, to buy a controlling stake in South Gobi Company. In April 2012, after Chalco made its offer, the government passed a law requiring Parliamentary approval for foreign investors to take a stake larger than 49% in companies in strategic sectors.
Landlocked country One crucial aspect of the development of Tavan Tolgoi is, of course, the logistics of transportation from the mine to the Mongolian border and beyond. Because of its geographical location, until now Mongolia has no access to overseas markets. While the natural market is China due to its geographic proximity and appetite for coal, Mongolia looks for diversification of its market. The country intends to build a railway to Russia to reach Pacific ports and Japanese and South Korean buyers. Just like the choice of a consortium to develop Tavan Tolgoi, defining export routes is not an easy task. Russia, at the opposite of China, is not a coal importer, but an exporter/competitor on the Asian market.
If the country is able to overcome these obstacles, it could become a major coal exporter and would be a serious competitor to current suppliers to Asian countries.
Mozambique A new coal hub
Mozambique has one of the world’s most significant unexplored coal reserves and is expected to become a key source of premium hard coking coal. Hard coal resources are estimated at 41 billion tons (BGR, 2012), of which a large proportion is high-quality coking coal. Shipments of coal have just commenced and the growth plans are substantial. Most coal projects in Mozambique are owned and operated by major international mining companies, such as Vale and Rio Tinto. The main current challenge is the poor transport logistics, both rail and port.
Five projects in the Tete province are being developed by international companies. These projects aim to supply electric power

Sylvie Cornot-Gandolphe / Global Coal Trade
61 © Ifri
generation in the region as well as export markets. Much of Mozambique’s coal will be shipped to India. For steel and power companies in India, Mozambique is now the closest supply basin. The country is therefore a serious competitor to Australian coking coal supplies. Exports are expected to reach 2.5 million tons in 2012 and 4 million tons in 2013 mainly from Vale’s Moatize and Rio Tinto’s Benga project. Exports could reach 11 million tons by 2016 as additional new projects come on stream and coal transportation infrastructure is improved. Mozambique is expected to produce 100 million tons within ten or twenty years, involving the construction of new transport and export infrastructure.
Investment in port and railway The rail and port capacity is a major bottleneck for coal exporters. But the country has several projects to upgrade transport and export capacity. The capacity of the port of Beira is expected to increase to 12-25 million tons a year. A new port at Nacala should be operational in 2014 and will ultimately be able to export 30 million tons a year. Mozambique also plans to treble its exports from the port of Maputo, from four million tons a year at present to 16-25 million tons a year by the end of 2013. A US$2 billion tender for railway and port development project is going to be issued by the government at the end of 2012. The tender will be for a 525 km line from the Tete province to Macuse, in Mozambique’s Zambezia province, and a new port, with a capacity of 20 million tons a year. The capacity of the Sena line, the only railway linking the coal-rich Moatize basin with the coast, is being upgraded to 6.5 million tons a year and a further upgrade to 20 million tons a year is scheduled for completion by end of 2014.
The various rail and port projects in the pipeline together will raise the coal export capacity to more than 120 million tons a year, and should be completed within five years at a total cost of US$12 billion. By that time, Mozambique should ramp up its production and exports and become a major player on the international coal scene.
62 © Ifri
Conclusion
After a difficult year for most coal exporters, the year 2013 begins with new questions.
China has just announced the liberalization of prices of domestic coal sold to power utilities that the government controlled until now. Under the new policy, coal miners and power companies can determine their own steam coal prices through bi-lateral negotiations. The country has also announced the abolition of the 40% tax that applied to coke exports so far. Both changes will affect the global coal market, although it is difficult to quantity the final impact. The price liberalization has not yet led to a rise in domestic coal prices, given the current overcapacity in the Chinese market, and the impact is not yet seen on the competitiveness of imported coal relative to domestic coal.
In the United States, the debate on coal exports heats up. Two U.S. senators have just asked the Interior Department to examine whether coal companies are paying fair royalties on Powder River Basin coal exports… If such an investigation concluded that the royalty rate has to be calculated on coal overseas value instead of domestic value, it would limit the appetite of U.S. mining companies for developing exports.
These examples show how national policies shape and influence the global coal market and they will continue to do so. On the demand side, it is of course the decisions taken in Beijing, and New Delhi tomorrow, that will have the biggest impact on future world coal trade. From the supply side, Australia and Indonesia will remain the key determinants, although the role of the United States is a wildcard in the global equation.

63 © Ifri
Bibliography
BGR (Bundesanstalt für Geowissenschaften und Rohstoffe, Federal Institute for Geosciences and Natural Resources), Annual Report Reserves, Resources and Availability of Energy Resources 2011, DERA Rohstoffinformationen, Hannover, February 2012. www.bgr.bund.de/
BP, Statistical Review of World Energy, London, June 2012. www.bp.com/
Bureau of Resources and Energy Economics (BREE), Resources and energy quarterly December Quarter 2012, Australian Government, Canberra, 2012, http://www.bree.gov.au
BREE, Energy in Australia 2012, Australian Government, Canberra, 2012
China SignPost, Central and Southwest China: The Key Battleground for Shale Gas and New Low-Cost Coal Supplies from Xinjiang, Mongolia, and Wyoming, Issue N° 67, 28 September 2012. http://www.chinasignpost.com/
China SignPost, Xinjiang Poised to Become China’s Largest Coal Producer: Will Move Global Coal, Natural Gas, and Crude Oil Markets, Issue N° 65, 20 September 2012.
China SignPost, Wyoming and Montana Could Become Major New Coal Suppliers to China and the Asian Market—If They Can Obtain Port Access, China SignPost, Issue N° 64, 4 September 2012
China’s State Council, Energy development in the "12th Five-Year Plan”, January 2013 (available in Chinese). http://www.gov.cn/zwgk/2013-01/23/content_2318554.htm
China’s State Council, China ‘s Energy Policy, 2012, 24 October 2012. http://www.china.org.cn/government/whitepaper/node_7170375.htm
CyclOpe, Les marchés mondiaux 2012, Economica, Paris, 2012
Credit Suisse, Commodity Forecasts: The Best of Times, The Worst of Times, Securities Research & Analytics, New York, 12 October 2012
DEEC (Department of Energy and Climate Change), UK coal statistics, http://www.decc.gov.uk/en/content/cms/statistics/energy_stats/source/coal/coal.aspx
ecoalchina.com, http://en.ecoalchina.com/ EIA (U.S. Energy Information Administration), coal statistics
and analysis, US DOE/EIA, Washington DC, 2012 http://www.eia.gov/coal/

Sylvie Cornot-Gandolphe / Global Coal Trade
64 © Ifri
EIA, 2012, Annual Energy Outlook 2012, US DOE/EIA, Washington DC, 2012,
EIA, Country Report: China, US DOE/EIA, Washington DC, 4 September 2012
EIA, Today in energy, various issues, US DOE/EIA, Washington DC http://www.eia.gov/todayinenergy/
EIA, 2011, International Energy Outlook 2011, US DOE/EIA, Washington DC, 2011
EURACOAL (European Association for Coal and Lignite), Coal Industry across Europe 2011, Brussels, 2011. http://www.euracoal.be/pages/medien.php?idpage=917
Eurostat (European coal and energy statistics). http://epp.eurostat.ec.europa.eu/statistics_explained/index.php/Coal_consumption_statistics
EWI (Institute of Energy Economics at the University of Cologne), Market structure scenarios in international steam coal trade, EWI Working paper N° 11/02, Köln, April 2011. www.ewi.uni-koeln.de
Hall I., The SA Coal Industry: Present Context & Preliminary Future Scenarios, Coaltech Colloquium, Witbank, 22 July 2011
IEA, Medium-term coal market report 2012, OECD/IEA, Paris, 2013. www.iea.org
IEA (International Energy Agency), World Energy Outlook 2012, OECD/IEA, Paris, 2012.
IEA, Policy Options for Low‐Carbon, Power Generation in China, Insight Series 2012, IEA/OCDE, 2012
IEA (International Energy Agency), Coal Information 2012, OECD/IEA, Paris, 2012.
IEA, World Energy Outlook 2011, OECD/IEA, Paris, 2011. IEA, Medium-term coal market report 2011, OECD/IEA, Paris,
2011. IEEJ (Institute for Energy Economics), Coal trends: trends in
coal supply, demand and prices as seen from statistics, Coal report N° 1, N° 2 and N° 3, IEEJ, Tokyo, August, September and October 2012, http://eneken.ieej.or.jp/en/
International Coal Report (weekly newsletter on the global coal industry). www.platts.com/Products/internationalcoalreport
Jianjun Tu K., Johnson-Reiser S., Understanding China’s rising coal imports, Carnegie Endowment for International Peace, Energy and Climate Program, Washington, 16 February, 2012
J.P. Morgan, Global coal update, Global Equities research, 13 November 2012
McCloskey’s Coal Report (bi-monthly publication providing news and analysis of the international coal market). http://cr.mccloskeycoal.com/
Office of the State Council of the People's Republic of China, China's Energy Policy 2012, Beijing, 24 October 2012, http://www.china.org.cn/government/whitepaper/node_7170375.htm
Program on Energy and Sustainable Development (PESD), Industrial organization of the Chinese coal industry, Working Paper

Sylvie Cornot-Gandolphe / Global Coal Trade
65 © Ifri
N° 103, Freeman Spogli Institute for International Studies at Stanford University, Stanford, July 2011. http://pesd.stanford.edu/publications/
PESD, Australia’s black coal industry: past achievements and future challenges, Working Paper N° 101, Freeman Spogli Institute for International Studies at Stanford University, Stanford, March 2011
PESD, The world’s greatest coal arbitrage: China’s coal import behavior and implications for the global coal market, Working Paper N° 94, Freeman Spogli Institute for International Studies at Stanford University, Stanford, August 2010
ResCap, Mongolia 101, Initiating country coverage on one of the last remaining mining frontiers, ResCap, Ulaanbaatar, January 24 2011. http://mongoliagrowthgroup.com/wordpress/wp-content/uploads/2012/01/ResCap_Mongolia101.pdf
Sastrawinata T., Coal upgrading implementation in Indonesia, 2012 APEC Symposium on energy efficiency of low rank coal, Beijing, 5-6 July, 2012
VDKI (Verein der KohlenImporteure), Facts and Trends 2012, Hamburg, 2012. http://www.verein-kohlenimporteure.de/wEnglish/
WEC (World Coal Institute), India Energy Book 2012, WEC/Indian Member Committee, New Delhi, 2012. http://indiaenergycongress.in/iec2012/ieb2012/ieb2012.pdf
Williams N. Dr, Rediscovering Our Competitive Edge, Australian National Conference on Resources and Energy (ANCRE), Canberra, 19 September 2012
World Coal Association, Coal Facts 2012, London, August 2012. www.worldcoal.org
WRI (World Resources Institute), Global Coal Risk Assessment: Data Analysis and Market Research, WRI Working Paper, Washington DC, November 2012. http://www.wri.org/publication/global-coal-risk-assessment
World Steel Association (WSA), www.worldsteel.org