njpdes monitoring report form reference manual · njpdes monitoring report form reference manual ....
TRANSCRIPT
New Jersey Department of Environmental Protection
Division of Water Quality
NJPDES Monitoring Report Form
Reference Manual
12/07 2
Table of Contents
Chapters Chapter 1: NJPDES Program Objectives Pg. 4 Chapter 2: Establishing a NJPDES Self-Monitoring Program
Pg. 6 Chapter 3: Definitions and Acronyms
A. Abbreviation and Acronyms B. Definitions
Pg. 10
Chapter 4: Understanding and Completing NJPDES Monitoring Report Forms (MRFs) A. Monitoring Report Submittal Form B. Discharge Monitoring Report (DMR) C. Residual Transfer Reports (RTR) D. Waste Characterization Reports (WCR) E. Common Reporting Mistakes and Comments F. Electronic Reporting of MRFs via NJ Online
Pg. 15
Chapter 5: Reporting Requirements A. NJPDES Monitoring Requirements B. Frequency of MRF Submissions C. Intermittent Discharges D. Holiday and/or Weekend Analyses E. Reporting Noncompliance
Pg. 33
Chapter 6: Completion of Reported Values A. Calculating Monthly Monitoring Data B. Quality or Concentrations C. Quantity or Loadings D. Quarterly Monitored Parameters E. Four-Day Average (SIU Permits)
Pg. 35
Chapter 7:
Reporting Specific Parameters A. BOD5 and TSS Percent (%) Removal B. Chlorine Produced Oxidants (CPO) and Total Residual Chlorine (TRC) C. Dissolved Oxygen (DO) D. E. Coli E. Enterococci F. Fecal Coliform G. Flow H. Lower Explosive Limits (SIU Permits) I. Methyl Tert-butyl Ether Percent Removal J. Organic Toxic Pollutants (GC/MS) K. Petroleum Hydrocarbons (PHC) and Petroleum Based Oil and Grease
Pg. 47

12/07 3
Chapters Chapter 7:
(O/G) L. Ph M. Settleable Solids N. Total Toxic Organic Substances (TTOS) O. Whole Effluent Toxicity (Bioassays) P. 2,3,7,8 Tetrachlorodibenzo-p-dioxin (TCDD)
Chapter 8: Reporting Analytical Data A. Split Samples B. Rounding Off C. Reporting Invalid Test Results and Submitting Corrected DMRS
Pg. 58
Chapter 9: NJPDES Permit Reporting for Non-Detectable and Unquantified Values A. Parameter Specific – All the Same Parameter B. Net Values C. Total GC/MS Fractions and Total Metals Conditions
Pg. 62
Chapter 10: Appendices Appendix 1 – Sample Types Appendix 2 – Sample WCR Report Appendix 3 – Sample RTR Report Appendix 4 – Sample DMR Report Appendix 5 – Sample Monitoring Report Submittal Form
Pg. 75

12/07 4
Chapter 1: New Jersey Pollutant Discharge Elimination System (NJPDES) Program Objectives
Introduction The goal of the New Jersey Pollutant Discharge Elimination System (NJPDES) program is to improve the State's water quality by reducing or eliminating pollutants discharged into waters or onto lands of the State. The major instrument used to achieve this goal is the NJPDES permit which sets forth limits on the pollutants in direct and/or indirect discharges. The NJPDES permit is a legal enforcement mechanism issued by the New Jersey Department of Environmental Protection (NJDEP) or a delegated local agency to dischargers of wastewater into receiving waters and/or sewage treatment plants and to various types of residuals management operations. Through the NJPDES program, the NJDEP and permittees are important participants in the drive to protect and preserve water quality within the state. The purpose of this manual, developed using existing state and federal regulations, departmental policy, the latest approved edition of the Standard Methods for the Analysis of Water and Wastewater, and United States Environmental Protection Agency (USEPA) guidance documents, including the "National Pollutant Discharge Elimination System (NPDES) Self-Monitoring System User Guide", is to: • Familiarize permittees with the objectives of the NJPDES permitting program and commonly
used definitions and acronyms; • Assist permittees in the development, operation and maintenance of a self-monitoring
program; and • Use as guidance for proper completion and submittal of Monitoring Report Forms when
confronted with common situations. On rare occasions a permit may contain a specific reporting protocol which differs from this guidance. In such cases the protocol specified in the permit takes precedence.
NJPDES Authority The New Jersey Water Pollution Control Act and the amendments thereto, commonly known as the Clean Water Enforcement Act, N.J.S.A. 58:10A-1 et seq. (hereinafter “the Act"), and the regulations promulgated thereto, specifically the New Jersey Administrative Code (N.J.A.C.) 7:14A-1 et seq., gives NJDEP the authority to regulate the discharge of pollutants to the waters and lands of New Jersey. The Act provides the authority to establish the NJPDES permit program, to define control technologies, to establish effluent limitations, to obtain information through reporting and compliance inspections, and to take enforcement actions (both civil and criminal) when violations of the Act are found.

12/07 5
Legal Authority for NJPDES Monitoring of Discharges Dischargers of pollutants are issued permits pursuant to N.J.A.C. 7:14A-1 et seq. that set forth specific limits and operating conditions to be met by the permittee. The Act authorizes inspections and monitoring to determine whether or not NJPDES permit conditions are being met. It provides for two types of monitoring: • Self-monitoring, where the facility must monitor its waste streams; and • Compliance monitoring, in which NJDEP reviews and/or inspects the self-monitoring
program.
Inspection of NJPDES Facilities Pursuant to N.J.A.C. 7:14A-2.11(e), NJDEP may request and collect information by various means, including the inspection of a NJPDES facility, or other locations/sites where actual or suspected unpermitted discharges exist. Under the NJPDES program, the NJDEP may conduct inspections of permitted facilities to verify that permit requirements are being met. Inspections are conducted to gather information that can be used to determine compliance with permit conditions, applicable rules and regulations, and other requirements. Inspections may be limited and routine unless suspected violations of permit requirements are uncovered, at which point a more in-depth investigation will follow. NJPDES inspections extend to everything related to compliance with the permit, including files, operating logs, records, treatment processes, controls, facilities, and licensed operator requirements. Meeting Permit Requirements The permits issued under the NJPDES program impose precise and detailed pollution control requirements on all dischargers. Permits are written to: • Limit discharges of pollutants based on applicable guidelines and regulations; • Require permittees to monitor their discharges and report results and any violations to
NJDEP; and • Where necessary, impose compliance schedules that the permittee must adhere to in abating
pollution and in complying with specified effluent limits. The permittee is responsible for understanding and meeting all permit requirements. Permittees should read their NJPDES permit completely and thoroughly to ensure their understanding of all limitations and conditions contained therein. Submission of improperly completed Monitoring Report Forms (MRF) is a violation of the NJPDES permit which may result in the assessment of penalties against the permittee, pursuant to the Act.
12/07 6
Chapter 2: Establishing a NJPDES Self-Monitoring Program Self-Monitoring Responsibilities The NJPDES permit stipulates that self-monitoring requirements are the responsibility of the permittee. The NJPDES permit, not the pre-printed MRF, sets forth the minimum frequency and type of sampling (calculated, grab and/or composite) requirements, as well as the flow monitoring, analytical, and data reporting requirements. All monitoring requirements of the permit are minimum requirements; however, additional monitoring is permissible and encouraged as it promotes more representative data and may avoid violations of weekly or monthly average limitations if a facility’s activities vary from day to day. The permittee is generally required to report all monitoring results, even if monitoring more frequently than the required minimum. The required information, obtained through the permittee's self-monitoring program, is reported to NJDEP primarily through the submission of a MRF. The validity and quality of the MRF data is the responsibility of the permittee and is a direct result of the adequacy and function of the permittee's self-monitoring program.
Organizing a Self-Monitoring Program The overall objectives of a self-monitoring program are to collect, analyze, and report representative discharge data, as required by the NJPDES permit, which is used to determine permit compliance. A properly organized and maintained program will aid in:
• Identifying problem areas that could result in noncompliance situations; • Rapidly discovering and rectifying noncompliance episodes; • Reporting noncompliance as required by the NJPDES permit; • Reporting accurate and timely self-monitoring data on the MRF; and • Establishing a consistent, routine program of self-monitoring evaluation. Elements of a Self-Monitoring System A self-monitoring program can be viewed as an organized system of components, typically including sampling, flow measurement, laboratory and field analyses, record keeping, reporting, and data quality assurance. It consists of both technical and administrative activities, which are of equal importance to the proper operation of the program and to meeting the NJPDES permit requirements. To develop and maintain a successful self-monitoring program, the following elements should be considered: • Reviewing NJPDES permit requirements and setting program objectives;
12/07 7
• Establishing staff training; • Developing a quality assurance (QA) plan; and • Conducting periodic evaluations of the program. Reviewing NJPDES Permit Requirements and Setting Program Objectives The specific elements of the self-monitoring program are stipulated in the permit. The primary program objectives include: • Qualitative and quantitative effluent limitations-minimum, average, and maximum
concentrations as well as average and maximum daily loadings; and • Self-monitoring requirements-location, frequency, and type of sampling (calculated, grab and/or composite), flow monitoring, methods of analysis, data reporting requirements, and reporting of noncompliance incidents. As stated previously, self-monitoring program objectives are set to yield accurate and representative data. Therefore, to be successful a self-monitoring program must include: • Frequency and type of sampling at designated permitted locations, as set forth in the
NJPDES permit; • Flow measurements; • Sample analyses to determine effluent quality; • Accurate record keeping for all activities specified in the NJPDES permit; and • Data reporting on the MRF in the manner specified in the NJPDES permit. Staff Training A capable and qualified staff is necessary for a self-monitoring program. It is the responsibility of the permittee to ensure that the staff is properly trained and qualified to perform the activities and report the results in accordance with the permit requirements. This holds true whether the facility uses its own staff, outside consultants and/or a NJDEP certified laboratory. When developing in-house or selecting outside training programs, the following instruction areas should be considered: • Sampling (including proper preservation methods), chain of custody, and flow measurement
procedures; • Laboratory procedures, including proper sample handling, analysis, quality control, data
management, record keeping, and reporting procedures; • Proper use of instruments and equipment including appropriate calibration procedures and
schedules; • Preventive maintenance practices; • Equipment troubleshooting; and • Safety procedures and contingency plans including handling emergencies.

12/07 8
Relevant training is sponsored by regulatory agencies, industry associations, professional societies, and colleges and universities. Proper certifications and/or licenses of operating personnel must be obtained, if required by NJDEP. Taking into consideration the technical and procedural training aspects discussed above, the overall facility training program should be organized so that it includes the following elements: • Orienting and training new staff; • Continued training and updating of existing staff; and • Cross-training staff members to provide backup. Developing a Quality Assurance (QA) Plan The establishment of an effective QA plan is essential to the proper functioning of a NJPDES self-monitoring program. The overall objective of the QA plan is to ensure the production and reporting of accurate and representative data to NJDEP. It also provides data that facility management can use to assess the performance of the facility. The QA plan must consider and integrate all elements of the self-monitoring program, both administrative and technical. In general the QA plan should cover the following elements: 1. Sample collection
a. Proper sampling procedures/equipment used; b. Sample type, frequency, method, and location in accordance with the NJPDES permit
requirements, as documented by the chain of custody; c. Sample preservation procedures for the approved methods in 40 CFR Part 136,
currently outlined in the latest approved edition of the NJDEP Field Sampling Procedures Manual and the latest approved edition of the Standard Methods for the Analysis of Water and Wastewater; or in the case of sludge monitoring, as required by 40 CFR 503.8 and the Sludge Quality Assurance Regulations (N.J.A.C. 7:14C);
d. Sample activity records; e. Control checks (duplicate samples, split samples, spike samples, and sample
preservative blanks) performed during the actual sample collection to determine the accuracy of the sample collection system; and
f. Proper procedure and schedule used for calibration and maintenance of automatic samplers.
2. Flow measurement
a. Functioning of primary/secondary measurement devices; b. Procedures/schedule for calibrating secondary devices; c. Regular maintenance/inspection of primary devices; d. Documentation of flow measurements/associated activities; and e. Evaluation of accuracy/precision of flow measurement devices.
3. Laboratory operations
12/07 9
a. Proper sample handling procedures; b. Approved analytical methods as specified in 40 CFR Part 136, or for sludge
monitoring, as specified in 40 CFR 503.8 and the Sludge Quality Assurance Regulations (N.J.A.C. 7:14C), or another method approved by NJDEP;
c. Verification that all analyses are performed by a New Jersey certified laboratory; d. Proper procedures/schedule used for calibration and maintenance of instruments and
ancillary equipment; and e. Accuracy/precision of analyses monitored.
4. Proper staff training a. Accurate documentation of all above activities.
5. Record keeping/reporting a. Record keeping/reporting in accordance with the NJPDES permit requirements; b. Record keeping system organized to facilitate retrieval; c. Record keeping system organized to produce accurate and complete reports
(especially MRFs) when required; and d. On-site maintenance of laboratory data and relevant worksheets that support properly
completed MRFs. Lab results should not be submitted to NJDEP unless specified by NJPDES permit requirements.
Periodic Evaluation of Self-Monitoring Program Integral to the efficient continued functioning of the self-monitoring program is the establishment of procedures and a regular schedule of program evaluation. The following elements should be included: • Confirm that all samples are properly obtained; • Confirm that flow measurement equipment is being properly maintained; • Verify that analyses are being performed properly and the equipment is in good working
order; • Verify that NJDEP and/or EPA analytical methods are being used; • Verify proper quality control procedures are being employed; and • Verify record keeping/reporting systems are being properly maintained.

12/07 10
Chapter 3: Acronyms and Definitions The following two sections contain abbreviations, acronyms and definitions used in this manual. A. Abbreviations and Acronyms as cited at N.J.A.C. 7:14A-1.1 “DMR” means Discharge Monitoring Report.
“EDP” means Effective Date of Permit. “kg/day” means kilograms per day. “ug/L” means micrograms per liter. “mg/L” means milligrams per liter. “MGD” means million gallons per day. “ml/L” means milliliters per liter. “MPN” means most probable number. “NJPDES” means New Jersey Pollutant Discharge Elimination System.
“POTW” means publicly owned treatment works.
“SNC” means significant non-compliance.
B. Other Abbreviations
“DST” means Discharge to Storm Water.
“DSW” means Discharge to Surface Water.
“DGW means Discharge to Ground Water.
“EDI” means Electronic Data Interchange.
“EDPA” means Effective Date of Permit Authorization (for RFA). “EDPM” means Effective Date of Permit Modification.
12/07 11
“g/day” means grams per day. “MMR” means monthly mandatory reporting. “MRF” means Monitoring Report Form. “MRSF” means Monitoring Report Submittal Form.
“NJEMS” means New Jersey Environmental Management System.
“PI” means Program Interest.
“RTR” means Residuals Transfer Report.
“SIU” means Significant Indirect User.
“SQAR” means Sludge Quality Assurance Regulations.
“WCR” means Waste Characterization Report.
C. Definitions as cited at N.J.A.C. 7:14A-1.2
“Average monthly discharge limitation” means the highest allowable average of “daily discharges” over a calendar month calculated as the sum of all daily discharges measured during a calendar month divided by the number of daily discharges measured during that month.
“col/100mL” means the coliform colonies per 100 milliliters. “Compliance Monitoring Report” means a report periodically submitted by a permittee to
verify continued compliance. This term includes a Monitoring Report Form and any report required in an SIU permit pursuant to 40 CFR 403.12(e).
“Composite sample” means a sample composed of several discrete samples combined in a
known proportion. For NJPDES wastewater monitoring, a composite sample is a sample composed of several discrete samples collected at equal time intervals, or proportionally to the flow rate of the discharge.
“Daily discharge” means the “discharge of a pollutant” measured during a calendar day or
any 24-hour period that reasonably represents the calendar day for purposes of sampling. For pollutants with limitations expressed in units of mass, the daily discharge is calculated as the total mass of the pollutant discharged over the day. For pollutants with limitations expressed in other units of measurement, the daily discharge is calculated as the average measurement of the pollutant expressed in designated units, calculated over the day.

12/07 12
“Daily monitoring” means monitoring conducted every calendar day, including weekends
and holidays. “Discharge Monitoring Report” means NJDEP’s form used primarily for the reporting of
limited and nonlimited parameters (for example, “monitor and report only”) by permittees. “Grab sample” means an individual sample collected over a time period of less than 15
minutes. “Maximum daily discharge limitation” means the highest allowable “daily discharge”
during the reporting period. “Maximum value” means the highest value measured during the monitoring period. “Minimum value” means the lowest data value measured during the monitoring period. “Monthly minimum percent removal” means the lowest percentage obtained for any single
sampling event performed during the calendar month (minimum percent removal limitation). “Multiple grab composite” means a combination of individual samples (aliquots) collected
at a specific frequency over a specified time period. Each aliquot shall be analyzed individually before being combined into a single composite sample. The recorded values will be both the individually analyzed aliquots and the composite sample.
“Monthly monitoring” means monitoring conducted at a minimum of once every calendar
month. “Outfall” means any point source which discharges directly to waters of the United States
and does not include open conveyances connecting two municipal separate storm sewers, or pipes, tunnels or other conveyances which connect segments of the same stream or other waters of the United States and are used to convey waters of the United States. (For purposes of the manual, the term “Outfall” may include other locations at which a permit required monitoring (e.g., a monitoring chamber for a treatment works)).
“Process wastewater” means any water which, during manufacturing or processing, comes
into direct contact with or results from the production or use of any raw material, intermediate product, finished product, byproduct, or waste product. Process wastewater includes, but is not limited to, leachate and cooling water other than non-contact cooling water. This definition includes the terms commercial wastewater and industrial wastewater as used in 40 CFR Part 503.
“Quarterly monitoring” means monitoring conducted at a minimum frequency of once
every three calendar months. “Semiannual Monitoring” means monitoring conducted at a minimum frequency of once
every six calendar months.

12/07 13
“Separate Storm Sewer” means a conveyance or system of conveyances (including roads
with drainage systems, streets, catch basins, gutters, ditches, man-made channels, or storm drains):
1. Designed or used for collecting or conveying stormwater 2. Which is not part of a combined sewer system; and 3. Which is not part of a publicly owned treatment works (POTW).
“Seven day average value” means the greatest sum of all daily discharges measured during any seven consecutive days, divided by the number of daily discharges measured during that period. Results are commonly expressed in loading (kg/day) and/or concentration (mg/L).
“Stormwater” means water resulting from precipitation (including rain and snow) that:
1. Runs off the land's surface; 2. Is transmitted to the subsurface; or 3. Is captured by separate storm sewers or other sewerage or drainage facilities, or
conveyed by snow removal equipment. “Weekly monitoring” means monitoring conducted at a minimum of once every seven
calendar day period. “30 day average” or “monthly average value” means the sum of all daily discharges
measured during a calendar month, divided by the number of daily discharges measured during that month. Results are commonly expressed in loading (kg/day) and/or concentration (mg/L).
“24 hour composite sample” means a combination of individual aliquots obtained at a
minimum frequency of one aliquot at hourly intervals over a 24-hour period.
D. Other Definitions “Annual Monitoring” means monitoring conducted at a minimum frequency of once every
calendar year. “Average quarterly discharge limitation” means the highest allowable average of daily
discharges over a calendar quarter calculated as the sum of all daily discharges measured during a calendar quarter divided by the number of daily discharges measured during that quarter.
“Average semiannual discharge limitation” means the highest allowable average of daily
discharges over a semiannual period calculated as the sum of all daily discharges measured during a semiannual period divided by the number of daily discharges measured during that semiannual period.

12/07 14
“Laboratory Composite” means a sample obtained by drawing one or more grab samples during a 24 hour period, then, if more than one grab sampling was taken, combining in the laboratory the individual grab samples in accordance with protocols (including appropriate preservation) specified in 40 CFR 136 and appropriate EPA guidance to form a single sample for analysis.
“Monitoring Report Form” or “MRF” means the standard NJDEP form (Discharge
Monitoring Report, Residuals Transfer Report, and/or Waste Characterization Report), including any subsequent additions, revisions or modifications, for the reporting of self - monitoring results by permittees. (See also the definitions of “Discharge Monitoring Report”, “Waste Characterization Report”, and “Residuals Transfer Report”).
“Monitoring Report Submittal Form” means the cover page to be submitted with a
Monitoring Report Form. “Residuals Transfer Report” means NJDEP’s form used to track quantities of sludge
volumes transferred inter- and intra- facility. “Semiannual Monitoring” means monitoring conducted at a minimum frequency of once
every six calendar months. “Waste Characterization Report” means NJDEP's form which is designed to serve various
functions such as 1) reporting of surface water sampling data for nonlimited parameters, such as priority pollutant scans, either required to be monitored once during the permit term or periodically, such as quarterly, semiannually, etc.; 2) collecting information on groundwater monitoring well results; 3) collecting residuals monitoring information; 4) collecting information on stormwater sampling events.
“Weekly discharge limitation” means the highest allowable average of “daily discharges”
over any seven consecutive days, calculated as the sum of all daily discharges measured during any seven consecutive days, divided by the number of daily discharges measured during that period.

12/07 15
Chapter 4: Understanding and Completing NJPDES Monitoring Report Forms (MRFs)
A Monitoring Report Form is used for the routine reporting of influent and effluent monitoring data for NJPDES/DSW, NJPDES/DST, NJPDES/SIU, and NJPDES/DGW permits. MRFs are also used for the routine reporting of residuals quality and quantity data as required by the Sludge Quality Assurance Regulations (N.J.A.C. 7:14C) as well as for submitting compliance monitoring data for NJPDES/Residuals permits. MRF data must be accurate, representative and timely so that the data can be compared to the NJPDES permit requirements to determine permit compliance. Failure to submit data subjects the permittee to civil administrative penalties pursuant to the Act. Furthermore, any intentional falsification of MRF data is a substantial violation subject to criminal enforcement action pursuant to N.J.A.C. 7:14A-4.9(d), N.J.A.C. 7:14A-6.9(b) and the Act. In accordance with N.J.A.C. 7:14A-6.8(a), the permittee shall report monitoring results on NJDEP’s original MRF. The signed original MRF shall be submitted to NJDEP, Bureau of Permit Management, PO Box 029, Trenton, New Jersey 08625-0029. A copy of the MRF shall also be submitted to any other appropriate agency as required by the permit and/or applicable regulations. Reports other than MRFs should be submitted to the Bureau and or Agency indicated in the permit. Lab results should be kept on site, unless otherwise specified by your NJPDES permit. If the permittee does not receive pre-printed MRFs, contact the Bureau of Permit Management at 609-984-4428. The MRF should be submitted as per the specified schedule in the NJPDES permit and according to N.J.A.C. 7:14A-6.8. Facilities which have a final effective NJPDES permit with either an inactive and/or ceased discharge are still required to submit MRFs until the outfall has been officially inactivated or NJPDES permit has been officially revoked. Facilities with no discharge, either during a particular monitoring period, or while awaiting official revocation, shall check the “No Discharge this Monitoring Period” box on the monitoring report submittal form and submit the form to NJDEP. Please ensure that the information is accurate and certified.

12/07 16
A. Monitoring Report Submittal Form Each monitoring report type form type (DMR, RTR, WCR) has its own Monitoring Report
Submittal Form (MRSF) cover sheet for each monitored location. The signature block is on the MRSF.
The MRSF shall be signed, completed, and accompany each type of report. Any MRF
submitted without the associated MRSF not properly completed and signed will not be accepted or processed. Such a report will be treated as if no report was ever received. This is a violation of the Act.
Name/Address Check that the correct name(s) and address(s) of the permittee and the facility are correct as
they appear on the submittal sheet. Permit Number Check that the pre-printed MRF NJPDES Permit number conforms with the NJPDES permit
number for the permit for which you are reporting information. Monitoring Period Ensure that the dates specified are for the beginning and end of the monitoring period and
use the corresponding MRF for the appropriate monitoring period. Specify the “month, day, year” (e.g., 07/01/04). Do not alter the monitoring periods on the MRF.
Monitored Location One or more separate MRFs should be pre-printed for each discrete outfall. Ensure that the
monitored location printed on the MRSF and each associated form conforms with the permitted outfall and the outfall number from which samples were taken.
No Discharge this Monitoring Period Box If you check the “No Discharge this Monitoring Period” box on the MRSF, indicating that
there was no discharge during that monitoring period from that monitoring location, the report forms themselves (DMRs, WCRs, RTRs, etc.) do not need to be submitted for that particular monitored location and monitoring period. Only the Monitoring Report Submittal Form is required.
Monitoring Report Comments Attached This box is used for anyone wishing to submit monitoring report comments. Check the
checkbox and attach your comments. Place the NJPDES permit number, monitored location, and monitoring period on the comments that are attached.
Signatories Pursuant to N.J.A.C. 7:14A-4.9, N.J.A.C. 7:14A-6.9(a), and N.J.S.A. 58:10A-1, etc., the
MRF shall be signed by the highest ranking official having day-to-day managerial and operational responsibilities for the discharging facility, which may include authorizing capital expenditures or hiring personnel. In his/her absence, this person may authorize another responsible high-ranking official to sign a MRSF if a report is required to be filed

12/07 17
during that time. In addition, legibly print the name of the person making the certification, his/her title and phone number, and the date the certification is made. This line is the first signature line on the MRSF.
The signature line for local agencies is located on the bottom of the form. For a local
agency, the highest-ranking licensed operator of the treatment works shall sign the MRSF. In the case where a local agency has contracted with another entity to operate the treatment works, the highest-ranking official who signs the certification on the form shall be an employee of the contract operator.
If the highest ranking licensed operator of the local agency does not have the ability to
authorize capital expenditures and hire personnel, a person at the local agency having that responsibility may sign on the signature line at the bottom of the MRSF. This signature line only indicates that the person has received and reviewed the accompanying MRFs. Also, in the case where a local agency has contracted with another entity to operate the treatment works, the person submitting the signature shall be an employee of the permittee and not of the contract operator.
Please refer any questions regarding signatories to the applicable water compliance and
enforcement bureau. Please see page 21 of this manual for a listing of these offices and their telephone numbers.
B. Discharge Monitoring Reports The Discharge Monitoring Report (DMR) form is generally used to record data for limited
parameters, although the permit writer may choose to include parameters that are not limited on the DMR, depending on the frequency of monitoring required. The DMR is also used to report information required under the Sludge Quality Assurance Regulations.
Parameter Attention must be paid to the monitoring location descriptions for each parameter since
multiple monitoring locations (e.g., influent/effluent, upstream/downstream) may appear for the same parameter on a single DMR form. The monitoring location description is indicated at the bottom of this block and the corresponding code is the first digit following the five digit parameter code.
Sample Measurement Row Enter sample measurement data for each parameter under the “Quantity or Loading” or
“Quality or Concentration” sections of the DMR in accordance with permit requirements. Report monitoring data in the units as specified in the permit.
Permit Requirement Row The permit requirement row (shaded area) lists the NJPDES permit effluent limit and/or the
reporting requirement (indicated by the term “Report”) for each parameter and a description of the statistical basis (e.g., monthly minimum, monthly average, daily maximum, etc.) for the reporting requirement.

12/07 18
Units Report monitoring data in the units as specified in the permit. No. Ex. (Number of Excursions) Enter the number of sample measurements and/or calculated values for the monitoring period
that do not comply with the permit and/or enforcement document (e.g., Administrative Consent Order, Administrative Order, etc.) requirements (minimum and/or maximum, weekly-day average, etc.) for each parameter. The number shall be the total of all excursions during the reporting period for each parameter, including loadings, concentrations and/or % removals. If there are no excursions during the reporting period enter “0”. If there are no limits for a parameter (e.g., reporting requirements only) for either concentration or loading, a “0” may also be entered for this parameter.
For example, the following monitoring data is for a facility whose NJPDES permit has
average monthly and maximum discharge concentration limitations of 20 mg/L and 40 mg/L respectively.
Sample Data (mg/L)
50 42 45 50 44
The five samples above all exceeded the maximum discharge limitation of 40 mg/L (5 excursions) and the average of the above sample results also exceeds the monthly discharge limitation of 20 mg/L (1 excursion). Therefore, the total number of excursions to be entered in the No. Ex. Column on the DMR for the above example would be six.
In a second example, a facility only has a monthly average loading discharge limitation of
152 kg/day. Suppose the reported monthly average loading value is 150 kg/day, which is in compliance with the permit limitation. In this case, a “0” would be put in the No. Ex. Block of the DMR since the average monthly discharge limit was not exceeded.
NOTE: If the permittee and NJDEP have executed a formal enforcement document that
includes interim enforcement effluent limits for certain parameters, the DMR data should be compared to the enforcement limits for those parameters and the number of excursions reported accordingly.
For a third example, please refer to Chapter 6, Section B.3. of this document, which
illustrates the number of excursions for the weekly average calculation. Frequency of Analysis Enter the frequency of analysis code for each parameter. The monitoring frequency specified
in the permit is the minimum required frequency of analysis. If additional sampling or monitoring is conducted, the permittee should indicate the increased sampling frequency by writing the number of samples actually taken in the box above the number of samples required. If the permittee does not comply with the minimum monitoring frequency specified in the permit, the permittee should also indicate the decreased sampling frequency by writing in the number of samples actually taken. In cases of increased or decreased

12/07 19
sampling, the permittee should include the results of all samples in the applicable calculations and data submitted on the report form as appropriate. For decreased sampling, the permittee should also check the box “Monitoring Report Comments Attached” on the MRSF and attach a sheet explaining the monitoring reduction. Please refer to Chapter 5, “Reporting Requirements, NJPDES Monitoring Requirements” for a detailed explanation.
Sample Type Enter the Code= that corresponds to the actual sample type collected during the monitoring
period in the sample measurement row. (See Chapter 11, Appendix 1). QL - "Quantification Level" means the measure of the smallest quantity of an analyte below
which the sample analysis equipment will not detect the analyte accurately. In some cases, the permit (and MRF) will specify a type of QL, such as “RQL” or recommended quantification limit.
1. DMR Reporting Codes
Where a discharge or sludge removal has occurred and some or all of the monitoring/analysis was not performed at a monitoring location, when appropriate, the following codes may be entered at the parameter level in place of all analytical results in the row for quality/loading, quantity/concentration, blocks(fields) on the DMR. These codes may be used for any DMR form type. Please note that if the permittee neglected to sample and analyze for a particular parameter that was required to be tested during the monitoring period, these codes are not appropriate, and the field for that parameter must be left blank.
Code = E Indicates situations of improper laboratory analysis, invalid measurement and/or test results. A statement from the laboratory should accompany such results and a copy must be sent to the appropriate enforcement bureau. Code = M Not Applicable During Sludge Monitoring Period (applies to Residuals DMRs only). Code = N Sample Not Required this Monitoring Period. Please note that Code = NODI for no discharge, and ND for non-detect, are not acceptable codes. As noted above, a facility indicates “No Discharge” by checking the “No Discharge this Monitoring Period” box on the Monitoring Report submittal form. If a result is not detected, enter the less than sign “<” and analytical detection level, (e.g., “<0.05”).
2. Mandatory Monthly Reporting (MMR) In accordance with N.J.A.C. 7:14A-6.5(d), a permittee must revise its effluent monitoring and reporting frequency to monthly for one or more parameters for which the permittee is required to report less frequently than monthly, (e.g., quarterly, semi-annually and annual) if the permittee: 1) reports a serious effluent violation, as defined by N.J.A.C.

12/07 20
7:14-8.2; or 2) fails to submit a timely and completed DMR. Monthly monitoring shall begin after the violation is verified, evaluated and the permittee is formally notified in writing of the violation. The permittee must continue the monthly monitoring and reporting until six consecutive monthly DMRs are submitted which show no serious effluent violations, omissions, significant non-complier designation for the particular parameter at the particular discharge point. An example of MMR: A facility has a quarterly monitored parameter for COD with a limit of 25 mg/L monthly average limit. For the month of April the facility has reported a result of 120 mg/L which is a serious violation. The DMR is submitted postmarked May 24th. The DMR is received by the NJDEP Bureau of Permit Management. The postmark date and data is entered into NJEMS. By the second week of June, the data is verified and designated as a serious violation and flagged as MMR. That violation information is forwarded to the enforcement case manager who verifies and evaluates the violation. Upon validation of the violation, the case manager places the facility on MMR status and notifies the facility through a Notice of Violation that the facility is required to initiate MMR for that parameter for six consecutive months. The earliest that the facility would be required to “automatically” initiate MMR would be July. Notes: a) NJPDES-SIU permittees that resample pursuant to 40 CFR Part 403 as a result of a
reported violation which triggers MMR may be able to use the additional samples to meet MMR obligations after verification, evaluation, and notification by the Enforcement Bureau. The permittee will be notified in writing accordingly.
b) For whole effluent toxicity violations: As stated above, a permittee is required to increase the monitoring frequency to
monthly if there are any "serious violations" (as defined by N.J.A.C. 7:14-8.2 and 7:14A-1.2) of a whole effluent toxicity limitation. This monthly monitoring frequency shall continue until the permittee is in compliance with the limitation which caused the serious violation for six consecutive months. At that time, the permittee may resume the original monitoring frequency as per the permit.
However, permittees with whole effluent toxicity limitations must also comply with
the Toxicity Reduction Investigation Requirements (TRIR) in the permit.
The monthly monitoring conducted to comply with the MMR requirements may also be used to satisfy the initial TRIR requirements, and vice versa, after notification by the Enforcement and Permitting Bureaus. The permittee will be notified in writing accordingly.
If you have questions regarding your MMR status, please contact your regional Water
Compliance and Enforcement office.

12/07 21
If you have any questions regarding your TRIR requirements may be directed to the Bureau of Point Source Permitting - Biomonitoring Program at (609) 633-3869.
• Central Bureau of Water Compliance and Enforcement Office: Counties of
Mercer, Middlesex, Monmouth, Ocean, and Union (609) 584-4200. • Northern Bureau of Water Compliance and Enforcement Office: Counties of
Bergen, Essex, Hudson, Hunterdon, Morris, Passaic, Somerset, Sussex, and Warren (973) 565-4099.
• Southern Bureau of Water Compliance and Enforcement Office: Counties of
Atlantic, Burlington, Camden, Cape May, Cumberland, Gloucester, and Salem (609) 968-2600.
3. DMR Instructions for Residuals
The DMR will be used for reporting several aspects of a sludge self-monitoring program. For SQAR reporting purposes, the DMR will continue to be used for reporting monthly quarterly, semi-annual, and annual metals and nutrients for domestic treatment works. The DMR is also used for reporting quality and quantity information on sludge from industrial treatment works. For residuals land application permits, the DMR is used to report information on parameters that have limits. This includes information on metals, pathogen process parameters, and vector attraction reduction process parameters. The DMR may also be used for other aspects of sludge requirements as determined by the NJPDES permit.
Specific requirements for completing certain aspects of the DMR are identified below:
a) Do not leave any blanks.
b) All domestic and industrial treatment works are exempt from performing analyses during monitoring periods when sludge is not removed from the treatment works for use or disposal; however, any domestic treatment works must perform the minimum number of analyses required to be submitted under 40 CFR Parts 503.116, 503.26 and 503.46 based on the annual amount of sludge removed for use or disposal. If no sludge has been removed, check the box labeled "No Discharge this Monitoring Period" on the MRSF. Only the MRSF needs to be returned.
c) Some sludge land application permits will allow the choice of salmonella or fecal coliform as part of pathogen reduction monitoring requirements. Unless an individual NJPDES permit requires otherwise, a facility will only be required to perform one of these analyses. For the parameter not chosen, use "CODE =M" in the quality or concentration measurement blocks on the DMR.
d) NJPDES permits for the land application of sludge require the reporting of a maximum and a monthly average for certain parameters (e.g., metals). However, usually only one analysis is required to be obtained by the permit per monitoring period. In such instances, where the permittee only has one analysis performed, the same result must

12/07 22
be reported as the maximum and the monthly average. If the permittee performs more analyses than required, and some of those values are not detected, not detected values must be assumed present at the minimum detection limit when calculating a monthly average for sludge monitoring purposes.
e) For domestic treatment works doing quarterly DMRs, report quarterly DMRs pursuant to SQAR based on calendar quarters.
If you have any questions on the sludge reporting forms, please do not hesitate to contact your case manager in the Bureau of Pretreatment and Residuals at (609) 633-3823.
C. Residual Transfer Reports
The Residual Transfer Report (RTR) is required to be completed by a NJPDES permittee to track the inter and/or intra-facility movement of sludge volumes for a transfer station, land application operation, or another treatment works which receives sludge from off-site sources. The RTR is also required by the Sludge Quality Assurance Regulations (SQAR) to be submitted by all sludge generators. Specifically, N.J.A.C. 7:14C-1.8(b) for domestic treatment works and N.J.A.C. 7:14C-1.9(b) for industrial treatment works, require the following information to be reported on the RTR: 1. The quantity of sludge removed to each ultimate sludge management alternative on a wet
basis in gallons, wet cubic yards, and/or wet metric tons for the reporting period. 2. The Program Interest (PI) number under NJDEP’s New Jersey Environmental
Management System (NJEMS) for each ultimate sludge management alternative. PI numbers may be found online (see below) or by phoning the Bureau of Pretreatment and Residuals at 609-633-3823.
a) If an ultimate sludge management alternative is located in New Jersey but has not
been assigned a NJEMS PI number, the treatment works shall include on the RTR form the name of the ultimate sludge management alternative, and the applicable New Jersey Pollutant Discharge Elimination System (NJPDES), Air Pollution Control, or Solid Waste permit number.
b) If an ultimate sludge management alternative is not located in New Jersey and has not
been assigned a NJEMS PI number, the treatment works shall include on the RTR form the name and location of the out-of-state sludge management alternative, and the full address and telephone number of the appropriate permitting authority.
As with the DMR and WCR, if no sludge is removed or received for the monitoring
period, check “No Discharge this Monitoring Period” on the MRSF and return the signed MRSF, the remainder of the form is not required. Additional instructions on how to complete specific fields are found below.

12/07 23
Sent to: For the applicable entry on the RTR, put an “x” in the box under this heading if the entry denotes sludge sent to a use or disposal operation. This heading is also used to denote intra-facility transfers such as from a storage tank to a land application field.
Rec’d from (“Received from”): For the applicable entry on the RTR, put an “x” in the box under this heading if the entry denotes sludge received from another generator for treatment or processing. This heading is also used to denote intra-facility transfers. Total quantities received from each off-site source in a monitoring period must be reported. Domestic septage may be totaled as one line item.
Facility ID Number
This column is for the program interest (PI) number which identifies each permitted facility in NJDEP’s NJEMS database. This number has also been referred to by NJDEP as the NJEMS facility identification number. Enter the NJEMS PI number for the use or disposal site, or the NJEMS PI number for the treatment works of the sludge received. When an NJEMS PI number is not available, follow the procedures outlined in number 2a. or 2b. above.
A report including the NJEMS PI numbers for all active NJPDES permits is available for download at the DEP Data Miner web site. See the web site address below. Click on NJPDES Active Permit List to access the report. This report includes the NJPDES Permit number and PI number along with other pertinent permit information.
http://datamine.state.nj.us/DEP_OPRA/OpraMain/categories?category=NJPDES%20Permitting
Amount Transferred
For the reporting period, indicate the total quantity of sludge removed for use or disposal separately for each ultimate management site, and/or the total quantity received for the monitoring period from each off-site source. Provide the appropriate wet units for the quantity reported (e.g., gallons per month or year, wet cubic yards per month or year, wet metric tons per month or year). Separately report each type of sludge that is removed, transferred, or received.
Note: Both inter-facility and intra-facility transfers must be reported.
Monitored Location
This field is for intra-facility transfers only, such as from a storage tank to a land application field. Enter the 4 digit designator and description (e.g., D001 Field 1), as noted below.

12/07 24
1. An “Inter” facility transfer means a transfer of sludge between two monitored locations at different NJEMS Program Interest numbers (e.g., from a customer sewage treatment plant to another receiving treatment works). The Monitored Location column of the Residuals Transfer Report is left blank for these types of transfers.
2. An “Intra” facility transfer means a transfer of sludge between two monitored
locations at the same NJEMS Program Interest number (e.g., from a farm’s storage tank to their land application field; from a plants belt press to their incinerator). Enter the 4 digit designator and description (e.g., D001 - Storage Tank 1 or D003 - Field 1; SL4A - Belt Press or INC1 - Feed Sludge) in the Monitored Location column of the Residuals Transfer Report. For example, if you are reporting a transfer from the “SL4A-Belt Filter Press” Monitored Location to the “INC1-Incinerator” Monitored Location, for the SL4A Residuals Transfer Report, check the “Sent to” box, indicate the quantity transferred, and indicate “INC1” in the Monitoring Location column. For the INC1 Residuals Transfer Report, check the “Received from” box, indicate the same quantity transferred, and indicate “SL4A” in the Monitored Location column.
D. Waste Characterization Report (WCR) The Waste Characterization Report (WCR) form is used to record data for most “monitor and
report only” parameters for surface water dischargers, ground water discharges and residual dischargers. However, they can also be used for compliance reporting of ground water monitoring well data. Sludge reporters should also refer to the section below labeled “WCR Instructions for Sludge Reporters” for additional information. Multiple WCR forms may be required based upon varying monitoring frequency.
The WCR monitoring frequency specified in the permit is the minimum required frequency
of analysis. If additional sampling or monitoring is conducted during the monitoring period, the
permittee should hold all the sampling results until the end of the WCR monitoring period. The permittee should note the increased sampling by checking the box “Monitoring Report Comments Attached” on the MRSF, attach a sheet containing comments (e.g., sample dates and parameters sampled on each date), and include the results of all samples in the applicable calculations and data submitted on the report form.
In the event the permittee has sampled the minimum requirements, reported the results on the
WCR before the end of the monitoring period, and has sampled again, then the permittee must submit a corrected WCR.
In all cases of increased or decreased sampling, the permittee should check the box
“Monitoring Report Comments Attached” on the MRSF, attach a sheet containing comments (e.g., sample dates and parameters sampled on each date) and include the results of all samples in the applicable calculations and data submitted on the report form as appropriate.
12/07 25
Reporting Rainfall: When a NJPDES Permit requires rain data to be reported on a WCR and the permittee decides to sample more than one rain event during a monitoring period, the permittee shall do the following: The Permittee shall report rain data on the WCR form from the first event that samples are collected in the monitoring period. The permittee shall then check the "Monitoring Report Comments Attached" box on the Monitoring Report Submittal Form, and include a letter summarizing the rain data from all the other events that were sampled during the monitoring period. That data shall be included with the DMR and WCR forms submitted to the Department for that monitoring period. All requested rain data must be completed for the rain event summary. All data must be also be retained on site. Note: Rain data refers to storm event date, time, duration, amount of rainfall, time of sample, hours since last storm event, etc.
Sample Date of Report Enter the date the sample was taken. Parameter Attention must be paid to the monitoring location descriptions for each parameter since
multiple monitoring locations (e.g., influent/effluent, upstream/downstream) may appear for the same parameter on a single MRF form. The monitoring location description is indicated at the bottom of this block and the corresponding code is the first digit following the five digit parameter code (see Figure 2).
Reported Value Place sample measurement data for each parameter under the “Reported Value” section.
Report monitoring data in the units as specified in the permit. If more than one valid sample result for the period exists, enter the average of all such results unless otherwise instructed or otherwise indicated in your permit. Do not leave any blanks in the “Reported Value” column. Where a discharge has occurred and some or all of the monitoring/analysis was not performed at a monitoring location, the following codes may be entered at the parameter level in place of the analytical results in the “Reported Value” column on the WCR, when appropriate. These codes may be used for any WCR type.
Code = E Indicates situations of improper laboratory analysis, invalid measurement and/or
test results. A statement should accompany such results from the laboratory and a copy must be sent to the appropriate enforcement bureau.
Code = M Not Applicable During Sludge Monitoring Period (applies to Residuals WCRs
only).
Code = N Sample Not Required this Monitoring Period. Also please note that when a result is not detected (ND), use the less than sign “<” and the
analytical detection level in the “Reported Value” column (e.g., <0.05). This can be
12/07 26
followed by Code=K, Code=T or Code=U in the “Remark Code” column, if applicable, as described below.
RQL - "Quantification Level" means the measure of the smallest quantity of an analyte
below which the sample analysis equipment will not detect the analyte accurately. Units Report monitoring data in the units as specified in the permit. Remark Code The following codes may be used when completing any WCR form type to clarify the
analytical data reported. The code is to be entered in the “Remark Code” column. The “Remark Code” column may be left blank if no code is applicable to the analytical data.
Code = B Value reported is a microbiological count which exceeds the acceptable range
of accuracy for the analytical procedure. Code = J Value reported is from a sample where the holding time has been exceeded. Code = K Value reported was detected but is less than the limit of detection of the
analytical procedure. Code = L Actual value is known to be greater than the value reported. Code = T Actual value is known to be less than the value reported. Use when the result of
the analysis is below the limit of detection of the analytical procedure as the value reported.
Code = U Parameter was analyzed for, but not detected. Report the method detection limit.
For the coliform group of bacteria the value reported indicates no positive growth.
Sample Type Enter the code that corresponds to the actual sample type collected during the monitoring
period in the sample measurement row. WCR Instructions for Sludge Reporters
The WCR is designed to serve several functions with respect to reporting sludge monitoring information. For SQAR reporting purposes, the “production” WCR is to be used for reporting sludge use and disposal information on a dry weight basis. In addition, for domestic treatment works with a permitted wastewater flow greater than or equal to 1.0 mgd, the WCR is used for reporting quality information on the annual priority pollutants in accordance with SQAR. The WCR may also be used for reporting certain aspects of a self-monitoring program for land application permits or other types of sludge information. How

12/07 27
the WCR is to be used in these instances will be determined by the permit. The columns labeled “Parameter”, “Units”, and “Sample Type” will be pre-printed on the WCR.
Residuals Production WCR
Specific requirements for completing the “production” WCR to report information on sludge use or disposal are outlined below.
a) If sludge is removed during the monitoring period, a minimum of four items (fields) must be completed as follows:
• Total amount of sludge removed (wet basis).
• Total amount of sludge removed (dry basis).
• Total amount of sludge removed by management method (dry basis). If only one management alternative is used during the monitoring period, then the quantity reported in this field would be the same as the total amount of sludge removed (dry basis).
• Percent total solids.
b) If no sludge is removed for the monitoring period, the entire WCR does not need to be returned. Check "No Discharge this Monitoring Period" on the Monitoring Report Submittal Form and return just the Monitoring Report Submittal Form.
c) Total amount of sludge removed (wet basis): Report the total quantity of sludge removed for the month or year, as applicable. This information should coincide with the information reported on the RTR. For a wet basis, the amount of sludge removed may be reported in gallons, cubic yards and/or metric tons. You do not need to report an amount of sludge removed on a wet basis for all three provided units. Choose the best wet basis unit(s) that is applicable for your system and enter the quantity under the "reported value" column. However, do not leave any blank fields in the "reported value" column. For those fields which are not applicable, use “Code=M”. (Code=M is not applicable during sludge monitoring period).
d) Total amount of sludge removed (dry basis): Report the total quantity of sludge removed for the month or year, as applicable, on a dry weight basis. This value is a conversion from the wet basis units and the total solids that are also reported on the WCR. Consistent with federal regulations please note the units are in dry metric tons. Typical conversions are as follows(for percent total solids in the calculations below, keep the percent sign, you do not have to move the decimal place):
Gallons to dry metric tons: (Gallons) x (Percent Total Solids) ÷ 26400 Wet tons to dry metric tons: (Wet Tons) x (Percent Total Solids) ÷110

12/07 28
Cubic yards (wet) to dry metric tons: (Cubic Yards) x (Percent Total Solids) ÷ (y) x (110) y = 1.185 where solids content is 15% or less 1.265 where solids content is 16% to 23% 1.58 where solids content is 24% to 29% 1.9 where solids content is 30% or greater Wet tons to wet metric tons: Wet Tons ÷ 1.1 Wet metric tons to dry metric tons: (Wet Metric Tons) x (Percent Total Solids) ÷ 100
Dry tons to dry metric tons: Dry Tons ÷ 1.1
e) Total amount of sludge removed by management method: There are several fields provided that require the reporting of the amount of sludge removed by management method (for example, “amount of sludge land applied”) on a dry weight basis. Indicate for each field the amount of sludge managed by that method for the reporting period. The total for all these fields must equal the total amount reported as being removed as described under item d above. If sludge is transported out -of-state, note that there are now two possible options. Report either “Sludge Disposed Out-of-State” or “Sludge Beneficial Use Out-of-State” for sludge that is transported out-of-state. Do not report the specific management method (for example, landfill) if sludge is transported out-of-state. However, do not leave any blank fields in the “reported value” column. For those fields that are not applicable, use “CODE = M”.
f) If another in-state POTW is used for sludge management services, report the amount removed by the management method based on the management method used by the receiving POTW. If the receiving plant goes to several management alternatives with their sludge (e.g., Sludge Disposed Out-of-State and Sludge Beneficial Use Out-of State), the customer should report those same management alternatives in the same percentages on their WCR. The customer should contact the receiving POTW to find out what the ultimate management method is for the sludge. To minimize double counting, POTWs that receive sludge are not to include customer sludge quantities in the amount removed to a management method on the WCR, unless the sludge is incorporated at the head end of the treatment works.
g) Total solids: Report the average of all samples collected for the total solids of sludge removed for the monitoring period.
h) Amount of sludge and/or septage received from off-site sources (monthly WCR only). Report on a wet basis the total amount of sludge received from off-site sources for the month. Choose the most appropriate units as gallons, metric tons and/or cubic yards. However, do not leave any blank fields in the "reported value" column, for those fields
12/07 29
which are not applicable, use "Code=M". This information should match what is being reported on the RTR.
Annual Priority Pollutants
Specific requirements for completing the Residual WCR to report the annual priority pollutants are outlined below.
a) The analytical result from the New Jersey Certified Laboratory for the indicated parameter must be entered in the "reported value" column. The units in the "units" column must be followed. Sometimes a laboratory may report results in ppb for organics (that is, ug/kg); however, the sludge WCR requests all results in ppm (that is, mg/kg). Please be sure to make all necessary conversions and report in the correct units.
b) Instructions for reporting monitoring results for 2,3,7,8 Tetrachlorodibenzo-p-dioxin (TCDD): Amendments to the Sludge Quality Assurance Regulations no longer require reporting for this parameter. Use Code=M in the “Reported Value” column of the Residuals WCR if the parameter has not been removed from your permits monitoring requirements.
E. Common Reporting Mistakes and Comments
1. DMR Forms
Mistakes: DO NOT: • Change Monitoring Periods. The database creates a unique key for each form that is
created. This key is based on NJPDES permit number, monitored location, and monitoring period. If this field is changed, the form cannot be keyed into the database.
• Enter ND or NODI anywhere on the MRFs. These codes are no longer valid and will cause reporting violations to be created. When a parameter is not detected (ND), use the less than sign “<” and the analytical detection level.
• Use commas in the reported value. It is sometimes difficult to distinguish between a comma and a decimal. Do not use commas. When using decimals, make sure they are clearly legible.
• Forget to enter the “less than” symbol – “<” when the analytical results are less then the detection level.
• Forget to provide the Lab Certification number(s) in the space(s) provided. • Leave blanks on the DMR form. A result or applicable DMR Code E, M, or N must
be provided in all open fields on the DMR form (except for unused Lab Certification fields), unless a sampling round has been missed, in which case you leave the field blank.

12/07 30
• Report in incorrect units. For example, a DMR may call for results in units of ug/L and the laboratory data may use units of mg/L. In this case, you would need to multiply the number reported by the lab by 1000 before entering it on the DMR.
• Miscount leading zeros, e.g., reporting 0.001 when 0.0001 should have been entered. Comments: • Please note that WCR Remark Codes B, J, K, L, T, and U cannot be used on the
DMR form.
2. RTR Forms
Mistakes:
• Reporting quantity information on a dry weight basis (e.g., dry metric tons). The RTR has been designed to report quantity information in wet units only (e.g., gallons, wet metric tons, wet cubic yards).
• Itemizing each load, or itemizing a daily total received from a specific source. The quantity received from each separate source should be totaled and one entry made for each specific source for the entire monitoring period. All domestic septage received for the monitoring period may be itemized as one line item.
Comments:
• For the “Facility ID Number” column, use the NJEMS Program Interest (PI) number if one has been assigned to the facility. This number identifies the facility in the NJEMS database. If you are not sure of the PI number you may contact the Bureau of Pretreatment and Residuals at 609-633-3823. If the facility does not have a PI number, follow the instructions above under “Residual Transfer Report” at 2.a or 2.b.
• For domestic or industrial treatment works that accept customers or have more than one monitored location, proper completion of the Residual Transfer Report(s) may vary. Contact your case manager in the Bureau of Pretreatment and Residuals if you have any questions on how to properly complete your form(s).
3. WCR Forms
Mistakes DO NOT • Leave “Sample Date of Report” left blank or not filled out correctly. Enter the date
the sample was taken and not the date the form was filled out. If the sample is a composite, then it is the date the last sample was taken to make the composite. The holding time will start at the time the last sample is taken.
• Change the Monitoring Period. Many reports are received and the monitoring period was changed on the pre-print. The database creates a unique key for each form based

12/07 31
on permit number, monitored location, and monitoring period. If the monitoring period is changed, it cannot be data entered into the database. If you feel your monitoring period is wrong, contact your case manger.
• Change the monitored location. Again, changing the monitoring location will stop a form from being data entered into the database. If you have moved your monitored location, or replace a well, thus changing the monitored location, this needs to be addressed via a permit modification. Please contact your case manager.
• Leave “Reported Value” column blank. The only time a Reported Value box should be left blank is if you neglected to sample and analyze for a particular parameter that was required to be tested for that particular monitoring period. Even though the RQL is now printed on the form, it is for informational purposes only. You must still report the sample result. Not completing this box will cause an omission violation to be created. On Residual WCR forms, for those field that are not applicable during the reporting period use “Code=M”.
• Leave Lab Certification number(s) blank. Enter in the space(s) provided. • Enter ND or NODI anywhere on the form. These codes are no longer valid and will
cause reporting violations to be created. When a parameter is not detected (ND), use the less than sign “<” and the analytical detection level. This can be following by Code=K, Code=T, Code=U, if applicable, in the “Remark Code” column.
• Use commas in the reported values. It is sometimes difficult to distinguish between a comma and a decimal. Do not use commas. When using decimals, make sure they are clearly legible.
• Report in incorrect units (e.g., ug/L when mg/L was required) or miscount leading zeros in a decimal fraction.
• Forget to enter the “less than” symbol “<” when the analytical results are less then the detection level.
Comments: • Report Codes E, M or N in the “Reported Values” column only. Do not report these
codes in the “Remark Code” column. • The “Remark Code” column should be used to clarify the analytical data reported.
Use Codes B, J, K, L, T, or U if applicable. • The “Remark Code” column may be left blank if there is no applicable code.
F. Electronic Reporting of MRFs via NJ Online
Permittees now have the opportunity to submit MRF data electronically to NJDEP. The Electronic Discharge Interchange (EDI) system has been created to combine today’s web technology with spreadsheet software technology.
The system is designed to closely mirror the existing manual operation. Upon creation of an ID and PIN (personal identification number) then approval from NJDEP, a permittee may download NJPDES EDI electronic spreadsheets via NJDEP online web portal at http://www.state.nj.us/dep/online/ for electronic data entry. When data entry is complete, the

12/07 32
form is validated, locked and uploaded to NJDEP via NJDEP’s online web portal. After uploading, NJDEP sends an e-mail message to the permittees designated responsible official advising that the form is ready to be certified. The responsible official then accesses the web portal, reviews the form and certifies it using their PIN. Once the file is certified the system spreadsheet data migrates over to NJDEP’s NJEMS database. At this point the form is considered postmarked complete. Electronic files are stored onsite for review by Compliance and Enforcement.
Benefits of Electronic Reporting include:
• Timely access to recently created forms.
• Timely acknowledgement upon certification.
• Immediate status of forms.
• What you see is what we get – no interpretation problems.
• Cost efficiencies, no postage fees or postage supplies to purchase.
• Storage efficiency, computer files stored on PC or other electronic media.
This service is free to all who wish to participate. All you need to participate is the following:
• Access to a Pentium computer or equivalent.
• Internet Access.
• An e-mail address.
• Microsoft Excel (optional).
• Electronic Storage Capacity (CD, DVD, hard drive or similar storage device).
• An executed agreement between NJDEP and the NJPDES permitted facility’s Responsible Official.
To sign up for participation into NJDEP EDI program, send an email to [email protected]. NJDEP will return an e-mail with a NJPDES EDI Agreement form and instructions to obtain your NJ Online ID and PIN. This agreement form may also be downloaded from the NJDEP On-line web site at the following address https://www9.state.nj.us/dep/DEP_eNJEMS/NJPDES_agreement_form.pdf . The agreement form will need to be completed and a hard copy returned to NJDEP. Upon approval of your request, NJDEP will send you an approval via e-mail along with a NJPDES EDI Reference Manual that will guide you through the NJPDES EDI process.
Please note that there is no specific method for submitting “attachments” to a monitoring form electronically at this time. Short textual attachments (e.g., certifications) may be submitted electronically in the “comments” section of the form. Otherwise, please submit attachments by mail, and indicate which monitoring form (permit number, type, outfall, and month they belong with).
12/07 33
You may still be required by your permit to submit report copies to entities other than NJDEP, and will need to submit hard copies unless the other entity is willing to accept electronic copies.

12/07 34
Chapter 5:
Reporting Requirements A. NJPDES Monitoring Requirements Pursuant to N.J.A.C. 7:14A-6.2(a), the permittee shall comply with all conditions of its
permit. This shall include providing samples and measurements that are representative of the monitored activity, in accordance with N.J.A.C. 7:14A-6.5(a)1.
NJDEP strongly suggests that sampling be scheduled at the beginning of the monitoring
period. This should avoid problems with inadequate laboratory capacity at the end of the monitoring period and allow the permittee time to conduct additional sampling in the event that it is necessary or required.
The permittee shall perform all analyses for the purpose of determining compliance with the
permit in accordance with the analytical test procedures approved under 40 CFR Part 136, 40 CFR 503.8, EPA Publication SW-846, or the NJPDES Compliance Inspection Manual, EPA 300-B-94-014, September 1994 pursuant to N.J.A.C. 7:14A-6.5(a)2 and N.J.A.C. 7:14C-1.4. In the case of residual use or disposal, analyses shall be conducted in accordance with the Sludge Quality Assurance Regulations.
All monitoring requirements of the permit are minimum requirements. However, additional
monitoring at the compliance point is encouraged as it promotes more representative data. The analytical results of any and all additional sampling or monitoring at the compliance point, using test procedures approved under 40 CFR Part 136 40 CFR 503.8, EPA Publication SW-846, or the NJPDES Compliance Inspection Manual, EPA 300-B-94-014, September 1994 and/or as specified in the permit, shall be included in the calculation of data, if the same methodologies are used. This data is then reported on the MRF, in accordance with N.J.A.C. 7:14A-6.8 and/or N.J.A.C. 7:14C-1.12. The results of sampling at the compliance point using test procedures not certified or approved in 40 CFR Part 136, 40 CFR 503.8, EPA Publication SW-846, or the NJPDES Compliance Inspection Manual, EPA 300-B-94-014, September 1994 or specified in the permit, should not be reported on the MRF, unless otherwise noted by NJDEP in writing. However, these results should be available for inspection by NJDEP. In all cases of increased or decreased sampling, the permittee should check the box “Monitoring Report Comments Attached” on the MRSF, attach a sheet containing the comments, and include the results of all samples in the applicable calculations and data submitted on the report form, as appropriate.
B. Frequency of MRF Submission All permittees are required to report a monthly average on their MRF for all “limited
pollutants” with the exception of pH, dissolved oxygen, whole effluent toxicity (WET), the lower explosive limit (LEL) and chlorine produced oxidants (CPO), and for certain residual use or disposal parameters (for example, salmonella). This is necessary to determine

12/07 35
compliance with the New Jersey Clean Water Enforcement Act (NJCWEA) amendment to the Water Pollution Control Act and can be found at N.J.A.C. 7:14A-6.8.
A permittee who has at least one monthly monitoring requirement is now required to submit
the monitoring report form on a monthly basis. These changes do not affect permit limits and should not affect how often a permittee samples. The permittee should report “CODE=N” for any parameter which is required to be sampled quarterly or less frequently than quarterly, for any particular month in which an analysis is not required to be performed for that parameter.
If a discharger does not have at least one monthly monitoring requirement, then the
discharger is only required to submit MRFs as per the permit (e.g., quarterly, semi-annually). However, the discharger is required to report a monthly average on that MRF as per the Act, pursuant to N.J.A.C. 7:14A-6.8. Please note that a quarterly or semi-annual MRF reporting requirement may change as noted in the frequency of analysis section and pursuant to N.J.A.C. 7:14A-6.5(d).
C. Intermittent Discharges
Although permitted discharges may occur on an intermittent basis, the permittee is required
to provide representative sampling of the monitored activity pursuant to N.J.A.C. 7:14A-6.5(a)1. Therefore, although a discharge may occur on an intermittent basis, it does not exempt the permittee from complying with the conditions of the permit. For example, if a permittee has a monthly monitoring and reporting requirement and the discharge occurs three separate times during the month, the permittee should obtain a sample during at least one of these discharge events.
Discharges from precipitation events are intermittent by nature. If the permit contains
limitations and/or monitoring requirements for stormwater discharges, the permittee should obtain and analyze sample(s) during the first available precipitation event producing a sufficient discharge. Please be aware that stormwater monitoring should not necessarily be conducted at 30-day intervals. Therefore, it is incorrect for the permittee to choose a sampling date which remains the same every month, and report “No Discharge this Monitoring Period” if it does not rain on that particular day.
D. Holiday and/or Weekend Analyses All required monitoring must be performed at least at the minimum frequency of analysis
specified in the permit, regardless of holidays and/or weekends. E. Reporting Noncompliance The permittee shall report any noncompliance in accordance with N.J.A.C. 7:14A-6.2(a)14
and N.J.A.C. 7:14A-6.10. Contact the appropriate regional compliance and enforcement bureau for further information, see page 21 for listing.
SIU permittees must also report unusual discharges in accordance with N.J.A.C. 7:14A-
21.2(b).

12/07 36
Chapter 6 Completion of Reported Values Verify that all parameters, “reporting” requirements, frequencies of analyses, and sample types are calculated and/or reported as required by the permit pursuant to N.J.A.C. 7:14A-6.8. As explained under “Sample Measurement” section, the reported value for each parameter should be expressed in “Quantity or Loading” and / or “Quality or Concentration” as specified by the permit. In the next few pages are a few examples illustrating a broad range of permit monitoring requirements, completing the calculations, and reporting the subsequent data on the MRFs. Each permittee should follow the examples which best fit the particular permit monitoring and reporting requirements. To fully understand the examples of this section, it is essential to read the definition of “daily discharge” which is contained in Chapter 3: Definitions and Acronyms of this manual.

A. Calculating Monthly Monitoring Data Table 1
Monthly Monitoring Data (sample results)
Date
Flow (mgd)
BOD5 Influent (mg/L)
BOD5Effluent (mg/L)
(% Removal)
TSS
(mg/L)
pH
(s.u.) 12/1 0.50 7.3 12/2 0.32 7.7 12/3 0.33 120 19 84.2% 34 7.4 12/4 0.33 7.6 12/5 0.43 6.8 12/6 0.34 7.2 12/7 0.25 7.4 12/8 0.58 7.6 12/9 0.47 143 6 95.8% 3 7.4
12/10 0.42 7.0 12/11 0.37 6.6 12/12 0.46 6.8 12/13 0.32 7.0 12/14 0.27 7.0 12/15 0.62 7.4 12/16 0.61 7.5 12/17 0.61 6.9 12/18 0.60 126 11 91.3% 15 7.3 12/19 0.46 6.8 12/20 0.36 7.2 12/21 0.40 7.4 12/22 0.52 117 7 94.0% 6 6.8 12/23 0.40 129 10 92.2% 7.2 12/24 0.38 6.9 12/25 0.45 7.0 12/26 0.42 7.1 12/27 0.39 7.2 12/28 0.42 7.0 12/29 0.64 6.8 12/30 0.45 7.2 12/31 0.51 7.4 Totals 13.63 635 53 N/A 58 N/A
Mo. Avg.
0.44
127
10.6
91.7%
14.5
N/A
12/07 37

12/07 38
Table 2 Monthly Monitoring Data (sample results)
Date
Flow (mgd)
BOD5Influent
Concentration (mg/L)
BOD5Effluent
Concentration (mg/L)
BOD5 Effluent Weekly Avg.
Loading (kg/d)
BOD5 Effluent
Percent (%) Removal
5/1 10.0 - 5/2 11.0 125 25 - 80.0% 5/3 10.5 - 5/4 10.8 200 28 - 86.0% 5/5 11.2 - 5/6 10.1 - 5/7 12.0 250 19 24 92.4% 5/8 10.8 24 5/9 11.2 300 15 20.7 95.0% 5/10 10.3 20.7 5/11 9.9 150 40 24.7 73.3% 5/12 10.1 24.7 5/13 10.2 220 32 25.5 85.5% 5/14 10.5 26.5 5/15 10.8 305 29 29 90.5% 5/16 10.4 29 5/17 11.0 175 27 32 84.6% 5/18 10.1 29.3 5/19 10.6 29.3 5/20 10.7 190 21 25.7 88.9% 5/21 11.0 25.7 5/22 11.1 24 5/23 11.2 230 20 22.7 91.3% 5/24 11.2 20.5 5/25 11.3 400 29 23.3 92.8% 5/26 10.9 23.3 5/27 10.8 160 33 27.3 79.4% 5/28 10.2 27.3 5/29 10.5 27.3 5/30 10.6 215 10 24 95.5% 5/31 11.2 24
Totals 332.2 2920 328 634.5 N/A Mo. Avg.
10.7 224.6 N/A 25.38 88.8%
Tenths Units Limit
10.7
224.6 25.2 N/A 88.8%
Whole Units Limit
11 225 25 N/A 89%

12/07 39
Table 3 Monthly Monitoring Data (sample results)
Date
Flow (mgd)
BOD5
Effluent Concentration
(mg/L)
BOD5Effluent
Weekly Avg. Concentration
(mg/L)
BOD5
Effluent Loading (kg/d)
BOD5 Effluent
Weekly Avg. Loading (kg/d)
12/1 0.50 - - 12/2 0.32 - - 12/3 0.33 19 - 23.7 - 12/4 0.33 - - 12/5 0.43 - - 12/6 0.34 - - 12/7 0.25 19 23.7 12/8 0.58 19 23.7 12/9 0.47 6 12.5 10.7 17.2 12/10 0.42 6 10.7 12/11 0.37 6 10.7 12/12 0.46 6 10.7 12/13 0.32 6 10.7 12/14 0.27 6 10.7 12/15 0.62 6 10.7 12/16 0.61 - - 12/17 0.61 - - 12/18 0.60 11 11 25.0 25.0 12/19 0.46 11 25.0 12/20 0.36 11 25.0 12/21 0.40 11 25.0 12/22 0.52 7 9 13.8 19.4 12/23 0.40 10 9.3 15.1 18.0 12/24 0.38 9.3 18.0 12/25 0.45 8.5 14.4 12/26 0.42 8.5 14.4 12/27 0.39 8.5 14.4 12/28 0.42 8.5 14.4 12/29 0.64 10 15.1 12/30 0.45 - - 12/31 0.51 - -
Totals 13.63 53 N/A 88.3 N/A Mo. Avg. 0.44 10.6 N/A 17.7 N/A

12/07 40
The monitoring data in Table 1 could be for a facility whose NJPDES permit requires monitoring for certain parameters on a weekly, twice / month, or monthly basis with a monthly reporting frequency. Please follow sections 1.1-1.4 below for appropriate calculation examples. The monitoring data in Table 2 could be for a facility whose NJPDES permit requires more often than weekly (e.g., twice / week, three / week) or daily monitoring with a monthly reporting requirement. Please follow sections 2.1-2.4 for appropriate calculation examples. In accordance with N.J.A.C. 7:14A-6.8(f), “average” is the arithmetic mean (geometric mean for bacterial parameters) of all sample measurements for each parameter obtained during the monitoring period unless otherwise specified by the permit (e.g., Four Day Averages and Weekly Average Calculations). Analytical results should not be rounded off prior to any calculations. Calculated results should be rounded off only as a final step before reporting data on the MRF. To avoid a burdensome number of decimal digits as a result of interim calculations (e.g., daily loading values used to compute a monthly average value), results of these calculations may be rounded off to one place to the right of the sensitivity of the loading permit limit one place to the right of the limit or one place to the right of the limit or quantification level, whichever is more sensitive, as specified in the permit. Limits in whole and tenths units have been established for the following examples to illustrate the rounding off procedures found in Chapter 8. Section B. Please note that in the Quantity or Loadings section, the results from interim calculations have been rounded off to the tenths place.
B. Quality or Concentration (mg/L) 1. Daily Maximum (mg/L) Considering effluent BOD5 for Table 1, the daily maximum value to be reported is 19
mg/L. 2. Monthly Average (mg/L)
Considering BOD5 Effluent for Table 1, there are five effluent data points for December. To calculate the monthly average concentration value, add each BOD5 effluent concentration value for the month and divide the total by the number of samples taken. Therefore, the calculated result to be reported on the MRF is:
(19 + 6 + 11 + 7 +10) ÷ 5 = 10.6 mg/L
If the monthly average limitation of 30 mg/L, the calculated value to be reported is 11 mg/L (e.g., 10.6 mg/L rounded off to 11 mg/L).
Please note that in this example it would be incorrect to divide by 31, which is the
number of days in the month. When calculating a monthly average, the divisor is equal
12/07 41
to the number of daily discharges measured during the month (see page 11 for the definition of daily discharge).
Also note that if the permit limit was written 30.0, the reported monthly average would
be 10.6, using the same number of decimal places. 3. Weekly Average (mg/L) The weekly average concentration value is calculated by adding up all the measured
concentration values during any seven consecutive days in a month (e.g., day 1 through day 7, day 2 through day 8, day 3 though day 9, etc.) and dividing by the total number of values measured during that period. The maximum calculated value is to be reported on the MRF. Please refer to the “BOD5 Weekly Avg. (mg/L)” column in Table 3, which illustrates the calculated rolling seven-day average values for BOD5 for an entire month.
For example, the calculation for the time period of 12/3 through 12/9 with a weekly
average limit of 40.0 mg/L is as follows: (19 + 6) ÷ 2 = 12.5 mg/L Please Note that the calculation for the time period of 12/3 through 12/9 with a weekly
average limit of 40 mg/L would be rounded off to 12 mg/L. Using Table 3 data, the maximum BOD5 weekly average concentration of 19 mg/L
occurred on 12/7 and on 12/8 representing the periods 12/1 through 12/7 and 12/2 through 12/8 respectively. This should be reported on the MRF.
Number of Excursions Example for the Weekly Average
The first weekly average in Table 3 starting 12/7 is 19 mg/L (representing the average of
all data taken days 12/1 through 12/7), the second weekly average calculated 12/8 is also 19 mg/L (representing the average of all data taken days 12/2 through 12/8, the third weekly average calculated 12/9 is 12.5 mg/L (representing the average of all data taken days12/3 through 12/9), the fourth weekly average calculated on 12/10 is 6 mg/L and so on.
If the permitted BOD5 weekly average discharge limitation is 11.0 mg/L, then the number
of concentration excursions in Table 3 would be two (2) for the weekly average calculated values of 19 mg/L and 12.5 mg/L, as mentioned above.
Please note that the second calculated weekly average value should not be considered an
excursion, as this value was obtained from the same BOD5 effluent result from the sample taken 12/3. A weekly average calculation cannot be performed during days 12/1 through 12/6 because there are not seven days in the particular monitoring period yet.
4. Daily Maximum (mg/L)

12/07 42
Considering Table 2, the daily maximum BOD5 effluent value is 40 mg/L, which should be reported on the MRF.
5. Monthly Average (mg/L) Considering Table 2, there are thirteen BOD5 effluent data points for the month. To
calculate the thirty day average concentration value, add each BOD5 effluent concentration value for the month and divide the total by the number of samples taken. Therefore, the calculated results to be on the MRF, with a monthly average limitation of 30.0 mg/L, is
328 ÷ 13 = 25.2307 mg/L rounded off to 25.2 mg/L The calculated result to be reported on the MRF with a monthly average limitation of 30
mg/L is 25 mg/L (25.2307 mg/L rounded off to 25 mg/L). As stated in Section B.2., the divisor would be the number of daily discharges measured
during the month and not the number of days in the month. 6. Weekly Average (mg/L) Considering BOD5 effluent for Table 2, the weekly average calculations should be
performed using the same procedure and limitations that are explained in Example B.3. above. A review of BOD5 effluent data in Table 2 shows the maximum weekly average value occurs in the seven day period ending 5/17 and is equal to 32 mg/L. This calculated value should be reported on the MRF.
7. Footnote Condition If your permit requires compliance with a footnoted discharge limitation which specifies,
for example, that the limitation is a maximum in any sample or maximum at any time, the maximum value for the month should be reported on the MRF. The data in Table 2 shows the maximum value for BOD5 occurred on 5/11, and the result is 40 mg/L.
C. Quantity or Loadings
Individual loading values are calculated by multiplying each individual concentration value (mg/L) by its corresponding daily average flow (MGD) for the day the concentration data was obtained, with the conversion factor of 3.785 [(L)(kg)/(106 mg)(gal)], to obtain a loading value in kilograms per day (kg/day). Load (kg/day) = BOD5 Eff. (mg/L) x Flow (106 gal/day) x 3.785 [(L)(kg)/(106 mg)(gal)] To obtain a loading value in pounds per day (lbs/day) each individual concentration value should be multiplied by its corresponding flow with the conversion factor of 8.344 [(L)(kg)(lbs)/(106mg)(gal)(kg)].
12/07 43
Load (lbs/day) = BOD5 Eff. (mg/L) x Flow (106gal/day) x 8.344 [(L)(kg)(lbs)/(106mg)(gal)(kg)] Please note that individual loadings should be calculated for each measured daily discharge before monthly and/or weekly average loading values can be calculated and reported.
1. Daily Maximum (kg/day) Using the sample results in Table 1 for BOD5 effluent, each individual loading value is in
Table 3 under the column “BOD5 Eff. kg/day”. The daily calculated maximum loading value occurred on 12/18 which is as follows:
Daily Maximum Loading = 11 x 0.60 x 3.785 = 24.981 kg/day. This value should be reported as 25.0 kg/day on the MRF with a limitation of 40.0
kg/day. This value should be reported as 25 kg/day on the MRF with a limitation of 40 kg/day. 2. Monthly Average (kg/day) Using the BOD5 interim calculated daily loading values which have been rounded off to
the tenths place in Table 3, the monthly average loading value to be reported on the MRF is calculated as follows:
Monthly Avg. = (23.7 + 10.7 + 25.0 + 13.8 +15.1) ÷ 5 = 17.6608 kg/day. The calculated monthly average loading value should be reported as 17.7 kg/day with a
limitation of 30.0 kg/day (17.6608 kg/day rounded off to 17.7 kg/day). The calculated monthly average loading value should be reported as 18 kg/day with a
limitation of 30 kg/day (17.6608 kg/day rounded off to 18 kg/day). 3. Weekly Average (kg/day) Please refer to the “BOD5 Eff. Weekly Avg. (kg/day)” column in Table 3 for the
calculated values (the procedure is explained under the “Quality or Concentration” section). The maximum weekly average loading value is 25.0 kg/day (24.981 kg/day rounded off as an interim calculation). Please note that the maximum weekly average loading value occurred during a different time period than the maximum weekly average concentration value. This illustrates why it is necessary to calculate each individual loading value first. Also, note that if the permit had a separate weekly average loading limit of 20 kg/d, the 25 kg/d value would also have counted as an excursion (in addition to concentration excursions noted above).
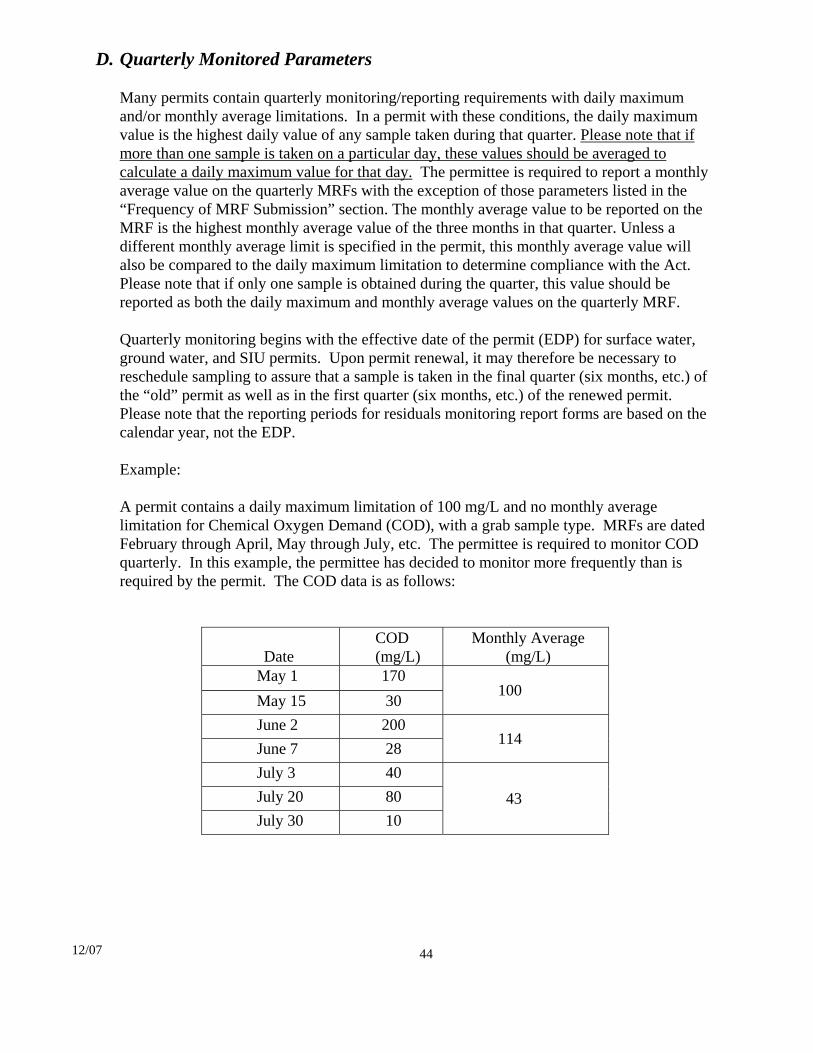
D. Quarterly Monitored Parameters
Many permits contain quarterly monitoring/reporting requirements with daily maximum and/or monthly average limitations. In a permit with these conditions, the daily maximum value is the highest daily value of any sample taken during that quarter. Please note that if more than one sample is taken on a particular day, these values should be averaged to calculate a daily maximum value for that day. The permittee is required to report a monthly average value on the quarterly MRFs with the exception of those parameters listed in the “Frequency of MRF Submission” section. The monthly average value to be reported on the MRF is the highest monthly average value of the three months in that quarter. Unless a different monthly average limit is specified in the permit, this monthly average value will also be compared to the daily maximum limitation to determine compliance with the Act. Please note that if only one sample is obtained during the quarter, this value should be reported as both the daily maximum and monthly average values on the quarterly MRF. Quarterly monitoring begins with the effective date of the permit (EDP) for surface water, ground water, and SIU permits. Upon permit renewal, it may therefore be necessary to reschedule sampling to assure that a sample is taken in the final quarter (six months, etc.) of the “old” permit as well as in the first quarter (six months, etc.) of the renewed permit. Please note that the reporting periods for residuals monitoring report forms are based on the calendar year, not the EDP. Example:
A permit contains a daily maximum limitation of 100 mg/L and no monthly average
limitation for Chemical Oxygen Demand (COD), with a grab sample type. MRFs are dated February through April, May through July, etc. The permittee is required to monitor COD quarterly. In this example, the permittee has decided to monitor more frequently than is required by the permit. The COD data is as follows:
Date COD (mg/L)
Monthly Average (mg/L)
May 1 170 May 15 30
100
June 2 200 June 7 28 114
July 3 40 July 20 80 July 30 10
43
12/07 44

12/07 45
The following should be reported on the quarterly MRF:
Daily Maximum 200 mg/L Monthly Average 114 mg/L Frequency of Analysis 7/Quarter*
No. Ex. 2 (2-max) Sample Type Grab
*Increase in sampling
E. Four Day Average (SIU Permits)
The Four Day Average is the average value of four (4) consecutive daily samples of a parameter during the time ending in the reporting period. Pursuant to 40 CFR Part 413, compliance is based on four (4) discrete sampling events. Therefore, a rolling average cannot be used. The permittee subject to 40 CFR Part 413 must compute a four day average whenever four consecutive daily samples which have not previously been used to calculate a four day average become available, regardless of the monitoring period in which the samples were taken. Example #1: A permit contains a four day average discharge limit of 800 mg/L and a daily maximum of 1000 mg/L for a specific parameter. In the absence of a monthly average limit, a monthly average value is still required to be reported. This reported value will be compared to the daily maximum limit to determine compliance. The permittee is required to monitor this parameter once per month and occasionally samples more than once per month. The permittee is required to submit monthly MRFs. Assume that the permittee has no previous monitoring data and that the following table includes all samples for January through June. The proper reporting response is also indicated in the table for convenience. Discrete excursions are shown in boldface.

Sample Results Permittee’s Response Report
Sample
Date
Daily Sample Concentration
(mg/L)
Calculate a 4-day
Average? 4-day Avg.
Monthly Avg.
Daily Max.
No. Ex.
1 Jan. 2 1267 No 1267 22
2 Jan. 15 1070 No Code = E1 1168
3 Feb. 3 690 No Code = E1 690 690 0 4 March 2 1345 Yes (= 1093) 1345 44
5 March 3 922 No 6 March 4 1039 No 7 March 8 420 No 8 March 12 750 Yes (= 782) 9 March 20 1039 No
1093 919
10 April 3 307 No Code = E 3 307 307 0 11 May 3 505 No Code = E 3 505 505 0 12 June 3 980 Yes(=707) 707 842 980 0 13 June 5 705 No
1 The four day average can not be calculated because fewer than four sample results are available. Code = E should be entered as specified in the “Reporting Invalid Test Results and Submitting Corrected MRFs” section. 2 The excursions for January of the daily max occurred on January 2 and January 15. 3 The Four Day Average can not be calculated because a total of four additional samples have yet to be taken since calculating the previous Four Day Average. 4 The excursions for March of the daily maximum limitation occurred on March 2, March 4, and March 20 as well as the Four Day Average limitation based on the March 2 sampling. The first Four Day Average = Average value of first four samples (1267 + 1070 + 690 + 1345) ÷ 4 = 1093 mg/L Note that the June 5 sample is used in determining the June monthly average and daily maximum, but is not included in the Four Day average reportable in June. The next Four Day Average will be reportable for the month when the third subsequent sample is taken. Also note that two distinct Four Day Average calculations were necessary in March: the higher Four Day Average in entered on the MRF.
12/07 46

A rolling average (e.g., the average of the values of the sample numbers 2, 3, 4, and 5) cannot be reported as a Four Day Average. NOTE: There are a minimum of three Four Day averages per year with a monthly monitoring frequency. Example #2: A much smaller permittee with the same permit limits as above and no previous samples is required to sample only semiannually for the particular pollutant and, sampling no more than once during any one month, obtains only these results:
Sample Results* Permittee’s Response Report
Sample
Date
Daily Sample Concentration
(mg/L)
Calculate a 4-day
Average? 4-day Avg. Monthly
Avg. Daily Max.
1 Jan. 2005 750 No Code = N 750 750 2 July 2005 620 No Code = N 620 620 3 Jan. 2006 1010 No Code = N 1010 1010 4 Feb. 2006 775 Yes (= 789) 789 775 775 5 July 2006 740 No Code = N 740 740 6 Jan. 2007 650 No Code = N 650 650
* The table does not show months in which sampling for the particular pollutant in question was not conducted. It should be noted that no 4-day average is reportable for over a year, but that it must be reported as soon as four samples become available. Also note that the SIU permittee exceeded the daily maximum limitation in January, 2006, and was therefore required to resample within 30 days of learning of the violation. The example assumes that the January 2006 sample was taken early enough in the month to have the permittee know of the violation in late January, and re-sampling was therefore scheduled for February. Under the Clean Water Enforcement Act, the February, 2006 sample must be reported on the February, 2006 DMR, even though sampling for the parameter would not have been required if the permittee had not violated the limit in January, 2006.
12/07 47

12/07 48
Chapter 7 Reporting Specific Parameters A. BOD5, CBOD5 and TSS % Removal
Monthly Average Minimum Percent Removal The monthly average minimum percent removal is the average percent removal over a calendar month which is calculated using the Table 2 data as follows: Avg. BOD5% = (sum of BOD5 Inf.) – (sum of BOD5 Eff.) x 100 (sum of BOD5 Inf.) Avg. BOD5% = (2920 – 328) ÷ 2920 x 100 = 88.7671% An alternate monthly average percent removal equation also accepted by NJDEP is as follows: (Monthly Avg. BOD5 Inf. Conc.) – (Monthly Avg. BOD5 Eff. Conc.) x 100 Monthly Avg. BOD5 Inf. Conc.
Avg. BOD5% = (224.6153 – 25.2307) ÷ 224.6153 x 100 = 88.7671% To report the monthly average minimum percent removal, with a permit limit of 85.0%, the result would be 88.8%. To report the monthly average minimum percent removal, with a permit limit of 85%, the result would be 89%. If any effluent values are ND (non-detectable) the permittee should calculate the percent removal using the actual numerical values, and report the percent removal as a greater than value. Note: For specific information on MTBE (Methyl Tert-butyl Ether) Percent Removal, refer to Section I of this chapter.
B. Chlorine Produced Oxidants (CPO) and Total Residual Chlorine (TRC) Both TRC and CPO should be measured by TRC methods. The term CPO is a more
appropriate name for the compounds which the TRC analytical method measures. The TRC test measures not only residual chlorine, but the sum of free and combined chlorine and bromine as well.
C. Dissolved Oxygen (DO)

12/07 49
Dissolved Oxygen is regulated with a minimum limitation. All values above the minimum
limitation are not excursions; however, all values below the minimum limitation are excursions of the permitted limit. Report the appropriate minimum concentration value(s) where it’s specified in the MRF.
D. E. Coli
Since E. Coli criteria have been adopted for fresh waters in the October 2006 Surface Water Quality Standards, N.J.A.C. 7:9B-1.14(d)1(ii)2, a monitoring requirement for E. Coli will be included in permits for dischargers to fresh waters. Consistent with N.J.A.C. 7:9B-1.5(c)7, the Department will require the permittees to collect a minimum of five (5) samples in any chosen month within the monitoring period specified in your permit and report the calculated geometric mean of the sample data collected during the month. Each month that E. Coli is sampled, the permittee shall perform at least one complete set of split sample analysis of E. Coli and Fecal Coliform.
For the months of the monitoring period specified in your permit that e. Coli sampling is not
conducted CODE =N should be reported on the DMR.
The calculations and reporting of E. Coli methodologies remain the same as the fecal coliform analysis calculations.
E. Enterococci As per the October 2006 Surface Water Quality Standards, N.J.A.C. 7:9B-1.14(d)1(ii)1, a
monitoring requirement for Enterococci will be included in the permits for discharges to SE1 and SC waters. Consistent with N.J.A.C. 7:9B-1.5(c)7, the Department will require the permittees to collect a minimum of five (5) samples in any chosen month within the monitoring period specified in your permit and report the calculated geometric mean of the sample data collected during the month. Each month that Enterococci is sampled, the permittee shall perform at least one complete set of split sample analysis of Enterococci and Fecal Coliform.
For the months of the monitoring period specified in your permit that Enterococci sampling
is not conducted, CODE =N should be reported on the DMR. The calculations and reporting of enterococci methodologies remain the same as the fecal
coliform analysis calculations. F. Fecal Coliform NJPDES Surface Water and Groundwater permits requiring Fecal Coliform averages shall be
calculated as Geometric Mean (GM). The permittee must report the monthly geometric mean, the maximum weekly geometric mean and/or the single highest test result as required

12/07 50
by the NJPDES permit limitations. If the average weekly discharge limitation is footnoted with the condition “Shall not be exceeded by more than 10% of the total samples taken during any thirty day period,” and if more than 10% of your daily samples exceed this permit condition, then report the number of excursions in the appropriate space of the MRF.
Membrane Filtration (MF) and Multiple Tube Fermentation Technique (reported as MPN)
are the two methods accepted by NJDEP for Fecal Coliform (FC) analysis of wastewater. The reporting of the results from these procedures is detailed below.
1. Membrane Filtration Technique (MF) A maximum value of Too Numerous to Count (TNTC) will not be accepted by NJDEP as
a reportable value. A quantified value is required so a geometric mean can be calculated. TNTC is to be “quantified” and reported as follows:
If the “maximum” reportable plate value is greater than 60 colonies (>60 col), then the value of “60 col” should be used. The permittee will have to ascertain the minimum dilution used by the certified laboratory for the MF Fecal Coliform analysis. The TNTC quantified calculation is:
60 col ÷ the lowest dilution (ml) x 100 = TNTC quantified calculation 60 col ÷ 0.01 (ml) x 100 = 6000 ÷ 0.01 = 600,000 col/100 ml
Note: • Other TNTC values may be greater if lower dilutions are used. • The minimum values of 0 col/100ml and non-detectable (ND) will not be accepted by
NJDEP as reportable values. • The minimum reportable plate value using the MF method is <1 colony. If you have a
result of <1 col/100 ml, the value of 1 col/100 ml should be used in the geometric mean calculation.
• If and when applicable, the maximum and/or minimum “quantified” place values are to be used in the geometric mean calculation. Should the laboratory report TNTC and/or 0 col/100 ml, it will be the permittees’ responsibility to “quantify” and correctly report the results on the MRFs.
• An MF confluent growth event cannot be “quantified”. Resampling must be performed and the confluent growth must be reported as a comment on the MRFS as confluent growth with or without coliforms. NJDEP suggests using dilutions low enough so that a confluent growth situation does not occur. Notify the Enforcement Bureau upon the occurrence of such an event.
The geometric mean calculation is the addition of the respective sample logarithms divided by the total number of samples taken (n) during the period. Take the antilog of the result to determine the geometric mean.

An alternative geometric mean calculation is the multiplication of the fecal coliform data (identified by Y), obtain a total result and take the nth root of the total result. (n) is the number of samples taken.
n YnYYY )])......(3)(2)(1[( or [(Y1)(Y2)(Y3)….(Yn)] 1/n
Example: FC results from Table 2 using the MF Method
Date
Results col/100 ml
Logarithm*
5/4 <1 0.0000 5/9 <1 0.0000 5/11 600 2.7781 5/13 >600,000** 5.7781 5/17 10 1.0000 5/20 15 1.1760 5/25 700 2.8450 5/27 3 0.4771
Sum of Logs 14.0543
*These calculated values have been truncated to four decimal places. ** Maximum “Quantified” value at 0.001 dilution reported as TNTC is >600,000 col/100 ml (MF).
Logarithmic Method: Sum of Logsn = 14.0543 = 1.7567 n 8 Monthly Geometric mean = Antilog (1.75670) = 57.108 = 57 col/100 ml (MF) Nth Root Method:
=)3)(700)(15)(10)(000,600)(600)(1)(1(8
=10134.18
x Monthly Geometric Mean = [1.134 x 10¹⁴] 1/8 = 57.108 = 57 col/100 ml (MF) The maximum weekly average calculation to be reported is as follows:
12/07 51

Date
Results col/100 ml
Logarithms*
5/11 600 2.7781 5/13 >600,000 5.7781 5/17 10 1.0000
Sum of Logs 9.5562
Sum of Logsn = 9.5562 = 3.1854 n 3
Weekly (GM) = Antilog (3.1854) = 1533 col/100 ml (MF) or
(MF) ml 100 / col 1533 )106.3()10)(000,6000)(600( (GM)Weekly 1/393 === x 2. Multiple Tube Fermentation (MPN) Most Probable Number (MPN) values usually reported by the laboratory as >1600
col/100 ml, >24,000 col/100 ml etc. are to be used as 1600 col/100 ml, 24,000 col/100 ml etc. in the calculation of the geometric mean. If the value is the maximum number, it shall be reported as >1600 col/100 ml, >24,000 col/100 ml or the applicable reported greater than number.
The minimum reported MPN value from the data below is <2col/100 ml. It should be
noted that the minimum detection level for this fecal coliform methodology is <2col/100 ml. The value of 2 col/100 ml will be used in the geometric mean calculation.
Example: FC Coliform Results (MPN)
Date
Results col/100 ml
Logarithms*
5/4 <2 0.3010 5/9 <2 0.3010 5/11 600 2.7781 5/13 >24,000 4.3802 5/17 10 1.0000 5/20 15 1.1760 5/25 700 2.8450 5/27 3 0.4771
Sum of Logs 13.2584
* These calculated values have been truncated to four decimal places.
12/07 52

Sum of Logsn = 13.2584 = 1.6573 n 8 Monthly (GM) = Antilog (1.6573) = 45 col/100 ml (MPN) or
Monthly (GM) = (1.8144 X 10 13)1/8 = 45 col/100ml (MPN) Maximum Value = >24,000 col/100 ml (MPN) The maximum seven day geometric mean calculation to be reported is as follows:
FC(MPN
Date
Results col/100 ml
Logarithm*
5/11 600 2.7781
5/13 >24,000 4.3802
5/17 10 1.0000 Sum of Logs 8.1583
Sum of Logsn = 8.1583 = 2.7194 n 3 Weekly (GM) = Antilog (2.7194) = 524 col/100 ml (MF) or
(MPN) ml col/100 524 )1044.1( (GM)Weekly 83
== x While the use of units of volume is practical for the examination of fecal coliform in wastewater (e.g., colonies per 100 millimeters), it is not practical for the examination of fecal coliform in sludge. Many microorganisms in sludge are associated with the solid phase. When sludge is diluted, thickened, or filtered, the number of microorganisms per unit volume changes markedly, whereas the number per unit mass of solids remains almost constant. Therefore, fecal coliform densities in sludge are expressed as the number present per unit mass of solids (MPN per gram total solids). For NJPDES Residuals Land Application permits, fecal coliform sampling procedures, reporting methods, and limits will be dependent on the level of pathogen reduction required, and will be specified in the permit.
G. Flow (MGD, GPD)
1. Daily Maximum 12/07 53

12/07 54
The daily maximum flow is the highest daily flow which occurred during the reporting
period. Considering Table 1, the daily maximum flow occurred on 12/29 and is 0.64 MGD, which should be reported on the MRF.
Note: Daily flows should be used for calculating corresponding daily loads. 2. Monthly Average The monthly average flow is the summation of each daily flow measurement obtained
during the monitoring period, divided by the number of days a sample was taken in that reporting period. Considering Table 1, the calculated monthly average flow is 0.44 MGD.
H. Lower Explosive Limit and Flash Point (SIU Permits) The lower explosive limit (LEL) of a compound is the minimum concentration of that
compound, as a gas or vapor in air at a given temperature, which will explode or burn in the presence of an ignition source. As part of their monitoring program for detecting flammable/explosive discharges, many SIU permits require permittees to conduct routine explosive meter screening of the LEL levels (e.g., measured vapor levels of a pollutant expressed as a percentage of the pollutant’s LEL) at key sewer locations. A monthly average is not required to be reported.
The Flash Point is the lowest temperature at which a flame will propagate through the vapor
from a material. Pursuant to 40 CFR 403.5, discharges into sanitary sewers must have a Flash Point no less than 60o C. A minimum permit limitation of 60o C would typically be imposed in a permit if NJDEP believed there was a reasonable potential for the permittee to discharge wastewater with material capable of giving off a flammable gas. That is, it must be possible in a laboratory to heat a sample of the wastewater to a temperature of at least 60o
C without producing a flammable vapor. A typical reported result might be > 85o C, indicating that the lab sample was heated to 85o C without producing a flammable vapor. Some permits may have stricter limits, such as 45o C. A monthly average is not required to be reported.
I. Methyl Tert-butyl Ether (MTBE) Percent Removal
For a B4B authorization which contains a MTBE percent removal limit AND a monthly average effluent limit of 70 ug/L - Dilute Influent Condition, please note that although both limits may be included, only one limit will apply during a calendar month. Reporting and compliance with these limits shall be as follows:
If the effluent MTBE level is less than or equal to 70 ug/L during a calendar month, the 85% MTBE minimum percent removal limitation does not apply while the effluent limit of 70 ug/L does apply. If the MTBE minimum percent removal limitation does not apply, the

12/07 55
permittee shall report “Code = N” on its monitoring report form under MTBE percent removal. The permittee shall also report its influent and effluent MTBE values. If the daily maximum effluent MTBE level is greater than 70 ug/L for a calendar month, an 85% MTBE minimum percent removal limitation does apply. The permittee shall report the minimum percent removal value achieved during that calendar month on its monitoring report form under MTBE minimum percent removal and shall also report its influent and effluent MTBE values. If the MTBE minimum percent removal limitation does apply, the permittee is not required to comply with MTBE effluent limits as a monthly average nor as a daily maximum for that calendar month.
J. Organic Toxic Pollutants (GC/MS) Surface water and ground water permits may contain a Monitoring Only requirement for Gas
Chromatography/Mass Spectrometry (GC /MS) fractions, including Acid Compounds, Base/Neutral Compounds, Volatiles, and Pesticides. To report this analytical data, the permittee should enter “Code = E” in the sample measurement block on the MRF and attach the laboratory sheets to the MRF. The permittee should also indicate on the submittal sheet that the laboratory sheets are attached.
Please note that this is a different requirement than Total Pesticides, Total Volatile Organics,
Total Acid Compounds, Total Base/Neutral Compounds, and/or Total Metals, which all necessitate a reportable value. Refer to the “NJPDES Permit Reporting for Non-Detectable and Unquantified Values” section.
K. Petroleum Hydrocarbons (PHC) and Petroleum Based Oil and Grease (O/G) Permittees with discharges resulting from precipitation events should monitor for PHC and
O/G in the following way:
1. If the permittee requires multiple grab samples taken in 15 minute intervals after the onset of the discharge, the permittee shall analyze each sample individually and report a maximum value for the samples. If the permittee is required to report a monthly average, the three individual sampling results should be arithmetically averaged to calculate a monthly average.
Example:
O/G Sample Interval Result (mg/L)
15 min 10.0 30 min 17.0 45 min 10.0 Total 37.0

12/07 56
Monthly Avg. = (10.0 + 17.0 + 10.0) = 37.0 ÷ 3 = 12.3 mg/L Maximum = 17.0 mg/L
2. If there is a discharge which does not last longer than 45 minutes during the month, then the permittee should still report the analytical results. For example, if it only rains once during the month and the duration of the discharge is 35 minutes, the permittee should obtain samples at 15 and 30 minutes. Enter the frequency of analysis as specified in the permit with an asterisk and report the decreased sampling frequency explanation as comments. The maximum value is the greater of the two values and the average value is the arithmetic mean of the two values.
If a permittee chooses to analyze PHC or O/G more frequently than is required by the
permit (e.g., more than once per month), the permittee is still required to take samples using the criteria specified above. The permittee should then report the maximum and monthly average of all individual samples taken during that monitoring period. Enter the actual frequency of analysis on the MRF.
3. Please note that a permittee should enter “Code = N” for the PHC or O/G parameter if no
discharge at any time during the monitoring period meets the criteria specified in 1. above (e.g., it rains every other day at night). This situation should also be explained as a comment and attached to the MRFS.
It should be noted that the sampling protocol specified in N.J.A.C. 7:18-9.4 deviates from
the procedures in the latest approved edition of the Standard Methods for the Analysis of Water and Wastewater. The sampling protocol specified in the NJPDES regulations is more stringent, and therefore the NJPDES regulations shall be utilized.
L. pH (Standard Units, S.U.)
For wastewater and stormwater analyses, pH values can not be averaged using an arithmetic mean, therefore, the permittee should only report the minimum and maximum of the analytical values obtained during the reporting period as specified in the permit. A review of sample monitoring data in Chapter 6, Table 1 indicates that the maximum pH is 7.7 S.U. and the minimum is 6.6 S.U.
For sludge analyses, pH should be measured in a slurry at 25 degrees Celsius or at another temperature and then converted to an equivalent value at 25 degrees Celsius. Samples may be taken and heated or cooled to 25 degrees Celsius or results can be adjusted based on the ambient temperature where pH is measured and the following calculation:
Correction Factor = (0.03 pH units) x (Temperature Measured – 25 degrees Celsius) 1.0 degree Celsius
Actual pH = Measured pH +/- the Correction Factor

12/07 57
Allowance for the pH of precipitation: pH values that are measured below the pH range are not in violation if they are not lower than the measured pH of the precipitation collected on site during the storm event. To qualify for this exception, pH of that precipitation must be reported on the MRF as influent (rain) pH. To qualify for this allowance, an outfall must meet two criteria: 1. The stormwater must not be mixed with domestic wastewater, process wastewater,
cooling water, boiler blowdown, or other permitted discharges prior to the monitoring point.
2. The existing effluent limitations for pH make no allowance for the pH of precipitation.
M. Settleable Solids (SS) It is not acceptable to report “trace” as a sample measurement value on MRFs. For example,
if settleable solids data is below the lowest graduation on the Imhoff cone, report the data as less than this lowest value (e.g., <1 ml/L). For the purposes of computing a monthly average, use the lowest graduation of the Imhoff cone in the calculation for measured data (e.g., <1 ml/L would be 1 ml/L in the calculation).
N. Total Toxic Organic Substances (TTOs) Several Federal Categorical Standards (FCS) include limits on TTOs, which is defined as the
sum of all concentrations of a specific set of compounds (depending on the applicable FCS) which are detected and have individual concentrations of 0.01 mg/L or greater. For this purpose, results for individual pollutants which are below detection or are less than 0.01 mg/L are considered to be zero. Remaining pollutant concentrations are summed. A single number is obtained for each daily sample, and is treated as a single measurement result.
O. Whole Effluent Toxicity (Bioassays) Toxicity limits on individual pipes may be: An acute toxicity limitation of an LC50. This limit is defined as being the concentration of
toxicant which causes mortality in 50% of the test organisms. The LC50 limitation is a minimum percent effluent limitation. Therefore, in order to be in compliance with an LC50 limitation, the LC50 value reported for a particular acute toxicity test must be a value greater than or equal to the LC50 percent effluent limitation in the permit. A discharger whose permit contains an acute toxicity limitation of an LC50 or an acute toxicity monitor only requirement should report an LC50 value (% effluent) on the MRF. The LC50 value is reported as being between 1% and greater than 100% (>100%) effluent.

12/07 58
An acute toxicity limitation of NOAEC. This limit is defined as the lowest concentration at which the organisms are adversely affected as compared to the control determined using hypothesis testing technique. The NOAEC limitation is a minimum percent effluent limitation. Therefore, in order to be in compliance with a NOAEC limitation, the value reported for a particular acute toxicity test must be a value greater than 100%. The NOAEC value is reported as being between 1% and greater than 100% (>100%) effluent.
A chronic toxicity limitation of IC25. This limit is defined as the concentration of effluent
which has an inhibitory effect on 25% of the test organisms for the monitored effect, as compared to the control (expressed as % effluent). A discharger whose permit contains a chronic toxicity limitation of an IC25 or a chronic toxicity monitor only requirement should report the IC25 value (% effluent) on the MRF. The IC25 value is reported as being equal to or between 1% and greater than 100% (>100%) effluent.
Please note that on the MRF under the parameter code for whole effluent toxicity, one or
more test species should be listed which correspond to the test species required in the final permit. This species should be verified with the test species listed in the final permit.
If the MRF lists more than one test species for toxicity testing, and the permittee has received
a letter from NJDEP designating one species to be used for further testing, then the permittee should enter “Code = N” in the blocks of the MRF for the test species that is no longer applicable until NJDEP eliminates this species from the MRF.
Please Note: Toxicity test results cannot be averaged at any time.
P. 2,3,7,8 Tetrachlorodibenzo-p-dioxin (TCDD)
For influent or effluent requirements - It is acceptable to use the screening procedure for 2, 3, 7, 8-Tetrachlorodibenzo-p-dioxin (TCDD) using Method 625. Please note that method 625 is approved for TCDD screening only and is not to be used for quantitation. Should TCDD be detected using Method 625, then Method 613, or another approved test procedure, must be used to conclusively determine the pollutant's presence and concentration level. Report TCDD as follows:
1. If the monitoring results using Method 625 indicate that TCDD is not present in the sample, you should report 'CODE=E' for TCDD in the open SAMPLE MEASUREMENT block(s) on the MRF and place a check in the 'Comments Attached' box on the MRSF and attach the Comments.
2. If Method 625 indicates that TCDD may be present in the sample, you must use
Method 613, or other approved test procedures, for verification and quantification. If after using Method 613 it is determined that TCDD is not present in the sample, 'CODE=E' should be reported in the appropriate concentration SAMPLE MEASUREMENT block(s) on the MRF as per #1 above.

12/07 59
3. If it is verified using Method 613 that TCDD is present in the sample, but at levels below the Quantitation Level, the result shall be reported as 'less than' the detection level in the open concentration SAMPLE MEASUREMENT block(s) on the MRF and the resultant "loading" should be reported as '< the calculated loading value' in the open loading SAMPLE MEASUREMENT block(s).
4. Lastly, if TCDD is verified and quantified using Method 613, the appropriate
concentration and loading values should be reported in the appropriate SAMPLE MEASUREMENT block(s) on the MRF.
Residuals Requirements For a Residuals WCR please use Code=M if the parameter has not been removed from your permits monitoring requirements.

12/07 60
Chapter 8
Reporting Analytical Data A. Split Samples Permittees may perform split samples on the permitted discharge. In accordance with
N.J.A.C. 7:14A-6.8(e), all additional monitoring shall be included in the calculation and reporting of the data submitted on the MRF. Samples taken at the same time and analyzed by the same methodology may be averaged together and considered one sample unless otherwise specified by NJDEP.
Example:
Date
Time
Result (mg/L)
Daily Result (mg/L)
2/1 11:00 AM 10.0 2/1 11:00 AM 15.0 12.5
2/10 9.0 9.0 2/20 3.0 3.0 2/25 10:00 AM 17.0 2/25 10:00 AM 12.0 14.5
Monthly Avg.
9.75
Data from 2/1 Avg. = (10.0 + 15.0) ÷ 2 = 12.5 mg/L Data from 2/25 Avg. = (17.0 + 12.0) ÷ 2 = 14.5 mg/L Monthly Avg. for Nickel = (12.5 + 9.0 + 3.0 + 14.5) ÷ 4 = 9.75 mg/L
Samples taken at the same time that are analyzed by different methodologies may not be averaged together and are considered two separate samples.
Date
Data (col/100 ml)
Methodology
2/1 10 Membrane Filtration (MF) 2/1 102 Multi-tube (mpn) 2/10 10 MF 2/22 17 MF
Note: The data from 2/1 split sample cannot be averaged to obtain a value for that day due to
the different methodologies used.

Only the Membrane Filtration (MF) data in this example should be used to calculate a
monthly geometric mean value. However, if separate methodology split samples are analyzed, and the frequency of analysis
complies with the permit requirements, then the permittee should report the highest average obtained from either methodology.
The Daily Maximum value reported is the highest value of any certified methodology used
by the permittee. In this example, the highest daily maximum value is obtained from the multi-tube methodology.
)(100/12)17)(10)(10()( 3 MFmlcolforFCGMMonthly ==
Daily Maximum for FC = 102 col/100 ml (Multi-tube methodology) Note: The 2/1 sampling event should be explained as comments, due to the two different
methodologies. B. Rounding Off
Permittees should use the method described below to round off values to be reported on MRFs for any limited permit parameter with the exception of pH and flow. Each decimal place of the permit is labeled as follows:
Permit Limit = 1453.72 kg/day 1 Thousands decimal place 4 Hundreds decimal place 5 Tens decimal place 3 Units decimal place 7 Tenths decimal place 2 Hundredths decimal place
The permit limit will define the precision required for reporting results. For example, the
permit limit above ends in hundredths. • Round off results to the sensitivity of the permit limit. For example, the calculated result of
32.7564 kg/day would rounded be off to 32.76 kg/day when comparing the result to the permit limit above.
• Zeros in a permit limit are considered to have place value. For example, if the permit limit is
300 kg/day, results should be rounded off to the units place.
12/07 61
• Round off by dropping digits that are irrelevant. If the digits 6, 7, 8 or 9 are dropped, increase the preceding digit by one unit; if the digits 0, 1, 2, 3, or 4 are dropped, do not alter

12/07 62
the preceding digit. If the digit 5 is dropped, round off the preceding digit to the nearest even number; 2.25 becomes 2.2 and 2.35 becomes 2.4.
• Due to the burdensome number of decimal points obtained as a result of interim calculations
(e.g., daily loading values used to compute a monthly average), these results may be rounded off to one place to the right of the sensitivity of the loading limit prior to further calculations. In the absence of a loading limit, the results from interim calculations may be rounded off to one place to the right of the sensitivity of the MDL or another detection level established by NJDEP. Final rounding off should be performed after the last calculation is completed, prior to entering the data on the MRF.
• If a parameter has a “monitor only” requirement (with no limit), with the exception of a Total
GC/MS Fraction, Total Recoverable Metals/Total Metals or Organic Toxic Pollutants requirement described individually in this manual, the result should be rounded off to the least sensitive of the reported detection levels achieved by the laboratory or another detection level established by NJDEP.
• In the absence of a monthly average limitation, the sensitivity of the daily maximum or
maximum limitations should be used for rounding off the monthly average value. • pH analytical values should be rounded off to the tenths place (e.g., 6.78 S.U. should be
reported as 6.8 S.U.). • For sludge analyses, analytical values equal to or greater than 100 may be rounded off to the
units place (for example, 101.4 mg/kg lead may be rounded off to 101 mg/kg); however, analytical values less than 100 should be rounded off to the tenths decimal place (for example, 1.24 mg/kg mercury may be reported as 1.2 mg/kg).
C. Reporting Invalid Test Results and Submitting Corrected MRFs In a situation where sample laboratory analysis was not performed properly and the
laboratory provided the inaccurate sample results to the permittee with a statement that explained the inaccurate data, “CODE = E” should be entered in the applicable sample measurement block on the MRF. In addition, an explanation of the situation should be included as comments and reported to the appropriate Enforcement Bureau.
NOTE: • “Code = E” is being used to indicate all situations of improper laboratory analysis, invalid
measurement and/or test results. A statement should accompany such results from the laboratory and a copy must be sent to the appropriate enforcement bureau.
• “Code = E” entries should be explained in detail in an attached letter and reported to the
appropriate Enforcement Bureau. • It is not appropriate to enter “Code = E” if the permittee neglected to sample during a
particular monitoring period.
12/07 63
If a permittee suspects that sample collection, measurement, and/or laboratory analyses were
not performed properly, even though the laboratory provided the permittee with the sample results without a statement disqualifying the data, the permittee should enter the laboratory data on the MRF. The concerns regarding the data should be explained in an attached letter, and the appropriate Enforcement Bureau should be sent a copy of this letter, with a copy of the affected MRF.
As illustrated in the examples for “Four-Day Average (SIU Permits), “Code = E” may be
entered on the MRF for an SIU permit which requires a Four Day Average. However, it is only appropriate to enter “Code = E” if the minimum frequency of analysis specified in the permit is attained and the Four Day Average cannot be computed because four analytical results have not yet been obtained which have not previously been used to calculate a four day average.
As per N.J.A.C. 7:14A-6.8(h), if the permittee becomes aware of new information or data
that conflicts with previously reported data, the permittee shall submit a revised MRF for the reporting period in question. The revised MRF shall be submitted promptly and explained in attached comments. The “Corrected MRF” should be signed and submitted to the appropriate agencies normally receiving the original MRF and / or as specified in the permit, and to the appropriate Enforcement Bureau.

12/07 64
Chapter 9 NJPDES Permit Reporting for Detectable, Detected but Not Quantified, and Non-Detectable Values Terminology Laboratory analytical results fall within three categories regarding the presence of a particular pollutant. • Detected and quantified – the pollutant is present at or equal to a quantifiable level (e.g., if
the laboratory’s analytical detection level equals 10 ug/L, the pollutant is present at 10 ug/L or at some value greater than 10 ug/L).
• Detected but not quantified – the pollutant is detected, but at a level below the laboratory
analytical quantification level and therefore cannot be accurately quantified (e.g., if the laboratory’s analytical detection level is 10 ug/L, laboratories may report the pollutant at <10ug/L or as some estimated value between 1 and 10 ug/L).
• Non-detectable (ND) – the pollutant cannot be “seen” by the analytical methodology used. Please note that this section addresses three specific permit reporting scenarios, namely, Parameter Specific, Net Values, and total GC/MS Fractions. These sections are as follows: A. The “Parameter Specific” section should be followed for reporting analytical results for all
the same parameter. For example, considering detected and quantified, detected but not quantified, and non-detectable analytical results for a parameter, the permittee would follow the directions in this section to obtain a daily maximum and monthly average value to report on the MRF.
B. The “Net Values” section should be followed for reporting analytical results for a net value
permit parameter. C. The “Total GC/MS Fractions and Total Recoverable Metals/Total Metals” section should be
used for obtaining daily maximum and monthly average “total” values. Please note that a Total GC/MS fraction permit requirement is different than a “Monitor Only” Organic Toxic Pollutant permit requirement as described in Chapter 7, Section L.
Laboratories may specify that a pollutant is present at “BMDL” (Below Method Detection Level) which usually means that the pollutant is detected but not quantified.

Laboratories may also specify a pollutant to be at an Undetected (“U”) level which usually means that the pollutant is non-detectable. It is essential that the permittee categorize their laboratory data into one of the three terminology categories explained above, before calculating concentration and mass values for MRF reporting purposes. Please be aware that the terminology used by laboratories can vary considerably, so it is important to understand the laboratory’s terminology as it applies to the qualified wastewater data.
ND Values Reporting of ND is not permissible. If the laboratory reports that the pollutant is at the ND level, the permittee should report less than (<) the analytical detection level which the laboratory reported for that analysis. For example, if the laboratory data looks like this:
Parameter Result Analytical Detection Level Benzene ND <10 ug/L
By reporting “ND” the sensitivity of the laboratory’s analytical data is not tracked; therefore, NJDEP would not be able to determine how accurate the permittee’s data is. For example, Facility A’s sampling data for lead is “ND” with an analytical detection level of <5 ug/L, and Facility B’s sampling data for lead is “ND” with an analytical detection level of <50 ug/L. If reporting of “ND” was allowed, the MRFs for the two facilities would reflect equivalent effluent quality for lead when in fact the difference between the two analytical methods is a full order of magnitude. A. Parameter Specific – all the same parameter
1. Permit Reporting for Concentration Values
a) Reporting Maximum Values for Concentration
(1) If the analytical values are all detected and quantified, report the actual maximum value.
For example:
12/07 65
One Month of Lab Data (ug/L) 29 102 48 63 Report Maximum (ug/L) 102
(2) If the analytical values are all detected but not quantified or non-detectable, the
permittee should report less than (<) the least sensitive reported analytical detection level of the laboratory for that data set.

For example:
One Month of Lab Data (ug/L) <17 <12 <10 <10
Report Maximum (ug/L) <17
(3) If some analytical values are detected and quantified and some analytical values are detected but not quantified or non-detectable the permittee should report the largest quantified value as the maximum.
For example:
One Month of Lab Data (ug/L)
10 <15 20 <25 Report Maximum (ug/L) 20
b) Reporting Monthly and Weekly Average Values for Concentration All examples shown below are for monthly averages although the same procedure
applies for weekly averages.
(1) If the analytical values are all detected and quantified, average all values and report this number.
For example:
12/07 66
One Month of Lab Data (ug/L) 20 80 60 40
Report Monthly Avg. (ug/L) 50
(2) If the analytical values are detected but not quantified, or non-detectable, then the
levels achieved by the laboratory cannot be averaged and the least sensitive value should be reported as the average.
For example:
One Month of Lab Data (ug/L) <17 <12 <10 <10
Report Monthly Avg. (ug/L) <17
(3) If some values are detected and quantified, and some values are detected but not
quantified or non-detectable, for purposes of calculating the average, the permittee should do the following, dependent on whether the analysis is on wastewater or sludge.

Wastewater: substitute one half the analytical detection level for all values reported as less than the laboratory’s analytical detection level, and then report the calculated average.
For Example:
One Month of Lab Data (ug/L) 50 ND (<10) 35 <20 Report Monthly Average (ug/L) 25
Lab Data Numbers To Be Used to Calculate the Monthly Average
50 50 <10 5 5 (½ of 10) 35 35
<20 10 (½ of 20) Total 100
Monthly Average of 25 100 ÷ 4 samples
Sludge: Since sludge values are typically higher than those in wastewater, large reporting errors may occur if one half the analytical detection level is used as in the wastewater example above. Therefore, for sludge analyses consider a pollutant present at the analytical detection level for all values reported as less than the laboratory’s reported analytical detection level, and to report the calculated average. For example:
One Month of Lab Data (mg/kg)
50 <10 35 <20 Report Monthly Average (mg/kg) 28.8
Lab Data Numbers To Be Used to Calculate the Monthly
Average 50 50
<10 10 35 35
<20 20 Total 115
Monthly Average of 28.8 115 ÷ 4 samples
c) Reporting of zero is only permissible if zero is obtained using the rounding off procedures as explained in Chapter 8, Section B. If an analytical result is detected
12/07 67

but not quantified or non-detectable, the permittee should not attempt to round off this value since it would prohibit tracking the level of precision that the permittee attained. For example, if a detected but not quantified value of less than 12 ug/L for a specific parameter, the permittee should report less than 12 ug/L and not round off this value.
2. Reporting for Mass Values
To calculate a mass value, the concentration value of the parameter obtained during the sampling period is multiplied by the measured flow for that day and the appropriate unit conversion factors. The procedures for reporting the mass values are essentially the same as those for concentration values. However, mass values must be calculated for each individual sampling occurrence before daily maximum and monthly average values can be calculated and reported. The permittee should not calculate mass loadings based on ND values, but should calculate individual mass loadings based on the reported analytical detection level and report less than (<) the calculated loading. a) Reporting Maximum Values for Mass
(1) If the laboratory analytical concentration values are all detected and quantified,
calculate individual mass loadings for each sampling event and report the maximum value.
For example, if the permittee has a weekly monitoring requirement and a monthly
reporting requirement, the data and calculated mass loadings may look like this:
Week Concentration
(ug/L) Flow
(MGD) Mass Loading
(kg/day) 1 50 0.1000 0.01893 2 25 0.2000 0.01893 3 40 0.1500 0.02270 4 50 0.2000 0.03785
Report Maximum 0.37885 kg/day
(2) If the analytical values are detected but not quantified or non-detectable, the
permittee should calculate individual mass loadings for each sampling event, and report less (<) than the largest mass loading for the data set.
For example:
12/07 68

Week Concentration
(ug/L) Flow
(MGD) Mass Loading
(kg/day) 1 <10 0.1000 <0.003785 2 <10 0.2000 <0.007571 3 <12 0.2000 <0.009085 4 ND (<10) 0.1000 <0.003785
Report Maximum <0.009085 kg/day
(3) If some of the laboratory analytical concentration values are detected and quantified,
and some of the laboratory analytical values are detected but not quantified or non-detectable, the permittee should calculate individual mass loadings for each sampling event and report the maximum quantified value. For example:
Week Concentration
(ug/L)
Flow (MGD)
Mass Loading (kg/day) 1 <10 0.1000 <0.003785 2 <10 0.2000 <0.007571 3 20 0.1500 0.01135 4 <25 0.2000 <0.01893 5 25 0.1000 0.00963
Report Maximum 0.01135 kg/day
b) Reporting Monthly Average Values for Mass
(1) If the analytical values are all detected and quantified, calculate individual mass
loadings for each sampling event, average all values, and report this value:
Week
Concentration (ug/L)
Flow (MGD)
Mass Loading (kg/day)
1 50 0.1000 0.01893 2 25 0.2000 0.01893 3 40 0.1500 0.02270 4 50 0.2000 0.03785
Report Monthly Average 0.02460 kg/day (2) If all analytical values are detected but not quantified or non-detectable, the
permittee should calculate individual mass loadings for each sampling event, and report the highest mass loading. For this case, all analytical values are not quantified; therefore, they cannot be averaged.
12/07 69

For example:
Week Concentration
(ug/L) Flow
(MGD) Mass Loading
(kg/day) 1 <10 0.1000 <0.003785 2 <10 0.2000 <0.007571 3 <12 0.2000 <0.009085 4 ND (<10) 0.1000 <0.003785
Report Monthly Average <0.009085 kg/day
(3) If some values are detected and quantified, and some values are detected but not
quantified or non-detectable, the permittee should substitute one half the calculated mass loading for all values reported as less than the laboratory’s reported analytical detection level, and report the calculated average.
For example:
Week Concentration (ug/L)
Flow (MGD)
Mass Loading (kg/day)
Use For Monthly Avg. Calculation
1 53 0.1000 0.0200 0.0200 2 <10 0.2000 <0.00757 0.00375 (1/2 of 0.00757) 3 53 0.2000 0.0400 0.04 4 <10 0.1500 <0.00568 0.00285 (1/2 of 0.00568)
Sum Total 0.0666 Report Monthly Average
Sum Total 0.0666 divided by four samples
0.01665 kg/day
c) Reporting of zero is only permissible if the results are obtained from using the
rounding off procedures outlined in Chapter 8, Section B.
B. Net Values
In accordance with N.J.A.C. 7:14A-13.4(k), a NJPDES DSW permit may contain an effluent net limitation which adjusts for a particular pollutant in an intake stream, using the following method. Rarely, a permit may require use of other specific methods for calculating net limitation results. The net discharge is the effluent concentration (or mass) minus the influent concentration (or mass). Unless specified otherwise in the permit, net values should be calculated using the method illustrated below. Consider the laboratory data for Examples #1 through #7:
12/07 70

Example 1 2 3 4 5 6 7 8 9
Influent ND <10 ND ND <10 20 20 100 50
Effluent ND ND <10 20 20 <10 ND 50 100
1. Quantifying Influent and Effluent Values If either the influent value or the effluent gross value is non-detectable (ND), less than
the analytical detection level should be reported for these values. ND is equal to <5 mg/L. Detected but not quantified influent or effluent values remain unchanged (e.g., <10 mg/L). The properly quantified values are re-illustrated in Examples #1through #7 below. The permittee should report the following quantified influent and effluent values on the MRF (in mg/L):
Example 1 2 3 4 5 6 7 8 9
a. Influent <5 <10 <5 <5 <10 20 20 100 50
b. Effluent gross <5 <5 <10 20 20 <10 <5 50 100
Net (b) – (a) 0* -5* 5* >15 >10 -10* -15* -50 +50
*Estimated
2. Calculating Net Values • If an effluent gross value is non-detectable, or detected but not quantified, then that value
should be reported as the net value. This is illustrated in examples #1, 2, 3, 6 and 7 below:
• If an effluent gross value is quantified, then zero should be substituted for the non-
detectable influent value, as illustrated in example #4 below. • If the effluent gross value is quantified, and the influent value is detected but not
quantified, then one half the detected but not quantified influent value should be substituted to calculate a net value, as illustrated in example #5 below.
• NJDEP recognizes that negative net values are possible, as illustrated in example #8
below. A negative net value may reflect a treatment system which is removing more of a pollutant than is generated inside the regulated facility.
The permittee should substitute the following values for the influent and effluent values in
determining a net value to be reported on the MRF (in mg/L):
12/07 71

Example 1 2 3 4 5 6 7 8 9
Influent ---- ---- ---- 0 5 ---- ---- 100 50
Effluent <5 <5 <10 20 20 <10 <5 50 100
Net Value <5 <5 <10 20 15 <10 <5 - 50 50
Please note that pursuant to N.J.A.C. 7:14A-6.2(a)3, a permittee shall not obtain any effluent concentration by dilution. Unless otherwise specified in the permit, net values should be calculated using the method illustrated above.
C. Total GC/MS Fractions and Total Recoverable Metals/Total Metals Condition
NJPDES permits may contain permit limitations or monitoring conditions for Total GC/MS fractions (e.g., Total Volatile Organics) or “Total Recoverable Metals/Total Metals”. Please note that this is a different requirement than the monitoring condition for Organic Toxic Pollutants as described in Chapter 7, Section L. The permittee’s wastewater data for a particular GC/MS fraction or metals scan may contain some detected and quantified values, detected but not quantified values and some non-detectable values. Calculating a Total Value with One Sample in the Monitoring Period (Example 1) Step 1: Use the detected and quantified values as reported; Substitute zero for non-detected
values; Substitute one-half the analytical detection level for detected but not quantified values.
Step 2: Sum up the results in Step 1 to calculate a total value. Step 3: This total value should be reported as both the daily maximum and the monthly
average on the MRF. NOTE: The permittee should not calculate a total value and then divide by the number of specific pollutants in the fraction to obtain a monthly average. Calculating a Total Value with More than One Sample in the Monitoring Period (Example 4) Step 1: Calculate a discrete total value from the results of each sampling event as described in Steps 1 and 2 above. Step 2: Calculate the larger of the total values obtained and report this value as the daily
maximum on the MRF.
12/07 72

12/07 73
Step 3: Average the total values obtained in Step 1 using the procedures outlined in the Parameter Specific – Section 1.b. entitled Reporting Monthly Average Value for Concentrations and report his monthly average value on the MRF.
NOTE: The same procedures outlined above apply for applicable mass calculations. Some of the procedures in the Section A entitled “Parameter Specific – all the same parameter” do apply to the Total GC/MS Fractions and Total Recoverable Metals/Total Metals parameters. Please note in the event that a total scan contains data in which all the values are either detected but not quantified or non-detectable, the permittee should report the least sensitive analytical value as both the daily maximum and the monthly average as illustrated in examples 2 and 3 below. Secondly, as illustrated in example 4, when averaging discrete “total” values, the substitution procedures in the subsections 1.b) (3) and 2.b) (3) of the section entitled “A. Parameter Specific” above do apply since discrete “total” values are being averaged. Note: Tables 4 – 6 are located at the end of this chapter.
Example 1: Consider a permit which contains a monthly monitoring requirement for “Total Base/Neutral Extractables” in which daily maximum and monthly average values are required to be reported on a monthly basis. Considering the data as illustrated in Table 6 16 + 17 + 10 + 28 + 94 + 72 + 43 + 10 = 280 ug/L 2 2 The value of 280 ug/L should be reported as the daily maximum as well as the monthly average, assuming that the permittee only took one sample that month.
Example 2: Considering a permit contains a monthly monitoring requirement for “Total Acid Extractables” in which a daily maximum and monthly average value are to be reported on a monthly basis. Considering the data as illustrated in Table 4, one sample is obtained on 9/7/06. As this was the only sample obtained for the month, the daily maximum should be reported as <50 ug/L and the monthly average should be reported as <50 ug/L, which is consistent with subsections 1.a) (2) and 1.b) (2) of the section, entitled “A. Parameter Specific”. Example 3: Consider the same permit monitoring and reporting requirements used in example 2. However, substitute a [10] ug/L for the <10 ug/L for 2,4,6 – trichlorophenol. The [10] ug/L is considered a detected but not quantified value. Therefore, the method for calculating the results will be the

12/07 74
same as those specified in Example 2. The results would be reported as <50 ug/L for the daily maximum and the monthly average. Example 4: Consider a permit with a “twice per month” monitoring frequency and a monthly reporting requirement as illustrated in Table 5. The daily maximum total value for the sample obtained in 11/7/06 is 580ug/L. The total value for the sample obtained on 11/20/06 is <50 ug/L. For the month of November, 580 ug/L should be reported as the daily maximum, and 302.5 ug/L should be reported as the monthly average. The value of 302.5 ug/L was obtained by averaging 580 ug/L and 25 ug/L. The language for Total GC/MS fractions and Total Metals specifies that zero should be substituted for non-detectable values ONLY for the purposes of calculating a “total” value. Therefore, the procedure outlined in subsection 1.b) (3) above in the “A. Parameter Specific” section applies, which specifies that one half the analytical detection level should be used for both non-detectable values and detected but not quantified values when calculating an average, if quantified values are included in the data set. This is because all the analytical values are for the same parameter.

12/07 75
Table 4
Acid Extractable Compounds
Compound 9/7/06 2,4,6- Trichlorophenol <10 p-chloro-m-cresol <10 2-chlorophenol <10 2,4-dichlorophenol <10 2,4 dimethylphenol <10 2-nitrophenol <20 4-nitrophenol <50 2,4 dinitrophenol <50 4,6 dinitro-o-cresol <20 Pentachlorophenol <10 Phenol <10
Daily Maximum <50 Monthly Average <50
Table 5 Acid Extractable Compounds
Compound 11/7/06 11/20/06 2,4,6- Trichlorophenol <10 <10 p-chloro-m-cresol <10 <10 2-chlorophenol <10 <10 2,4-dichlorophenol <10 <10 2,4 dimethylphenol <10 <10 2-nitrophenol <20 <20 4-nitrophenol <50 45 J 2,4 dinitrophenol <50 <50 4,6 dinitro-o-cresol <20 <20 Pentachlorophenol <10 <10 Phenol 580 <10
Daily Maximum 580 Monthly Average <302.5

12/07 76
Table 6
Analysis Report for Base Neutral Extractable by GC/MS (EPA METHOD 625)
Compound Result (ug/L)
MDL (ug/L)
Qualifier (Q)
Acenaphthylene 16 10 Benzidene ND 10 Benzo(a) Anthracene ND 52 Benzo(b) Fluoranthene ND 10 Benzo(k) Fluoranthene ND 10 Benzo(g,h,I) Perylene ND 10 Bis (2-Chloroethoxy) Methane ND 10 Bis (2-Chloroethyl) Ether ND 10 Bis (2-Chloroisopropyl) Ether ND 10 Bis (2-Ethylhexyl) Phthalate 17 10 4-Bromophenyl Phenyl Ether ND 10 Butyl Benzyl Phthalate ND 10 2-Chloronaphthalene ND 10 4-Chlorophenyl Phenyl ether ND 10 Chrysene ND 10 Dibenzo(a,h)Anthracene ND 10 1,2-Dichlorobenzene ND 10 1,3-Dichlorobenzene ND 10 1,4-Dichlorobenzene ND 10 3,3-Dichlorobenzidene ND 21 Diethyl Phathalate ND 10 Dimethyl Phathalate ND 10 Di-N-Butyl Phathalate ND 10 2,4 Dinitriotoluene ND 10 2,6 Dinitriotoluene ND 10 Di-N-Ocytyl Phathalate ND 10 1,2-Diphenylhydrazine ND 10 Flourathene 1.5 10 J Flourene 28 10 Hexachlorobenzene ND 10 Hexachlorobutadiene ND 10 Hexachlorocyclopentadiene ND 10 Hexachloroethane ND 10 Indeno(1,2,3-CD) Pyrene ND 10 Isophorone ND 10 Napthalene 94 10 Nitrobenzene ND 10 N-Nitrosodimethylamine 72 10 N-Nitrosodiphenylamine ND 10 Phenanthrene 43 10 Pyrene 6.5 10 J 1,2,4-Trichlorobenzene ND 10
ND=Not Detected, MDL = Method Detection Level, J=Indicates an estimated value below MDL

Chapter 10: Appendices Appendix 1 – Sample Types
SAMPLE TYPES
Sample Type Description Sample Type Code as Printed
on MRF 1 Hour Composite COMP-1 24 Hour Composite COMP24 3 Hour Composite COMP-3 4 Hour Composite COMP-4 6 Hour Composite COMP-6 8 Hour Composite COMP-8 Batch BATCH Calculated CALCTD Check Requirements CK REQ Composite COMPOS Continuous CONTIN Core Sample CORSAM Estimated ESTIMA Grab GRAB Grab-10 GRAB10 Grab-2 GRAB-2 Grab-3 GRAB-3 Grab-4 GRAB-4 Grab-5 GRAB-5 Instantaneous INSTAN Measured MEASRD Metered METER Not Applicable NOT AP Representative REPRES SGRAB1 SGRAB1 SGRAB2 SGRAB2 Total TOTALZ Visual VISUAL
12/07 77

Appendix 2 – Sample WCR
Residuals Waste Characterization Report PI 12345 PERMIT NUMBER: MONITORED LOCATION: MONITORING PERIOD: FACILITY NAME:_____________________________ NJ0103788 SIB6 Residual/SQAR 11/1/2006 TO 11/30/2006 Anytown Paper Company USA SAMPLE DATE OF REPORT:
PARAMETER QL REPORTED VALUE
UNITS REMARK CODE
SAMPLE TYPE
Comments: If you have any questions regarding this form please contact the Bureau of Pretreatment and Residuals at (609) 633-3823.
Pre-Print Creation Date: 9/1/06
12/07 78 Page 1 of 1

Appendix 3 – Sample Residuals Transfer Report
Residuals Transfer ReportPERMIT NUMBER: MONITORED LOCATION: MONITORING PERIOD: FACILITY NAME:
NJ0117809 SL4A 2/1/2006 TO 4/30/2006 Textile Company Inc.
SENTTO
REC’DFROM# FACILITY ID NUMBER AMOUNT TRANSFERRED
QUANTITY UNITS
MONITORED LOCATION
1
2
3
4
5
6
7
8
9
10
11
12
13
14
15
16
17
18
19
12/07 79

Appendix 4 – Sample Discharge Monitoring Report
12/07 80
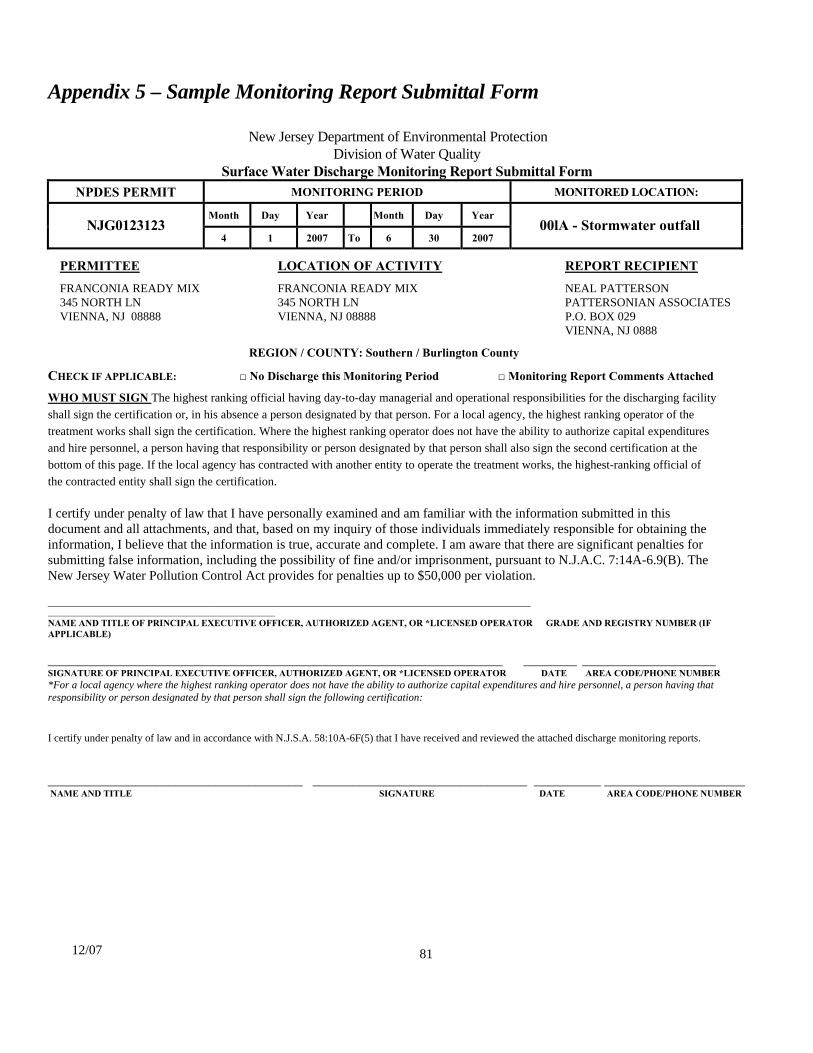
12/07 81
Appendix 5 – Sample Monitoring Report Submittal Form
New Jersey Department of Environmental Protection Division of Water Quality
Surface Water Discharge Monitoring Report Submittal Form NPDES PERMIT MONITORING PERIOD MONITORED LOCATION:
Month Day Year Month Day Year NJG0123123
4 1 2007 To 6 30 2007 00lA - Stormwater outfall
PERMITTEE LOCATION OF ACTIVITY REPORT RECIPIENT
FRANCONIA READY MIX FRANCONIA READY MIX NEAL PATTERSON 345 NORTH LN 345 NORTH LN PATTERSONIAN ASSOCIATES VIENNA, NJ 08888 VIENNA, NJ 08888 P.O. BOX 029 VIENNA, NJ 0888
REGION / COUNTY: Southern / Burlington County
CHECK IF APPLICABLE: □ No Discharge this Monitoring Period □ Monitoring Report Comments Attached
WHO MUST SIGN The highest ranking official having day-to-day managerial and operational responsibilities for the discharging facility shall sign the certification or, in his absence a person designated by that person. For a local agency, the highest ranking operator of the treatment works shall sign the certification. Where the highest ranking operator does not have the ability to authorize capital expenditures and hire personnel, a person having that responsibility or person designated by that person shall also sign the second certification at the bottom of this page. If the local agency has contracted with another entity to operate the treatment works, the highest-ranking official of the contracted entity shall sign the certification. I certify under penalty of law that I have personally examined and am familiar with the information submitted in this document and all attachments, and that, based on my inquiry of those individuals immediately responsible for obtaining the information, I believe that the information is true, accurate and complete. I am aware that there are significant penalties for submitting false information, including the possibility of fine and/or imprisonment, pursuant to N.J.A.C. 7:14A-6.9(B). The New Jersey Water Pollution Control Act provides for penalties up to $50,000 per violation. _________________________________________________________________________________________________________________________ _________________________________________________________ NAME AND TITLE OF PRINCIPAL EXECUTIVE OFFICER, AUTHORIZED AGENT, OR *LICENSED OPERATOR GRADE AND REGISTRY NUMBER (IF APPLICABLE) _____________________________________________________________________________________ __________ _________________________ SIGNATURE OF PRINCIPAL EXECUTIVE OFFICER, AUTHORIZED AGENT, OR *LICENSED OPERATOR DATE AREA CODE/PHONE NUMBER *For a local agency where the highest ranking operator does not have the ability to authorize capital expenditures and hire personnel, a person having that responsibility or person designated by that person shall sign the following certification: I certify under penalty of law and in accordance with N.J.S.A. 58:10A-6F(5) that I have received and reviewed the attached discharge monitoring reports. ______________________________________ ________________________________ __________ _____________________ NAME AND TITLE SIGNATURE DATE AREA CODE/PHONE NUMBER