njasa · pdf fileeffect of wedge probe and swirl ... on the test rig with a uniquely contoured...
TRANSCRIPT

NASA Contractor Report 3047
Aerodynamic Design and -
NASA CR 3047 c.1
Testing of an Advanced 30” Swept, Eight Bladed Propeller at Mach Numbers From 0.2 to 0.85
D. M. Black, R. W. Menthe,
and H. S. Wainauski
CONTRACT NAS+202 19 SEPTEMBER 1978
nJAsA
https://ntrs.nasa.gov/search.jsp?R=19780024123 2018-05-25T20:06:20+00:00Z
NASA Contractor Report 3047
Aerodynamic Design and Performance Testing of an Advanced 30" Swept, Eight Bladed Propeller at Mach Numbers From 0.2 to 0.85
D. M. Black, R. W. Menthe,
and H. S. Wainauski
United Technologies Corpomtiorr Widsor Locks, Conuecticzit
Prepared for Lewis Research Center under Contract NAS3-202 19
National Aeronautics and Space Administration
Scientific and Technical Information Office
1978


TABLE OF CONTENTS
Section Page
SUMMARY . . . . . . . . . . . . . . . . . . . . . . . . . . . . . . . . . . . . . . . . . . . . . . . . . . . . . . . . .
INTRODUCTION . . . . . . . . . . . . . . . . . . . . . . . . . . . . . . . . . . . . . . . . . . . . . . . . . . . .
THE PROP-FAN CONCEPT . . . . . . . . . . . . . . . . . . . . . . . . . . . . . . . . . . ...*...
PROP-FAN AERODYNAMIC DESIGN PHILOSOPHY . . . . . . . . . . . . . . . . . . . .
MODEL DESCRIPTION . . . . . . . . . . . . . . . . . _...........................
PROGRAM DESCRIPTION . . . . . . . . . . . . . . . . . . . . . . . . . . . . . . . . . . . . . . . . . . .
TEST FACILITIES . . . . . . . . . . . . . . . . . . . . . . . . . . . . . . . . . . . . . . . . . . . . . . . . . Wind Tunnel
propeller Test Gc . . . . . . . . . . . . . . . . . . . . . . . . . . . . . . . . . . . . . . . . . . . . . . .
. . . . . . . . . . . . . . . . . . . . . . . . . . . . . . . . . . . . . . . . . . . . .
PRESSURE INSTRUMENTATION . . . . . . . . . . . . . . . . . . . . . . . . . . . . . . . . . . . . 11
TUNNEL MACH NUMBER CALIBRATION . . . . . . . . . . . . . . . . . . . . . . . . . . . . . 12
STRESS SURVEY . . . . . . . . . . . . . . . . . . . . . . . . . . . . . . . . . . . . . . . . . . ..*......
PROPELLER FORCE MEASUREMENTS . . . . . . . . . . . . . . . . . . . . . . . . . . . . . . 14
RESULTS AND DISCUSSION ......................................... Basic Force Data .............................................. Cruise Performance ........................................... Cruise Performance Evaluation .................................. Take -off, Climb ............................................... Reverse Thrust ............................................... Feather Drag ................................................. Pressure Data ............................................... Nacelle Statics ............................................... Kiel Rake .................................................. Boundary Layer Rakes ......................................... Effect of Wedge Probe and Swirl Angles ..........................
CONCLUSIONS . ..“.“...........................~...............
1
2
3
5
7
8
9 9 10
14
18 18 20 21 22 23 24 24 24 25 26 26
28
iii

TABLE OF CONTENTS (Cont)
Section Page
LIST OF SYMBOLS ................................................. 29
REFERENCES ..................................................... 31
TABLES ......................................................... 34
FIGURES . . . . . . . . . . . . . . . . . . . . . . . . . . . . . . . . . . . . . . . . . . . . . . . . . . . . . . . . . 35
iv
SUMMARY
Hamilton Standard, under contract to NASA-Lewis, has completed wind tunnel perfor- mance tests on a model of a new advanced, high speed propeller concept, appropriate for energy efficient transport aircraft designed for cruise at Mach 0.8. This new con- cept has been named,Prop-Fan by the contractor. A 0.62m (24.5 in. ) diameter model propeller was tested at Mach numbers from 0.2 to 0.85 in the 2.44m (8 ft.) throat of the United Technologies Research Center’s (UTRC) wind tunnel on a Propeller Test Rig (PTR).
The, objective of the test program was to establish the performance of the propeller model covering take off, high speed cruise and reverse thrust at touchdown velocities within the capabilities of the 2.44m (8 ft.) test section.
The model had eight 30’ swept blades designed to produce a net efficiency of 78.9 percent at a design operating condition of 0.8 Mn, 10.68 km (35,000 ft.) alt., 243.8 m/s (800 ft/sec) tip speed and a high power loading of 301 kw/m2 (37.5 SHP/D2). The model was mounted on the test rig with a uniquely contoured spinner and nacelle. The blade sweep and the unique contour of the spinner and nacelle configuration were incorpor- ated for the purpose of reducing the effective blade section Mach number to minimize compressibility losses.
A net efficiency of 77.7 percent was achieved at the design condition. With a cleaner fairing of the spinner to blade juncture, the net efficiency was increased to 78.2 percent.
Blade spanwise total pressure distribution and flow visualization data indicate that the propeller was not operating completely as designed. These data indicate that the tip may have been unloaded at the design blade angle. A modified blade with a revised twist and camber distribution may achieve the efficiency goal of 80.0 percent.
INTRODUCTION
In response to the worldwide energy shortage and the increasing cost of aviation fuel, the National Aeronautical and Space Administration’s Aircraft Fuel Conservative Tech- nology Task Force reported to Congress (reference 1) in late 1975 that six areas of advanced technology, including both aircraft and propulsion systems, indicate the potential for significant fuel savings and warrant further study. One of these areas is the advanced turboprop.
With technologies developed over the past two decades, a new advanced turboprop, called Prop-Fan by the Contractor, was conceived which promises to extend the high propulsive efficiencies of the old turboprop from flight speeds of 0.65 Mach number to at least 0.8 Mach number. For the envisioned installed configuration which incorpor- ates several advanced aerodynamic concepts, this advanced turboprop is predicted to produce an installed (thrust minus nacelle drag) efficiency of 74 percent at 0.8 Mach number compared to 62 percent for the high bypass turbofan as shown in figure 1. This would result in a significant potential fuel savings for future transport aircraft.
Utilizing predicted aerodynamic performance data, weight estimates, and noise pro- jections, NASA sponsored studies by both engine and airframe manufactures have generally confirmed the substantial fuel savings predicted for this new tubroprop concept. These studies are contained in references 2 to 14. A summary of the essen- tial results of these studies is shown in figure 2 where block fuel consumed and DOC savings are presented for an advanced Mach 0.8 cruise turboprop compared with both current and future advanced turbofan powered aircraft. In these studies a new pro- peller efficiency of 78.9 percent at Mach 0.8 was assumed along with an advanced level of technology for the core engine, gearbox, and propeller structures. As summarized in figure 1, the advanced turboprop could result in fuel reductions of from 15 to 28 percent for stage length missions from 1296 to 3704 km (700 to 2000 n mi). For a very short mission 185.2 km (100 n mi) a fuel saving of up to 40 percent was projected in reference 7. In addition, an advanced turboprop could result in DOC saving of from 3 to 5.3 percent assuming 8C/liter (30$/gal) fuel or from 4.5 to 8.2 percent for 16C/Liter (6OC/gal) fuel.
In view of the attractive fuel savings potential of the Prop-Fan propulsion system, NASA Lewis Research Center has mounted a major research and technology effort to establish the design criteria to achieve an uninstalled net efficiency goal of 80 percent at 0.8 M. N. and high power loading. One phase of this overall program was wind tunnel evaluation of two model Prop-Fans. The first model incorporated swept blades for improved efficiency at high flight Mach number while the second model incorpor- ated conventional straight blades as a basis of comparison. Both models were designed by Hamilton Standard and tested in the United Technologies Research Center’s 2.44m (8 ft.), high-speed wind tunnel. The test program of the first model has been complet- i ed. This report presents a brief discussion of the Prop-Fan concept, discussion of the aerodynamic design philosophy, a description of the test program and a discussion of the test results on the first model.
2

THE PROP-FAN CONCEPT
The Prop-Fan is a small diametar, highly loaded, multi-bladed variable pitch, un- ducted propulsor. The blades incorporate thin airfoils with tip sweep and are integrat- ed with a spinner and nacelle shaped to reduce the axial Mach number through the blading to alleviate compressibility losses. The complete Prop-Fan propulsion system depicted in figure 3 includes the propulsor with a pitch change mechanism and control geared to a turboshaft core engine in a manner similar to turboprops of the past.
The predicted design point, uninstalled aerodynamic efficiency level of 80 percent at 0.8 cruise Mach number is associated with a power loading nearly three times that of conventional turboprops and corresponds to a diameter reduction of about 40 percent of a conventional turboprop. This size reduction is required to permit installation compatibility with the aircraft and to provide the propulsive system weight and main- tenance characteristics, as well as cabin comfort levels demanded for advanced 0.8 Mach number transport aircraft that cruises near to 688 km (35,600 ft).
The potential fuel savings over turbofan engines have been thoroughly discussed in Ref- erences 15 and 16. These references have projected a potential fuel savings of 20 to 28 percent over a high bypass (6:l) turbofan transport aircraft when each is sized for the same payload and range and both propulsion systems incorporate the same core engine technology.
The position of the Prop-Fan in the overall prop&or spectrum can be demonstrated by the simple momentum theory. Ideal propulsive efficiency is shown in figure 4 as a function of flight Mach number and fan pressure ratio which is analogous to power load- ing. These curves were derived from the simple momentum equations and represent only the axial induced loss. The calculations assumed an adiabatic efficiency of 1.0 and no viscous losses. The pressure ratio range typical for various propulsor types are indicated. Lightly loaded conventional propellers operate at pressure ratios up to about 1.03 while ducted fans and turbofans operate at pressure ratios above 1.07 and 1.30 respectively. The Prop-Fan will operate at higher power levels than conventional propellers to provide the high thrust levels required for large high speed aircraft. Moreover in order to achieve the relatively small diameters mentioned previously, a high power loading is required for these advanced propellers. Thus the corresponding pressure ratio for Prop-Fans will be in the range from about 1.03 to 1.07.
The initial Prop-Fan design point includes a power loading of 301 kw/m2 (37.5 SHP/D2) at 243.8 m/set (800 ft/sec) tip speed and 0.8 M. N. cruise speed at 10.668 km (35,000 ft) altitude ISA corresponding to a pressure ratio of 1.047. The typical advanced turbo- fan is projected to have a pressure ratio of 1.6. From Figure 4, the ideal efficiency for the Prop-Fan is 97 percent compared to 80 percent for the turbofan - a significant inherent advantage for the Prop-Fan. Moreover at low flight speeds corresponding to take-off and climb, the ideal efficiency gains for the Prop-Fan are shown to be even larger.
3

However, it should be noted that the simple momentum theory does not account for the residual swirl loss in the propeller wake. Since the propeller does not incorporate swirl recovery vanes as do turbofans, the ideal efficiency of.the propeller must be corrected for this loss. As shown in figure 5, for an infinite number of blades, the ideal efficiency at the design power loading should be reduced approximately 7 percentage points. It should be noted that much of this loss could be partially recovered with a counterrotating propeller, or possibly by proper shaping of the wing in the slipstream region. According- ly, this more complex approach may be investigated in the future.
As noted in figure 5, the ideal efficiency of the propeller decreases rapidly as the number of blades are reduced. This is associated with tip induced losses for a finite number of blades. It is further noted in the figure that efficiency increases as power loading is re- duced for any number of blades. However, in order to minimize diameter, high power loading is basic to the Prop-Fan concept. So too are large number of blades as shown in figure 5. Thus at the design power loading, eight or more blades are required to maintain a significant performance advantage over the turbofan.
However, even with these two additional penalties, it is evident from figures 4 and 5 that the highly loaded Prop-Fan at Mach 0.8, still shows a significantly higher ideal efficiency than the high fan pressure ratio turbofan (85 percent versus 80 percent.) The advantage for the Prop-Fan would be considerably larger if the turbofan performance was adjusted for fan losses due to adiabatic efficiency, inlet recovery, nozzle efficiency, and cowl drag.
The high propulsive efficiency level predicted for this turboprop concept is based on ex- isting experimental data on high speed propellers and on proven aerodynamic principles as will be discussed below.
High levels of propeller efficiency at Mach numbers up to 0.8 and above have been attain- ed in wind tunnel research programs conducted on high-speed propellers more than twenty years ago. These tests clearly demonstrated the powerful effect of reduced blade thick- ness ratio on reducing compressibility losses. This is due to the fact that drag rise Mach number is increased with reduced airfoil thickness ratio. Typical of these charac- teristically thin-bladed propellers is the performance shown in figure 6 presenting effi- ciency for a two-bladed propeller as a function of power loading kw/m2 (SHP/D2) and Mach number (ref. 17). This plot shows a peak efficiency of over 80 percent at 0.8 flight Mach number and 243.8 m/s (800 ft/sec) speed at an altitude of 10.688 km (35,000 ft. ). However, at the higher power loadings corresponding to those required for advanced turbo- prop propulsion, the efficiency level falls off significantly, as indicated in the figure. These experimental data on the two-bladed propeller model were projected to the eight- bladed highly loaded Prop-Fan as shown in figure 7. The data shown in figure 6 have been replotted in terms of efficiency variation with power loading for several tip speeds at 0.8 Mach number and 10.688 km (35,000 ft.). The data were converted to represent an eight- bladed Prop-Fan by scaling the power loading by the ratio of number of blades to the 0.83 power and adjusting efficiency level for the effect of number of blades on ideal propeller efficiency. Moreover, as .discussed in reference 15, this projected performance, based on test data, was correlated with calculated performance for the eight-bladed Prop-Fan using the Hamilton Standard propeller performance method. An inspection of figure 7 shows that at the design point of 301 kw/m2 (37.5 SHP/D2), the efficiency is 73percent,
4

considerably below the goal of 80 percent. This reduced efficiency at high power load- ings is due primarily to the unrecovered swirl energy in the slipstream and compressible losses. In lieu of recovery vanes or counterrotating blading, reduction in compressibility losses offers the best potential for achieving an efficiency of 80 percent.
Figure 8 presents several concepts for alleviating compressibility losses. Further reduction in section-thickness ratio, although the most effective airfoil shape para- meter for increasing section critical Mach number, is not practical for structural reasons. Advanced airfoils designed for aircraft wings have demonstrated improved critical Mach numbers but their consideration for this model was deemed premature since no thin (2-4% thickness ratio) transonic sections have been developed.
Thus, of the items listed, a nacelle shaped to reduce the axial Mach number through the blading, particularly over the inboard portions where the blades are thick with low gap-to-chord ratios, and tip sweep to reduce the effective blade section Mach number, were incorporated to essentially eliminate compressibility losses.
The effect of incorporating nacelle diffusion and blade tip sweep in the calculation of advanced turboprop cruise efficiency is shown in figure 9. From an inspection of this figure, it is apparent that the goal of 80 percent uninstalled net efficiency at 0.8 Mach number may be achieved at a high power loading of 301 kw/m2 (37.5 SHP/D2).
PROP-FAN AERODYNAMIC DESIGN PHILOSOPHY
Having discussed the Prop-Fan concept and demonstrated the basis for the predicted aerodynamic efficiency, it is appropriate to review the approach to the aerodynamic design of the wind tunnel model. In lieu of an integrated compressible flow design analysis to analyze the combined Prop-Fan and nacelle flow field including the effect of swept blades operating at transonic tip speeds, the Prop-Fan model design was accomplished by using several existing aerodynamic methods which best apply to particular portions of the propeller and nacelle combination. Briefly, the approach was to model the Prop-Fan as a turbofan in the root sections where the gap-to-chord ratios are below 1.0, as a turboprop in the mid portions , and as a swept wing for the tip sections . To this end conventional turbofan aerodynamics were modified to represent the Prop-Fan root blading andnacelle combination with the influence of the duct removed. This method includes a streamline analysis coupled to empirical cascade data. The Hamilton Standard propeller method based on Goldstein, reference 19, was modified to incorporate 2D compressible airfoil data with a cascade correction for the mid-blade por- tion. These airfoil data were corrected for compressiblity effects based on the results of reference 17. For the tip section, this same method was further modified to incorpo- rate a “tip relief” correction to account for the three dimensional flow effect on compres- sibility losses. In addition, a method based on 2D wing cosine correlation for sweep effects on airfoil performance was added to the propeller program for analyzing the tip sections where sweep is incorporated. Finally, development of a new compressible
5
swept vortex method was undertaken to account for the effect of supersonic Mach number on the induced effects at the blade tip. This method, based on the Biot-Savart equation (reference 18) incorporated the compressible airfoil data, cascade correc- tion and tip sweep. Although the method has not yet been fully developed, it was used as a guide in the design of the Prop-Fan model. Thus in lieu of an integrated aero- dynamic design method incorporating these components, the appropriate methodo- logy was separately applied to portions of the blading with the final tailoring accom- plished with the new compressible program.
Utilizing the various methods described above, the procedure for designing the Prop- Fan model is outlined in the block diagram of figure 10. The design procedure begins with a preliminary analysis where the propeller diameter, number of blades, HPM, and power are selected. Blade thickness ratio distribution is generally chosen as the minimum allowable by stress limitations, aeroelastic considerations and the fabrication state-of-the-art. The initial blade planform is selected based on experience and a preliminary performance analysis of the design condition. Next, the velocity gradient at the blade leading edge is obtained from calculations of the flow field around the spinner/nacelle configuration including the blade blockage. Then with this velocity gradient and the selected initial geometry and design operating condition(s), the pro- peller is analyzed using the Hamilton Standard strip analysis program modified as described above. With this program, the optimum Goldstein loading distribution for minimum induced loss with corresponding minimum profile losses along the blade span
is established by iterating between angle of attack and camber.
As previously mentioned, the blade root sections are relatively thick with low gap-to- chord ratios. Therefore, cascade effects are important and choking could be a problem. Since the conventional propeller theory does not apply under these conditions, the flow in this region is analyzed and cascade airfoils are selected using the turbofan method- ology as indicated above.
Finally the design must be checked at take-off and climb conditions. Because good low speed performance may require higher camber, the low camber designed for high speed cruise may need to be modified to a slightly higher camber. Then with the inclusion of the root configuration designed by the turbofan method and the take-off climb constraints, final iterations of the Hamilton Standard propeller strip analysis program were required to assure that the final design had the highest cruise perfor- mance with acceptable take-off performance.
Since it was realized that the Goldstein theory (reference 19) does not properly analyze the induction at the tips of blades operating at supersonic speeds, the aforementioned compressible vortex method based on the Biot-Savart equations was used for the final tailoring of the Prop-Fan model.
6

While the design philosophy of this model is based on sound aerodynamic principles, there are several critical areas in the design which have not been rigorously established. The integration of nacelle and blade root configuration to alleviate root choking is a potential problem area. No reliable method exists to define the sweep, the planform shape and the associated twist at the tip for a rotatin, s loaded blade operating at transonic velocities. Finally the composite design approach defined above, in lieu of an integrated propeller/nacelle method involved compromises in establishing the blade shape charac- teristics. Thus the wind tunnel test of this model was essential to establish the actual performance of this first generation Prop-Fan and to afford diagnostic measurements for pinpointing any problem areas, thereby providing the basis for refining the blading in sub- sequent models as well as the methodology.
MODEL DESCRIPTION
Utilizing this approach discussed above, the swept blade, Prop-Fan model was designed for an operating condition 0.8 Mach number, 10.668 km (35,000 ft.) alt., 243 m/s (800 ft/sec) tip speed and a power loading of 302 kw/m2 (37.5 SHP/D2). Calculations using the above design method yielded a net uninstalled efficiency of 7 8.9. This tends to support the preliminary analysis discussed above that even at this very high power loading, the installed net efficiency goal of 80 percent should be achievable with further work. The model diameter of 0.62 meters (24.5 in. ) was selected by the model design power loading and the power available from the propeller test rig (PTR). The overall characteristic of this mdoel are listed below:
8 blades 302 Activity Factor per blade (AF) 0.081 Integrated Design Lift Coefficient (CLi) 30 degrees blade tip sweep NACA 16 and 65 airfoils 0.35 Ratio of nacelle max. diameter to prop diameter
The blade shape characteristics are presented in figure 11. The thickness ratio selected is essentially that incorporated in the previously discussed conventional propeller models which achieved over 80 percent efficiency at 0.8 Mach number in a 1955 wind tunnel test (ref. 17). The twist, design lift coefficient and planform distribu- tions were selected to provide optimum loading distribution at the design condition. The sweep distribution is that required to effectively reduce the local helical Mach number along the blade radius below the corresponding critical Mach number of the airfoils. This was done to minimize compressibility losses at the blade tip sections. As shown in figure 12, &he built in sweep of the line connecting the center of pressure of the airfoils along the blade radius varies from 27 degrees at the tip to zero at the 40 percent radius. Since the airfoils are laid out along streamlines (including the swept sections) the effective aerodynamic sweep becomes 30 degrees at the tip and varies along the radius as shown in figure 12. The actual planform and stacked view

of the blade is shown in figure 13. The sweep was achieved by first stacking the sec- tions along the pitch change axis. Next each section was oriented to the proper twist angle and then swept back along the extended chord lint. The airfoil sections selected for the swept blade design are NACA Series 16 from the tip to the 45 perceti radius and NACA Series 65 from the 37 percent radius to the root with a transition fairing between. These airfoils were chosen for their high critical Mach number and wide low drag buckets.
The nacelle and spinner lines shown in figure 14 are configured to produce the flow retardation at the spinner surface sufficient to alleviate any significant blade root choking and to minimize the blade tip sweep requirement consistent with a favorable trade-off with nacelle drag. The spinner is a 20 degree half angle cone blending to a mnsimmn nacelle diameter equal to 35 percent of the Prop-Fan diameter. The Mach number distribution along the nacelle surface, including the blade blockage effect is shown in this figure. These distributions were calculated using the Hamilton Standard Streamline Curvature computer program. This program calculates the flow field for a given design condition and body shape. A slight choking is indicated through the blade root which the analyses show to vanish aboti 0.066 meters (0.25 in) above the spinner surface. The analyses also indicate a mild supercritical bubble over the nacelle surface near the maximum diameter.
The calculated thrust and power loading distributions from the new compressible design method along the blade radius are presented in figure 15. The plot shows the bIade tip portions to be highIy loaded associated with the reduced induced losses from the transonic flow in this region. This tfie of loading distribution was indicated I’rorn the aforementioned compressible propeller design method. Estimates of the calcul~tlc~~l swirl angle distribution and the average slipstream Mach number from the strenmlinc curvature program are shown in figure 16.
PROGRAM DESCRIPTION
Before discussing the details of the test program, for clarity it is appropriate to first present a brief overview of the entire test program.
The objectives of this program were three fold:
1. To establish the complete aerodynamic performance of the Prop-Fan model.
3 -. To obtain detailed flow data to indicate where the blading may be modifirrl for improved performance.
3. To verify and improve the various elements of the aerodynamic design methodology.

To achieve the objectives of this program a test schedule of 84 runs was conducted. Each run consisted of a fixed blade angle and Mach number with rpm variable. Each combination of blade angle and Mach number was tested to the maximum torque avail- able from the test rig. The testing covered fonvard thrust operation over a Mach number range from 0.20 to 0.85. At each Mach number a range of power loadings and tip speeds were investigated. Reverse thrust, windmill and feather drag data were also obtained. The Reynold’s number range of this test varied from .4 to 1.5 million based on the relative velocity, blade width at the B/4 radius and the blade rotational speed and tunnel operating conditions.
In addition to the force data, diagnostic data were obtained by surveying the Prop-Fan wake with special total and static pressure rake instrumentation. In addition, tuft and sublimation studies were performed on the operating Prop-Fan.
TEST FACILITIES
Wind Tunnel
Tests were conducted in the 2.44 m (8.0 ft) test section of the United Technologies Research Center’s subsonic wind tunnel facility. This tunnel, shown in figure 1’7, is a single-return, closed-throat facility with interchangeable 5.49 m (18 ft) and 2.44 m (8 ft) octagonal test sections. Maximum tunnel velocity is approximately 89.4 m/s (200 mph) in the 5.49 m (18 ft) section and near sonic Mach numbers (0.95 - 0.98 Mn) can be obtained in the 2.44 m (8 ft) section. For this program only the latter test section was utilized. Tunnel stagnation pressure equals atmospheric pressure, and the stagnation temperature of the airstream is held constant in the 15.6’C (60°F) to 54.4’C (130°F) range by means of air exchanger valves. The main tunnel drive sys- tem consists of a 6711 kw (9000 hp) synchronous motor with a variable-speed coupling driving an 8.4 m (26 ft) diameter 20 bladed fan.
As mentioned above, for this test the 2.44 m (8 ft) section was used. This section has special inserts for use with the Propeller Test Rig (figure 18). With these inserts (reference 20) test Mach numbers above 0.85 can be attained. Moreover, these in- serts control the axial distribution of Mach number in the tunnel.
In addition a data acquisition system is located in the tunnel control room. This system (called STADAS, S&tic Data &quisition %stem) is capable of recording over 200 steady forces, pressures or temperatures. Coupled to the STADAS system is a remotely located computer. For this test the computer provided both on-line and off-line data reduction. The on-line print-out permitted immediate persual of the force results while the off-line data, reduced the following day, displayed all the pressure data as well as all of the force data.
9

Propeller Test. Riig
The model was installed on the Propeller Test Rig (PTR) pictured scbcmnticnlly in figure 1s. This rig was designed and built over twenty years ago for the UTRC wind tunnel to conduct research on advanced propeller designs. The metric system has been extensively developed to achieve accurate and repeatable measurements. It is estimnt- ed that the accuracy of the data is within i 1.868 newtons (i 0.42 Ihs) in thrust ant1 i0.76 nm (to.55 ft. Ihs) in torque. Over 50 different model advanced design proprllc~s, ducted propellers and low pressure ratio fans have been tested on the PTR since its first installation in 1953.
The propeller test rig consists of two variable-speed motors, mounted in tan&m, and housed within a streamlined cast steel pod with an integral support strut, (figure 18). The motors are mounted in hydrostatic hearings to restrain all motion except axial motion along or rotational motion about the longitudinal axis of the dynamometer. These motions are restrained by load cells which measure thrust and torque of the model propeller. Each motor has a nominal rating of 229 Inv (375 hp) at 12,000 lpm; together they provide a maximum torque of 450 N-M (330 lb-ft) over the entire speed range. Model speed is controlled by variable frequency power supplied by two motor generator sets and measured with an events per unit time meter and a GO-tooth signal generator. Propeller rotational direction for this test was counter-cloclcwisc looking upscream. The model installation on the PTR has been configured such that the Prop-Fan and spinner surfaces are the only portions of the metric system cxposcd to the airstream. As can be seen in figure 18 the portion of the nacelle needed to suppress the local flow in the blade region was simulated on the PTR. This naccllo, aft of the “pie-plate” was not on the metric portion of the model. Pressure mensurc- ment instrumentation is provided within the dynamometer to allow the measured thrust to be corrected for any differential pressure between the rear face of the hub and an equal area in the rear fairing. A detailed description of the propeller tlynnmomctc1 is giveu in reference 20.
Propeller test rig monitoring instrumentation consisted of a vibration meter with pro- vision for selecting vertical or horizontal motion and a multi-channel display rccortlc~ for thermocouple temperatures. During pi-e-performance stress tests, electrical lends from blade strain gages were routed along the face side of two blades, and through the hub to a slip ring assembly mounted on the upstream surface of the hub. The mwlcl and nacelle assembly mounted on the PTR is shown installed in the 2.44 m (8 ft) test section in the photograph of figures 19 and 20.
Prior to the start of the performance testing the thrust and torque tares of the spinner were established. This was done with a dummy spinner, i.e., with no blades. For this, a special spinner without blade sockets was provided and installed as shown in figure 21. This installation was used for all tare runs.
10

PRESSURE INSTRUMENTATION
In addition to the normal propeller test rig pressure instrumentation for monitoring rig internal pressures i. e., PB~ and PRAVE as shown in figure 18, other special pressure instrumentation was used to establish nacelle forces and to provide diagnostic data. This instrumentation consisted of two boundary layer rakes, a total head rake, a wedge probe rake and surface static pressure taps on the nacelle. The location and installation of these rakes is shown in the photographs of figures 19 through 21 and schematically in figures 22 and 23. The static taps were located at the top of the nacelle. Each of these pieces of instrumentation is described briefly below.
Two boundary layer rakes as shown in figure 21 were used in this test. One was located at the nacelle leading edge immediately behind the spinner trailing edge while the c&her was installed at the nacelle minimum diameter. Each rake consisted of 10 total head tubes the inner 5 of which were stacked on top of each other while the outer 5 were radially spaced to fully encompass the calculated height of the boundary layer at each of these locations. The rakes were staggered azimuthally so that the wake of the forward rake would not interfere with the rear rake and both rakes were aligned with the estimated swirl angles. The configurations of the rakes are shown in figure 24 and 25. The purpose of the rakes was, 1) to measure the height of the boundary layer, 2) help evaluate the blade root performance and 3) provide a measure of the losses over the nacelle.
A total head rake of 15 Kiel probes was located one blade chord width downstream of the model and installed at the estimated mean flow angle of 6.5’ to the tunnel flow direction as shown in figure 20. The inner four probes of the rake were extended forward in length to avoid possible interference with a predicted sonic region on the nacelle as indicated in figure 14. The probes were spaced 0.0189 meters (0.72 inches) apart and extended radially outward to 0.372 meters (14.68 inches). This rake is shown in figure 26. The purpose of this rake was to measure the total pressure rise behind the operating Prop-Fan for comparison with predictions.
A total of twenty-two static pressure taps were located on the nacelle surface. Each of these taps was located in center of an equal annular area for the rapid evaluation of nacelle pressure drag. The estimated and actual Mach distribution on the nacelle was to be compared through the use of these taps. A special wedge probe was built for this test to investigate the blade radial flow characteristics for comparing with predic- tions and to use as a diagnostic tool. This rake incorporated six specially calibrated wedge probes mounted on the end of an airfoiled strut. That portion of the rake with the wedges was rotatable in the pitch direction for flow alignment. The instrument is shown installed on the model in figures 27a and 27b. An individual wedge is shown in figure 27~. It was intended that each wedge would be sequentially aligned with the flow by equalizing static pressure on each side of the wedge to sense the flow direction and total and static pressure behind the operating model. In addition, as pictured in the photograph, static probes were mounted above the airfoil shaped strut surface.
11
Because of unexpected tunnel interference effects to the pressure data from this instrument are suspect. are presented herein.
be discussed later in more detail, Thus, only the flow angle data
TUNNEL MACH NUMBER CALIBRATION
The tunnel Mach number calibration is an important part of any wind tunnel test, and it is of particular importance in propeller testing since the propulsive efficiency is based upon the Mach number determined from this calibration. During propeller testing in solid wall wind tunnels it is necessary to account for 1) the solid body blockage of the model, and 2) the change in tunnel velocity caused by the thrusting propeller, when determining the tunnel Mach number.
During this test, procedures established and previously used at UTRC to account for the effects of the solid body blockage and the thrusting propeller were combined to establish the equivalent free stream Mach number. The procedures discussed below result in a correlation between a wall sensed Mach number and the true test section Mach number which differs with each significantly different test section installation. Thus separate Mach number calibrations are required for the spinner tare run without blades and for the performance runs with the complete model and instrumentation installed in the test section.
To account for the change in tunnel velocity caused by a thrusting propeller, the pro- cedure suggested by Pope, in reference 21, and verified by H. Lanz in reference 20, was used. Theoretically, it can be shown that Prop-Fan test anditions referenced to the Prop-Fan plane result in performance measurements equivalent to free-air con- ditions . During this test, a static tap located in the plane of the propeller on the upper east wall(upper left hand wall of figure 27a) of the tunnel was used to set the tunnel Mach number, and at this location the set Mach number is not biased by propeller load- ing. Tests conducted by Lanz, and reported on in reference 20, confirmed that this approach yields the same free stream velocity for a thrusting propeller as does the frequently used method, reference 21, of correcting the upstream velocity for the in- creased flow through the propeller.
The solid body blockage correction introduced by Gothert, reference 22, and refined for use in the UTRC 2.44 m (8 ft) tunnel by W. Wells, reference 23 was used to correct the tunnel Mach number for the model blockage during this test. The solid body blockage corrections often referred to as the Gothert Velocity-Ratio Method, attempts to account for the increase in velocity at the model due to the confinement effect caused by the tun- nel walls in the vicinity of the model. The Velocity-Ratio Method is based on the existence of a linear relationship between the velocity interference at the tunnel wall caused by the model and the interference velocity (A u) at the model, caused by the walls:
12
Au=m= Au,
The interference factor, m, will of course be less than 1, and depend on the shapes of both the model and the tunnel. Wells, reference 23, has determined the “rnrr factor based on potential flow calculations, as a function of source location for a doublet in the UTRC 2.44 m (8 ft) tunnel.
The equivalent source-sink location for the propeller model was determined by forming a close body, symmetrical about the maximum body diameter, and determining the source location by a method given in reference 23. This yielded an interference factor of approximately 0.45, which agrees with the value suggested by Gothert for symmetrical bodies.
As mentioned above a static pressure tap, was installed on the wind tunnel wall in the propeller plane and a reference tap, was located on a wall mounted airfoil (speed bump) in the test section bell mouth upstream of the model figure 18. At this location the tap is not influenced by any blockage due to the PTR and test model. Thus the “speed bump” Mach number is a reference for calibrating the wall Mach number. The tunnel was then run empty (with both model and PTR absent) over a range of Mach number, to obtain a plot of wall Mach number, MW, versus %peed-bumpll Mach number, MS-R. Then with the PTR and bladeless “dummy” spinner (used for the tare runs) installed, the tunnel was again run to obtain a plot of MsR vs MW. These calibration curves are shown in figure 28.
With these data, the Velocity Ratio Method is applied by determining the change in wall Mach number, MW, between the empty tunnel and with the PTR and dummy spinner in- stalled. Then with the MW for the empty tunnel noted, the test section Mach number, i.e. the equivalent freestream Mach number is defined by the following equation:
MO = MWALL (EMPTY) + o*45 (“WALL - MWALL (EMPTY))
Using this procedure the tunnel calibration curve in figure 29, was developed for the tare runs. The test section Mach number is set via a preselected test section MW which will give the appropriate freestream Mach number.
The Mach number calibration with the blades installed was obtained in a manner identical with that described above for the tare runs. The empty tunnel data was the same as
for the tare calibration. The installed PTR calibration data was taken with the propel- ler windmilling. This was done to allow the blades to exhibit their solid body blockage while not inducing flow through the propeller. These calibration data are presented in figure 30. The final test section Mach number calibration shown in figure 31, was then set and maintained during each Prop-Fan power condition.
13
I -

STRESS SURVEY
Prior to the start of the aerodynamic test program, a range of blade angles .and Mach numbers was selected for a stress survey test of the propeller. The extremes in blade angle, Mach number and rotational speeds that were selected for the survey are shown in figure 32. The sloped lines connect constant windmilling blade angle points. For example, at a blade angle of 55O this propeller windmilled at 3500 rpm at 0.4 Mach number and 7700 rpm at 0.84 Mach number. All blade angles were tested to either a blade structural or a rig mechanical limitation of 450 N-M (330 ft-lbs) of torque or 9000 rpm whichever occurred first. Table I is a summary of the stress data from two blades that were measured with the gages located as shown in figure 33. The two blades were identically gaged.
The strain gage recordings were played back on to Sanborn records. Analysis of these data confirmed that all stress measurements were acceptable and well within allowable limits . During some of the lower rpm runs with the model blades oriented in reverse thrust, the strain signals were generally “noisy”, i.e. the traces exhibited spikes. At higher speeds, this “noise” was not evident. In general, however, stresses measured in reverse thrust tended to vary at a constant tunnel operating condition and at a some- what higher level than forward thrust but still well within limits.
Visicorder records were made for some of the test conditions to identify the frequency orders of the stress signals. These records confirm the expected presence of the 2P first flatwise bending mode critical speed near 4300 rpm as shown on figure 34. Table I lists the stresses measured for selected points including points closest to the design point, at the maximum reverse thrust level and near the 2P first flatwise mode critical speed of 4300 rpm.
The 2P excitation resulted from the two aerodynamic instrumentation rakes located about 15.24 cm (6 inches) downstream of the blades (figure 22). Excitation at 1P could be due to gravity loads as well as the rakes. In reverse thrust there was a trace of a shear stress near 600 Hz, which is close to the calculated first mode natural frequency of 8000 rpm. Response at these natural frequencies is not unusual during reverse thrust in a turbulent environment. In summary, the measured stress were entirely acceptable and disclosed no new or unusual vibration characteristics.
PROPELLER FORCE MEASUREMENTS
As described previously the Prop-Fan model was tested in the pressence of the nacelle to allievate compressibility loss in the blade root sections. Also, as shown in the section entitled “Propeller Test Rig”, the propeller blades and spinner were the only
14

model components on the metric portion of the PTR. The simulated axisymmetric nacelle was attached to the ground portion of the model. With this force measurement arrangement it has been shown in reference 24 that the propeller net thrust cannot be directly measured on the force balance. This occurs because, as discussed in both references 24 and 25, when a propeller is run in the presence of a nacelle body a mutual inte.raction occurs between the propeller and body. This interaction causes an increase in propeller thrust, and a corresponding increase in the pressure drag on the body behind the operating propeller. This increased propeller thrust has been classical- ly called “apparent thrustff and is the major force component measured by the PTR balance. It has been previously demonstrated, however, that this increase in propeller thrust is exactly equal to the corresponding increase in the pressure drag of the nacelle (references 24 and 25). Therefore the desired “net thrust” of the propeller can be obtained by evaluating the change in the pressure drag of the non-metric nacelle and by applying this correction to the measured apparent thrust. This then was the procedure used in this test.
The “net” propeller thrust is defined as the propulsive force of the blades operating in the presence of the spinner and nacelle flow field without the increase in thrust due to the mutual interaction. This thrust is analogous to the traditional “isolated” propeller thrust.
With the present model force arrangement the balance measures the algebraic sum of the apparent thrust, spinner drag, and internal pressure area forces. Therefore, to resolve these forces, a series of model tare tests were made first without the pro- peller blades to evaluate the external spinner aerodynamic drag and the nacelle pres- sure drag.
FORCE BALANCE (FB)
“S = FB - Z PAINT
0 NT = J (PdAIT
15

In these tare tests the spinner for the performance testing was replaced by the previous- ly mentioned “dummy” spinner made without the holes for the blades. A special series of experimental runs were made to define the spinner aerodynamic and nacelle pres- sure drag at the same tunnel Mach numbers and model speed (RPM) conditions that would be tested with the propeller blades. As shown in the above sketch, the spinner drag was measured directly from the force balance with a correction for the internal spinner base pressure area forces. The nacelle pressure drag (DN), was determined by pressure integration of the longitudinal row of area-weighted pressure orifices.
With the blades installed and thrusting the force balance then measured the algebraic sum of the apparent thrust, the spinner drag, and again the internal pressure area terms. The model forces are as shown in the following sketch:
47 TAPP
I I “N
FORCE BALANCE (FB)
Therefore the apparent thrust of the propeller was obtained directly as shown in the following equation:
T~pp = FB - C PAINT + Ds
DN = I(pdA) NACELLE
Then since the nacelle tare pressure drag, DNT, was determined previously the change in pressure drag on the nacelle was calculated directly:
ADN=DN -DN T
Finally the net thrust was found by subtracting the change in nacelle pressure from the apparent thrust :
TNET = TAPP - A DN
16
Once the net thrust of the propeller is known then a simple estimate of a typical complete nacelle drag will result in a rapid means of estimating the complete propulsion system uninstalled thrust-minus-drag performance. A simple estimate of the nacelle drag can be made using the slenderness ratio and wetted areas based on the geometry of both the spinner and nacelle, i.e. reference 26. The drag of the wetted surface aft of the blades is then based on the local flow conditions exiting the propeller.
A sketch of the model configuration and the propeller test rig was shown previously in figure 18. The dummy spinner, the “pie-plate” and the propeller test rig internal pres- sure and areas are identified. As mentioned above, the rig internal pressure measure- ments are used to correct for the pressure forces acting on the load cell. The internal pressures result in a net upstream force acting on a surface area equivalent to the “pie- plate” base area.
The tare forces for the dummy spinner thrust and torque and nacelle drag that were used in the final data reduction are shown in figure 35, 36, and 37 respectively. The spinner axial force is not referenced to ambient static measure and therefore at M=O a large axial force is shown. These corrections were found to be independent of the dummy spinner rotational speed and as shown on each tare varies with the freestream Mach number. The spinner thrust tare is shown in figure 35 for freestream Mach numbers between 0.10 and 0.90. This tare force represents the pressure force on the external part of the spinner and “pie plate”. The spinner torque tare is shown in figure 36. This correction represents the amount of torque required to rotate the spinner and is removed from the torque measurements made for the performance runs. The nacelle force is shown in figure 37, and represents the pressure force without the blades pre- sent on the length of nacelle downstream of the “pie plate” and to the point of minimum diameter. The pressure force results in an upstream or thrust force on the incremen- tal length of nacelle.
Each of the tare values; thrust, body force, and torque were corrected to the tunnel total relative pressure such that,
Thrust Tare = Measured Tare/ d
where,
d =Po/ 10.332~10~
PO = tunnel total pressure
10.332 x 102 = Standard atmospheric pressure, kg/m2
and in this way the tare values could be corrected to the tunnel conditions as they existed during the performance runs.
17

RESULTS AND DISCUSSION
Basic Force Data
All of the basic force data were reduced to terms of power coefficient, net efficiency and advance ratio. Figures 38a-g contain these data in terms of net efficiency maps for specific Mach numbers. It is appropriate to define the efficiency that was used in the data reduction. The net efficiency is defined as:
rl net = Thrust net x Tunnel Velocity
SHIP
where
t7 net = net efficiency Tunnel Velocity = Free&ream velocity
SHP = Shaft power
As pointed out previously, net thrusts and efficiencies are used in this report. Super- imposed on figures 38a and f are calculated performance for their respective Mach numbers . These will be discussed in a later section.
From an inspection of these plots, it is apparent that the power coefficient data form smooth curves and exhibit little variability with advance ratio at a constant blade angle. Under ideal conditions, the variation of peak efficiency with blade angle should form a smooth continuous envelope as analytical trends indicate. A perusal of the data shows that the test peaks do not form smooth envelopes and show a variation of from one to one and a half percent near peak. This is not unusual and has been noted in previous propeller tests. It must be remembered that very small changes in thrust, usually within experimental accuracy, can result in significant changes near peak efficiency and therefore cause point to point variation in the data. Nevertheless, the small variation noted above indicates the excellent quality of the PTR metric system. Another indication of the excellent repeatability of the system is a comparison of the performance for a limited number of repeat runs shown in figure 39. Theoretically, all these data runs should form a single efficiency and a single power coefficient curve. In reality, although the power coefficient data do form a single line, there is scatter in the efficiency line of up tc two percent. Thus, it would appear that any individual efficiency line or any map is accurate to within one percent.
18

Superimposed on figure 38a is the calculated performance at a Mach number of 0.2 with the design point indicated. It is obvious that there is a difference between the calculated and measured blade angles of 3 degrees. The reasons for this difference will be discussed in the diagnostic section. It may, also be noted that the ,measured efficiency is 4.5 percent greater than the estimated efficiency at the design point. The calculated and measured performance at 0.8 Mach number is shown in figure 38f. Here the difference is blade angle between calculated and measured is 5 degrees and unlike the 0.2 Mach number the measured efficiency is almost 3 to 4 percent lower than calculated. Although the levels of the calculated Cp and efficieny lines are different, the slopes and shapes are almost identical.
Al1 of the above data were obtained with the gaps and openings between the blades and hub unsealed to preclude any mechanical binding between the blade and the hub during the testing. These gaps are proportionately larger for themodel than they would be for the full scale hardware. The measured gap/chord ratio for the model was 0.01424 at the leading edge while the equivalent gap/chord ratio for the full scale design would be 0.00182. Moreover the blade angle mis-match noted above, resulted in a misalign- ment of the blade root and spinner platform which could adversely effect efficiency. Near the conclusion of the test, a special run was made with all the gaps and openings around the hub and blades sealed with an RTV compound. The effect of this sealing on aerodynamic performance is shown in figure 40 for both efficiency and power co- efficient. With the gaps sealed, the flow separation from the mis-matched blade root section and spinner platform as well as the large opening around the blades is allevi- ated, resulting in a lower power absorption and a higher net efficiency by almost one percent at advance ratios from 3.1 to 3.7.
Before reviewing the details of the test results, it is interesting to compare the ex- pected and actual performance trends. Previously, the best measured propeller per- formance was the blade TlCl of reference 17. The variation of isolated peak efficiency versus Mach number is shown as the dashed line of figure 41. Note the rather sharp drop in efficiency beyond a Mach number of 0.6. The peak net efficiency of the swept blade of this test is shown as the solid line with symbols. Here a very gradual de- crease in efficiency can be seen beyond a Mach number of 0.6. The initial difference in peak efficiency between the two propellers is primarily associated with the higher induced losses due to the large difference in power loading (see figure 7). Thus, sweeping the blade apparently reduced the severe compressibility losses beyond 0.6 Mach number associated with a straight blade.
A comparison between the calculated and measured performance at two levels of the dimensionless parameter Cp/J3 is shown in figure 42. The lower value of Cp/J3 corresponds to Cp’s near peak efficiency while the higher value corresponds to the design CP (1.7). The shape of the surves appear to be similar. Therefore, based on these results the present performance prediction method for swept blades overestimates
19
the performance at high Mach numbers and underestimates the performance at low Mach numbers. It is also interesting to note that tip relative Mach numbers start to exceed unity at a free stream Mach of 0.70 indicating that the accounting for compress- ibility losses in the design analysis may need to be refined.
Cruise Performance
Since the prime objective of this test program was to determine the net efficiency at 0.8 Mach number and tunnel operating conditions corresponding to 10.67 km (35000 ft) altitude and power loadings in the region of 301 kw/m2 (37.5 SHP/D2), the data in figure 38f represents the most important data of the test program. The design cruise condition is a Cp of 1.7 and a J of 3.06 at 0.8 Mach number. This point along with the calculated net efficiency of 78.9 percent has been noted on the figure. These data have been converted to efficiency and power loading in figure 43. Shown on this figure are the calculated and measured performance for a tip speed of 243.8 m/s (800 ft/sec) and an altitude of 10.67 km (35,000 ft). The calculated and measured performance are generally parallel to each other with the calculated data approximately 1.8 percent higher at the design point. With the gaps between the spinner and blades sealed, the efficiencies shown by the dashed line of figure 43 are indicated. These data are an extrapolation of the data of figure 40. At the design point an efficiency of 78.2percent maybe achieved in the gaps sealed condition. This is only 0.7 percent below the design value of 78.9. This is a remarkable achievement for the first swept model in view of the uncertain aspects of the design procedure discussed previously. The figure also shows that the efficiency goal of 80 percent can be attained at a power loading of 220 kw/ma (27.5 SHP/D2)
Further study of the data near the design condition were undertaken to establish the effect on cruise performance of variations in tip speed, power loading and flight Mach number. Figure 44 shows the effect of tip speed on net efficiency at 0.80 Mach number for a range of power loading. The plot shows a negligible effect of tip speed between 243.8 (800) and 259.1 m/s (850 ft/sec) tip speed at the design power loading. The test data at 228.6 m/s (750 ft/sec) do not extend to the design point. The calcu- lated performance would indicate that the 228.6 m/s (750 ft/sec) line should cut below the 243.8 m/s (800 ft/sec) line at higher power loadings. Thus a tip speed of from 243.8 (800) to 259.1 m/s (850 ft/sec) is optimum for this propeller design at 0.80 Mach number and this design condition. At other conditions the optimum tip speed may vary from the values shown here. Both figure 43 and 44 show that the net efficiency increases from 77.7 to 80 percent when the power loading is reduced to 220 kw/m2 (27.5 SHP/D2). Figure 45 shows the effect on net efficiency of operating at the design tip speed with a variation in flight Mach number. This curve indicates that at the design power loading, increasing flight Mach number to 0.85 reduces net
20
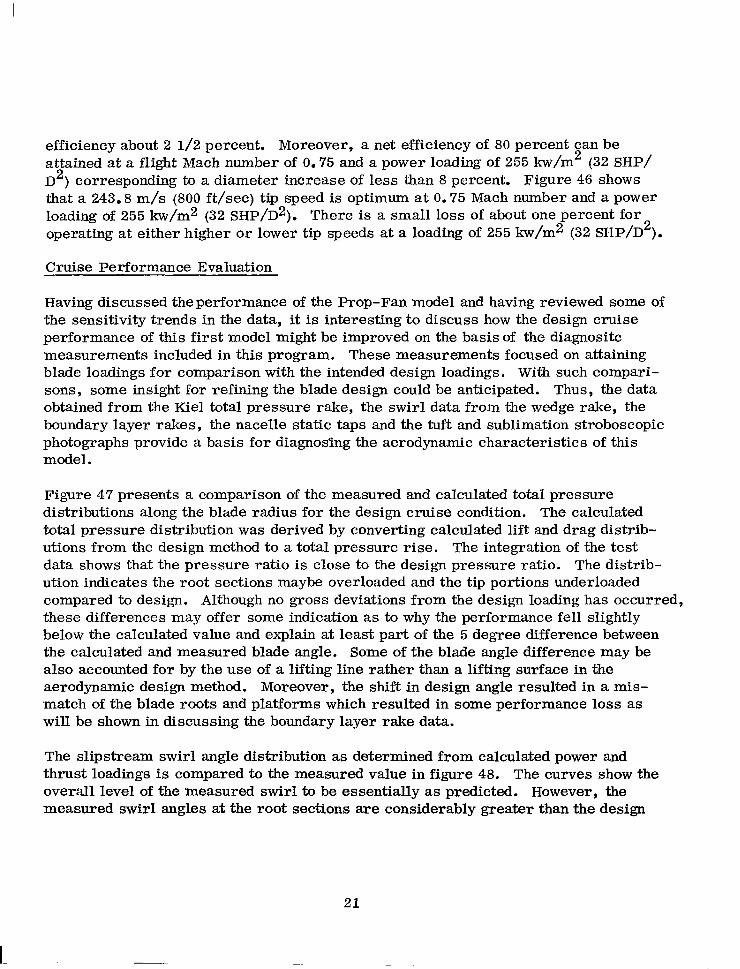
efficiency about 2 l/2 percent. Moreover, a net efficiency of 80 percent can be attained at a flight Mach number of 0.75 and a power loading of 255 kw/m2 (32 SHP/ D2) corresponding to a diameter increase of less than 8 percent. Figure 46 shows that a 243.8 m/s (800 ft/sec) tip speed is optimum at 0.75 Mach number and a power loading of 255 kw/m2 (32 SHP/D2). There is a small loss of about one percent for operating at either higher or lower tip speeds at a loading of 255 kw/m2 (32 SHP/D2).
Cruise Performance Evaluation
Having discussed the performance of the Prop-Fan model and having reviewed some of the sensitivity trends in the data, it is interesting to discuss how the design cruise performance of this first model might be improved on the basis of the diagnositc measurements included in this program. These measurements focused on attaining blade loadings for comparison with the intended design loadings. With such compari- sons, some insight for refining the blade design could be anticipated. Thus, the data obtained from the Kiel total pressure rake, the swirl data from the wedge rake, the boundary layer rakes, the nacelle static taps and the tuft and sublimation stroboscopic photographs provide a basis for diagnosmg the aerodynamic characteristics of this model.
Figure 47 presents a comparison of the measured and calculated total pressure distributions along the blade radius for the design cruise condition. The calculated total pressure distribution was derived by converting calculated lift and drag distrib- utions from the design method to a total pressure rise. The integration of the test data shows that the pressure ratio is close to the design pressure ratio. The distrib- ution indicates the root sections maybe overloaded and the tip portions underloaded compared to design. Although no gross deviations from the design loading has occurrec these differences may offer some indication as to why the performance fell slightly below the calculated value and explain at least part of the 5 degree difference between the calculated and measured blade angle. Some of the blade angle difference may be also accounted for by the use of a lifting line rather than a lifting surface in the aerodynamic design method. Moreover, the shift in design angle resulted in a mis- match of the blade roots and platforms which resulted in some performance loss as will be shown in discussing the boundary layer rake data.
The slipstream swirl angle distribution as determined from calculated power and thrust loadings is compared to the measured value in figure 48. The curves show the overall level of the measured swirl to be essentially as predicted. However, the measured swirl angles at the root sections are considerably greater than the design
21
I-

values. This further strengthens the previous indication that the inboard portions of the blade were overloaded.
As discussed above, the measured total pressure distribution and slipstream swirl distribution as well as the 5 degree. design blade angle discrepancy indicates a blade loading variation from the design value which might explain the net efficiency being below the design value. Moreover, the tuft and sublimation material applied separately to the blades, tend to confirm this observation. The tufts were made from .05mm (. 02 in) diameter white cotton thread cut to approximately . Olm (. 5 inch) lengths and spot glued to the blade. The sublimation material consisted of a saturated mixture of acenapthelene and acetone applied to the blade with a conventional spray gun. Figures 49 and 50 present stroboscopic photographs of tuft patterns on the pressure and suction sides of the blade respectively while operating at a @ref of 60’ and 0.8 Mach number. Examination of these photos shows that the pressure side is operating as expected. However, the photo of the suction side indicates a flow abnormality over the aft 20 to 30 percent of the chord from about the second to fifth. row (outboard) of tufts covering the area approximately between the 40 to 70 percent of the blade radius. This further tends to confirm the overloading indicated by the total pressure and swirl rakes in this area and implied by the increased blade angle requirement. The sublimation photos, figures 51 and 52 of the same blade angle and Mach number again show no flow problem on the pressure side of the blade at the blade tip. However, the presence of small airborne dust particles adhering to the blade have tripped some of the flow from laminar to turbulent. Moreover, there appears to be some turbulence over the entire tip of the leading edge. The suction side photo also shows the presence of dust particles which have tripped the flow in several locations over most of the blade radius. Darkened areas near the blade mid-span and trailing edge indicate a flow disturbance in the general area where the tufts indicated a similar disturbance. Thus these diagnostic observa- tions tend to confirm that the blade loading was not as desired. Therefore it would appear that the performance of this model might be improved by retwisting and recam- bering the blades such as to load up the tips and unload the inboard portions and by im- proving the blade to spinner juncture. Moreover, the test data indicates some residual compressibility loss at tunnel Mach numbers above 0.6. Thus a revised sweep may further increase net efficiency at the design condition.
Take-off Climb
A comparison of the test results and calculated performance has also been made at 0.2 M. N. corresponding to take-off climb and is presented in figure 38a. Again, the test data are shown as net efficiency and power coefficient as a function of advance ratio for a range of blade angles with the calculated performance super?mposed.
22

Since the advanced turboprop core is sized by cruise requirements, the lapse rate of the engine determines the power available at take-off. Based on the cruise loading of 301 kw/m2 (37.5 SHP/D2) and a representative core characteristic, a power load- ing of 577.9 kw/m2 (72 SHP/D2) at 243.8 m/s (800 ft/sec) at sea level ISA repre- senting a Cp of 1.0 and a J of 0.878 at Mach 0.20 was selected for this model. This condition occurs at a fi ref of 38 degrees compared to a calculated value of 35 degrees. As for the. cruise condition, the calculated and test blade angles differ significantly, although considerably less than in cruise. The data in terms of thrust per horsepower and power loading at sea level and 243.8 m/s (800 ft/sec) tip speed are shown in figure 53. In this case, the test results are approximately 10 percent higher than calculated. In figure 54 the take-off climb performance is presented as thrust per horsepower as a function of velocity at two tip speeds. The corresponding calculated performance is shown for comparison. These curves indicate that the performance increase over the predicted values at 0.2 Mn pointed out in the previous figure is extended over the entire take-off climb range. The effect of increased tip speed at take-off is generally as predicted.
These test data indicate excellent take-off and climb performance for a Prop-Fan driven transport aircraft. Moreover, the i,mplied capability for higher aircraft climb angles should reduce airport community noise and aircraft fuel consumption during this portion of the mission.
Reverse Thrust
In view of the importance of reverse thrust capability of the propulsion system on transport aircraft, the reverse thrust characteristics were briefly investigated at 0.15 Mach number. The blade angle was set at -8.5 degrees. Due to mechanical interfer- ence, this was the maximum reverse blade angle that could be achieved with the model Prop-Fan. The test results are presented in figure 55 in terms of power and thrust coefficients as a function of advance ratio. In figure 56 these data have been replotted in terms of thrust per horsepower and power loading for the design tip speed of 243.8 m/s (800 ft/sec). The predicted performance is included for comparison. Again the test data indicate thrust loads well above the predicted values. Although the power loading achieved in the testing was limited by the low reverse blade angle, the reverse thrust to power ratio level corresponding to a power loading only 20 percent of the take-off level is greater than the positive thrust at 0.2 Mn. Thus the small diameter Prop-Fan is capable of producing the large breaking force required for transport aircraft.
23

Feather Drag
As part of the testing, the feather drag of the Prop-Fan was measured. The results are shown in figure 57 where the drag coefficient of the feathered model is presented as a function of Mach number. The corresponding calculated drag data have been included for comparison. It is noted that the drag coefficient, based on disc area, increases slightly with Mach number. This trend is similar to the calculated trend. However, the slight decrease in the measured drag coefficient at 0.85 Mn is un- explained. In the cruise Mach number range between 0.75 and 0.85, the test data show feather drags to be within 8 percent of the predicted values.
Pressure Data
The purpose of the internal rig static pressure measurements was to adjust the thrust load cell readings to establish the Prop-Fan net efficiency as previously discussed. The purpose of the Kiel probe, boundary layer and wedge rakes was to provide diag- nostic data along with the blade tuft and sublimation pictures to aid in interpreting the test results and to provide a guide for modifying the blade design for improved per- formance. These pressure data were to provide the radial loadings behind the model Prop-Fan, establish the axial Mach number distribution on the nacelle and provide a measure of the blade root gap losses. The pressure instrumentation required to obtain this information has been previously described but is listed below. The required instrumentation included a total pressure Kiel rake, two boundary layer rakes and a line of static pressure taps along the nacelle. Many thousands of pressure points were taken. It would be impractical and impossible to present all of these data in this report. Thus, only a representative sample of each measurement is shown.
Nacelle Statics
Figure 58 shows the axial Mach number distribution on the nacelle from the static taps. Shown in the figure is the distribution at 0.8 Mach number with and without the blades and 0.2 Mach number with the blades. The difference in pressures with and without the blades is the mN, a “buoyancy force”, which must be subtracted tc obtain the net thrust. Superimposed on the figure is the calculated variation of Mach number at 0.8 Mach number. In neither 0.8 Mach case did the large predicted sonic bubble ap- pear. The peculiar upsweep of the data at the leading edge is not understood but may be associated with local flows developed in running the rig. Since the large sonic bub- ble did not occur, sonic losses on the body are smaller than originally estimated. Figure 59 shows the effect of freestream Mach number on surface Mach number while
24

operating at a J near 3.0 and constant blade angle. As might be expected, the sur- face Mach number increases and decreases with freestream Mach. Note that the sonic bubble disappears entirely at a Mach number of 0.75 whereas the sonic bubble covers forty percent of the nacelle at a Mach number of 0.85. This implies large shock losses at 0.85 Mach number. Figure 60 shows the effect of changing blade angle at a constant Mach number and almost constant rpm while figure 61 shows the effect of changing J at a constant blade angle and freestream Machnumber. Obviously, the latter two changes have little effect on surface Mach number.
Kiel Rake
The variation of total pressure rise with radius for various operating conditions is shown in figures 62, 63, 64 and 65. These measurements were made with a Kiel rake located approximately one blade chord width downstream of the Prop-Fan. Ln none of these distributions is there a large pressure perturbation indicating an ab- normality in the loading distribution. Each curve shows a smooth and uniform radial variation from the inner most tube to the edge of the slipstream, 0.31m (12.38 in).
Figure 62 shows the effect of changing blade angle while maintaining a constant free stream Mach number and almost constant tip speed. Since the loading at a given speed decreases with decreasing blade angle, the pressure ratio is also lower. This is also true of figure 63 which shows the effect of rpm at a constant blade angle and Mach number. As in the case of blade angle, decreasing rpm unloads the blade and, therefore, decreases pressure ratio.
Figure 64 shows the effect of varying Mach number at a constant blade angle and almost constant tip speed. While the loadings at Mach numbers of 0.8 and 0.75 are very close to each other, the loading at 0.85 is suppressed. This is also the Mach number at which the efficiency begins to fall rapidly. Thus, this lower loading may be an indication of increased compressibility losses on the blade.
The final figure of this series, figure 65, shows the pressure ratio distribution at the design take-off and cruise conditions. The integrated values are close to each other although the 0.20 Mach does peak at a higher ratio.
25
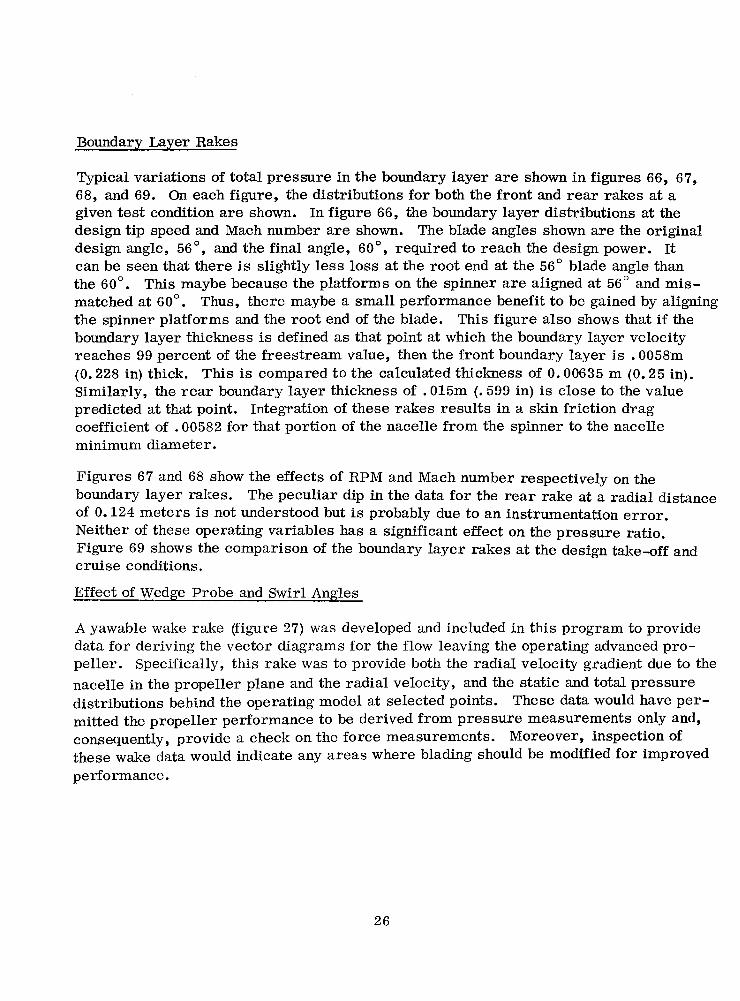
Boundary Layer Rakes
Typical variations of total pressure in the boundary layer are shown in figures 66, 67, 68, and 69. On each figure, the distributions for both the front and rear rakes at a given test condition are shown. In figure 66, the boundary layer distributions at the design tip speed and Mach number are shown. The blade angles shown are the original design angle, 56 ‘, and the final angle, 60°, required to reach the design power. It can be seen that there is slightly less loss at the root end at the 56’ blade angle than the 60”. This maybe because the platforms on the spinner are aligned at 56” and mis- matched at 60’. Thus, there maybe a small performance benefit to be gained by aligning the spinner platforms and the root end of the blade. This figure also shows that if the boundary layer thickness is defined as that point at which the boundary layer velocity reaches 99 percent of the freestream value, then the front boundary layer is .0058m (0.228 in) thick. This is compared to the calculated thickness of 0.00635 m (0.25 in). Similarly, the rear boundary layer thickness of .015m (. 599 in) is close to the value predicted at that point. Integration of these rakes results in a skin friction drag coefficient of .00582 for that portion of the nacelle from the spinner to the nacelle minimum diameter.
Figures 67 and 68 show the effects of RPM and Mach number respectively on the boundary layer rakes. The peculiar dip in the data for the rear rake at a radial distance of 0.124 meters is not understood but is probably due to an instrumentation error. Neither of these operating variables has a significant effect on the pressure ratio. Figure 69 shows the comparison of the boundary layer rakes at the design take-off and cruise conditions.
Effect of Wedge Probe and Swirl Angles
A yawable wake rake (figure 27) was developed and included in this program to provide
data for deriving the vector diagrams for the flow leaving the operating advanced pro-
peller . Specifically, this rake was to provide both the radial velocity gradient due to the
nacelle in the propeller plane and the radial velocity, and the static and total pressure distributions behind the operating model at selected points. These data would have per-
mitted the propeller performance to be derived from pressure measurements only and, consequently, provide a check on the force measurements. Moreover, inspection of these wake data would indicate any areas where blading should be modified for improved performance.
26
Unfortunately, the configuration of this rake produced some unexpected flow interference effects which influenced all the force and pressure measurements. For example, figure 70 shows a significant reduction in the total pressure sensed by the Kiel rake due to the presence of the wedge probe. It will be recalled from figure 23, that the wedge probe was located 135 azimuthal degrees away from the Kiel rake. Moreover, the total pres- sures sensedbythe wedge probe yield yet a third level of total pressure. Thus, the pres- ence of the wedge probe not only influenced the Kiel rake pressures but also the wedge probe total pressure sensors. Similarly figure 71 shows the effect of the wedge probe rake on the nacelle Mach number distribution. Clearly, the sonic region is increased by the presence of the wedge probe rake. Yet only a small effect was noted as shown in figure 72 on the boundary layer rakes. The presence of the wedge probe rake on measured performance was correspondingly severe. For example, at the design condition, the power was reduced approximately 1 percent, the net thrust nearly 5 percent with the net efficiency down about 4 percent. Only the flow direction measure- ments shown in figures 73 and 74 are considered to be reasonably valid.
The cause of the interference is not fully understood but probably is associated with the blockage and possible circulation due to the large airfoiled support strut pictured in figure 27. In view of this situation, the decision was made to ignore the data ob- tained with the wake rake installed except for the swirl data presented above. Accordingly, the wedge probe and wall mount were removed and the test completed.
27

CONCLUSIONS
Based on the test results, the following conclusions may be reached:
1. The initial model design achieved a net efficiency of 78.2 percent at the design point of Mach 0.8, a tip speed of 243.8 m/s (800 ft/sec) and a power loading of 301 kw/m2 (SHP/D2 = 37.5).
2. The data indicates that the design goal of 80 percent can be achieved with a slight reduction in power loading.
3. The diagnostic data indicates that the blade was not operating as designed. The blade was overloaded in the inboard region at curise conditions and was operating with possibly some flow separation. To acheive design power, a 5O increase in blade angle was required. (A redesigned blade should offer the possibility of improved cruise performance.)
4. The take-off and climb performance of the initial model exceeded the estimated performance by almost 10 percent in thrust per power.
5. The reverse thrust exceeded estimated performance and indicates the full- scale advanced turboprop would provide adequate braking.
28

AF -
b -
CLD -
CQ -
CP -
CT -
D -
dCp/d(r/R) -
dCT/d(r/R) -
J -
M-
n -
P -
PTR -
r -
R-
SHP -
T -
LIST OF SYMBOLS
/
1.0 blade activity factor = 100000 b/D(X)3 dr
16 Hub/tip
elemental blade chord, meters
elemental blade design lift coefficient
integrated design lift coefficient =
power coefficient = P/PnSD5
thrust coefficient = T/pn2D4
tip diameter, meters
elemental power coefficient - (Cp=~dCp/d(r/W)
elemental thrust coefficient - (CT=ldCT/d(r/R))
advance ratio, V/nD
freestream Mach number
rotational speed, revolutions per second
power
propeller test rig
blade sectional radius, meters
blade tip radius, meters
shaft horsepower
thrust (as defined in text), newtons
29

LIST OF SYMBOLS (Continued)
t - elemental blade thickness, meters
v - freestream velocity, meters per second
X- blade fractional radius (r/R)
r/R - blade fractional radius
BREF - blade angle at the 77.7% blade radius, degrees,
(B3/4 R= flref + lo)
t7 - efficiency (as defined in text)
30

REFERENCES
1. Task Force Report, “Aircraft Fuel Conservation Technology”, NASA Office of Aeronautics and Space Technology, NASA, Washington, D.C., September 10, 1975.
2. G. Kraft and W. Strack, “Preliminary Study of Advanced Turboprops for Low Energy Consumption. I1 NASA TM X-71740, 1975.
3. “Energy Consumption Characteristics of Transports Using the Prop-Fan Con- cept. I1 D6-75780, Boeing Commercial Airplane Co., October 1976; also NASA CR-137937.
4. R. Hirschkron and R. E. Neitzel, “Alternative Concepts for Advanced Energy Conservative Transport Engines. ” SAE Paper 760536-SAE Air Transportation Meeting, May 1976.
5. R. E. Neitzel, R. Hirschkron, and R. P. Johnston, “Study of Unconventional Aircraft Engines Designed for Low Energy Consumption. ‘I R76AEG597, General Electric Co., December 1976; also NASA CR-135136.
6. D. E. Gray and J. W. Witherspoon, “Fuel Conservative Propulsion Concepts for Future Air Transports. ” SAE Paper 760535-SAE Air Transportation Meeting, May 1976.
7. D. E. Gray, fStudy of Unconventional Aircraft Engines Designed for Low Energy Consumption. I1 PWA-5434, Pratt and Whitney Aircraft, June 1976; also NASA CR-135065.
8. J. A. Stern, “Aircraft Propulsion - Key to Fuel Conservation: An Aircraft Manufacturer’s View. It SAE Paper 760538-SAE Air Transportation Meeting, May 1976.
9. R. L. Foss and J. P. Hopkins, “Fuel Conservative Potential for the Use of Turboprop Powerplants, ” SAE Paper 760537-SAE Air Transportation Meeting, May 1976.
10. J. P. Hopkins and H. E. Wharton, ‘Summary Report: Study of the Cost/Benefit Tradeoffs for Reducing the Energy Consumption of the Commercial Air Trans- port&ion System, ” NASA CR-137927, August 1976.
11. J. P. Hopkins and H. E. Wharton, “Final Report: Study of the Cost/Benefit Tradeoffs for Reducing the Energy Consumption of the Commercial Air Trans- portation System, I1 NASA CR-137926, August 1976.
31
L.

REFERENCES (Continued)
12. R. E. Coykendall, et al. , Y%udy of Cost/Benefit Tradeoffs for Reducing the Energy Consumption of the Commercial Air Transportation System. It United Air Lines, Inc., June 1976; also NASA CR-137891.
13. F. W. Gobetz and A. A. LeShane, ‘Cost/Benefit Trade-Offs for Reducing the Energy Consumption of Commercial Air Transportation (RECAT). II UTRC-R76-912036-17, United Technologies Research Center, June 1976; also NASA CR-137878.
14. F. W. Gobetz and A. P. Dubin, “Cost/Benefit Trade-Offs for Reducing the Energy Consumption of Commercial Air Transportation: Final Report, If NASA CR-137877, June 1976.
15. C . Rohrbaoh and F. Metzger, “The Prop-Fan, A New Look in Propulsors’l, AIAA No. 75-1208, AIAA/SAE 11th Propulsion Conference, Anaheim, California, September 29, 1975.
16. B. S. Gatzen and S. M. Hudson, “General Characteristics of Fuel Conservative Prop-Fan Propulsion System”, SAE Preprint 751085, 1975 Aerospace Engineer- ing and Manufacturing Meeting, Los Angeles, California, November 1975.
17. R. M. Grose, “Wind Tunnel Studies of the Effects of Blade Thickness Ratio, Camber and Pitch Distribution on the Performance of Model High-Speed Pro- peller# I, United Aircraft Corporation Research Department Report R-25665-2, June 1955.
18. Henry V. Borst, fSummary of Propeller Design Procedures and Data. Volume 1 - Aerodynamic Design and Installation. I1 Borst (Henry V.) and Associates (USAAMRDL-TR-73-34A-Vol-1; AD-774831), Nov. 1972.
19. S. Goldstein, “On the Vortex Theory of Screw PropelIersff, Royal Sot. (London) Proc. (1929), 440.
20. H. Lanz, “Despription of UAC 12,000 RPM Propeller Test Rig”, United Aircraft Corporation Research Department Report R-14493-1, January 1954.
21. Alan Pope, “Wind Tunnel Testing”, John Wiley & Sons, Inc., 1954.
22. B. Gothert, “Wind Tunnel Corrections at High Subsonic Speeds Particularly for an Enclosed Circular Tunnel”, NACA TMBOO, February 1952.
23. W. J. Wells, “Blockage Corrections for the U . A. C . 8-Foot High-Speed Wind Tunnel”, Reprt M-4500-50, January 14, 1954.
32

REFERENCES (Continued)
24. R. M. Reynolds, R. I. Sammonds and G. C. Kenyon, IIAn Investigation of a Four Blade Single-Rotation Propeller in Combination With an NACA l-Series, D-Type Cowling at Mach Numbers Up to 0.83”, NACA RMA53B06, April 13, 1953.
25. H. Glauert, ttAirplane Propellers, Body and Wing Interference”, Volume IV, Division 2, Chapter VIII or Aerodynamic Theory, W. F. Dinard, editor Julius Springer (Berlin), 1935 (Dover reprint 1963).
26. S. F. Hoener, “Fluid Dynamic Drag’?, 1958.
27. C . Rohrbach, “A Report on the Aerodynamic Design and Wind Tunnel Test of a Prop-Fan Modeltt, AIAA Paper no. 76667.
28. D. C. Mikkelson, et al, “Design and Performance of Energy Efficient Propellers for Mach 0.8 Cruise”, NASA TMX-73612, April 1, 1977.
33
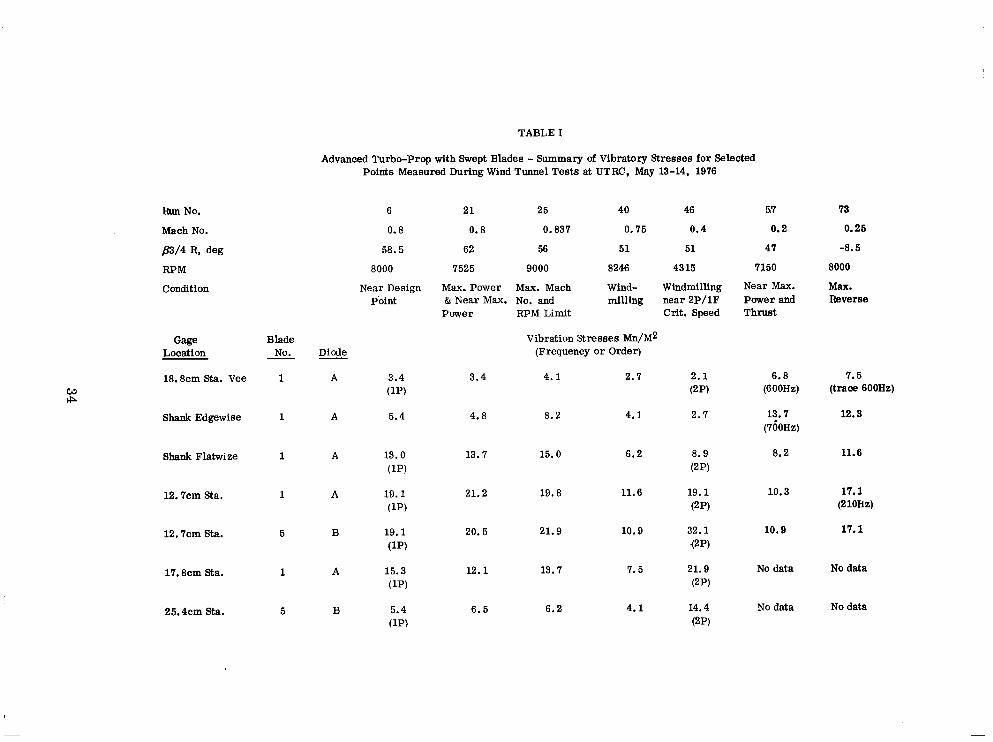
Gage Blade Location No.
18.8cm Sta. Vee
Run No.
Mach No.
83/4 R, deg
RPM
condition
Shank Edgewise 1
Shank Flatwize 1
12.7cm Sta.
12.7cm Sta.
17.8cm Sta. 1
25.4cm Sta. 5
1
5
TABLE I
Advanced Turbo-Prop with Swept Blades - Summary of Vibratory Stresses for Selected Points Measured During Wind Tunnel Tests at UTRC, May 13-14, 1976
Diode
6
0.8
58.5
8000
Near Design Point
3.4 (W
5.4
13.0 (W
19.1 w
19.1 UP)
15.3 W)
5.4 WV
21 25 40 46
0.8 0.837 0.75 0.4
62 56 51 51
7525 9000 8246 4315
Max. Power Max. Mach Wlnd- Windmilling & Near Max. No. and milling near 2P/lF
Power RPM Limit Crit. Speed
Vibration Stresses Mn/M2 (Frequency or Order)
3.4 4.1 2.7 2.1 cm
4.8 8.2 4.1
13.7 15.0 6.2
2.7
8.9 W)
21.2 19.8 11.6 19.1 W)
20.6 21.9 10.9 32.1 iw
12.1
6.5
13.7
6.2
7.5
4.1
21.9 W)
14.4 cw
57
0.2
47
7150
Near Max. Power and Thruet
73
0.25
-8.5
8000
Max. Reverse
6.8 (600Hz)
13.7 (7hOHz)
8.2
7.5 (trace 6OOHZ)
12.3
11.6
10.3
10.9
17.1 (210BZ)
17.1
No data No data
No data No data

60
A0 ’ 0.5 0.6 0.7 0.8 0.9
CRUISE MACH NUMBER
FIGURE 1. VARIATION OF INSTALLED EFFICIENCY WITH CRUISE MACH NUMBER

30
25
2c
1’;
ia
I296.AKM (700 N.MI.)
- \ \
lo-
0-
a-’
iii 6 z 2 - 5 %
In
E A
2-
0 PWA
13%
1296.AKM (700 NMI.)
\ \
GE
26%
7.0%
- - - DOUGLAS LOCKHEED BOEING
(A) FUEL SAVINGS
m 15.65t/LITER
(BOC/GAL)
GE DOUGLAE i
1296.4 KM (700 N. MI.)
5%
3.7
1 I .2%
9 .7 %
mOCKHEED BOEING
(B) DOC SAVINGS
FIGURE 2. FUEL CONSERVATION AND DOC STUDY RESULTS; MO = 0.8 CRUISE
36

FIGURE 3. PROP FAN PROPULSION SYSTEM

100
MACH
21 o-
4
D 1.01
CONV. e PRO?.
I
1.03
ADV. DUCTED TURBO-
a t FANS -
PROP. FANS
I I I I I I 1.3 1.5 2.0 1 .os 1.1 I.2
1 FAN PRESSURE RAT10
FIGURE 4. IDEAL PROPULSIVE EFFICIENCY AS A FUNCTION OF FAN PRESSURE RATIO

90
60
70
60
5a
AXIAL INDUCED - - - - LOSSES (BASIC
MOM. THEORY) I
ALL INDUCED LOSSES I (VORTEX THEORY)
I
I
I
I DESIGN
I LOADING 2 I
I I I I I 0 100 200 300 400 500
POWER LOADING. SHP/D? KW/M2
I I 0 10
I I I 20 30 40
POWER LOADING. SHP/D? HP/FT’
I I SO 60
FIGURE 5. IDEAL EFFICIENCY; 0.8 MACH NUMBER AT 10.668 KM (35,000 FT) ALTITUDE AND 243.8 M/SEC (800 FT/SEC) TIP SPEED
39

UTRC WIND TUNNEL DATA 243.8 M/S (800 FT/SEC) TIP SPEED
10.68 KM (35.000 FT) ISA 2 BLADED, TlCl PROPELLER, REF 17
T
. . .
MACH NUMBER
0 20 40 60 80 100 120 POWER LOADING, KW/M 2
I 0
I 5
SHP/D2
I I 10 15
FIGURE 6. EFFECT OF POWER LOADING ON ISOLATED PROPELLER EFFICIENCY
40

80
70
I/
60
50.
0.8 MACH NUMBER AT 10.68 KM (35,000 FT.) ISA
(800 FT/SEC)
0 40 80 120 160 200 240 280 320 360 400
POWER LOADING, KW/M2
I 0
I 10
I 20
SHP/D’
I I 1 30 40 50
FIGURE 7. VARIATION OF ISOLATED PROPELLER EFFICIENCY WITH POWER LOADING, TIP SPEED AND NUMBER OF BLADES.
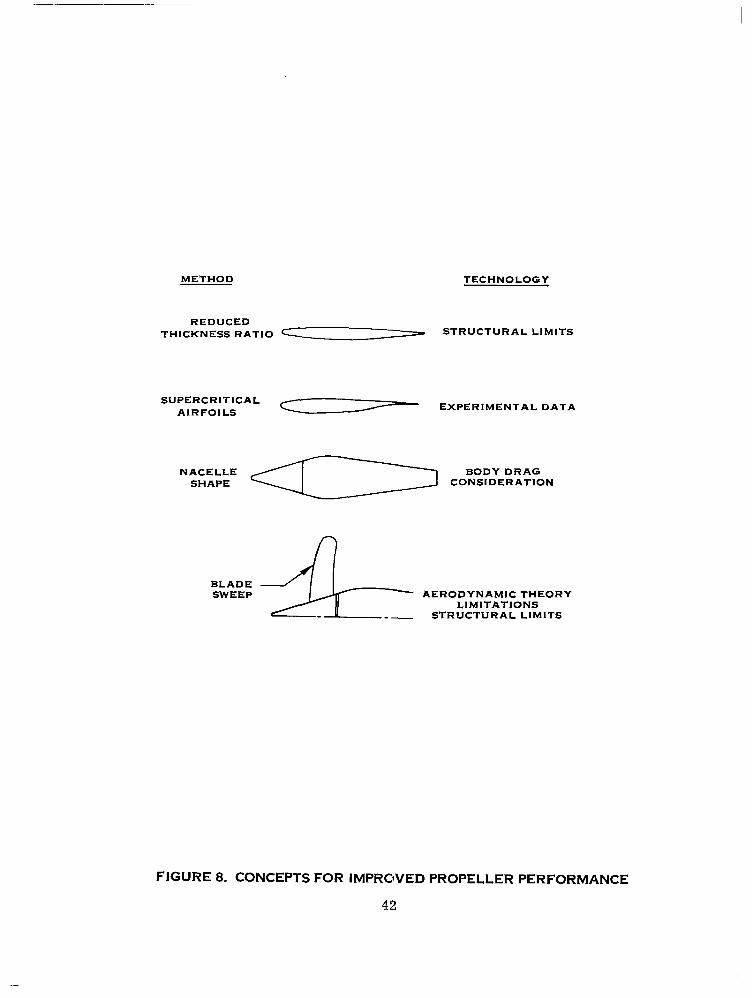
METHOD TECHNOLOGY
REDUCED THICKNESS RATIO cm STRUCTURAL LIMITS
SUPERCRITICAL AIRFOILS
EXPERIMENTAL DATA
NACELLE SHAPE
BODY DRAG CONSIDERATION
BLADE SWEEP AERODYNAMIC THEORY
LIMITATIONS STRUCTURAL LIMITS
FIGURE 8. CONCEPTS FOR IMPROVED PROPELLER PERFORMANCE
42

I
90% -
6 BLADES, 203 ACTIVITY FACTOR, 0.061 CLi TI THICKNESS
0.80 MACH NUMBER IO.68 KM (35,000 %T). ISA 243.8 M/S (800 FT/SEC) TIP SPEED
CRITICAL MACH NUMBERS INTEGRATED NACELLE TIP SWEEP
CRITICAL MACH NUMBERS :SOLATED
60 160 200 240 280 320 360 4
POWER LOADING. KW/U’
I 20
I 30
SHP/D2
I I 40 50
FIGURE 9. PROP-FAN NET EFFICIENCY VARIATION WITH POWER LOADING
43

BLADE
GEOMETRY ----em
PLANFORM
T/B
BODY FLOW FIELD -----em-
v/v0
DESIGN POINT CONDITIONS
------
DIAM. RPM
HP M 0
ALTITUDE
,
TAKE OFF -
GOLDSTEIN - STRIP ANALYSIS
------- COMP. AIRFOIL DATA
CASCADE CORR. COMPRESSOR
TIP 43 - DESIGN
SWEEP
-- i
(ROOT CHOKING)
/’ CRUISE OPTIMUM
LOADING /
(CAMBER AND TWIST) /
I /
FIGURE 10. ADVANCED PROPELLER DESIGN PROCEDURE.
44

8 BLADE/203 ACTIVITY FACTOR/O.081 CL1
0.62 METER DIAMETER, 0.239 HUB/TIP
30
20
2
IO
0
-10
- 0.4
- 0.2
0
“J
0
- -0.2
- -0.4
0.
- 0. 16
0
P
- 0.
e *
- 0
- 0
.20
.I2
.08
.04
0 I
0.239 0.3673 0.449
BLADE FRACTION RADIUS, r/R
FIGURE 11. BLADE CHARACTERISTICS
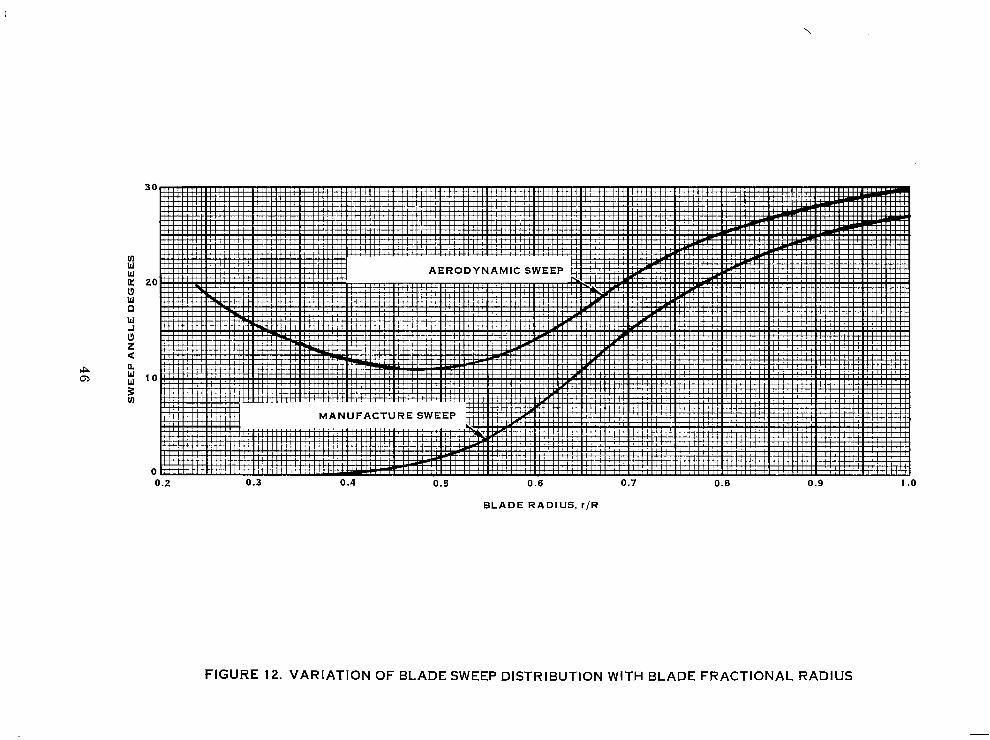
0.6 0.7 0.8 0.9 I .o
BLADE RADIUS, r/R
FIGURE 12. VARIATION OF BLADE SWEEP DISTRIBUTION WITH BLADE FRACTIONAL RADIUS

FIGURE 13. DEVELOPED PLANFORM AND STACKED VIEW

0.80 FLIGHT MACH NUMBER I.
w
: I
0
0 0.1 0.2 0.3 0.4 0.5 0.6 0.7 0.8 0.9
NACELLE LENGTH -METER
FIGURE 14. NACELLE SURFACE MACH NUMBER DISTRIBUTION

2.0-
1.6 -
1.2-
0.8 -
0.4 -
Oh
K L
G B u 0
0.5 0.6 0.7 0.8 0.9 1.0
BLADE RADIUS. r/R
FIGURE 15. VARIATION OF CALCULATED THRUST AND POWER COEFFICIENTS WITH BLADE FRACTIONAL RADIUS

0.80 MACH NUMBER 10,668 M (35,000 FT) ALTITUDE
301 KW/M2 (37.5 SHP/Dz) POWER LOADING
BLADE RADIUS, r/R
FIGURE 16. VARIATION OF CALCULATED SWIRL ANGLE WITH BLADE FRACTIONAL RADIUS

FIGURE 17. UTRC LARGE SUBSONIC WIND TUNNEL b!

SPEED BUMP
F (MSB)
I
L-l I
- I
STATIC TAP .
VlBRATlON PICK-UPS
YDROSTATIC BEARINGS
TACHOMETER PICK-UP
OROUE LOAD CELL
R FAIRING AVE(VENTED TO Pg
FORCE BALANCE
PRESSURE BULKHEAD
L!!Bz!-z
FIGURE 18 PROPELLER DYNAMOMETER DETAIL

FIGURE 19. MODEL IN TUNNEL
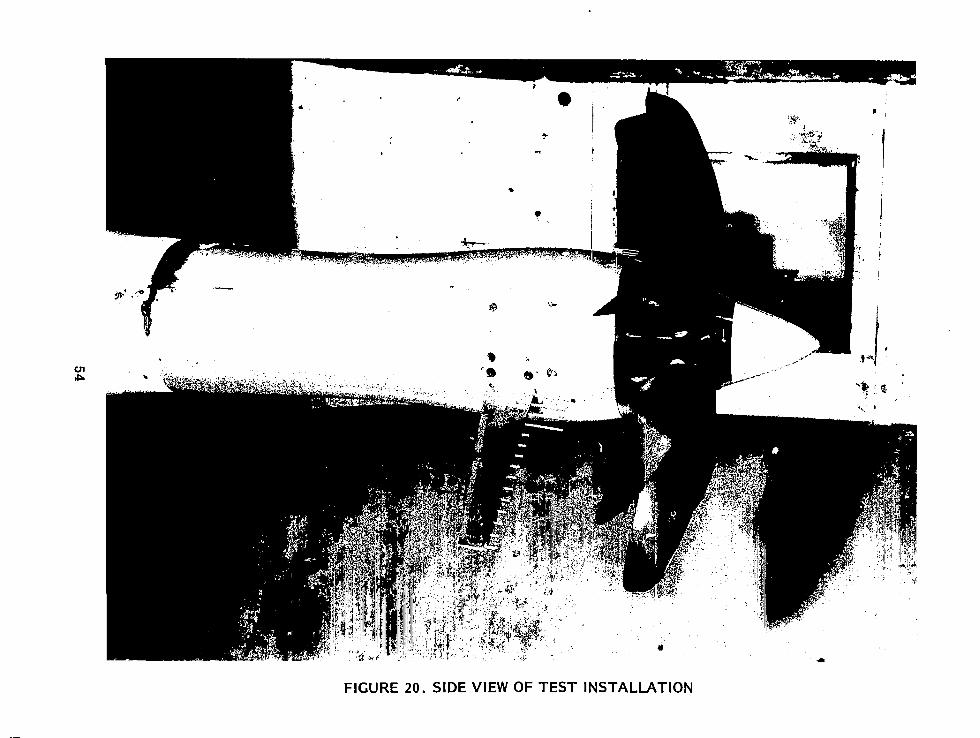
.
FIGURE 20. SIDE VIEW OF TEST INSTALLATION

FIGURE 21. DUMMY SPINNER
55

ONE VELOCITY SWIRL RAKE, POSTION 1 TWO BOUNDARY LAYER RAKES ONE VELOCITY SWIRL RAKE, POSITION 2 TWENTY TWO BODY STATIC TAPS ONE TOTAL HEAD RAKE WITH KIEL PROBES’ SEVEN STATIC TAPS IN BODY
~ TUNNEL WALL
SPINNER
FIGURE 22. INSTRUMENTATION LOCATIONS ON PROPELLER TEST RIG
I WEDGE
RAKE
FIGURE 23. INSTRUMENTATION PLANES (VIEW LOOKING AFT
56

NOTE:
RAKE ALIGNED WITH ESTIMATED SWIRL ANGLE
TUBE NO.
I 0.0008 2 0.0025 3 0.0037 A 0.0050 5 0.0074 6 0.0088 7 0.0126 6 0.0163 9 0.0196
10 0.0228
DISTANCE FROM SURFACE, M
FIGURE 24. FORWARD BOUNDARY LAYER RAKE
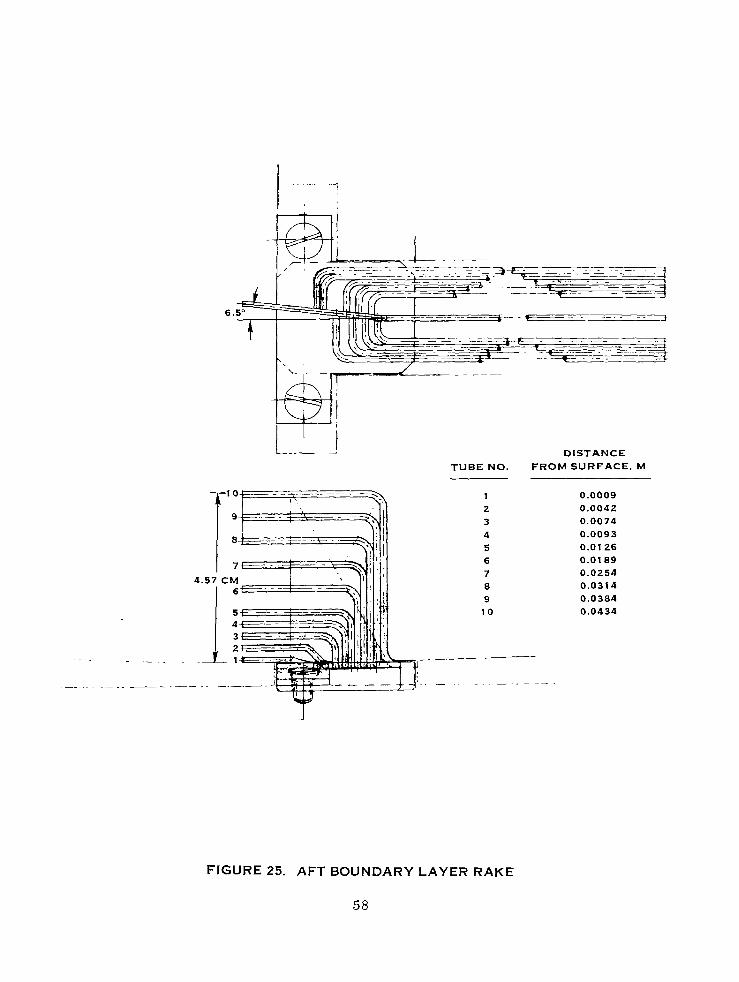
L-.- _! TUBE NO.
I
7
4.57 CM
---. ~I
6
5 4 3 2 1
_. _.--.
4 5 6 7 8 9
10
DISTANCE FROM SURFACE, M
0.0009 0.0042 0.0074 0.0093 0.0126 0.0189 0.0254 0.0314 0.0384 0.0434
FIGURE 25. AFT BOUNDARY LAYER RAKE
58

e 26.99 CM
O.lSCI
I -w
----- .- - - -__ ._- - _--- _---- -- --
Yin
---__- -- r: \‘ \
FIGURE 26. TOTAL HEAD RAKE

(A) WEDGE RAKE INSTALLATION
(B) WEDGE RAKE DETAIL
FIGURE 27. WEDGE RAKE INSTALLATION
60

SECTION B - B
I-- B 7 B
(C) DETAIL OF WEDGE
FIGURE 27. (CONCLUDED)
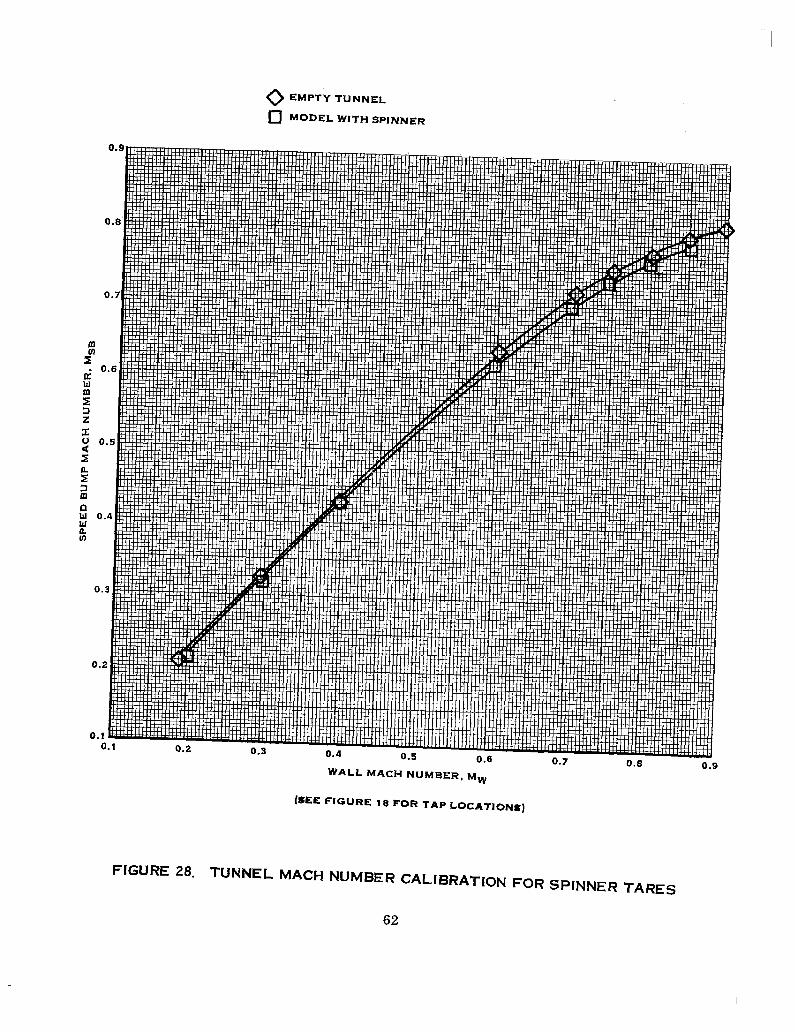
0 EMPTY TUNNEL
0 MODEL WITH SPINNER
WALL MACH NUMBER, MW
(SEE FIGURE 18 FOR TAP LOCATION$)
FIGURE 28. TUNNEL MACH NUMBER CALIBRATION FOR SPINNER TARES
62

0.9
0.8
0.7
0.6
0.5
0.4
0.3
0.2 0.2 0.3 0.4 0.5 0.6 0.7 0.8 .0.9
FREESTREAM MACH NUMBER M o.
FIGURERS. TUNNELMACHNUMBERCALIBRATIONF~RTARERUNS
63

0.9
0.8
0.7
0.3
0.2
0.1
WALL MACH NUMBER, MW
FIGURE 30. TUNNEL MACH NUMBER CALIBRATION FOR PERFORMANCE, RUNS

-
0.2 0.3 0.4 0.5 0.7 0.8 0.9
FREESTREAM MACH NUMBER. M 03
FIGURE 31. TUNNEL MACH NUMBER CALIBRATION FOR PERFORMANCE RUNS
65

ROTATIONAL SPEED, RPM
FIGURE 32. OPERATING ENVELOPE FOR MODEL PROP-FAN

31 CM
25
\.
\
\
\
\
:h4
-
19.
12.
12.7 CM
8.1 bC
1
I I I I
-L I
I I !
I CAMBER SIDE
I
FIGURE 33. STRAINGAGE LOCATION
67
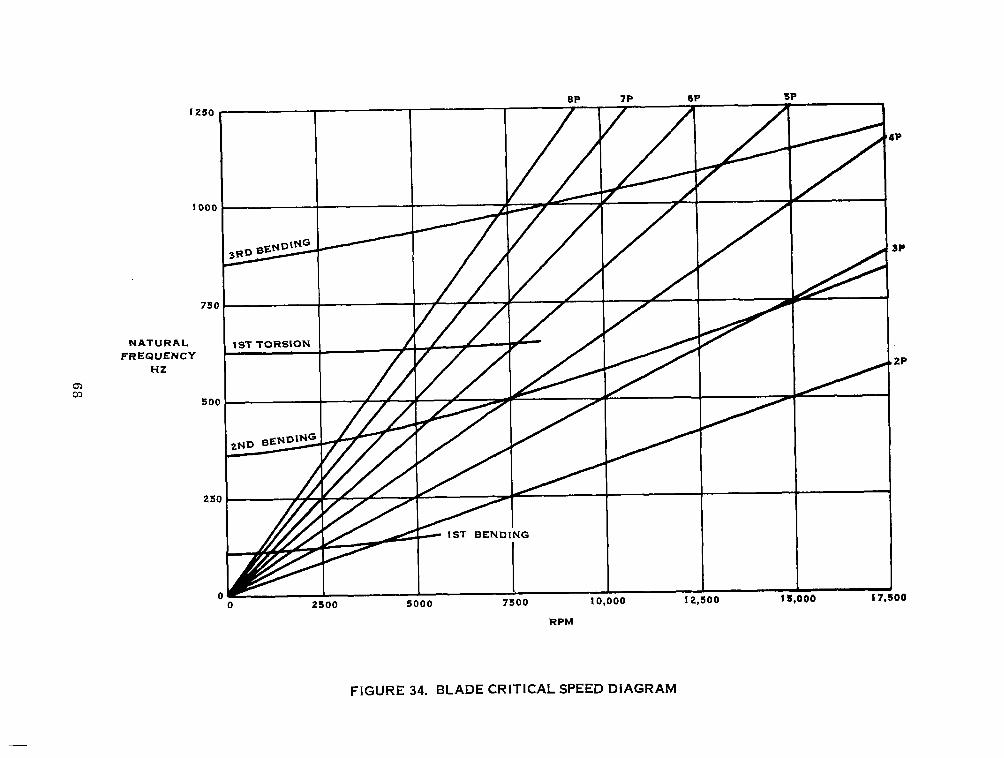
NATURAL FREQUENCY
HZ
250
RPM
RP SP
FIGURE 34. BLADE CRITICAL SPEED DIAGRAM

-3200
-2000 0 0.1 0.2 0.3 0.4 0.5 0.6 0.7 0.8 0.9
FREESTREAM MACH NUMBER
FIGURE 35. DUMMY SPINNER TARE AS A FUNCTION OF FREESTREAM MACH NUMBER

2.a
2.0
0.A
0 0 0.1 0.2 0.3 0.4 0.5 0.6 0.7 0.8 0.9
FREESTREAM MACH NUMBER
FIGURE 36. DUMMY SFlNNER TORQUE TARE AS A FUNCTION OF FREESTREAM MACH NUMBER

-300
-280
-260
-240
-220
-200 --- 0 0.1 0.2 0.3 0.4 0.5 0.6 0.7 0.8 0.9
FREESTREAMMACHNUMBER
FIGURE 37. NACELLE TARE AS A FUNCTION OF FREESTREAM MACH NUMBER
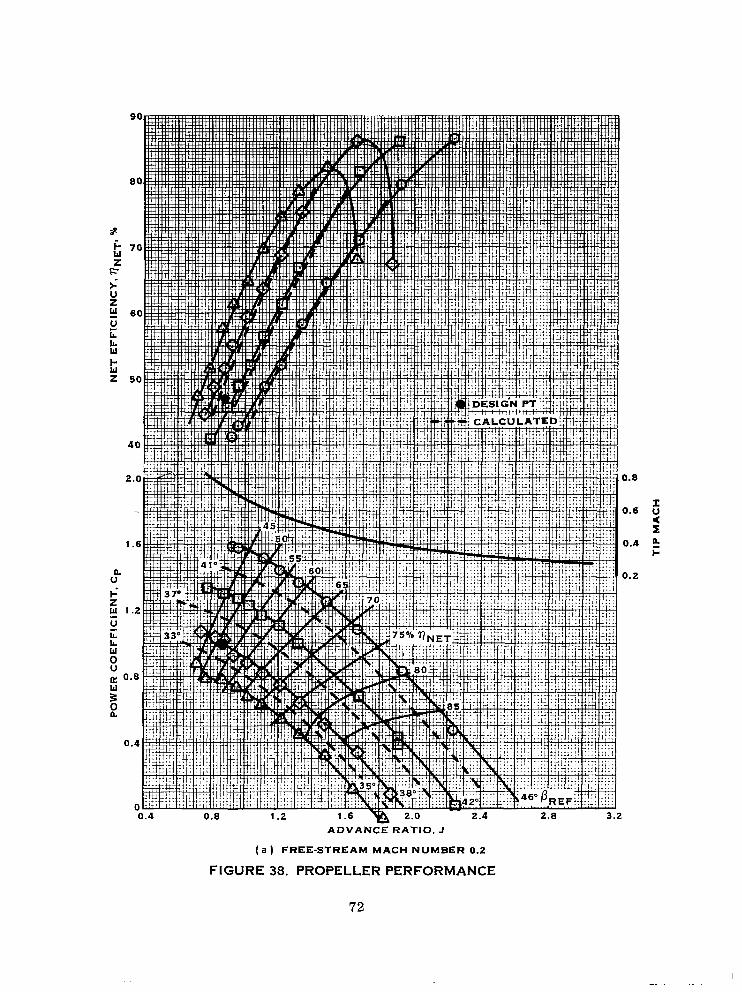
0.6
0.a
ADVANCE RATIO, J
(a ) FREE-STREAM MACH NUMBER 0.2
FIGURE 38. PROPELLER PERFORMANCE
72

.8 I
x .i3 L
.a
:F
lb) FREE-STREAM MACH NUMBER 0.4
FIGURE 38. (CONTINUED)
73
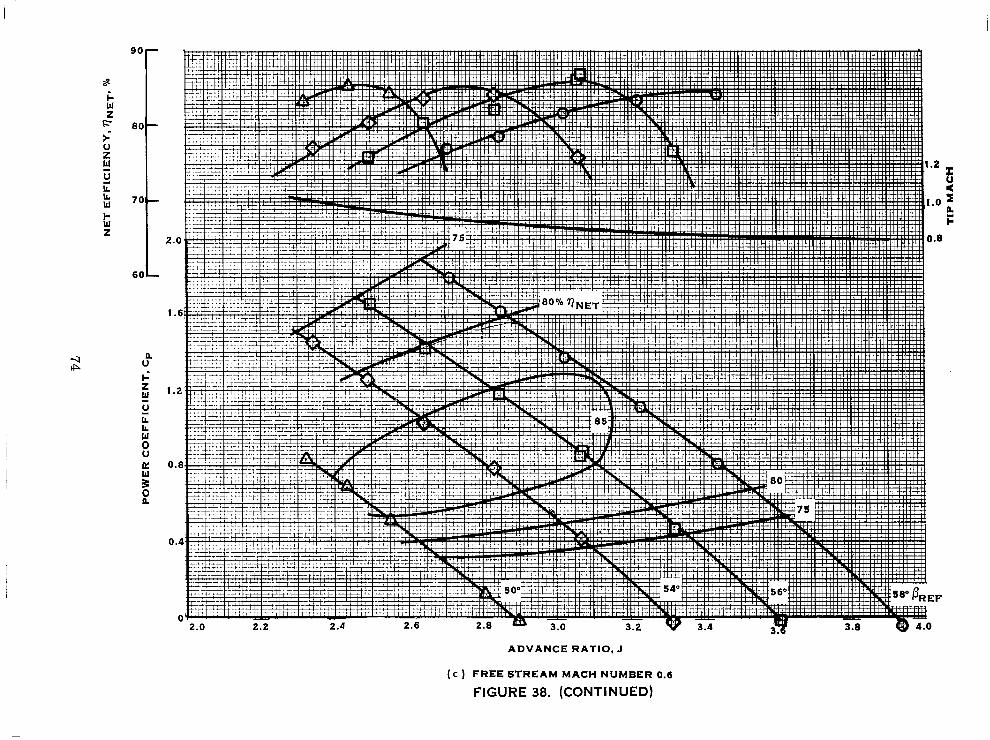
60 I
0
2.0 2.2 2.4 2.6 3.0 3.2 W 3.4 3.8 @ a.0
ADVANCE RATIO, J
(c ) FREE STREAM MACH NUMBER 0.6
FIGURE 38. (CONTINUED)
.8
:F

(d ) FREE-STREAM MACH NUMBER 0.70
FIGURE 38. (CONTINUED)

90
80
I
70
60
2.4
ADVANCE RATIO. J
(e ) FREE-STREAM MACH NUMBER 0.75
FIGURE 38. (CONTINUED)

--CALCULATED
ADVANCED RATIO, .I
( f ) FREE-STREAM MACH NUMBER 0.80
FIGURE 38. (CONTINUED)
0.8 F
IEF

(9 ) FREE-STREAM MACH NUMBER 0.85
FIGURE 38. (CONCLUDED)

90
80
70
60
50
40
30
20
10
0
-
?j = OPEN SYMBOLS
Cp = SOLID SYMBOLS
1.8
1.6
1.4
1.2
u”
5 w 1.0 0 ii k
8 cc
g
0.8
CL
0.6
0.4
0.2
0 2.4 2.8 3.2
ADVANCED RATIO, J
FIGURE 39 REPEATABILITY OF PROP-FAN PERFORMANCE DATA
70
-
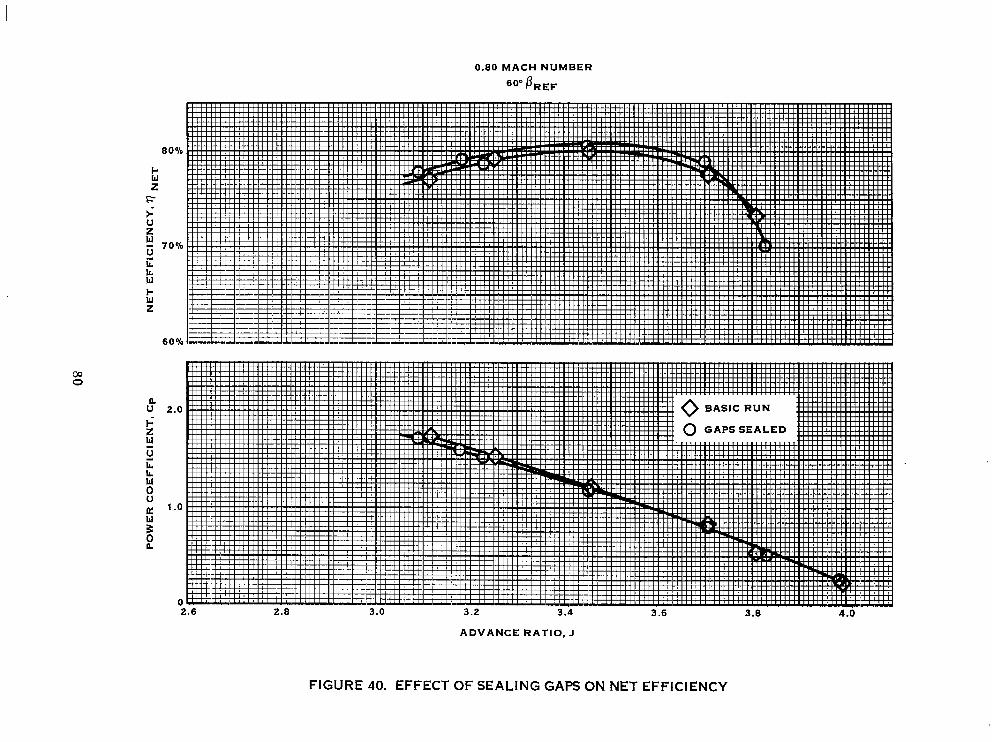
8 0 %
0.80 MACH NUMBER
‘O”flREF
ADVANCE RATIO, J
FIGURE 40. EFFECT OF SEALING GAPS ON NET EFFICIENCY

1.0
0.9
0.7
0.6
-
-~
- -.
0.a c
TICI --
TEST DATA
- -. -\
C
MACH NUMBER
I --- REF 17
0
\
3 I D
FIGURE 41. VARIATION OF PEAK EFFICIENCY WITH MACH NUMBER

- .-. -.- .- .__... -_-.-_ ._. ~..
90
L ,z 80
60
E 70
60
./J3=0.0326
----.
- I
- -\
\
0 TEST DATA - --CALCULATION
Cp/J3=0.0589
0.4 0.5 0.6 0.7 0.8 0.9
MACH NUMBER
FIGURE 42. VARIATION OF NET EFFICENCY WITH MACH NUMBER
82

80
60
POWER LOADING, KILOWATT/METER’
IO 15 20 25 30 35 40 a5
SHP/D’
FIGURE 43. VARIATION OF NET EFFICIENCY WITH POWER LOADING

80
10.888M (35,000 FT) ALTITUDE
60
50 a0
I 5
80
I 10
120 160 200 2ao 280 320
POWER LOADING, KILOWATT/METER’
I I I I I I 15 20 25 30 35 a0
SHP/D’
FIGURE 44. VARIATION OF NET EFFICIENCY WITH POWER LOADING AND TIP SPEED AT 0.80 MACH NUMBER
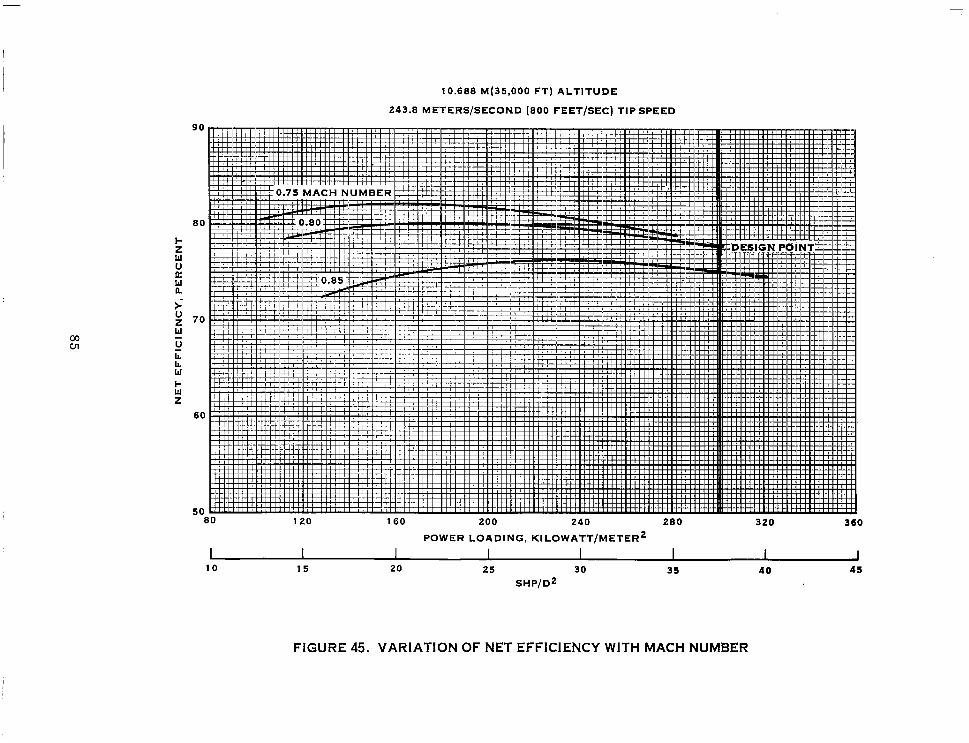
10.688 M(35,000 FT) ALTITUDE
243.8 METERS/SECOND (800 FEET/SEC) TIP SPEED
50 80
I IO
120
I
15
160 200 240 280 320 360
POWER LOADING, KILOWATT/METER’
I I I I 20 25 30 35 a0 a5
SHP/D2
FIGURE 45. VARIATION OF NET EFFICIENCY WITH MACH NUMBER

10,688 M(35.000 FT) ALTITUDE
0.75 MACH NUMBER
a0 80
I I
5 10
120 160 200
POWER LOADING, KILOWATT/METER’
I I I 15 20 25
SHP/D’
240 280
I I 30 35
320
40
FIGURE 46. VARIATION OF NET EFFICIENCY WITH POWER LOADING AND TIP SPEED AT 0.75 MACH NUMBER

FIGURE 47. COMPARISON OF MEASURED AND CALCULATED TOTAL PRESSURE DISTRIBUTIONS
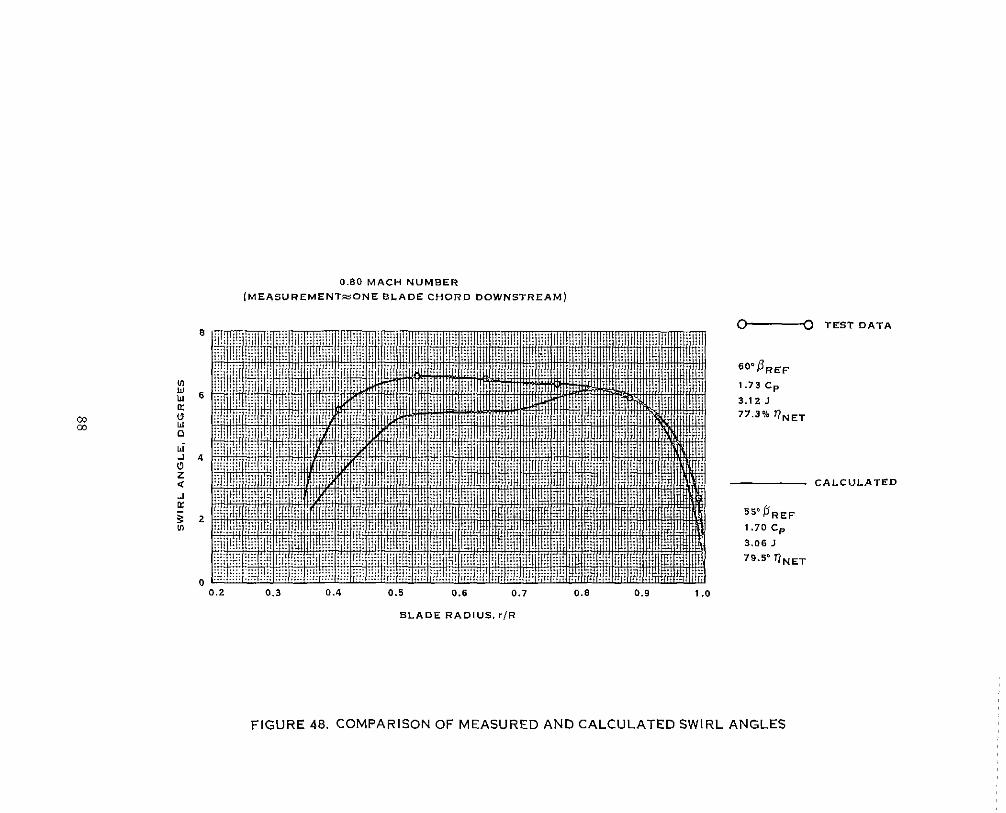
FIGURE 48. COMPARISON OF MEASURED AND CALCULATED SWIRL ANGLES

0.80 MACH NUMBER
60° PREP 8250 RPM
FIGURE 49. STROBOSCOPIC PHOTO OF TUFTS ON PRESSURE SIDE OF BLADE
89

0.80 MACH NUMBER
60° PREP 8250 RPM
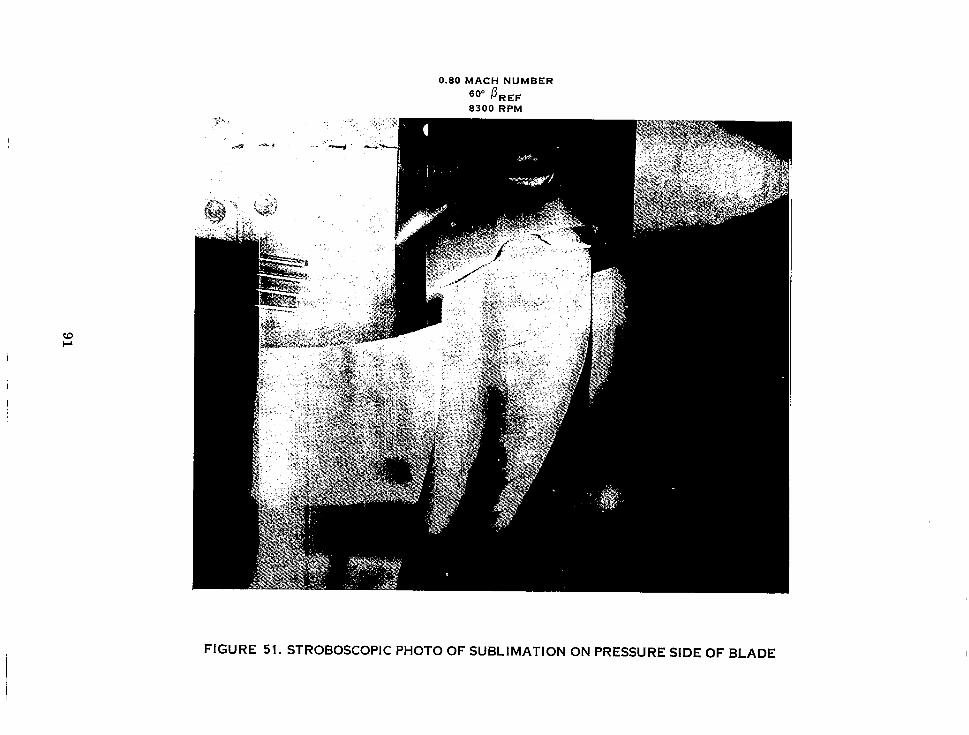
0.80MACHNUMBER
60" OREF 8300 RPM
FIGURE 51. STROBOSCOPIC PHOTO OF SUBLIMATION ON PRESSURE SIDE OF BLADE
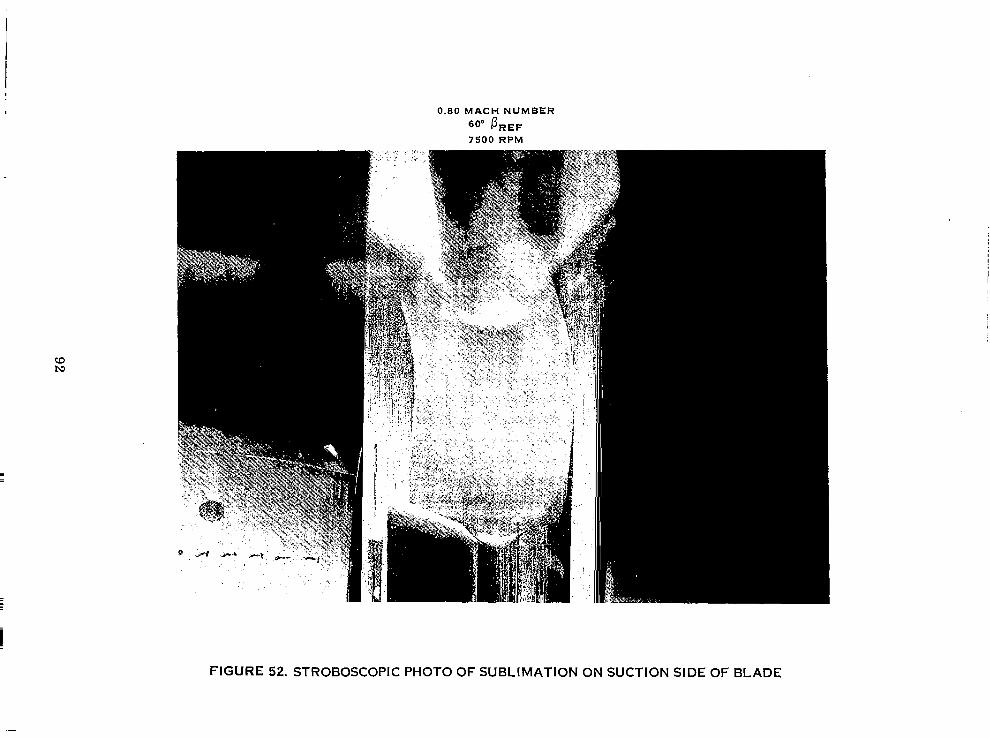
0.80 MACH NUMBER
600 PREF 7500 RPM
FIGURE 52. STROBOSCOPIC PHOTO OF SUBLIMATION ON SUCTION SIDE OF BLADE

243.8 METER/SECOND (800 FT/SEC) TIP SPEED SEA LEVEL, ISA
0 TEST DATA --- CALCULATED
400 500 600 700 800
POWER LOADING. KILOWATTS/METER2
I------ _= I I I I 50 60 70 -‘- SO 90
SHP/D2
100
FIGURE 53. COMPARISON BETWEEN TEST AND CALCULATED PERFORMANCE AT 0.20 MACH NUMBER
93

579 KILOWATT/METER2 (72 SHP/D2) SEA LEVEL, ISA
0.8~
VELOCITY, METERS/SECOND
I I I I I I I I 100 120 140 160 180 200 220 240
VELOCITY. KNOTS
FIGURE 54. VARIATION OF THRUST LOADING WITH VELOCITY AND TIP SPEED
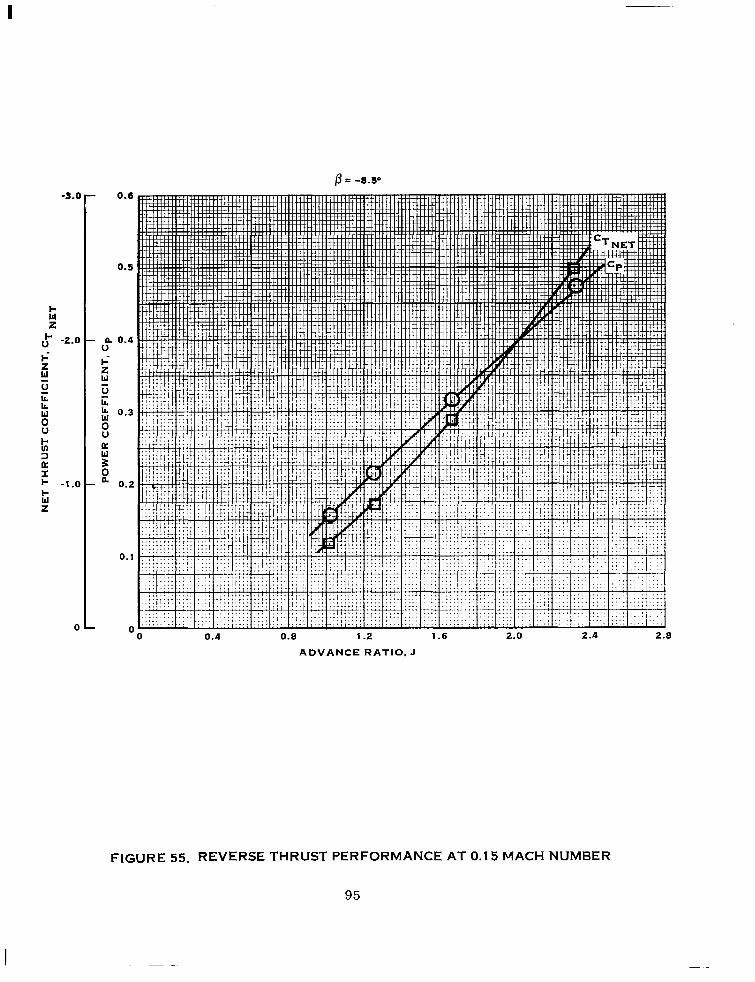
P= -8.!Y
ADVANCE RATIO. J
FIGURE 55. REVERSE THRUST PERFORMANCE AT 0.15 MACH NUMBER
95

0 TEST, -8.!V &EF
- - -CALCULATION
TIP SPEED = 243.8 M/S (800 fps) -10
3 ; -8
-7
-6
-
-
-
-
-
40 60 80 100 120
POWER LOADING, KILOWATT/METER2
I I I I I I 4 6 8 10 12 14
SHP/D2
FIGURE 56. COMPARISON BETWEEN TEST AND CALCULATIONS IN REVERSE
96
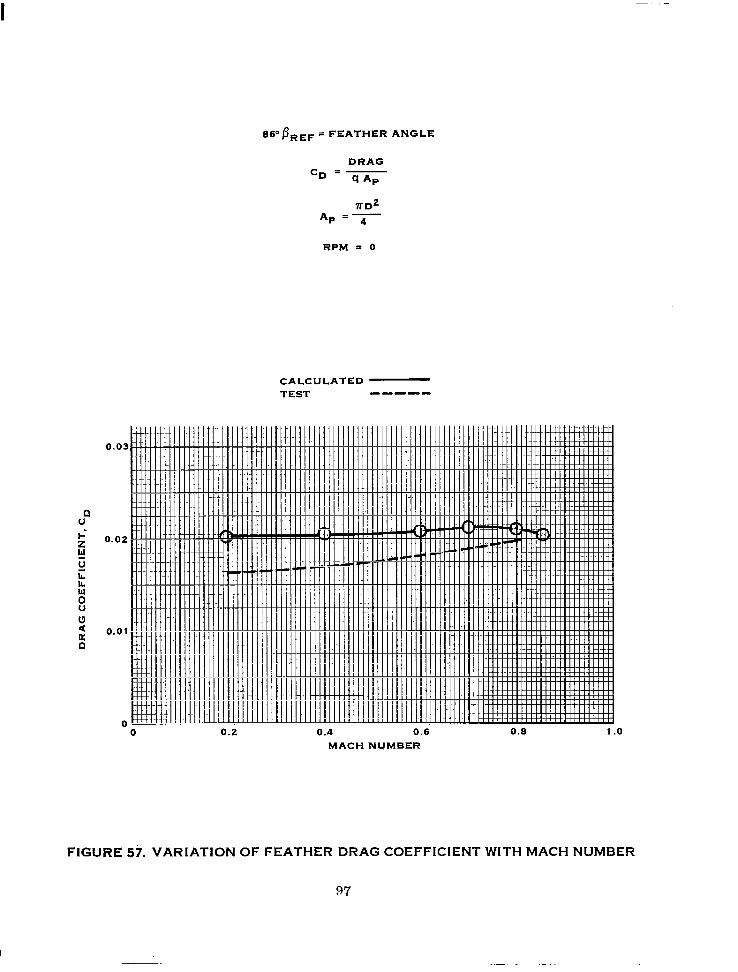
86”flREF = FEATHER ANGLE
DRAG CD =-
q AP
RPM = 0
CALCULATED TEST m---w
i I I I 1 1 1 i i 1
0.6 0.8 1 .o MACH NUMBER
FIGURE 53. VARIATION OF FEATHER DRAG COEFFICIENT WITH MACH NUMBER
97
I- --
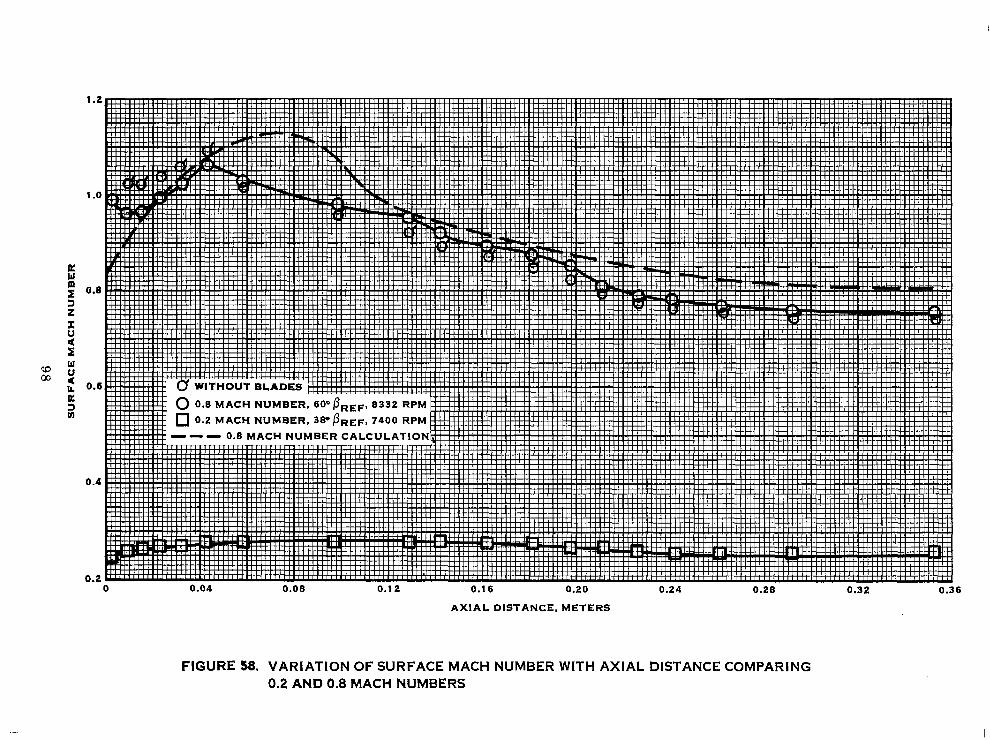
1 .o
0.6
0.1
0.2
AXIAL DISTANCE, METERS
FIGURE 58. VARIATION OF SURFACE MACH NUMBER WITH AXIAL DISTANCE COMPARING 0.2 AND 0.8 MACH NUMBERS
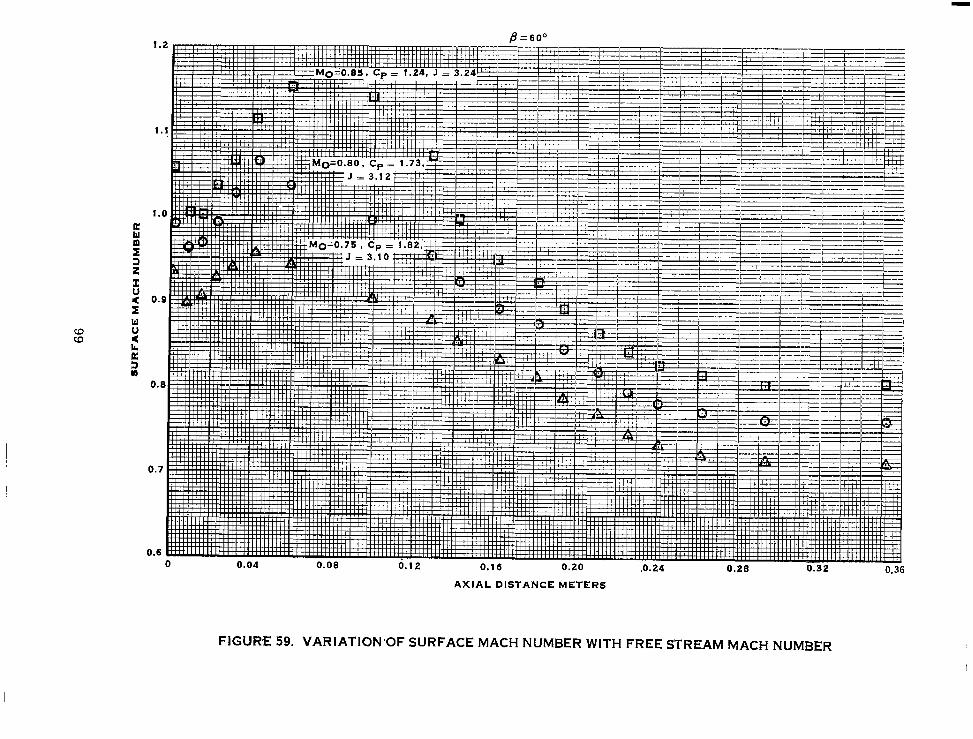
AXIAL DISTANCE METERS
FIGURE 59. VARIATION’OF SURFACE MACH NUMBER WITH FREE STREAM MACH NUMBER

0
0 0 A 8 12 16 20 2A i8 32 36
AXIAL DISTANCE, METERS
FIGURE 60. VARIATION OF SURFACE MACH NUMBER WITH BLADE ANGLE
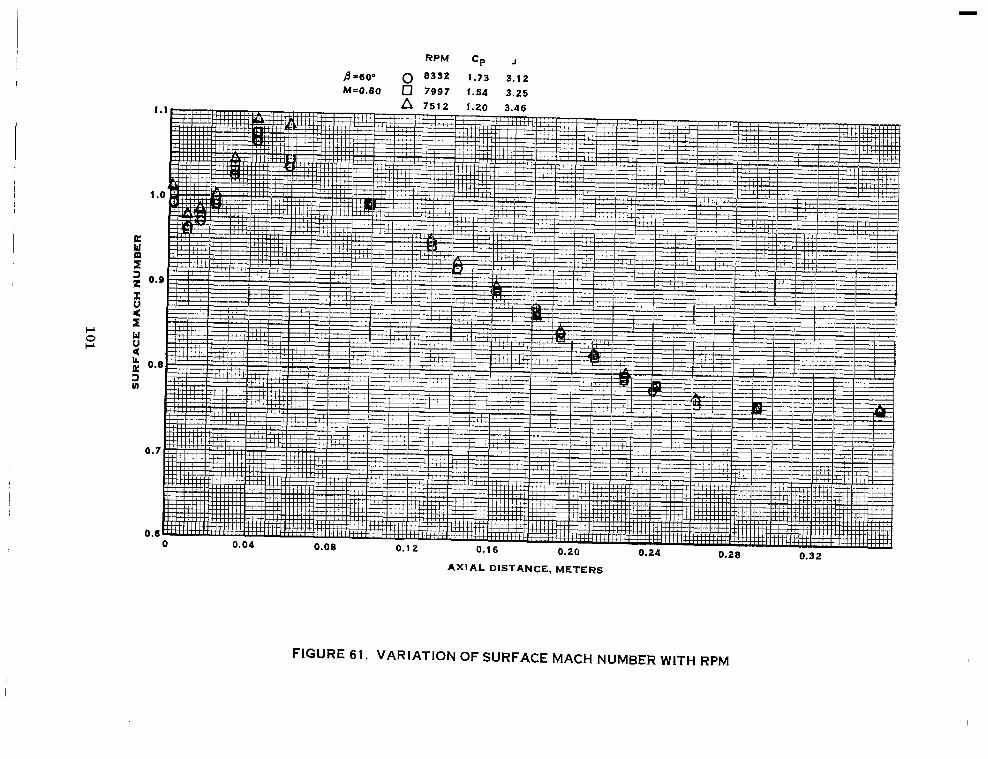
RPM Cp J
A=60° 0 8332 1.73 3.12 M=O.BO q 7997 1.54 3.25
FIGURE 61. VARIATION OF SURFACE MACH NUMBER WITH RPM

1 .a2
0.10 0.14 0.16 0.22 0.26 0.30 0.34 0.36
RADIAL DISTANCE, METERS
FIGURE 62. EFFECT OF BLADE ANGLE ON TOTAL PRESSURE RISE, KIEL RAKE

0.10 0.14 0.18 0 22 0.26 0.36 0.34 - 0.38
FIGURE 63. EFFECT OF RPM ON TOTAL PRESSURE RISE, KIEL RAKE
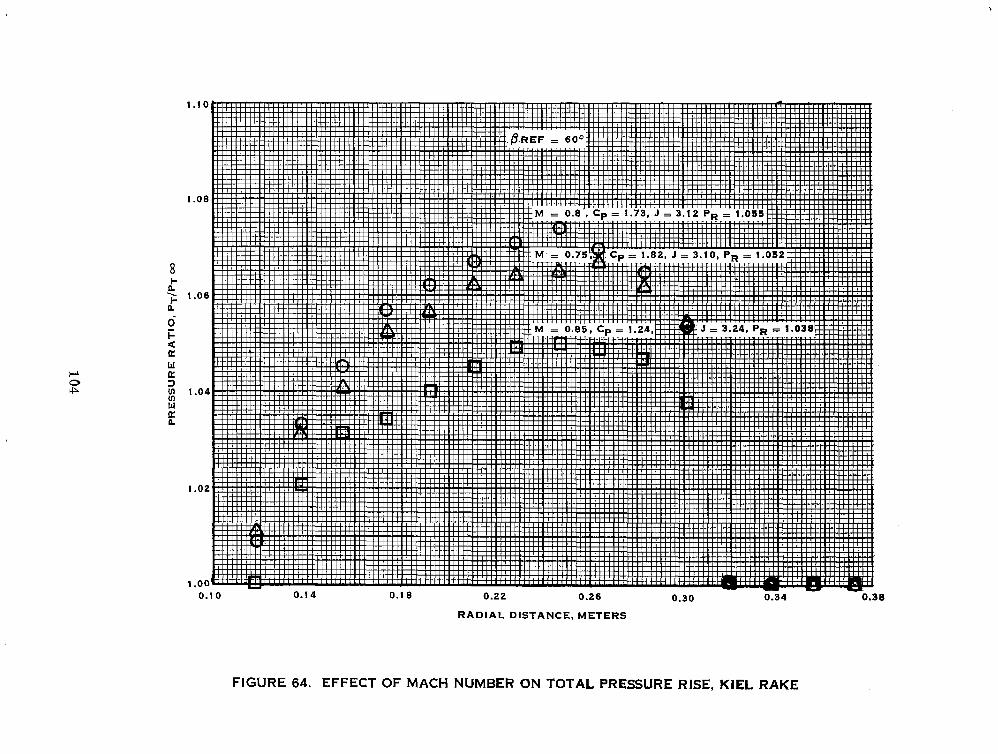
1
1
8 Lt a
1
1
1
RADIAL DISTANCE, METERS
FIGURE 64. EFFECT OF MACH NUMBER ON TOTAL PRESSURE RISE, KIEL RAKE
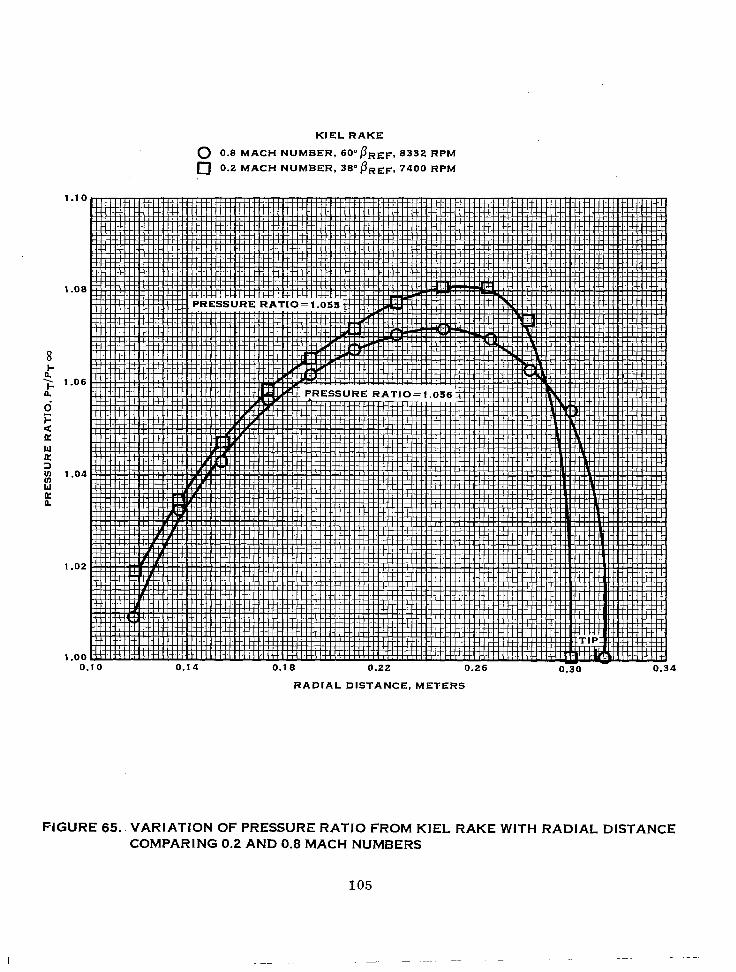
W
5
ii W
1.08
1.06
1.04
E
1.02
1 .oo 0,
KIEL RAKE
0 0.8 MACH NUMBER, 60°fi~.~, 8332 RPM
0 0.2 MACH NUMBER, 3E0PR~~, 7400 RPM
RADIAL DISTANCE. METERS
FIGURE 65.. VARIATION OF PRESSURE RATIO FROM KIEL RAKE WITH RADIAL DISTANCE COMPARING 0.2 AND 0.8 MACH NUMBERS
-

8 t 2’
FORWARD B.L. RAKE’
MO = 9.80
@REF,60°0, Cp = 1.73, J = 3.12
BREF = 56” 0, Cp = 0.84. J = 2.91
0.10 0.i 1 0.12 o.i3
RADIAL DISTANCE FROM MODEL e, METERS
REAR B. L. RAKE 1
RADIAL DISTANCE FROM MODEL c, METERS
FIGURE 66. EFFECT OF BLADE ANGLE ON TOTAL PRESSURE RISE, BOUNDARYLAYER RAKES
106
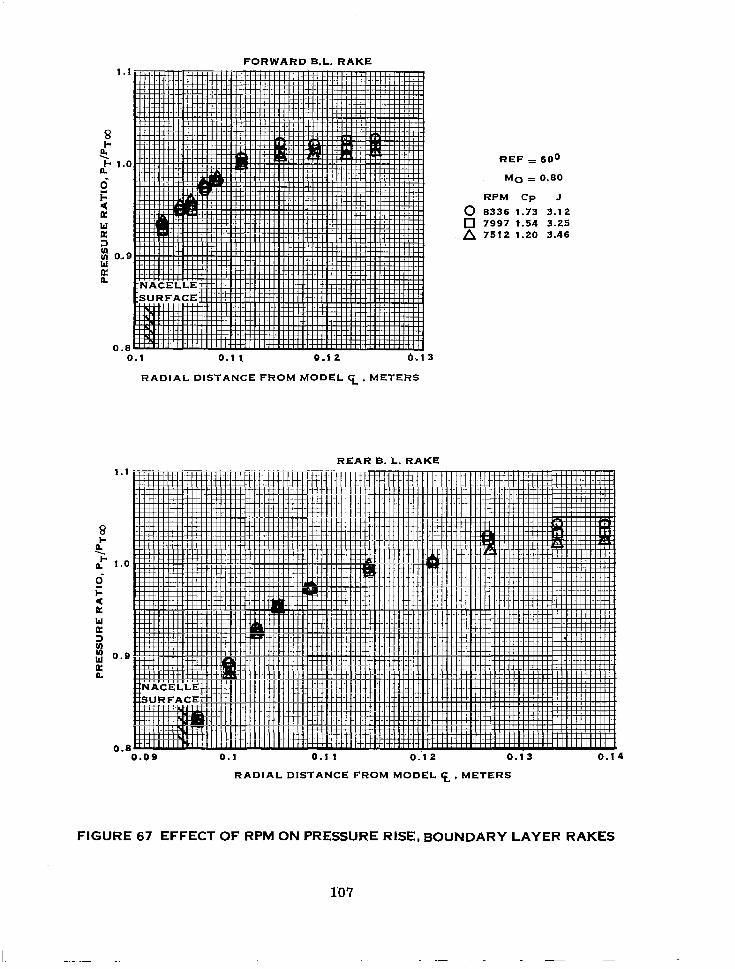
FORWARD B.L. RAKE
0 0.1 0.1 1 0.1 2 6.1
RADIAL DISTANCE FROM MODEL 5, METERS
REAR B. L. RAKE 1.1
0.8
no A
REF = 60°
MO = 0.80
RPM Cp J
8336 1.73 3.12 7997 t.54 3.25 7512 1.20 3.46
RADIAL DISTANCE FROM MODEL 5, METERS
FIGURE 67 EFFECT OF RPM ON PRESSURE RISE, BOUNDARY LAYER RAKES
1D7
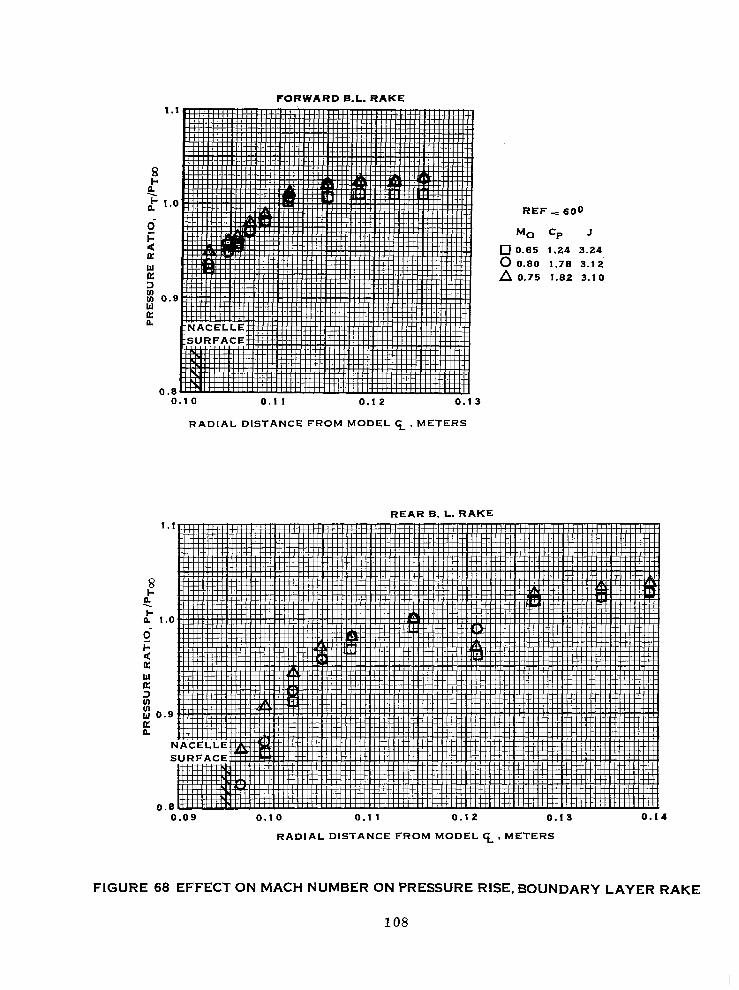
FO,RWARD B.L. RAKE 1
8 LF 21
?suRFAcE#~##
0. 0.10 0.11 0.12 0.13
RADIAL DISTANCE FROM MODEL 5, METERS
REAR B. L. RAKE 1
REF = 600
M. CP J q 0.85 1.24 3.24
0 0.80 1.78 3.12 A 0.75 1.82 3.10
0.09 0.10 0.1 1 0.12 0.13 0.14
RADIAL DISTANCE FROM MODEL c, METERS
FIGURE 68 EFFECT ON MACH NUMBER ON PRESSURE RISE, BOUNDARY LAYER RAKE
108
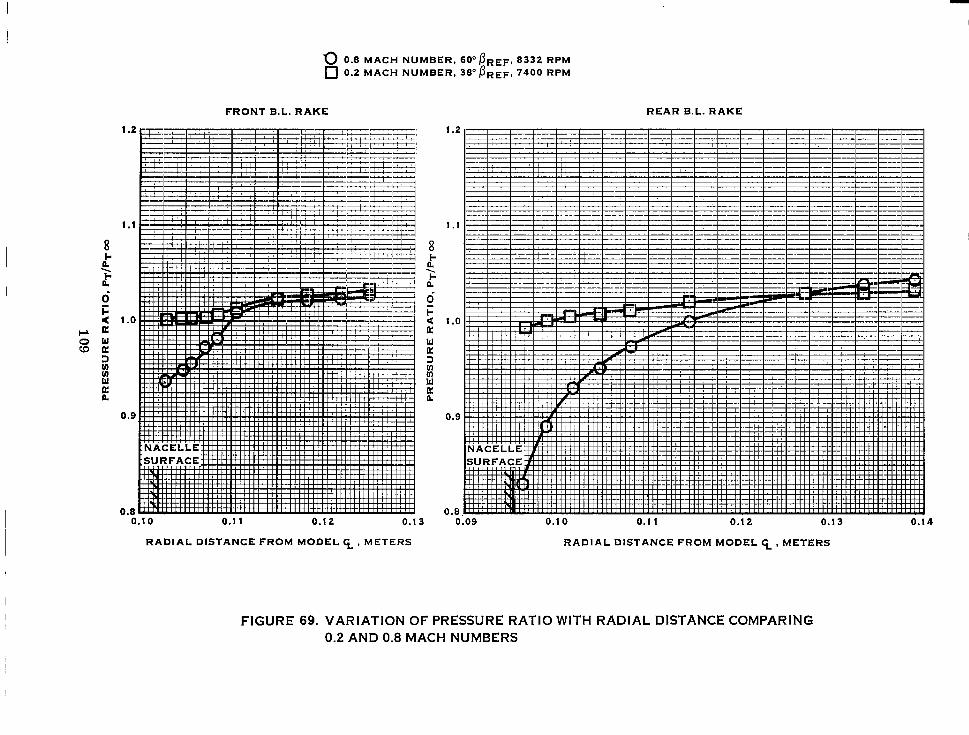
1 .o
0 0.8 MACH NUMBER, 66’flREF, 8332 RPM q 0.2 MACH NUMBER, 38”flRE~. 7406 RPM
FRONT B.L. RAKE REAR B.L. RAKE
0.8 0.10 0.1 1 0.12 0.13
1 .I
1 .o
0.8 0.09 0.10 0.11 0.12 0.13 0.14
RADIAL DISTANCE FROM MODEL G.1 METERS RADIAL DISTANCE FROM MODEL x, METERS
FIGURE 69. VARIATION OF PRESSURE RATIO WITH RADIAL DISTANCE COMPARING 0.2 AND 0.8 MACH NUMBERS
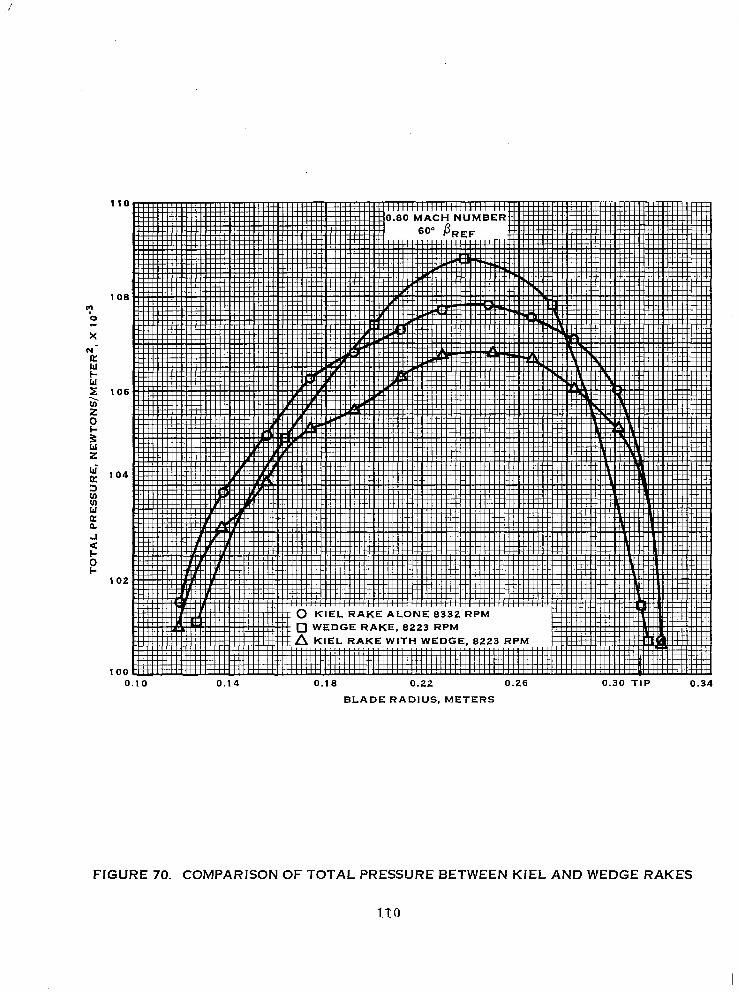
0.10 0.14 0.1 8 0.22 0.26 0.30 TIP 0.34
BLADE RADIUS. METERS
FIGURE 70. COMPARISON OF TOTAL PRESSURE BETWEEN KIEL AND WEDGE RAKES
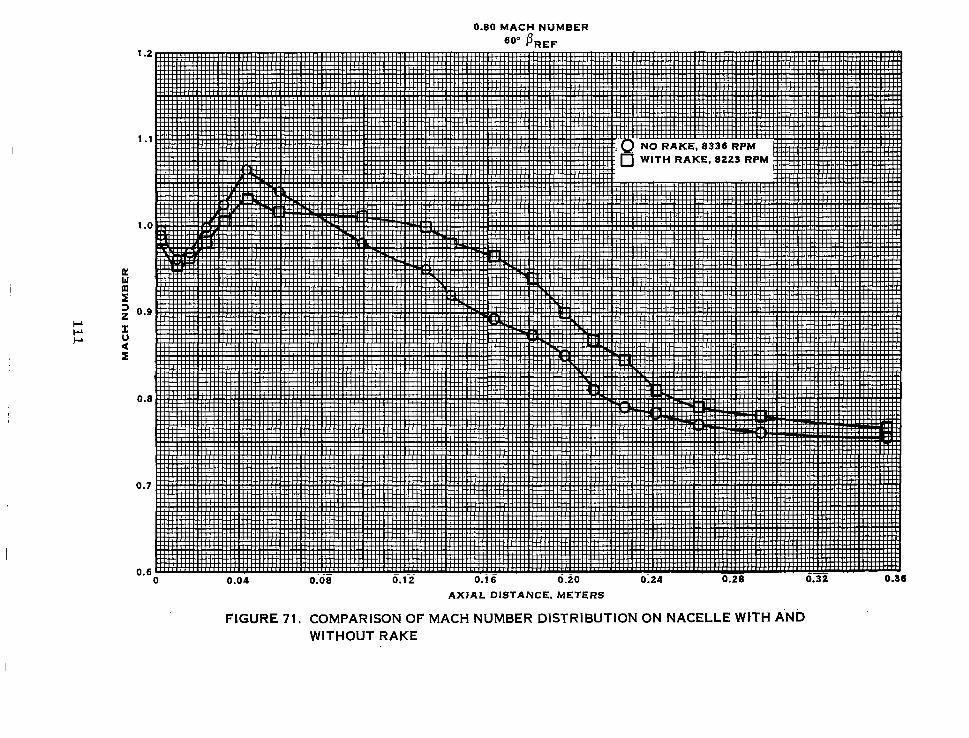
0.80 MACH NUMBER
60’ i&r,
.8
.6 0 0.04 0.08 0.12 0.16 0.20 0.24 0.28 0.32 0.36
AXIAL DISTANCE, METERS
FIGURE 71. COMPARISON OF MACH NUMBER DISTRIBUTION ON NACELLE WtTH AND WITHOUT RAKE

110
m
‘0
X
106
94
0.10 0.1 i 0.12 0.13
RADIAL DISTANCE FROM NACELLE x, METERS
82 0
FIGURE 72. COMPARISON OF TOTAL PRESSURES BETWEEN FRONT AND REAR BOUNDARY LAYER RAKES AT 0.80 MACH NUMBER
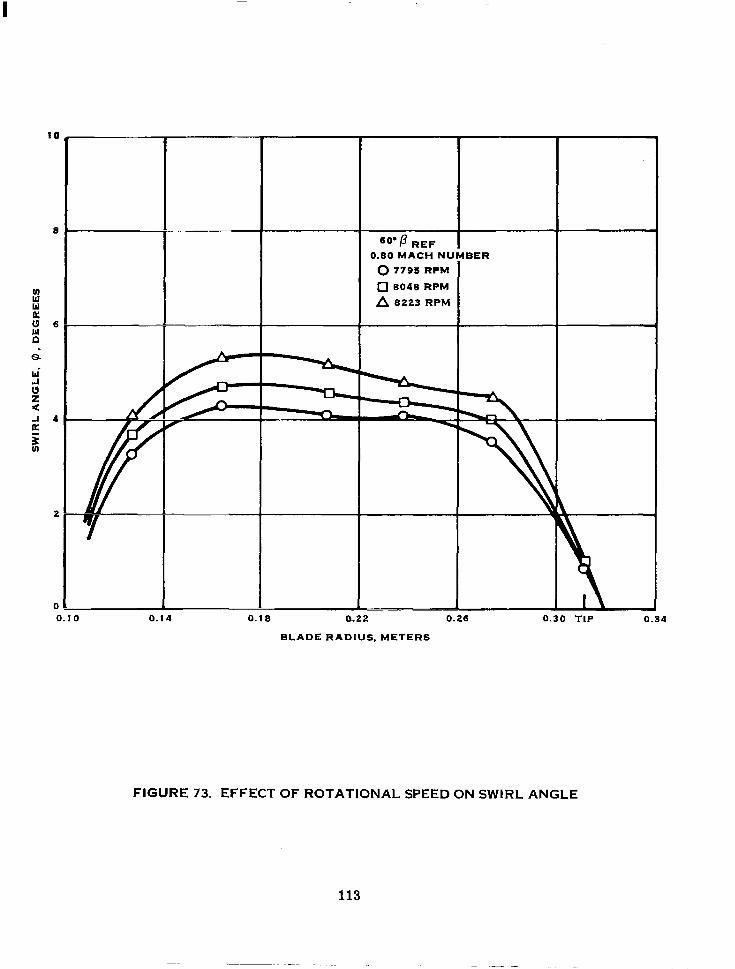
“*p REF 1 0.80 MACH NUMBER
0 7795 RPM
0 8048 RPM
A 8223 RPM
0.10 0.14 0.18 422 0.26 0.30 TIP 0.34
BLADE RADIUS, METERS
FtGURE 73. EFFECT OF ROTATIONAL SPEED ON SWIRL ANGLE
113
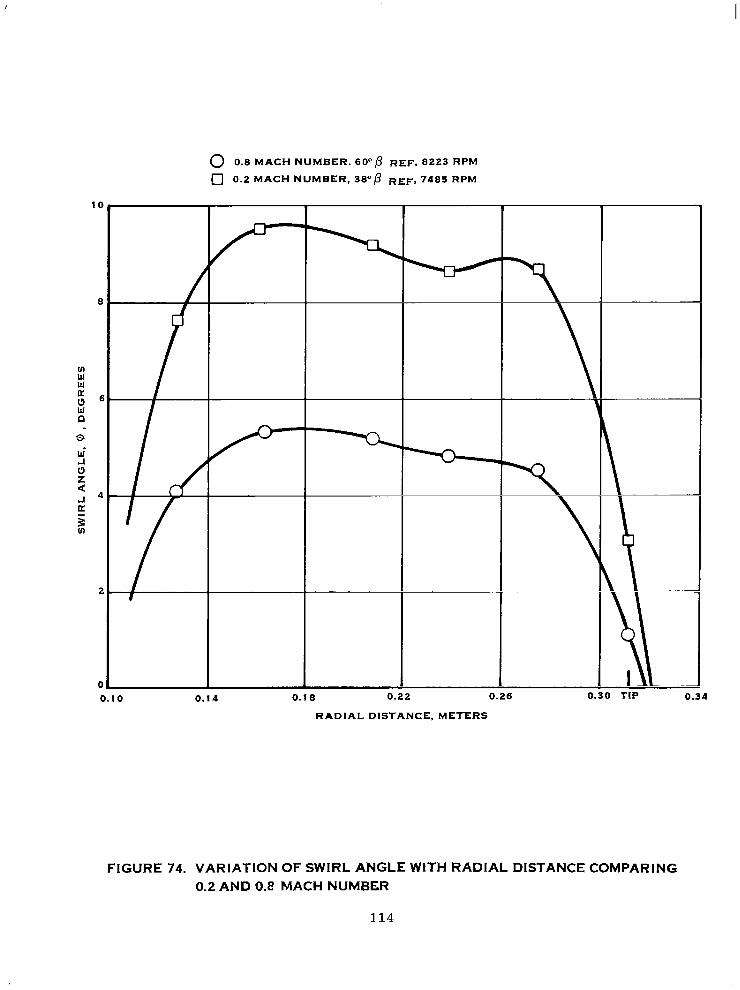
0 0.8 MACH NUMBER. 60°p REF, 8223 RPM
0 0.2 MACH NUMBER, 3E”p REF, 7485 RPM
0.10 0.14 0.18 0.; 0.26 0.
RADIAL DISTANCE, METERS
1 1 1 I - 1 -
0.3 4
FIGURE 74. VARIATION OF SWIRL ANGLE WtTH RADIAL DISTANCE COMPARING 0.2 AND 0.8 MACH NUMBER
114
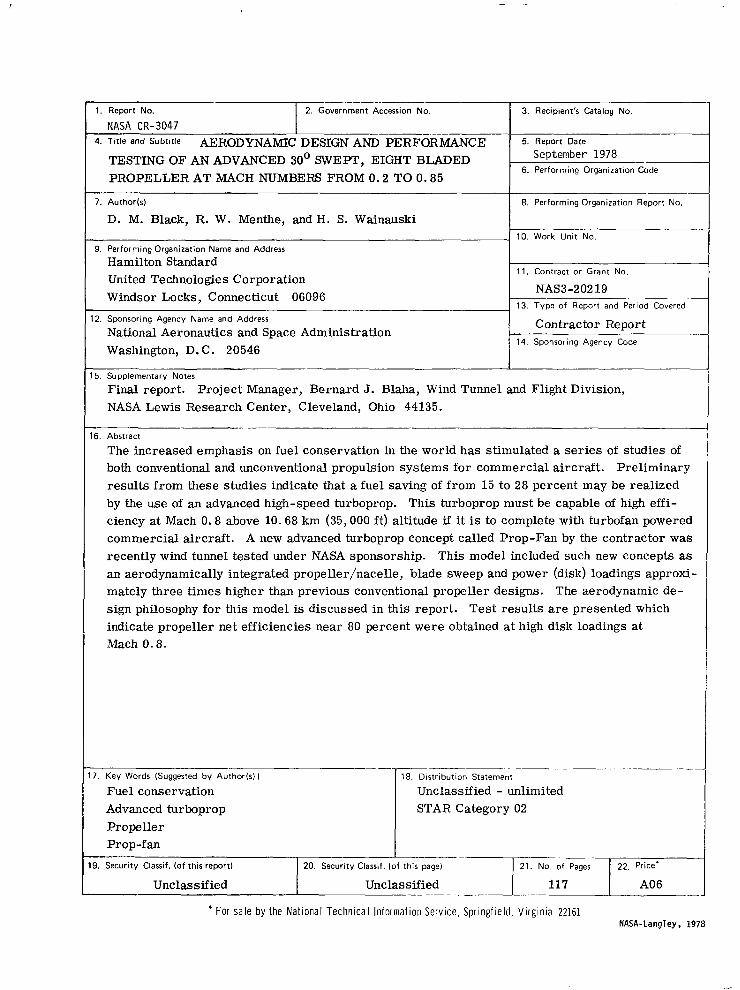
1. Report No. 2. Government Accession No.
NASA CR-3047 --- 4. Title and Subtitle AERODYNAMIC DESIGN AND PERFORMANCE
TESTING OF AN ADVANCED 30’ SWEPT, EIGHT BLADED PROPELLER AT MACH NUMBERS FROM 0.2 TO 0.85
3. Recipient’s Catalog No.
5. Report Date
September 1978 6. Performing Organization Code
7. Author(s)
D. M. Black, R. W. Menthe, and H. S. Wainauski
9. Performing Organization Name and Address
Hamilton Standard United Technologies Corporation Windsor Locks, Connecticut 06096
12. Sponsoring Agency Name and Address
National Aeronautics and Space Administration Washington, D. C. 20546
8. Performing Organization Report No.
10. Work Unit No.
11. Contract or Grant No.
NAS3-20219 13. Type of Report and Period Covered
Contractor Report 14. Sponsoring Agency Code
15. Supplementary Notes
Final report. Project Manager, Bernard J. Blaha, Wind Tunnel and Flight Division, NASA Lewis Research Center, Cleveland, Ohio 44135.
6. Abstract
The increased emphasis on fuel conservation in the world has stimulated a series of studies of both conventional and unconventional propulsion systems for commercial aircraft. Preliminary results from these studies indicate that a fuel saving of from 15 to 28 percent may be realized by the use of an advanced high-speed turboprop. This turboprop must be capable of high effi- ciency at Mach 0.8 above 10.68 km (35,000 ft) altitude if it is to complete with turbofan powered commercial aircraft. A new advanced turboprop concept called Prop-Fan by the contractor was recently wind tunnel tested under NASA sponsorship. This model included such new concepts as an aerodynamically integrated propeller/nacelle, blade sweep and power (disk) loadings approxi- mately three times higher than previous conventional propeller designs. The aerodynamic de- sign philosophy for this model is discussed in this report. Test results are presented which indicate propeller net efficiencies near 80 percent were obtained at high disk loadings at Mach 0.8.
-- 7. Key Words (Suggested by Author(s)1
Fuel conservation Advanced turboprop Propeller Prop-fan
I
-___ 18. Distribution Statement
Unclassified - unlimited STAR Category 02
9. Security Classif. (of this report) 20. Security Classif. (of this page)
Unclassified Unclassified / 22. Pzi6 1 21. Nol;;Pages
* For sale by the National Technical Information Service, Sprlnefield. Virginia 22161 NASA-Langley, 1978