njapa paving conference 3/14/2017 - new jersey … ≤ 98.0 13.0 14.0 15.0 16.0 17.0 65 - 85 0.6 -...
TRANSCRIPT

NJAPA Paving Conference3/14/2017

In 2008, NJDOT began evaluating higher RAP mixtures under request from industry Under the classification of “research pilot studies”
Some immediate concerns came out during evaluation Proper AC determination of RAP Ignition oven correction factors Need of softer binder to maintain -22oC low temp?▪ Were blending charts right way? Extraction/recovery?
Mixture tests indicated higher RAP %’s had fatigue issues – especially Overlay Tester (crack propagation)

0% RAP = 138 cycles 15% RAP = 40 cycles 20% RAP = 38 cycles 25% RAP = 40 cycles 30% RAP = 24 cycles (only 1 mix – 19mm)

Five pilot projects were produced and placed – 4 of 5 with immediate issues Plant volumetrics, field compaction 5th project showed issues in field 2 years later
In 2011, NJDOT held NJ asphalt industry to current specifications 15% RAP in surface; 25% RAP in intermediate/base
In winter 2012, Rutgers and NJDOT worked to develop a Performance-Based High RAP (HRAP) specification Utilized database of performance testing results to
establish performance requirements for both rutting (Asphalt Pavement Analyzer) and cracking (Overlay Tester)


The supplier is not held to PG grade or max. RAP content
Have to meet basic Superpave requirements NJDOT increased VMA 1% over current specs▪ Higher effective asphalt content compensates for potential
lack of RAP blending
Could use softer binder, rejuvenators, WMA However, acceptance based on final mixture
performance, based on database of typical “virgin” HMA

Table 902.11.03-1 HMA HIGH RAP Requirements for Design
Compaction Levels
Required Density (% of Theoretical Max.
Specific Gravity)
Voids in Mineral Aggregate (VMA)2, % (minimum)
Voids Filled With Asphalt
(VFA) % Dust-to-Binder
Ratio Nominal Max. Aggregate Size, mm @Ndes
1 @Nmax 25.0 19.0 12.5 9.5 4.75 L 96.0 ≤ 98.0 13.0 14.0 15.0 16.0 17.0 70 - 85 0.6 - 1.2 M 96.0 ≤ 98.0 13.0 14.0 15.0 16.0 17.0 65 - 85 0.6 - 1.2
1. As determined from the values for the maximum specific gravity of the mix and the bulk specific gravity of the compacted mixture. Maximum specific gravity of the mix is determined according to AASHTO T 209. Bulk specific gravity of the compacted mixture is determined according to AASHTO T 166. For verification, specimens must be between 95.0 and 97.0 percent of maximum specific gravity at Ndes.
2. For calculation of VMA, use bulk specific gravity of the combined aggregate including aggregate extracted from the RAP.
Table 902.11.04-1 HMA HIGH RAP Requirements for Control
Compaction Levels
Required Density (% of Theoretical Max.
Specific Gravity)
Voids in Mineral Aggregate (VMA), % (minimum)
Dust-toBinder Ra
Nominal Max. Aggregate Size, mm @Ndes1 25.0 19.0 12.5 9.5 4.75
L, M 95.0 – 98.5 13.0 14.0 15.0 16.0 17.0 0.6 - 1.3 1. As determined from the values for the maximum specific gravity of the mix and the bulk specific gravity of the compa
mixture. Maximum specific gravity of the mix is determined according to AASHTO T 209. Bulk specific gravity of compacted mixture is determined according to AASHTO T 166.

Minimum of 20% RAP in Surface Course Minimum of 30% RAP in Intermediate/Base Lab design and plant produced material must
meet rutting (APA) and cracking (Overlay Tester) requirements
Table 902.11.03-2 Performance Testing Requirements for HMA HIGH RAP Design
Test
Requirement Surface Course Intermediate Course
PG 64-22 PG 76-22 PG 64-22 PG 76-22 APA @ 8,000 loading cycles
(AASHTO T 340) < 7 mm < 4 mm < 7 mm < 4 mm
Overlay Tester (NJDOT B-10) > 150 cycles > 175 cycles > 100 cycles > 125 cycles


Tons of literature illustrating conflicting information pertaining to the fatigue cracking performance of recycled asphalt mixtures
Question is why? Differences in regional materials Differences in regional climate Differences in production practices Differences in what we define as fatigue cracking
performance (lab vs field)

Flexural Beam Device, AASHTO T321
Test mixes ability to withstand repeated bending
Run at strain levels higher than expected field strains to accelerate testing

Sample size: 6’’ long by 3’’ wide by 1.5’’ high
Loading: Continuously triangular displacement 5 sec loading and 5 sec unloading
Definition of failure▪ Discontinuity in Load vs
Displacement curve
Fixed plate
2 mm (0.08 in)
Aluminum plates
150 mm (6 in)
Sample
Movable plateplate
Ram direction
38 mm (1.5 in)

SPS-5 (LTPP’s Special Pavement Sections) used for the “Study of Rehabilitation of Asphalt Concrete Mixtures” 2-inch vs 5-inch thick overlays Milled vs Unmilled surfaces Virgin vs 30% RAP Mixtures
NJ Constructed in 1994 – Out of Service in 2009 Yearly distress survey Cores taken and tested prior to rehab, as well as
retained loose mix from 1994 construction

0.0
10.0
20.0
30.0
40.0
50.0
60.0
0.0 2.0 4.0 6.0 8.0 10.0 12.0 14.0 16.0
Allig
ator
Cra
ckin
g D
educ
t (m
2 /m2 )
Time After Construction (Years)
Section 506 - 2" Virgin HMA - MilledSection 509 - 2" 30% RAP - MilledSection 505 - 2" Virgin HMA - No MillingSection 502 - 2" 30% RAP - No Milling

0.0
10.0
20.0
30.0
40.0
50.0
60.0
0.0 2.0 4.0 6.0 8.0 10.0 12.0 14.0 16.0
Allig
ator
Cra
ckin
g D
educ
t (m
2 /m2 )
Time After Construction (Years)
Section 506 - 2" Virgin HMA - MilledSection 509 - 2" 30% RAP - MilledSection 505 - 2" Virgin HMA - No MillingSection 502 - 2" 30% RAP - No Milling

0.0
5.0
10.0
15.0
20.0
25.0
30.0
35.0
40.0
0.0 2.0 4.0 6.0 8.0 10.0 12.0 14.0 16.0
Tran
sver
se C
rack
ing
Ded
uct (
m/m
2 )
Time After Construction (Years)
Section 506 - 2" Virgin HMA - Milled
Section 509 - 2" 30% RAP - Milled
Section 505 - 2" Virgin HMA - No Milling
Section 502 - 2" 30% RAP - No Milling
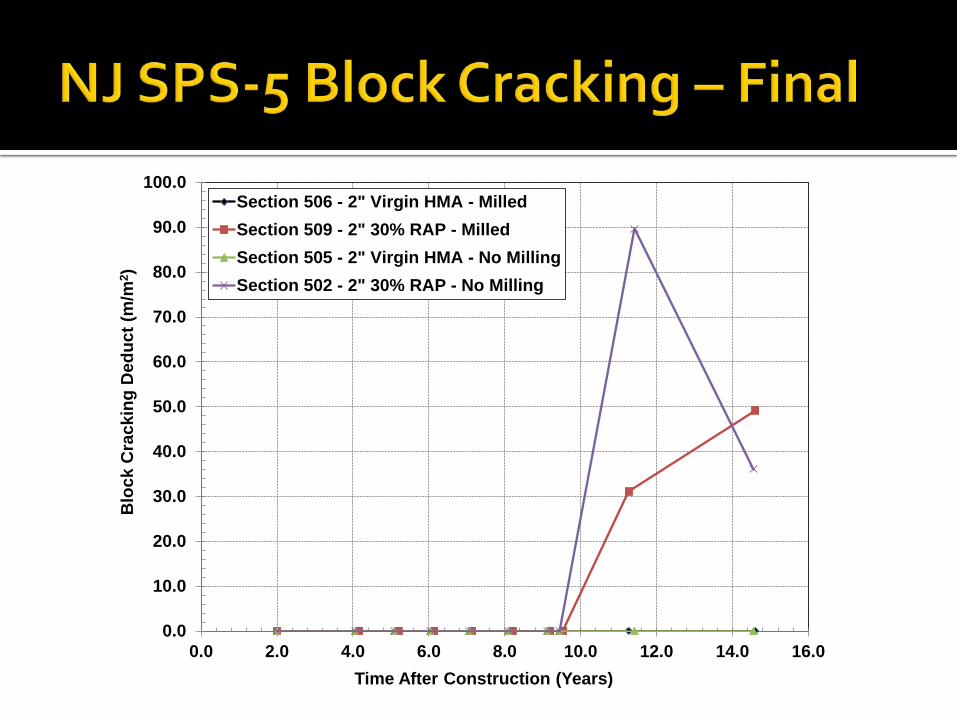
0.0
10.0
20.0
30.0
40.0
50.0
60.0
70.0
80.0
90.0
100.0
0.0 2.0 4.0 6.0 8.0 10.0 12.0 14.0 16.0
Blo
ck C
rack
ing
Ded
uct (
m/m
2 )
Time After Construction (Years)
Section 506 - 2" Virgin HMA - MilledSection 509 - 2" 30% RAP - MilledSection 505 - 2" Virgin HMA - No MillingSection 502 - 2" 30% RAP - No Milling
Sections began to have visual “cracking” around the same time period
However, once cracking had initiated, the cracking propagated through the RAP sections at a greater rate
Therefore, crack initiation rankings appear to differ from crack propagation rankings Crack propagation better represents the mixture’s
ability to resist cracking


PANYNJ Newark & JFK Airfield Cracking FHWA ALF Fatigue Study NYSDOT RAP-RAS Studies NYSDOT WMA Studies
HRAP specification provides a means for industry to use more RAP Can use up to 100%! Most plants can not use more than 40% - 50% anyway
Gives flexibility to supplier to use different design and production alternatives – think outside the box a little
Performance tiered for needed performance Field performance used to select and verify
performance testing and criteria
