nitrogen - pncwa home · nitrogen terry dokken october 25, 2010 bend, or. nitrogen in the...
TRANSCRIPT

Nitrogen
Terry Dokken
October 25, 2010
Bend, OR

Nitrogen in the Environment
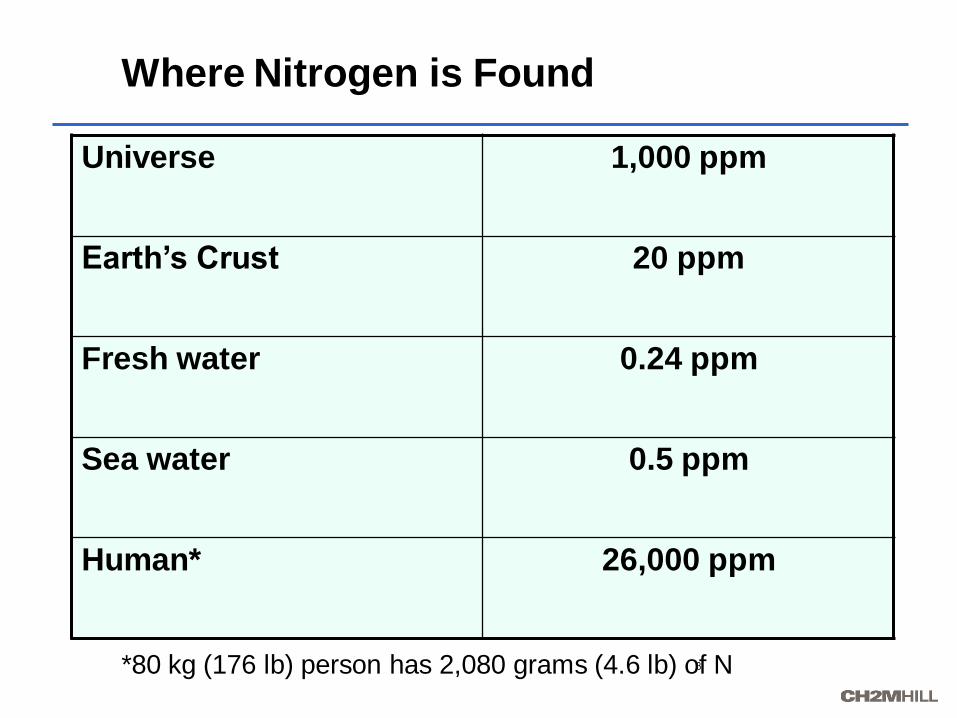
Where Nitrogen is Found
Universe 1,000 ppm
Earth’s Crust 20 ppm
Fresh water 0.24 ppm
Sea water 0.5 ppm
Human* 26,000 ppm
*80 kg (176 lb) person has 2,080 grams (4.6 lb) of N3
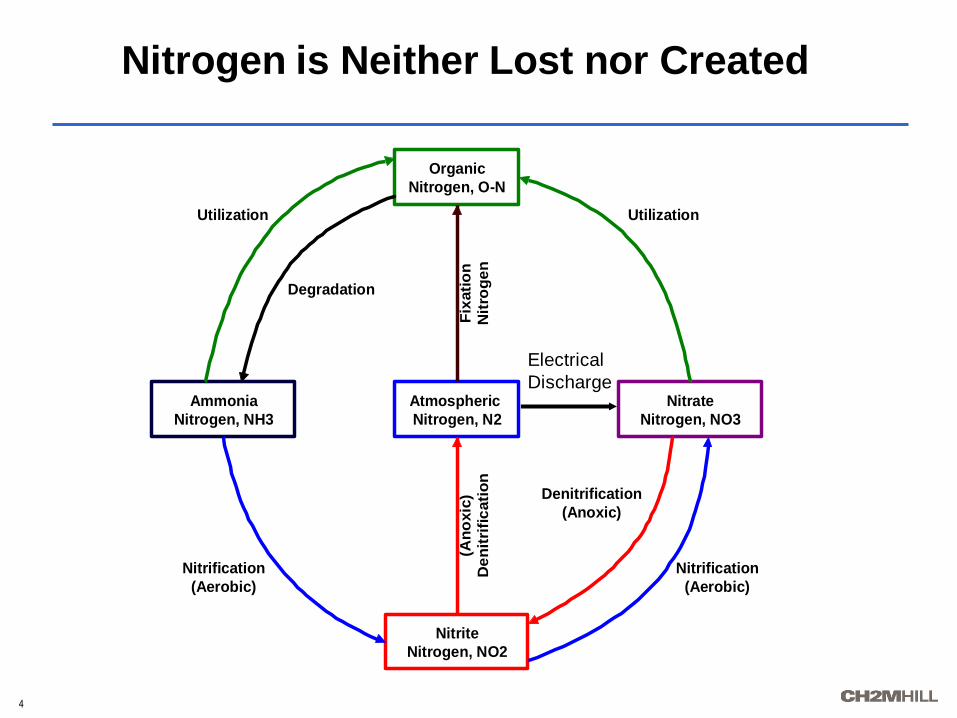
Nitrogen is Neither Lost nor Created
Nitrite
Nitrogen, NO2
Nitrification
(Aerobic)
Nitrification
(Aerobic)
Ammonia
Nitrogen, NH3
Atmospheric
Nitrogen, N2
De
nit
rifi
cati
on
(An
oxic
) Denitrification
(Anoxic)
Utilization
Degradation
Organic
Nitrogen, O-N
Utilization
Nitrate
Nitrogen, NO3
Nit
rog
en
Fix
ati
on
Electrical
Discharge
4

Reason for Concern: Nitrogen Has Doubled
in Ecosystems in Past 100 yr.
This increase coincides with increases in population
and industrialization
5
100 years

Impacts of Nitrogen Pollution
Ammonia and nitrite toxicity
Blue baby syndrome
Oxygen sag
– Eutrophication
– Hypoxia – dead zones
6

Hypoxia - Dead Zones
Even before the
oil spill the
Gulf has had
large areas of
DO < 2 mg/L
7
6,200 square miles

Natural Sources of Nitrogen in Water
Urea
Decomposition
Fixation
Electrical
Discharge
8

Manmade Nitrogen in Water
Combustion of
Fossil Fuels returns
as precip.
Agriculture –
– Farming – N fertilizers, N
fixers (soybeans, peas)
– Livestock
Point Sources
(WWTPs) - minor,
but significant9

Nitrogen in Wastewater
Human waste – 12 g N per person/day
– 150 gal/person/d (567 L) = 21 mg/L N
Food waste
Fertilizer manufacture
Contribution from detergents
10

Classification of Nitrogen Compounds
Total Kjeldahl
Nitrogen (TKN)Total Nitrogen
(TN)
Ammonia
Organic N
Nitrite,Nitrate
11
TIN

Concentrations of Nitrogen in Wastewater
Influent
Nitrogen mg/L
Total 20 to 85
Organic 8 to 35
Ammonia 12 to 50
Nitrite < 1
Nitrate < 1
12

Septage and Side Streams
Anaerobically Digested Sludge Dewatering Filtrate
800 mg/L TKN - typical
Septage 100-800, average 400 mg/L TKN
13
As we will
discuss later
these side
streams can be
a problem for
nitrifying
systems

Regulatory Agencies Moving Toward
Nutrient Limitations
Ammonia < 1.0 to < 3.0 mg/L
Total Nitrogen < 10 mg/L
14

3 ways N leaves WWTP
Effluent
Sludge
Atmosphere15
Nitrogen Removal
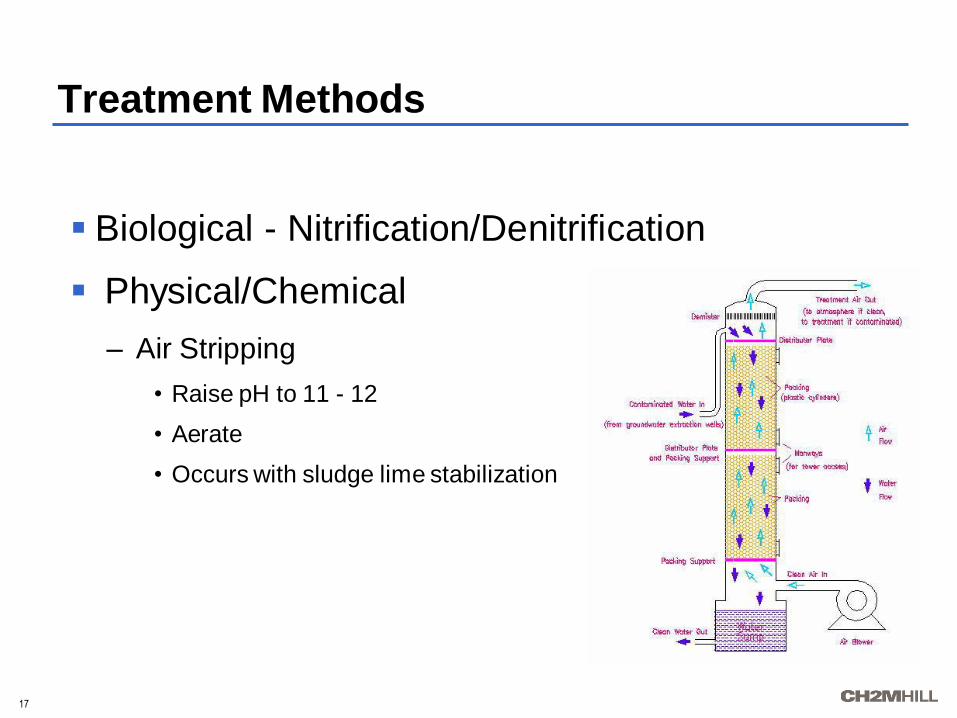
Treatment Methods
Biological - Nitrification/Denitrification
Physical/Chemical
– Air Stripping
• Raise pH to 11 - 12
• Aerate
• Occurs with sludge lime stabilization
17

Breakpoint Chlorination CurveAt breakpoint 7-10 Cl2 to 1 NH3
Breakpoint Chlorination Curve
Combined residual
Free and com
bined residu
al
Breakpoint
Chlorine dosage, mg/L
Inorganic
Compounds
Reducing
Agents
Initial
Chlorine
Demand
Oxidation of
Combined
Residual
F
ree
res
idu
al
Co
mb
ine
d
res
idu
al
Ch
lori
ne
re
sid
ual,
mg
/L
Formation of free
chlorine and presence
of chloro-organic
compounds not
oxidized
Formation of chloro-organic
compounds and chloramines
18

Nitrification: Results of Removing One
Pound of Ammonia Nitrogen
4.2 LB of oxygen are consumed
– Doubles Carbon Removal Oxygen Demand
7.1 LB of alkalinity are consumed
– Lowers pH
0.08 LB of inorganic carbon are consumed
0.17 LB of new cells are formed
19

Nitrification Step 1
Nitrosomonas
2NH4+ + 3O2 + inorganic-C >
2NO2- +2H2O + 4H+ + new cells
20
Forms Acid
Forms Nitrite
Consumes Oxygen
Nitrosomonas growth rate
controls the nitrification rate

Nitrification Step 2
Nitrobacter
2NO2- + O2 + inorganic-C > 2NO3
- + new cells
21
The growth rate of nitrifiers is 10 – 20
slower than heterotrophs.
Consumes Oxygen
Forms Nitrate
Nitrite from step 1
Nitrifiers' Growth Rate Depends on …
Total Kjeldahl Nitrogen (TKN) concentration
Dissolved oxygen (DO)
pH
Temperature
Alkalinity
22

Nitrifiers' Growth Rate Depends on
TKN Concentration
In a nitrifying system the nitrifier population will increase to
match the average TKN concentration
WWTP Diurnal TKN
0
20
40
60
80
100
120
140
0:00
1:00
2:00
3:00
4:00
5:00
6:00
7:00
8:00
9:00
10:00
11:00
12:00
13:00
14:00
15:00
16:00
17:00
18:00
19:00
20:00
21:00
22:00
23:00
Time of Day
lb/h
r
Belt Press
Septage
Influent
23
Nitrifier Concentration

Dissolved Oxygen (DO) Requirement
Nitrifiers are obligate aerobes.
AB target range DO should be 2.0 – 4.0 mg/L.
Nitrification can occur at DOs as low as 0.3 mg/L
At 17C and pH 7
0
0.5
1
1.5
2
2.5
3
0.0 0.5 1.0 1.5 2.0 2.5
DO
, m
g/L
Nitrification
53% inc in substrate utilization when DO raises from 0.5 to 2.0 mg/L
53% Increase
24

pH and Nitrification
Optimal - 7.2 to 8.0.
The growth at 6.5 rate is half the rate at pH 7.2
25

Temperature
Decrease from 20oC (68oF) to 15oC (59oF)
= 38% decrease in nitrifier growth rate
MCRT Required for Nitrification at Varying Temperatures
9
11
13
15
17
19
21
23
25
0 1 2 3 4 5 6 7 8 9 10
days
Te
mp
era
ture
C
Min MCRT (aeration tank only)
Operating MCRT (aeration tank only)
26

Alkalinity
Less than 50-60 mg/L inhibits nitrification
Typical raw wastewater = 120 – 250 mg/L alkalinity
For Example:
Influent TKN = 21 mg/L, then 7.1 x 21 = 149 mg/L + 50 =
~199 mg/L needed for nitrification
(Assumes no denitrification)
27

Denitrification
Heterotrophic bacteria
– Grow 10-20 times faster than nitrifiers
Switch from oxygen to nitrates in anoxic
conditions
COD/TKN ratio of 8+
Restores alkalinity
30
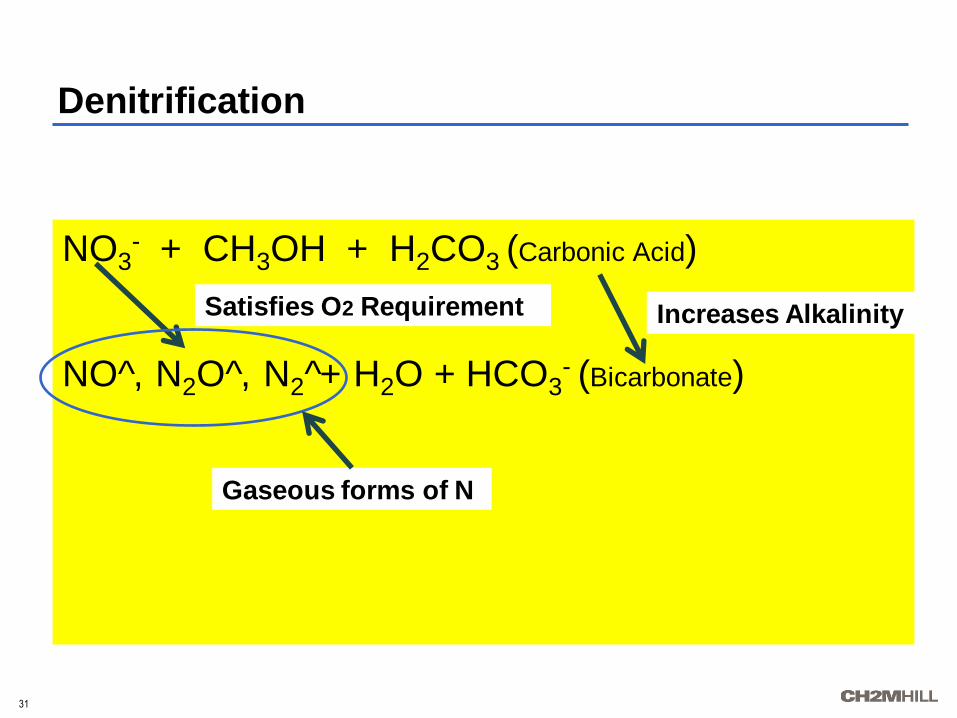
Denitrification
NO3- + CH3OH + H2CO3 (Carbonic Acid)
NO ,̂ N2O ,̂ N2^+ H2O + HCO3- (Bicarbonate)
31
Increases AlkalinitySatisfies O2 Requirement
Gaseous forms of N

Results of Removing One Pound of Nitrate
Nitrogen
2.86 LB of oxygen demand are satisfied
3.6 LB of alkalinity are produced
2.47 LB of organic-C are consumed
0.45 LB of new cells are produced
32
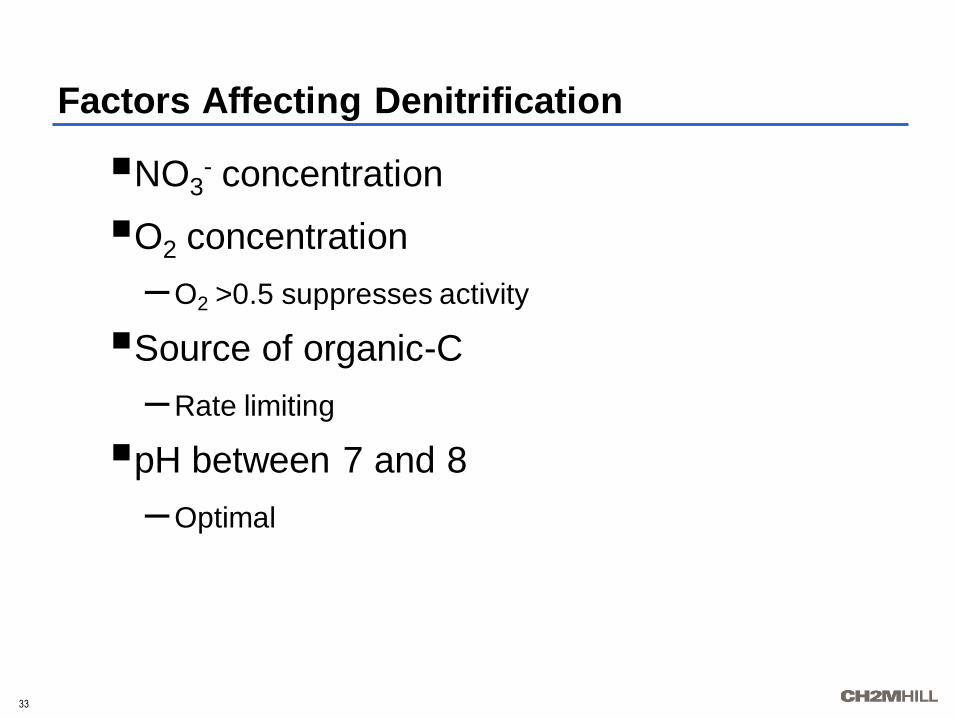
Factors Affecting Denitrification
NO3- concentration
O2 concentration
–O2 >0.5 suppresses activity
Source of organic-C
–Rate limiting
pH between 7 and 8
–Optimal
33

Benefits of Denitrification
Reduces nitrate and nitrite
Reduces BOD
Produces alkalinity (raises pH)
Reduces aeration requirement
Improves phosphorus removal
34

Oxygen
Ammonia
Nitrate
Aerobic
Anoxic
Nit/Denit Can Occur at the Same Time if O2
Cannot Penetrate to the Floc Completely
35
cBOD
Simultaneous
nitrification /
denitrification can
occur in the reactor
and/or the clarifier
N2

WWT Processes for Biological
Nitrogen Removal

Oxidation Ditch Used for N Removal
Aerator (Anoxic
zone)
(Aerobic
zone)Aerator
Overflow
RAS
WAS
Influent
to Clarifier
ML
SS
(Aerobic
zone)
DO probe
37
Carbon
Source
DO < 0.5 mg/L
NO3
Source
NO3 > N2^NH3 > NO3
DO 2-4 mg/L

SBR Operating Sequence to Remove N
Influent
Fill
Anoxic
(air off, mixer on)
React
Settle
Air off, mixer off
Decant
Effluent
Idle
WAS
Air and/or Mixer
on and/or off
Aerobic
(air on)1 2
3 4
5
38
Carbon
Source
NO3
Source
DO < 0.5 mg/LNH3 > NO3
NO3 > N2^
DO 2-4 mg/L
Denitrification may
start during idle
stage

Activated Sludge Nitrification/Denitrification
Process Schematic
Aerobic
RAS, 0.5 Q
Q Q
WAS
Anoxic
ML Pump
4Q
RAS
pump
39
NO3
Source
NH3 > NO3
NO3 > N2^
Carbon
Source
DO < 0.5 mg/L
DO 2-4 mg/L
Variations:•A2/O Process•Bardenpho Process•Membrane Bioreactor (MBR)

Operating Strategies

Non-Nitrification
Process Control Strategy
Anticipate wastewater temperature
– As WW temperature increases lower SRT
Match biomass to BOD
Monitor lead indicators
– Alkalinity (Influent – Effluent)
– Effluent Nitrites (NO2)
41

Non-Nitrification
Process Control Strategy
Maintain AB DO of 2 – 4 mg/L, especially at the front
end of the aeration basin
– Lower DO short term only if needed
If nitrification can not be avoided:
– Create anoxic zone to recapture energy, alkalinity
– Recycle mixed liquor
42

Nitrification without Denitrification
Control Strategy
Avoid clarifier denitrification
– Increase RAS Flow
Monitor pH for permit and process
Maintain Nitrifying SRT based on temperature, pH,
and DO.
– Use nitrification model to determine SRT
– Possibly run nitrification profile
43
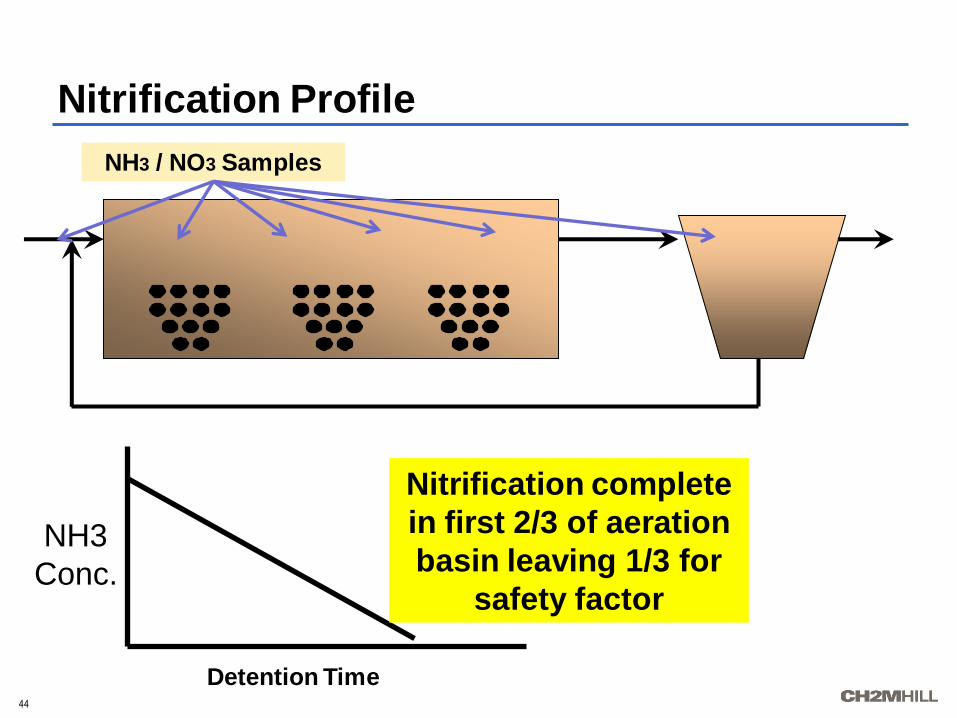
Nitrification Profile
NH3
Conc.
Detention Time44
Nitrification complete
in first 2/3 of aeration
basin leaving 1/3 for
safety factor
NH3 / NO3 Samples

Nitrification with Denitrification
Control Strategy
SRT based on temp, pH, DO + safety factor
Maintain enough biomass for BOD
Mixed liquor return 1-4 x Influent Flow
Return rates 30-100% Influent Flow
Monitor anoxic zone DO and Oxygen
Reduction Potential (ORP)
Monitor aerobic zone DO
45

Nitrification with Denitrification
Aerobic
RAS, 0.5 Q
Q Q
WAS
Anoxic
ML Pump
4Q
RAS
pump
46
NO3
Source
NH3 > NO3
NO3 > N2^
Carbon
Source
DO < 0.5
DO 2-4
Maintain DO at front end of aerobic zone > 2 mg/L to
reduce filamentous bacteria
ORP 0 - -300 mv

Sources of DO in Anoxic Zones
Mixed liquor recycle
Cascading influent
and/or RAS
Back mixing from
aerobic zone
47
Aerobic
An
ox
ic

Seasonal Nitrification
Surface water discharge, required to nitrify in
summer and not in winter.
Reversed when water is used for reuse in summer
and discharged in winter.
48

Moving from Non-Nitrifying to Nitrifying
Target nitrifying SRT for conditions
Start 3-4 sludge ages before target
– Remember nitrifiers are slow growing
Change rapidly to minimize nitrite lock
Use nitrifying seed for < 13C (55F)
49

The Reverse - Nitrifying to Non-Nitrifying
Target non-nitrifying SRT
Begin at end of nitrifying period
Decrease SRT rapidly
50

Move Rapidly In and Out of Nitrification
to Avoid Partial Nitrification
0
20
40
60
80
100
2 4 6 8 10 12 14
MCRT, days
Pe
rcen
t N
itri
fic
ati
on
For 20 degrees C
Partial
Nitrification
As the temperature decreasesthe MCRT required increases
51
Denitrification in
Clarifier
NO2 > N2^
NO2 and NH3
Interference with Cl2
Disinfection

O2 required
changes moving
in and out of
nitrification
Seasonal Nitrification
Oxygen Requirement for cBOD and nBOD
0 5 10 15 20 25 30
MCRT, Days
0
20
40
60
80
100
O2
Consumed
(relative)
0 5 10 15 20 25 30
MCRT, Days
nBOD
cBOD
52

Nitrification/Denitrification with
Biological Phosphorus Removal
Biological P removal works best at low SRT
Same Strategy as Nitrification/Denitrification:
+ Minimum SRT based temp, pH, DO
+ Nitrates in RAS upsets P removal
53
Aerobic
RAS, 0.5 Q
Q
WAS
Anoxic
Q
Anaerobic
1-2Q
RAS
pump
ML Pump
DO < 0.5DO = 0
DO = 2-4
Carbon
Source
P ReleaseP Uptake
NO3 ~ 0
ORP <-300 mv
ORP 0- -300 mv

Nitrogen Treatment Problems

Toxics that inhibit the nitrification
process
Herbicides > 0.0 mg/L
– Collection system root control
Thiourea > 0.0 mg/L
Halogenated solvents > 0.0 mg/L
Heavy metals > 10 to 20 mg/L
Cyanide > 1 to 2 mg/L
Wood preservatives > 20 mg/L
55

Ammonia Bleed Through
WWTP Diurnal TKN
0
20
40
60
80
100
120
140
0:00
1:00
2:00
3:00
4:00
5:00
6:00
7:00
8:00
9:00
10:00
11:00
12:00
13:00
14:00
15:00
16:00
17:00
18:00
19:00
20:00
21:00
22:00
23:00
Time of Day
lb/h
r
Belt Press
Septage
Influent
56
High NH3 loading
caused by side
streams
Nitrifiers
match avg.
loading
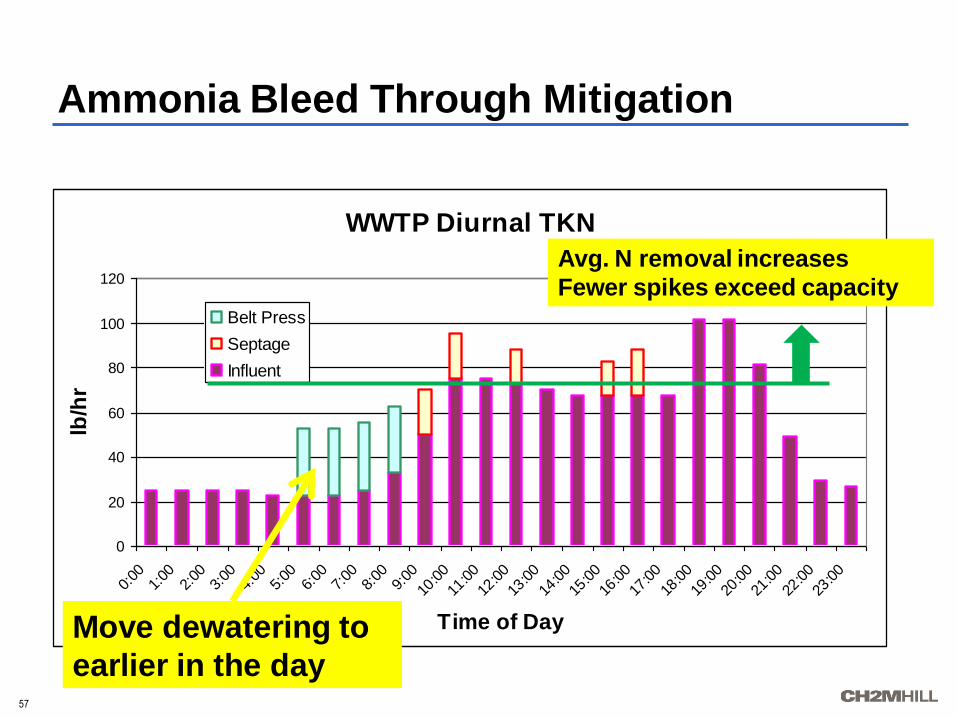
Ammonia Bleed Through Mitigation
WWTP Diurnal TKN
0
20
40
60
80
100
120
0:00
1:00
2:00
3:00
4:00
5:00
6:00
7:00
8:00
9:00
10:00
11:00
12:00
13:00
14:00
15:00
16:00
17:00
18:00
19:00
20:00
21:00
22:00
23:00
Time of Day
lb/h
r
Belt Press
Septage
Influent
57
Move dewatering to
earlier in the day
Avg. N removal increases
Fewer spikes exceed capacity

Chlorination
Erratic nitrite demand
Breakpoint chlorination
58

Excess Filamentous Bacteria Causing
Foaming and/or Bulking
59
Quick Fix
Cl2 to RAS,
Mixed Liquor
For the long term …
Reduce Solids
Loading to
Clarifier

Control of Filamentous Bacteria
Maintain a minimum SRT for process goals
– Filaments grow more slowly than floc formers
Use clarifier model to predict loading
60

Control of Filamentous Bacteria Foaming
Do not let foam accumulate
– Keep foam moving toward skimmers.
Do not return foam to the head of the plant.
– Ideally get foam completely out of the system.
Spray concentrated (0.1 to 0.35 percent) chlorine
directly on foam accumulations
– Not very effective
61

Control of Foam in Anaerobic Digesters
Foam gas separator for fixed cover
Spray bars for floating cover
Treat the foam at it’s source – the activated
sludge
62

Discussion