nitrogen plasma modification and chemical derivatization of polyethylene surfaces - an in situ study...
TRANSCRIPT
Full Paper
Nitrogen Plasma Modification and ChemicalDerivatization of Polyethylene Surfaces –An In Situ Study Using FTIR-ATR Spectroscopy
Claus-Peter Klages,* Alena Hinze, Zohreh Khosravi
Chemical derivatization reactions of nitrogen plasma-treated surfaces with aromaticaldehydes, such as the prototypic 4-trifluoromethyl-benzaldehyde (TFBA), have for a longtime been considered selective for primary amines. Results of an in situ study using FTIR-ATR
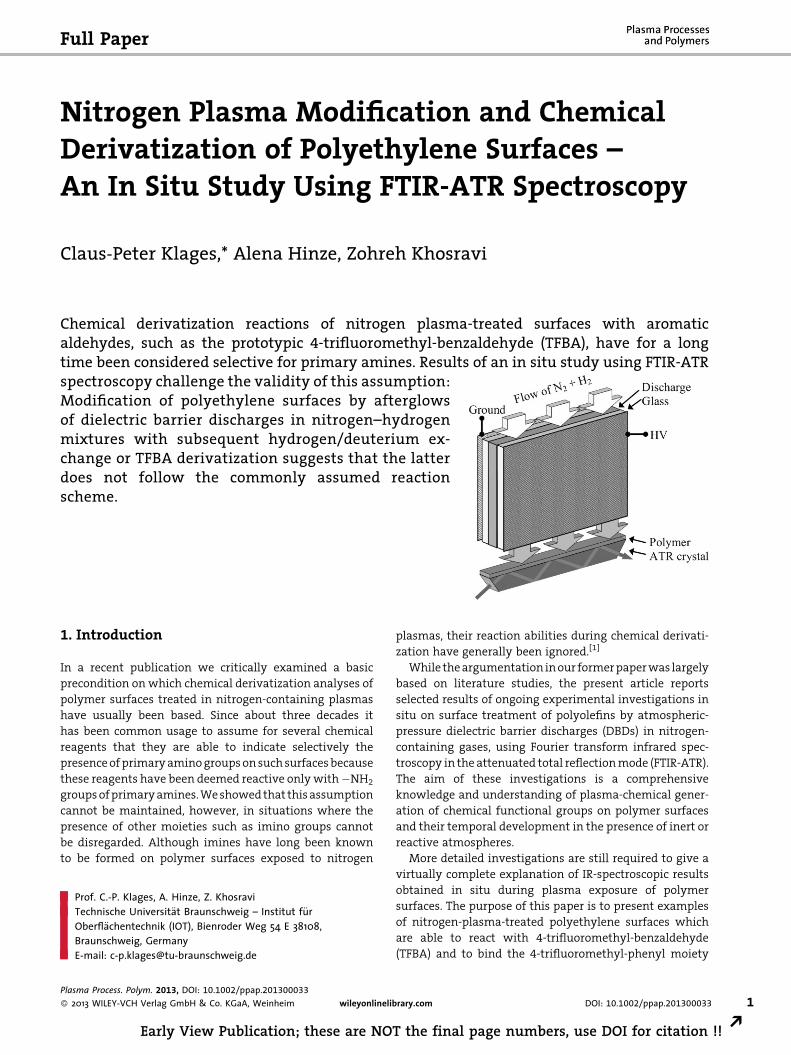
spectroscopy challenge the validity of this assumption:Modification of polyethylene surfaces by afterglowsof dielectric barrier discharges in nitrogen–hydrogenmixtures with subsequent hydrogen/deuterium ex-change or TFBA derivatization suggests that the latterdoes not follow the commonly assumed reactionscheme.Prof. C.-P. Klages, A. Hinze, Z. KhosraviTechnische Universit€at Braunschweig – Institut f€urOberfl€achentechnik (IOT), Bienroder Weg 54 E 38108,Braunschweig, GermanyE-mail: [email protected]
Plasma Process. Polym. 2013, DOI: 10.1002/ppap.201300033
� 2013 WILEY-VCH Verlag GmbH & Co. KGaA, Weinheim wileyonlinelibrary.com
Early View Publication; these are NOT the final
r reaction abilities during chemical derivati-
1. IntroductionIn a recent publication we critically examined a basic
precondition on which chemical derivatization analyses of
polymer surfaces treated in nitrogen-containing plasmas
have usually been based. Since about three decades it
has been common usage to assume for several chemical
reagents that they are able to indicate selectively the
presenceofprimaryaminogroupsonsuchsurfacesbecause
these reagents have been deemed reactive onlywith�NH2
groupsofprimaryamines.Weshowedthat thisassumption
cannot be maintained, however, in situations where the
presence of other moieties such as imino groups cannot
be disregarded. Although imines have long been known
to be formed on polymer surfaces exposed to nitrogen
plasmas, thei
zation have generally been ignored.[1]
While theargumentation inour formerpaperwas largely
based on literature studies, the present article reports
selected results of ongoing experimental investigations in
situ on surface treatment of polyolefins by atmospheric-
pressure dielectric barrier discharges (DBDs) in nitrogen-
containing gases, using Fourier transform infrared spec-
troscopy in the attenuated total reflectionmode (FTIR-ATR).
The aim of these investigations is a comprehensive
knowledge and understanding of plasma-chemical gener-
ation of chemical functional groups on polymer surfaces
and their temporal development in the presence of inert or
reactive atmospheres.
More detailed investigations are still required to give a
virtually complete explanation of IR-spectroscopic results
obtained in situ during plasma exposure of polymer
surfaces. The purpose of this paper is to present examples
of nitrogen-plasma-treated polyethylene surfaces which
are able to react with 4-trifluoromethyl-benzaldehyde
(TFBA) and to bind the 4-trifluoromethyl-phenyl moiety
1DOI: 10.1002/ppap.201300033
page numbers, use DOI for citation !! R

C.-P. Klages, A. Hinze, Z. Khosravi
2
REa
with a certain area density rTFBA, although primary amines
with a corresponding density rNH2¼ rTFBA cannot be
detected by FTIR spectroscopy. It will also be shown
that several of the IR spectroscopic results are not in a
qualitative agreement with a selective reaction of primary
amines with TFBA furnishing the corresponding imines,
see Equation (1):
CF3CH
ONH2 +R CF3C
H
N + H (1)2O
R
Thereby additional, experimental arguments are pre-
sented against the thesis of primary-amine selectivity of
TFBA.
Figure 1. Schematic view of the experimental setup used in thisstudy, not to scale. The figure shows a bubbler flask filled withheavy water, D2O. For chemical derivatization this flask is filledwith TFBA.
2. Experimental
2.1. Materials
Decalin (decahydronaphthalene, mixture of cis and trans isomers,
anhydrous, �99%), isopropanol (ultrapure, 99.9%), xylene (p-xylene,anhydrous, �99%), hexadecane (99%), 3-aminopentane, 1-amino-
hexane, 1-aminooctane, TFBA (98%), and heavy water (D2O, deuteri-
um oxide, 99.9at% D) were obtained from Sigma–Aldrich Chemie
GmbH (Schnelldorf, Germany), 2-aminooctane from Ominilab-
Laborzentrum (Bremen, Germany), 1-amino-2-ethylhexane from
Acros Organics (Nidderau, Germany), and used without further
purification. Sodium carbonate was from Merck (Darmstadt,
Germany). LDPE foils were purchased from Goodfellow GmbH (Bad
Nauheim, Germany). Gases were cleaned by purification systems
purchased fromMesser Griesheim GmbH, (Duisburg, Germany) and
Spectron GmbH (Frankfurt am Main, Germany).
2.2. Film Preparation and Characterization
Ultrathin LDPE films were prepared from purified polymer
obtainedbydissolutionof LDPEfoils inhotxyleneandprecipitation
in isopropanol. Typically 10 g of the polymer were dissolved in
200ml xylene at a temperature of 80 8C and precipitated by slowly
pouring the hot solution into 1 L of warm (40–50 8C), well-stirred
isopropanol. The precipitate was collected on a 125mm diameter
filter paper using a B€uchner funnel on a vacuumflask andwashed
thoroughly with small portions of warm isopropanol, 1 L in total.
The polymer was then dried in an oven at 60 8C overnight. This
procedure was repeated twice. Purity checks of the obtained
powder using ex situ FTIR-ATR (diamond, 508) show that the
purified product is virtually free of fatty acid amides.
Hot solutions of the purified LDPE in decalin were used to spin-
coat ultrathin polymer films with thicknesses between 50 and
200nm on the preheated ZnS ATR crystal. In order to obtain a
thickness of about 100nm, 100mg LDPE were dissolved in 10ml
decalin at 80–90 8C under continuous magnetic stirring. The ZnS
crystal, coveredbyaglasscup,waspreheatedonahotplate (150 8C).For film preparation the crystal was transferred to a spin coater
(modelWS-400E-6NPP, Laurell Technologies,NorthWales, PA,USA)
equipped with a suitable holder featuring a rectangular recess to
accommodate the crystal. A fewdrops of thehot solutionof LDPE in
decalin were transferred to the hot ZnS substrate using a glass
Plasma Process. Polym. 2013, DOI: 10.1002/ppap.201300033
� 2013 WILEY-VCH Verlag GmbH & Co. KGaA, Weinheim
rly View Publication; these are NOT the final pag
pipette. Substrate rotation was started and accelerated to a final
spinning rate of 1 100 rpm, held for 35 s.
Ellipsometric measurements on polymers thin film were made
using a spectroscopic ellipsometer (SE 850 DUV, SENTECH Instru-
ments GmbH, Berlin, Germany) at incident angles of 508, 608, and708 in thewavelength range from380 to 900nmusing a dispersion
model for the visible region. Thicknesses at minimum three
differentpoints on each layerwere obtainedbyprocessing thedata
using theSpectraRay/3softwarepackage (SENTECH)withaCauchy
model for the polymer layer.
2.3. In Situ FTIR-ATR Measurements
Across-sectionof theexperimental setup is shownschematically in
Figure 1: FTIR-ATR measurements were done on an FTIR
spectrometer with series measurement capability (Nicolet 5700,
ThermoFisherScientificGmbH,Dreieich,Germany), equippedwith
an MCT detector and a ZnS ATR crystal (length�height�width
¼80�4�10mm3, u¼458, from Korth Kristalle GmbH, Hamburg,
Germany) using unpolarized light and 4 cm�1 spectral resolution.
The afterglowplasma treatmentwas achieved by aDBD reactor
made from glass with an open cross-section of 80� 1mm2 and an
active volume of 70� 50�1mm3, mounted above the horizontal
ATR accessory (Pike Technologies, Madison,WI, USA) in the sample
chamber of the IR spectrometer. The gas flow (N2þ 4% H2) of
typically 16 Lmin�1 STP during plasma treatment could pass the
dischargeand reachthepolymersurface,positionedatadistanceof
10mm from the down-stream edge of the discharge within about
3ms after leaving the plasma zone with an average velocity of
roughly 3ms�1. The discharge was powered by a commercial
generator (model 7010 R, SOFTAL electronics GmbH, Hamburg,
Germany). The peak voltage and frequency were typically 12.5 or
12 kV (ignition voltage 6.5 kV) and 20kHz, respectively.
In order to avoid electromagnetic interference between the
high-voltage circuit powering the plasma and the electronics of
the spectrometer, the DBD reactor was encased in a Faraday cage
DOI: 10.1002/ppap.201300033
e numbers, use DOI for citation !!

Nitrogen Plasma Modification and Chemical Derivatization
fabricated from a wire mesh. This shield and the ATR accessory
were grounded.
Duringandafter exposureof thepolymer surfaceon theZnSATR
crystals to afterglows of DBDs in mixtures of N2 with H2, infrared
spectra were taken in situ. In order to unravel the complex spectra
and to isolate the characteristic ‘‘scissoring’’ deformation vibration
of primary amino groups d(NH2) from interfering C55C and C55N
stretching vibrational bands, an exchange reaction with vapor of
heavy water (D2O) was applied, carrying the vibration d(NH2)
(about 1 620 cm�1) to d(ND2), located in the relatively empty
wavelength region around 1200 cm�1. The densities of functional
groups reacting with TFBA were quantified utilizing the C�CF3stretching vibration appearing at 1 324� 1 cm�1. Both, the gas-
phase derivatization and the exchange reaction with D2O or H2O
vapor were performed by exposing the polymer surface to gas
flows, typically 1 Lmin�1 STP, of nitrogen bubbled through a flask
containing the appropriate reagent (TFBA, D2O, or H2O) at room
temperature, see Figure 1.
Zb
2.4. Quantitative Evaluation of IR Spectra
In thefollowingweuse thesymbol e for thedecadicmolarabsorption
coefficient as defined in Lambert–Beer’s law, AT log(I0/I)¼ ecl, forthe absorbance AT of a sample with path length l, containingthe absorbing species at molar concentration c, measured in a
transmissionexperimentwith incident and transmitted intensities
I0 and I, respectively.[2] The absorption coefficient a is defined
by the equation I/I0¼ exp(�al), which for low absorbance can be
approximated by I/I0¼ 1�al. For ATR measurements Harrick
by analogy defined an effective thickness de using the equation
R¼ I/I0 1�ade for the reflectance R in a single-reflection
configuration (ade�1). With N-fold reflections the resulting total
reflectance is RN¼RN¼ (1�ade)N� 1�Nade.[3] As it is common
practice, results of ATR spectra are shown in this paper as
absorbance, A¼ log(1/RN), versus wavenumber n in cm�1.
aLetteroptica
Plasma
� 2013
A ¼ log1
RN
� �ffi N a de=lnð10Þ ð2Þ
The integral of A over an absorption band b of a vibration is
given by the equations
ZbAdn ¼ N de
Zb
adn=lnð10Þ ¼ N c de
Zb
edn ð3Þ
The integral over e on the right-hand side can be expressed using
the integrated (or integral) absorption intensity;[4]weuse the letter
B for this quantitya:
Zb
Adn ¼ N c de B=lnð10Þ;
B 1
cl
Zb
lnI0Idn ¼ lnð10Þ
Zb
ednð4Þ
A is frequently used in the literature; we reserve this letter forl absorbance.
Process. Polym. 2013, DOI: 10.1002/ppap.201300033
WILEY-VCH Verlag GmbH & Co. KGaA, Weinheim
Early View Publication; these are NO
For many infrared absorption bands integrated intensities B
can be found in the literature. It is important to pay attention to
the units used: While path length is generally given in cm and
concentration inmol L�1, themolarabsorptioncoefficientmayeither
be based on decadic logarithms like in the ‘‘practical units’’ used by
Wexler[5] or on natural logarithms as, for example, in the papers by
Ramsay[4] as well as by Yagudaev et al.,[6] and in this paper.
Harrick’s definition of an effective thickness is useful for
samples which are either thick, compared with the penetration
depth of the radiation dp (bulk samples), or thin with respect
to dp (thin film samples). For thin films of thickness d, the ratio
de/d f is a function of the refractive indices ni of the three
materials involved (i¼1: ATR element, i¼2: thin film, i¼3: third
phase – usually air), the angle of incidence u, and the state of
polarization of the light with respect to the plane of incidence.
Owing to the virtually constant electric field of the evanescent
wave over a thin film sample of thickness d�dp the absorbance
is independent of the detailed distribution of absorbers over
the thickness, as long as the concentration average cav over d is
the same. Therefore in case of a non-uniform distribution over dthe product cd can be replaced by cavd, which is the area density r
of absorbers:
T the
Adn ¼ N c d f B=lnð10Þ ¼ N r f B=lnð10Þ ð5Þ
If B is known, Equation (5) can be used to determine r from
the measured vibrational band area and f as calculated from
Harrick’s formulae.[3]
If literature data forB areunavailable, it canbedetermined from
ATR measurements on solutions (index s) containing known
concentrations cs of suitable reference molecules featuring the
oscillator: After Equation (4), B can be calculated from a plot of
the integrated absorbance as a function of molar concentration:
The slope of this plot equals the product NdesB/ln(10). In the
reference measurements the sample (solution) thickness on the
ATR element must exceed the penetration depth dp by far and desis the effective thickness for a solution as a bulk sample.
We used solutions of aldimines in hexadecane prepared in situ
from TFBA and a 10–20% excess of 3-pentyl-amine or n-hexyl-amine in order to determine the area of the C�CF3 stretching band
at 1 324 cm�1 by integration over a range of �25 cm�1. Measure-
mentswereperformedwith s-polarized lightusinga single-bounce
diamond ATR crystal at a resolution of 1 cm�1. The Smart
DuraSamplIR accessory used provides a peak incidence angle of
508 (statement of the manufacturer, SensIR Technologies, now
part of Smith’s Detection, Danbury, CT, USA). Figure 2 shows the
resultingband areas for different concentrations. The solvent used,
hexadecane,hasquitesimilar refractive indices inthevisible region
(nD¼1.4345 at 20 8C)[7] and in the far infrared (n(80 cm�1)¼ 1.428
at 20 8C).[8] To calculate the effective thickness for ATR measure-
ments with a diamond crystal (n1¼ 2.4; N¼1) we adopt n2¼1.43
for the hexadecane solutions to arrive at des¼0.39l/2.4¼1.23mm
at a wavenumber of n¼ 1/l¼1 324 cm�1. From the slope of the
linear fit to the data points in Figure 2 the integrated absorption
intensity of the C�CF3 stretching band in the aldimines can be
calculated as B¼ 370kmmol�1.
Correspondingly integrated absorption intensities were deter-
mined for the d(ND2) vibration in three isomeric deuterated
3www.plasma-polymers.org
final page numbers, use DOI for citation !! R

0.00 0.02 0.04 0.06 0.08 0.10 0.12
0.00
0.05
0.10
0.15
0.20
0.25
alkyl = 3-pentyl alkyl = 1-hexyl linear fit
Ban
d ar
ea /
cm-1
Concentration / mol/liter
Figure 2. Areas of IR absorption bands at 1 324 cm�1 due toC�CF3 stretching vibrations in two N-alkyl-4-trifluoromethyl-benzaldimines in hexadecane solutions as a function ofconcentration (ATR, diamond, 508, single reflection, s-polarization).The slope of the linear fit is 2.00L cm�1mol�1.
Table 1. Integrated band intensities B and typical peak positions nmaimines, amides, acrolein CH255CH�CH55O as prototypic unsaturat
Vibration, compound class B/kmmol�1
d(NH2), amines 30
d(ND2), amines 18 (theor.)
25 (exp.)
nasym(NH2), amines 5
nsym(NH2), amines 2
n(NH), sec. amines 1–2
n(C55N), alkyl-CH55N-alkyl 85
39
n(C55N), aryl-CH55N-alkyl 58
n(C�CF3), 4-CF3-benzaldimines 370
Amide Iþ II, prim. amides 460
Amide I, sec. acetamides 230
Amide II, sec. acetamides 210
n(C55O), CH255CH�CH55O 220
n(C55O), satur. aliph. ketones 170
n(C55O), a,b-unsat. ketones, trans 185
n(C55C), a,b-unsat. ketones, trans 25
n(C55O), a,b-unsat. ketones, cis 140
n(C55C), a,b-unsat. ketones, cis 90
nasym(CO2), aliphat. carboxylates 830
a)Data from Wexler[5] were multiplied by ln(10)�2.3 to account for
rounded to 0 or 5 in the last digit; b)Average of data obtained withc)Measured on an imine formed in situ from hexanal and 1-amino-2-
emaxDn ln(10) is given.
C.-P. Klages, A. Hinze, Z. Khosravi
Plasma Process. Polym. 2013, DOI: 10.1002/ppap.201300033
� 2013 WILEY-VCH Verlag GmbH & Co. KGaA, Weinheim4
REarly View Publication; these are NOT the final pag
primary amines with the molecular formula C8H17ND2: 5ml of a
3.1M solution of the corresponding amine C8H17NH2 (1-amino-
octane, 2-aminooctane, or 1-amino-2-ethylhexane) in hexadecane
was intensely shaken two times with 10ml D2O in a separating
funnel, then the organic phasewas thoroughly dried (Na2CO3) and
measured as above, using an integral over the resulting ND2
scissoring band (FWHM�30 cm�1) from 1160 to 1260 cm�1. With
an effective depth des of 1.35mm at 508 and 1200 cm�1, the
resulting average B value is 25 kmmol�1.
Using the described ATR method instead of transmission
measurements for the determination of B brings about a source
of a systematic error, owing to the not exactly known angular
spread of the IR beam in the ATR crystal. We estimate that the
size of this error is in the order of�10%. For themain conclusion of
the present paper to be developed below this error does not play
a role because only the ratio B[n(C�CF3)]/B[d(ND2)]¼15 is of
relevance for it!
Table 1 is a collection of integrated band intensities B and
typical peak positions nmax of several important vibrational
infrared absorption bands which are expected to play a role for
FTIR spectroscopy of nitrogen-plasma-treated polymer surfaces.
An unsaturated aldehyde and open chain ketones are included
x of characteristic vibrational infrared absorption bands of amines,ed aldehyde, ketones and carboxylate ions.
nmax/cm�1 (solvent) Ref.a)
1620–1 625 (heptane) [6]
1 201 (exp., Kr) [9]
1 195–1 205 (hexadecane) This workb)
3 375 [5]
3 310 [5]
3 300 [5]
1 670 (diglyme) Unpubl.c)
1 671 (CHCl3) [10]d)
1 654 (CHCl3) [10]d)
1 324 (hexadecane) This work
1 690 (CHCl3) [5]
1 670 (KBr) [5]
1 540 (KBr) [5]
1 696 (CHCl3) [11]
1 715 (non-polar solvent) [5]
1 690 (non-polar solvent) [5]
1 660 (non-polar solvent) [5]
1 680 (non-polar solvent) [5]
1 630 (non-polar solvent) [5]
1 550–1600 [5]
different definition of molar absorption coefficient and generally
1-aminooctane-d2, 2-aminooctane-d2, 1-amino-2-ethylhexane-d2;
ethylhexane in diglyme over molecular sieve; d)For B the value of
DOI: 10.1002/ppap.201300033
e numbers, use DOI for citation !!

Nitrogen Plasma Modification and Chemical Derivatization
as possible products of reactions of imines with water or TFBA;
carboxylate ions may form upon exposure of amine, imine, and
other basic groups on the polymer surface to the vapor of volatile
organic acids.
3. Results and Discussion
3.1. Plasma Afterglow Treatment of LDPE Film
Surfaces
Figure 3 shows – from bottom to top – a selection of FTIR
spectra taken in situ at intervals of about 10 s during 30 s
plasma afterglow treatment of an 80nm LDPE film under
standard conditions, using a spectrum taken before the
plasma treatment as background spectrum. The first
spectrum (bottom) was taken about 1 s after the plasma
was ignited, the top spectrum corresponds to the situation
immediately at the end of the plasma treatment, and the
dashed spectrum was obtained 18 s after the plasma
treatment was finished. The spectra reveal effects of the
plasma treatment on the ZnS crystal, the ‘‘bulk’’ of the PE
film and on the PE surface.
Plasma effects on the ZnS crystal become visible in the
baseline shift in Figure 3. These shifts are not due to
offsetting spectra against each other but they are a result of
the exposure of the ZnS crystal to the plasma and are
similarly also observed in the absenceof aPEfilm.Although
the refractive indexn of ZnS in the IR region is temperature-
dependent, the increase of n with temperature, dn/dT¼ 2.9� 10�5 K�1 (5.5mm)[12] is too small to explain the
increase of baseline absorption during plasma exposure
(only)byan increaseof the insertion lossdue toenhanced IR
reflections. During standard treatment the increase of
3500 3000 2500 2000 1500 1000-0.010
-0.008
-0.006
-0.004
-0.002
0.000
0.002
Abs
orba
nce
Wavenumber / cm-1
From bottom to top: 1 s 13 s 23 s 32 s 18 s
Figure 3. Spectra of 80nm LDPE film on ZnS taken at differenttimes (see legend) during and after 30 s plasma treatment.Plasma was shut off after 30 s; the last spectrum (dashed) wastaken 18 s after the end of plasma exposure.
Plasma Process. Polym. 2013, DOI: 10.1002/ppap.201300033
� 2013 WILEY-VCH Verlag GmbH & Co. KGaA, Weinheim
Early View Publication; these are NO
baseline absorbance at 2 000 cm�1 is between 0.001 and
0.007, depending on the individual crystal used. After the
treatment theabsorbance slowly recoverswitha relaxation
time in the order of hours. At the moment we can only
speculate that the origin of these effects are possible very
weakUV-inducedbroadband IR absorptions due to electron
traps which are populated by excited electrons, similar to
UV-induced IR absorption bands observed – albeit many
orders of magnitude stronger – in deliberately doped ZnS
crystals.[13]
Aside from positive bands due to the formation of new
functional groups on the polymers surface the spectra
shown in Figure 3 also reveal the effects of plasma-induced
etching of the LDPE film: Because a spectrum of the film
before plasma action was used as a background, etching
away PE material results in negative absorption bands,
mainly in the regions of stretching vibrations of aliphatic
C�H bonds (n(CH2), 2 800–3 000 cm�1) and of deformation
vibrations (d(CH2), scissoring, 1 400–1 500 cm�1). An ex-
panded view of the latter region is shown in Figure 4
featuring two curves: A spectrum of the 80nm LDPE film
itself (with theuncoated crystal as background, inbold) and
a difference spectrum representing the etched-away
material as a positive spectrum after multiplication of
the original difference (spectrum before� spectrum after
plasmatreatment)bya factorof15.Obviously thespectrum
of theetchedmaterial isnot exactlyadownsized copyof the
original: The two peaks at 1 461 and 1473 cm�1 are much
better separated and quite similar in intensity, while in
the spectrum of the film the 1463 cm�1 component clearly
dominates. Even more pronounced are differences in the
1 330–1 390 cm�1 range: Interestingly the spectrum of
etchedmaterial showsonlyapeakat 1 378 cm�1 –probably
1500 1475 1450 1425 1400 1375 1350 1325-0.02
0.00
0.02
0.04
0.06
0.08
0.10
0.12
0.14
Abs
orba
nce
Wavenumber / cm-1
80 nm LDPE on ZnS Difference before - after
30 s plasma treatment (x 15, arb. offset)
Figure 4. Spectrum of 80nm LDPE film on ZnS before plasmatreatment and difference of spectra taken before and after 30 splasma treatment in the region of deformation modes d(CH2) at1 463 and 1 473 cm�1 and wagging modes and the symmetricmethyl (‘‘umbrella’’) deformation at 1 378 cm�1.
5www.plasma-polymers.org
T the final page numbers, use DOI for citation !! R

C.-P. Klages, A. Hinze, Z. Khosravi
6
REa
the symmetric ‘‘umbrella’’ deformationvibrationofmethyl
groups in side chains of the polymer – while bands with
maxima at 1 363 and 1 359 cm�1 of comparable intensity –
wagging vibrations of disordered polymethylene chain
segments of the polymer – are also visible in the original
film. In principle three different possible reasons have to
be considered in order to explain the observed differences:
(i) A stratification of the original film with differences
in structure between the bulk of the film and the etched-
away surface region of typically about 3–6nm thickness
within 30 s plasma treatment – due to segregation and
crystallization processes during film formation or there-
after; (ii) preferential etching of phases or crystallites
with special orientations, and/or (iii) an effect of UV
radiation from the plasma acting not only on the surface
region but more or less through the whole film. For a
more detailed discussion of these issues, more systematic
investigations with films of different thicknesses and
varying etching depths are required, supported by
other methods which are able to characterize the film
structure.
In the context of the present paper the formation of
new vibrational bands due to new functional groups at
the polymer surface is of more interest: Figure 5 shows
the region of 1 350–1 800 cm�1 in which the stretching
vibrations of double bonds C55C, C55N, and C55O, as well
as deformation vibrations of XH2 moieties (CH2, NH2, OH2)
are typically located. The spectral regionbetween2 700and
3 500 cm�1 of X–H stretching vibrations shows broad
maxima at 3 160 and 3 320 cm�1.
In Figure 5, a group of at least four overlapping
absorption bands is developing between 1 550 and
1800 1700 1600 1500 1400
0.000
0.001
0.002
0.003
0.004
0.005
0.006
0.007
0.008
Abs
orba
nce
Wavenumber / cm-1
From bottom to top:Spectra taken at intervals of about 5 s during30 s plasma afterglow treatment in N2 + 4 % H2
Figure 5. X55Y stretching regions of spectra taken at intervals of5 s during plasma afterglow treatment of an LDPE film surfaceunder standard conditions. The first spectrum at the bottom ofthe series was taken at the start of the plasma exposure.Following spectra are offset by 0.0005 absorbance units each.
Plasma Process. Polym. 2013, DOI: 10.1002/ppap.201300033
� 2013 WILEY-VCH Verlag GmbH & Co. KGaA, Weinheim
rly View Publication; these are NOT the final pag
1 720 cm�1 during plasma exposure. Originally this region
was expected to be dominated by a band due to �NH2
groups: Primary aliphatic amines have scissoring defor-
mation vibration d(NH2) bands of medium-to-strong
intensity in the range of 1 580 to 1 650 cm�1, the most
probable wavenumber range of appearance is from
1620 to 1 625 cm�1.[6,9,14] (Secondary amines sometimes
show weaker bending absorptions between 1 490 and
1 580 cm�1.[14])
However, a peak maximum in this range was not seen;
obviously the majority of absorption bands are due to
unsaturated groups. Most probable candidates are C55N
and C55C double bonds but also the formation of carbonyl
compounds featuring C55O bonds must be taken into
account because at atmospheric pressure even gases of
very high purity may contain enough oxygen to form a
monolayer of oxygenatedgroups inquite a short time: Even
at an oxygen content of only 100ppb (O2 partial pressure
¼ 0.01 Pa), the wall collision rate of O2 is still about
300nm�2 s�1 resulting in about 9 000 collisions per nm2
during the plasma treatment.[16] One ‘‘successful’’ collision
on 1nm2 of the active surface, resulting in formation of a
carbonyl group would already give an easily measurable
contribution to the spectrum, due to the high integrated
intensities of C55O vibrations.
The interpretation of the bands in the 1 550 to
1 700 cm�1 region is complicated by the unsaturation of
carbon–carbon bonds occurring along with the formation
of N-containing unsaturated functional groups C55N
and possibly carbonyl. As already noted in a previous
paper,[1] imine groups may play a bigger role on polymer
surfaces plasma-treated in nitrogen atmospheres than
frequently thought and – aside from reactions leading
to an incorporation of nitrogen within functional
groups, also the formation of C55C double bonds by the
interaction of nitrogen atoms with alkyl radicals is
probably a favorable reaction channel. In case of ethyl-
D5 radicals in the gas phase the deuterium abstraction by
nitrogen atoms, which could be considered as a model
reaction for the interaction of a radical center at the
polyethylene chain with atomic N,[17]
D
e nu
D3C� _CD2 þN ! D2C55CD2 þND ð6Þ
accounts for nearly two-thirds of the radicals reacted
while the formation of an iminyl radical and a methyl
radical
3C� _CD2 þN ! D2C55Nþ CD3 ð7Þ
accounts for most of the rest.[18]
For energetic reasons the formationof conjugateddouble
bonds such as >C55CH�CH55N� will be favored; that is
while in interpreting the IR spectra one has to take into
DOI: 10.1002/ppap.201300033
mbers, use DOI for citation !!

Table 2. Peak positions ni, FWHM values wi, and areas Ai of fourGaussian absorption bands used to fit spectra P and PO,respectively.
i¼ 1 i¼ 2 i¼ 3 i¼ 4
ni/cm�1 1 570 1 601 1643 1 675
wi/cm�1 31 37 51 50
Ai in P/cm�1 0.03054 0.0606 0.10293 0.0264
Ai in PO/cm�1 0.02278 0.06245 0.1204 0.12593
Nitrogen Plasma Modification and Chemical Derivatization
account the probable presence of unsaturated imines and
carbonyl compounds.
Spectra shown in Figure 3–5 were obtained from
nominally pure gas atmospheres containing well below
1ppm oxygen. In order to investigate the effect of oxygen
we deliberately added 5ppm oxygen in one experiment in
order tosee ifanychanges in the IR spectrawouldgiveaclue
towards functional groups involving oxygen. Figure 6
shows final spectra after finishing 30 s of plasma afterglow
exposure under standard conditions and with oxygen
added, and also the difference spectrum.
In the wavenumber region between 1 540 and
1 740 cm�1, a reasonable joint fit of both spectra is obtained
using a 4-component sum S(n) of Gaussian functions
(Equation 8)
-0.
0.
0.
0.
0.
0.
0.
0.
Abs
orba
nce
Fig30andspeat
Plasma
� 2013
SðnÞ ¼X4i¼1
Ai
wi
ffiffiffiffiffiffiffiffiln 4
p
rexp �ln 4
n� ni
wi
� �2 !
ð8Þ
with shared peak positions ni and full widths at half
maximum (FWHM) wi.
The obtained parameters are shown in Table 2.
The major effects of adding a trace of oxygen are (i) a
strong intensification of band 4 at 1 675 cm�1 whichmight
be due to amide groups and (ii) a reduction of the band 1
which cannot be assigned so far.
3.2. Hydrogen-Deuterium Exchange Experiments
In order to separate the vibrational signature of primary
amines from overlapping stretching vibrations of double
bonds in the 1 600–1750 cm�1 range we applied an
1800 1700 1600 1500 1400001
000
001
002
003
004
005
006
Wavenumber / cm-1
PO P Difference PO - P
ure 6. X55Y bond stretching regions of spectra taken afters plasma afterglow treatment under standard conditions (‘‘P’’)with 5 ppm oxygen added (‘‘PO’’), respectively. The differencectrum PO–P (offset þ0.003) is dominated by peaks centered1 672 and 1 400 cm�1. Note the negative peak at 1 377 cm�1.
Process. Polym. 2013, DOI: 10.1002/ppap.201300033
WILEY-VCH Verlag GmbH & Co. KGaA, Weinheim
Early View Publication; these are NO
exchange of the nitrogen-bonded hydrogen against deute-
rium: In general, hydrogen atoms bonded to heteroatoms
such as O, N, S, or P atoms are chemically much more
reactive than carbon-bonded hydrogen atoms. In contact
with liquid or gaseous heavy water (D2O) a rapid
equilibration will take place furnishing a nearly statistical
distribution of H and D over the compound carrying the
heteroatom and water.[19] Spectroscopic observation of
H–D exchange between biomolecules and the surrounding
water has become an important method for studying the
structure of biomolecules.[20]
In the present example, deuteration of primary aliphatic
amines shifts the deformation vibration from 1620 to
1 625 cm�1 to a range of 1 190 to 1 240 cm�1 (d(ND2)).[9,21]
According to ourmeasurements the integrated intensity of
this vibration is about 25 kmmol�1, reasonably close to
theoretical results.[9,15]
In preliminary experiments it was seen that spectral
changesmeasured in situ during contact of plasma-treated
LDPE films with D2O vapor carried from a bubbler flask
in an N2 stream of 1 Lmin�1 STP came to an end after
an equilibration time of about 30min. In addition, it
was noted that the spectra of (i) a bare ZnS crystal or (ii) an
LDPE-coated Zn crystal without plasma treatment also
were dependent on the presence or absence of H2O or
D2O. This observation is due to several kinds of functional
groups on the ZnS surface carrying active hydrogen such
as thiol, sulfite, and sulfate moieties.[22] Therefore, in order
to eliminate from the final results any effects due to
functional groups with active hydrogen present on the
ZnS surface or in the LDPE film, a special referencing
procedure was applied: First, the LDPE film on ZnS was
exposed for 30min to a water atmosphere generated by a
streamofH2Ovapor inN2. Then the crystalwas exposed for
30min to dry N2 to remove any physisorbed H2O. Then a
reference spectrum ‘‘Ref. H’’ was measured. The procedure
was repeated with D2O to obtain a reference spectrum of
ZnS and LDPE with all active hydrogen atoms replaced by
deuterium atoms, ‘‘Ref. D.’’
The sample was plasma-treated and then underwent
three 30min exposures to water vapor atmospheres,
7www.plasma-polymers.org
T the final page numbers, use DOI for citation !! R

C.-P. Klages, A. Hinze, Z. Khosravi
8
REa
startingwith 30min inD2O, then changing toH2O, then the
second D2O exposure followed. After each 30min ‘‘wet’’
period, the samplewas overflownwith 1 Lmin�1 STP of dry
N2 in order to remove physisorbed water, and a spectrum
(labelled D, H, 2D, respectively) was measured. Figure 7
shows results of such experiments after the standard
plasma treatment (‘‘P’’) and treatment with 5ppm oxygen
added (‘‘PO’’), respectively.
The pairs of difference spectra generated frommeasure-
ments after treatments P (middle) or PO (bottom) are
obtained as (i) spectra after H2O exposure minus spectra
after previous D2O exposure (‘‘H�D’’) and (ii) vice versa
after 2nd D2O exposure (‘‘2D�H’’). The corresponding
references (Ref. H or Ref. D) were subtracted. Repeating
the exchange twice or more increases the sensitivity of
the method. In addition, the mirror symmetry within the
pairs of difference spectra shows that spectra D and H or
spectra 2D and H differ only by reversible exchange of
active hydrogen – any irreversible reaction with water is
not visible on the time scale of the experiment. Aside from
the replacement of N�H and possibly O�H stretching
vibrations at n> 3 000 cm�1 by N�D (O�D) bands between
2 000 and 2 800 cm�1, a few exchange peaks in the region
1 300–1 750 cm�1 are observed. A detailed discussion of
these spectral changes is beyond the scope of this paper. For
the moment it is important to note that there is no
indication of the presence of primary amino groups which
should yield a positive (negative) d(NH2) vibrational band
near 1 620–1625 cm�1 in the H�D (2D–H) spectra and a
3500 3000 2500 2000 1500 1000-0.006
-0.004
-0.002
0.000
0.002
0.004
0.006
Abs
orba
nce
Wavenumber / cm-1
P P:H-D P:2D-H PO PO:H-D PO:2D-H
Figure 7. Top: Spectra taken after 30 s afterglow exposure understandard conditions (top pair, black, ‘‘P’’) and with 5 ppm oxygenadded, respectively (top pair, dark gray, ‘‘PO’’). Middle: pair ofdifference spectra during H–D exchange experiment afterstandard afterglow treatment: Spectrum after H2O exposureminus spectrum after previous D2O exposure (broken curve,‘‘P:H–D’’) and vice versa after 2nd D2O exposure (solid curve,‘‘P:2D–H’’). Bottom: As before, but with 5 ppm oxygen addedduring afterglow exposure. (Arbitrary absorbance offsets.)
Plasma Process. Polym. 2013, DOI: 10.1002/ppap.201300033
� 2013 WILEY-VCH Verlag GmbH & Co. KGaA, Weinheim
rly View Publication; these are NOT the final pag
negative (positive) d(ND2) band in the 1190–1 240 cm�1
range in the H�D (2D–H) spectra. Figure 8 shows these
spectra in the 1 100–1 300 cm�1 range, expanded in order
to make any absorption bands better visible. Again there
is no indication of d(ND2): Theoretical bands calculated
under the assumption of an �ND2 density of 1 nm�2
appearing (disappearing) in the presence of D2O (H2O)
vapor are superimposed as Gaussian functions in Figure 8.
The comparison with measured results shows that the
density of �ND2 which would be detectable in these
spectra is significantly below 1nm�2. We estimated that it
is around 0.3 nm�2.
3.3. Exposure of Plasma-Treated Surfaces to TFBA
Vapors
Figure 9 shows selected spectra measured during a TFBA
derivatization experiment, which was extended over a
period of nearly 5 h. Remarkable features – aside from
the strong C�CF3 peak at 1 325 cm�1 marked by ‘‘A’’ – are
a strong transient band of so far unknown origin at
1 585 cm�1 attaining maximum intensity between 20
and 40min (‘‘B’’) and the C55O stretching peak of
physisorbed TFBAat 1 716 cm�1 (‘‘C’’), immediately appear-
ing in the first spectrum measured after starting TFBA
exposure (5min). The LDPE film stays saturated with
‘‘dissolved’’ TFBA until the TFBA-loaded N2 stream is
replaced by a pure N2 stream after 289min, leading to
immediate disappearance of the corresponding peak
(290min). The band area of the C�CF3 peak in Figure 10,
1300 1250 1200 1150 1100
0.0000
0.0005
0.0010
0.0015
0.0020
Abs
orba
nce
Wavenumber / cm-1
From top to bottom: P:H-D P:2D-H PO:H-D PO:2D-H
Figure 8. Wavenumber region around ND2 deformationvibrations taken from spectra in Figure 7, expanded. (Arbitraryabsorbance offsets.) On each spectrum, a Gaussian functioncentered at 1 200 cm�1 is superimposed as a positive ornegative theoretical spectral band, calculated under theassumption of an appeared or disappeared amino group �ND2density of 1 nm�2, using experimental values B¼ 25 kmmol�1 andFWHM¼ 30 cm�1, see above.
DOI: 10.1002/ppap.201300033
e numbers, use DOI for citation !!

1900 1800 1700 1600 1500 1400 13000.000
0.005
0.010
0.015
0.020
Abs
orba
nce
Wavenumber / cm-1
From bottom to top: 2 min 5 min 10 min 20 min 40 min 59 min 91 min 140 min 181 min 223 min 250 min 289 min 290 min 320 min
A
BC
Figure 9. Selection of spectra taken during 287min exposure ofafterglow-treated LDPE surface to TFBA in an N2 stream. Start ofthe TFBA exposure at 2min. After 289min the TFBA-loaded N2stream was replaced by pure N2. Spectra for t> 2min are shiftedvertically and horizontally for better presentation. See Section 3.3for explanations.
Nitrogen Plasma Modification and Chemical Derivatization
representative of the total density of adsorbed plus
chemically bonded TFBA, rises rapidly in the first 50min
and keeps growing even after nearly 5 h. (In a subsequent
experiment there was a still weakly increasing signal
even after 22h of exposure to TFBA.) Removal of TFBA
from the N2 stream (289min) leads to an immediate
desorption of physisorbed and a slower vanishing of
some loosely bound TFBA.
Thefinal bandarea obtained in this experiment (and also
in the 22h run) was about 0.1 cm�1. Using the integrated
absorption intensity of this band determined above,
0 50 100 150 200 250 300
0.00
0.02
0.04
0.06
0.08
0.10
0.12
0.14
Area of 1324 cm-1 band,
integrated from 1300 to 1350 cm-1
series 0 - 180 min manual measurements series 260 - 320 min
Atmosphere:2 - 290 min: TFBA vapor290 - 320 min: N2
Ban
d ar
ea /
cm-1
Time / min
Figure 10. Area of C�CF3 stretching band during 287minexposure of afterglow-treated LDPE surface to TFBA in an N2stream. Start of TFBA exposure at 2min. After 289min the TFBA-loaded N2 stream was replaced by pure N2.
Plasma Process. Polym. 2013, DOI: 10.1002/ppap.201300033
� 2013 WILEY-VCH Verlag GmbH & Co. KGaA, Weinheim
Early View Publication; these are NO
B¼ 370 kmmol�1, a density of 1.6 nm�2 is calculated for
the 4-trifluoromethyl-phenyl moieties immobilized to the
surface, roughly a factor 5 beyond theprimary aminogroup
densities which would be detectable by the deuteration
experiments described above. This is quantitative experi-
mental evidence that TFBA is not or not only reacting with
�NH2 groups.
There is also qualitative evidence demonstrating that
the derivatization reaction is proceeding different from
the simple chemical reaction formulated in Equation (1).
If this equation would describe completely what happens
upon exposure of the plasma-treated LDPE surface to
TFBA, the only spectral changes observed would be a
vanishing of the vibrations due to primary amines
and appearance of vibrations of an aromatic N-alkyl-aldimine Ar�CH55N�R (Ar¼ 4-CF3�C6H4�, R¼ alkyl).
In the 1 500–1800 cm�1 region of difference spectra
taken after and before derivatization one would corre-
spondingly expect (see Table 1) (i) a negative d(NH2) band
at 1 620–1 625 cm�1 with about 8% of the band area of
the n(C�CF3) peak at 1 325 cm�1 and (ii) a positive n(aryl-
CH55N�) band around 1655 cm�1 with about twice
the area of the negative NH2 band or roughly 16% of n(C-
CF3). (In our calibration experiments using TFBA and
aliphatic amines in hexadecane the corresponding C55N
peak ofN-alkyl-4-trifluoromethyl-benzaldimines appeared
at 1 652 cm�1.)
The observations do not meet these expectations: The
top spectrum of Figure 11, difference between the final
spectrum after derivatization and the starting spectrum,
shows that the strong characteristic C�CF3 vibration at
1 325 cm�1 is accompanied by a broad band in the region
of 1 690–1 710 cm�1, probably – by reason of position
and intensity – due to carbonyl groups. A peak due to
4-trifluoromethyl-benzaldimines near 1 655 cm�1 is not
visible. In addition, the intensity in the range of X–H
stretching vibrations with wavenumbers beyond
3 000 cm�1 is increased and two maxima appear at 3 370
and 3 210 cm�1. Although this range is relatively low for
O�H vibrations we tentatively attribute these bands to
chelated O�H groups of b-hydroxycarbonyl compounds as
they can be formed by aldol additions. Also the relatively
low carbonyl wavenumber could indicate aldol addition
or aldol condensation products.[1,14]
On the other hand, 24h exposure of a plasma-treated
surface to water vapor also produces a carbonyl band of
similar integrated intensity peaking in the 1 670–
1 710 cm�1 region.[23] Therefore we tentatively attribute
the carbonyl band observed after TFBA exposure, located in
a wavenumber range between the regions typical for
saturated aldehydes or ketones on the one hand and
saturated amides on the other, to structure elements
containing a carbonyl group conjugated with a double
bond. Moieties of this kind could be furnished by an
9www.plasma-polymers.org
T the final page numbers, use DOI for citation !! R

3500 3000 1800 1700 1600 1500 1400 13000.000
0.002
0.004
0.006
0.008
0.010
0.012
Abs
orba
nce
Wavenumber / cm-1
From bottom to top: 5-2 289-290 (!) 320-2
Figure 11. Selected difference spectra taken during TFBAexposure. A label ‘‘m–n’’ means that the spectrum at nmin issubtracted from the spectrum at mmin. From bottom to topthese difference spectra demonstrate (i) physisorption and (ii)desorption of TFBA characterized by a narrow carbonyl peak at1 716 cm�1. (iii) The top spectrum shows the overall differencebetween the final derivatization product spectrum and thestarting spectrum before TFBA contact. A presumptivecarbonyl peak is located at 1 690–1 700 cm�1. In the n(X–H)region, two peaks are visible at 3 370 and 3 210 cm�1.
1750 1700 1650 1600 1550 1500 1450 1400 1350 1300 1250-0.0015
-0.0010
-0.0005
0.0000
0.0005
0.0010
0.0015
0.0020
Abs
orba
nce
Wavenumber / cm-1
7-5 20-7 49-20 149-49 289-149
Figure 12. Selected difference spectra taken during TFBAexposure. A label ‘‘m–n’’ means that the spectrum at nmin issubtracted from the spectrum atmmin. These difference spectrademonstrate (i) formation of a strong absorption band atabout 1 585 cm�1 due to a transient species (spectra 7-5 and 20-7) and its decay (149-49 and 289-149) and (ii) continuousformation of a new absorption band with a maximum at1 700–1 705 cm�1 along with the continuous increase of C�CF3absorption at 1 325 cm�1.
C.-P. Klages, A. Hinze, Z. Khosravi
10
REa
exchange reaction of unsaturated imines (1-aza-buta-
dienes) on the plasma-treated surface with TFBA:
NR O
CF3CH
NRCF3C
H
O
+ +H
H
R' H
H
R'
(9)
Similartounsaturatedketones (R0 ¼ PEchain), seeTable1,
a,b-unsaturated aldehydes (R0 ¼H) are also characterized
by very strong C55O stretching vibrations between 1 685
and 1 705 cm�1.[11,14]
Due to virtually same positions (about 1 655 cm�1) and
comparable intensities of C55N vibrations in unsaturated
imines and arylimines, contributions of the vanishing
unsaturated imine on the left hand side of Equation (9) to
the IR spectrum are cancelled by those of the newly formed
benzaldimine on the right hand side. Therefore the region
between 1 650 and 1 655 cm�1 is virtually devoid of a
positive or negative absorbance.
The scheme in Equation (9) is not meant as a final
description of the chemical nature of a nitrogen-plasma-
treated PE surfaces and its TFBA derivatization but as a
working hypothesis for future investigations. At least some
Plasma Process. Polym. 2013, DOI: 10.1002/ppap.201300033
� 2013 WILEY-VCH Verlag GmbH & Co. KGaA, Weinheim
rly View Publication; these are NOT the final pag
aspects of the spectroscopic results obtained during TFBA
exposure are interpretable in terms of Equation (9), but not
by the commonly assumed reaction shown in Equation (1).
In addition, one may speculate about formation of
unsaturated imines using as model processes only the
reactions reported by Stief et al.,[18] see Equation (6) and (7):
If the reaction scheme shown in Equation (7) is formally
applied to an allyl radical instead of ethyl, the resulting
radical pair could recombine to the unsaturated secondary
aldimine shown in Equation (10) or to an isomeric primary
ketimine.
Further spectra shown in Figure 11 and in Figure 12
contain a lot of information about the mechanism of the
derivatization reaction, which are still to be worked out in
detail. In brief, the two lower spectra of Figure 11 show the
very rapid uptake and loss of physically dissolved TFBA by
the LDPE film at the start and the end of the derivatization,
respectively. In Figure 12, differences of selected spectra
are shown. These spectra prove that the chemical
DOI: 10.1002/ppap.201300033
e numbers, use DOI for citation !!
Nitrogen Plasma Modification and Chemical Derivatization
immobilization reactionofTFBAproceedsduring thewhole
timeundercontinuousformationofcarbonylproducts. (Even
during amuch longer subsequent derivatization experiment
the gradual increase of the C�CF3 bandwas accompanied by
rising carbonyl absorption near 1700 cm�1).
A very surprising feature in Figure 12 is the growth and
decay of a transient species responsible for the very strong
band – compared with other vibrations – at 1 585 cm�1
which is accompanied by weaker peaks at 1 345 and
1 370 cm�1. The density of this compound goes through a
maximum at about 55min. This transient species is also
characterized by a broad absorption band between 2 600
and 3500 cm�1, having two pronounced peaks at 2 773 and
2 687 cm�1. The nature of this species is so far unknown
and further investigations are required to clarify it.
The weak bands at 2 150 cm�1 to be seen in Figure 7
(top pair of spectra) are due to a functional group
formed during plasma exposure of LDPE which is
reactive towards water vapor and TFBA vapor as well
(corresponding spectra are not shown): Candidates are
some of the groups with cumulated double bonds: azides
�N55N55N (vs–s), carbodiimides �N55C55N� (vs),
ketenimines >C55C55N� (s), or ketenes >C55C55O (m-
s).[14]All of thesevibrations are at least ofmediumintensity
(m), but usually they are strong (s) or very strong (vs).
Therefore the low-intensity of bands seen in Figure 7
indicates that only a small density of this group is present.
4. Conclusion
In the present paper, we have presented experimental
evidence that the reaction of nitrogen-plasma-treated
polymer surfaces with TFBA is not selective for primary
aminogroups. There are twoarguments, a quantitative and
a qualitative one:
(1)
Plasm
� 20
Exposing the plasma-treated surfaces to TFBA
vapor results in a strong absorption band in FTIR-
ATR measurements, due to chemically bonded
4-CF3�C6H4� moieties. Characteristic signatures of
primary amino groups, on the other hand, are missing
in the spectra. Quantitative analysis shows that the
density of TFBAmolecules immobilizedat the surface is
by a factor of about 5 larger than the density of primary
amino groups, which should be detectable by IR
spectroscopy after deuteration by contact with D2O
vapor.
(2)
The IR-spectroscopic changes during the reaction withTFBA are not in agreement with the so far generally
assumed reaction scheme but they hint towards the
a Process. Polym. 2013, DOI: 10.1002/ppap.201300033
13 WILEY-VCH Verlag GmbH & Co. KGaA, Weinheim
Early View Publication; these are NOT th
dominance of a different reaction scheme possibly
involving unsaturated imines, which remains to be
scrutinized in the future.
Acknowledgements: The authors gratefully acknowledge helpfuldiscussions with Dipl.-Chem. H. Dillmann and Dipl.-Ing. H.Schmolke of IOT as well as Dr. Kristina Lachmann, andDr. Michael Thomas, Fraunhofer IST Braunschweig. This workwas supported by a grant from the Deutsche Forschungsgemein-schaft (DFG-No. Kl 1096/19).
Received: March 18, 2013; Revised: July 7, 2013; Accepted: July 8,2013; DOI: 10.1002/ppap.201300033
Keywords: derivatization; FTIR-ATR in situ; plasma treatment;polyethylene (PE); polymer modification
[1] C.-P. Klages, Z. Khosravi, A. Hinze, Plasma Process. Polym.2013, 10, 307.
[2] V. P. Tolstoy, I. V. Chernyshova, V. A. Skryshevsky, Handbookof Infrared Spectroscopy of Ultrathin Films, John Wiley &Sons, Inc., Hoboken, NJ, USA 2003.
[3] N. J. Harrick, A. I. Carlson, Appl. Opt. 1971, 10, 19.[4] D. A. Ramsay, J. Am. Chem. Soc. 1952, 74, 72.[5] A. S. Wexler, Appl. Spectrosc. Rev. 1967, 1, 29.[6] M. R. Yagudaev, Yu. N. Sheinker, Dokl. AN SSSR 1962, 144,
379.[7] A. Aucejo, M. C. Burguet, R. Munoz, J. L. Marques, J. Chem. Eng.
Data 1995, 40, 141.[8] J. P. Laib, D. M. Mittleman, J. Infrared Milli. Terahz. Waves
2010, 31, 1015.[9] J. R. Durig, C. Zheng, Struct. Chem. 2001, 12, 137.
[10] J. Fabian, M. Legrand, Bull. Soc. Chim. Fr. 1956, 23, 1461.[11] G. M. Barrow, J. Chem. Phys. 1953, 21, 2008.[12] G. Hawkins, R. Hunnemann, Infrared Phys. Technol. 2004,
45, 69.[13] H. Kukimoto, S. Shionoya, T. Koda, R. Hioki, J. Phys. Chem.
Solids 1968, 29, 935.[14] G. Socrates, Infrared and Raman Characteristic Group
Frequencies: Tables and Charts, John Wiley & Sons, Inc.,Hoboken, NJ, USA 2004.
[15] D. Zeroka, J. O. Jensen, A. C. Samuels, J. Mol. Struct. 1999, 465,119.
[16] R. Brdicka, Grundlagen der Physikalischen Chemie, VEBDeutscher Verlag der Wissenschaften, Berlin, Germany1968.
[17] C.-P. Klages, A. Grishin, Plasma Process. Polym. 2008, 5, 359.[18] L. J. Stief, F. L. Nesbitt, W. A. Payne, S. C. Kuo, W. Tao, R. B.
Klemm, J. Chem. Phys. 1995, 102, 5309.[19] W. R. Harp, R. C. Eiffert, Anal. Chem. 1960, 32, 794.[20] F. S. Parker, K. R. Bhaskar, Appl. Spectrosc. Rev. 1970, 3, 91.[21] S. Pinchas, I. Laulicht, Infrared Spectra of Labelled Compounds,
Academic Press, London 1971.[22] W. Hertl, Langmuir 1988, 4, 594.[23] Z. Khosravi, C.-P. Klages, to be published.
11www.plasma-polymers.org
e final page numbers, use DOI for citation !! R