nitrate and phosphorous levels in selected surface water ... · nitrate and phosphorous levels in...
TRANSCRIPT

Nitrate and Phosphorous Levels in Selected SurfaceWater Sites in Southern Ontario – 1964-1994
By: Ron Fleming P.Engand Heather Fraser
Ridgetown College-University of GuelphAugust, 1999
1. Objectives
Using existing water quality data from the Ontario Ministry of the Environment, we haveattempted to:
1) Show the current and past state of surface water nitrate-N and total phosphorouslevels;2) Recognize trends in nitrate and phosphorous levels over time; and 3) Identify relationships among nutrient levels, watershed uses and management practices.
2. Background
Surface water quality is a concern as it relates directly to drinking water quality and thegeneral status and condition of the environment. Monitoring it over a period of time can oftenreveal trends in the changing quality and perhaps the practices which may have initiated thechange. Over the last 30 years, there has been an awakening to the importance of protecting theenvironment.
Despite the fact that consuming large amounts of waterborne phosphorous has few, if any,direct adverse affects to human health, it is a nutrient of concern if detected in the environment(CAST 1992). During the 1950's and 1960's, phosphate was used as a cleaning agent indetergent. Family households, institutions and industries were flushing phosphates literally downthe drain and into a sewage treatment system that did not have the facility to remove them. Thisresulted in extremely high levels of phosphates in the streams and lakes into which “treated” waterwas released. Massive algal “blooms” began to grow and subsequently decay. The foul-smellingdecaying process depleted oxygen in the water to a level that suffocated large amounts of fish andother oxygen-relying water creatures. This process is called eutrophication. A well-knownCanadian example of eutrophication is lake Erie – in the 1970's, this lake was generally regardedas dead. Fishing industries could no longer find any fish to catch and the smell of decaying algaewas overwhelming. It wasn’t until the 1970's that measures were taken to put a halt on phosphatepollution. Ontario legislation was introduced to reduce phosphate levels in waterways by limiting

Surface Water Quality Fleming & Fraser, 1999 Page 2
and eventually phasing-out phosphate use in detergents. Sewage treatment plants (STP’s) werealso required to reduce phosphate levels in their effluents. As a result of these efforts, the averagephosphorous content of raw Ontario sewage has dropped significantly from around 10 mg/L in1969 to 5 mg/L in 1974 and has remained below 5 mg/L since then (Bunce 1993). As previouslymentioned, human consumption of phosphorous does not appear to be detrimental to humanhealth. Therefore no “acceptable” level of phosphorous has been established for drinking waterquality. However, elevated phosphorous levels can have quite an effect on aquatic life. Excessiveplant growth due to elevated phosphorous levels can occur in surface waters at concentrationsabove 0.03 mg/L (MOE, 1984).
Agricultural practices can also contribute to elevated phosphorous levels in surfacewaters. Plants require phosphorous for growth, so by adding phosphorous in the form of manureor commercial fertilizer, better crop yields can be attained. Phosphorous tends to bind tightly tosoils and therefore does not leach into water systems as easily as some nutrients. It can, howeverenter surface waters through deposited eroded soil (CAST 1992). In the 1960's and 1970'sefforts were taken to try to prevent soil erosion. This resulted in a decrease in surface waterphosphorous levels in agricultural areas.
Pure nitrogen (N2), makes up approximately 80% of the atmosphere. Nitrates arenaturally formed in the environment by nitrogen-fixing bacteria, as well as in high temperaturessuch as those found in lightning (Bunce 1993). Nitrogen, like phosphorous, is a required plantnutrient and so is added to soil to improve crop yields. In 1991, Agriculture Canada estimatedthat 400 million kilograms of nitrate-based inorganic fertilizer were sold annually in Canada. It ispossible to add nitrogen-based fertilizer to a field in order to maximize yield without harming theenvironment – the technologies exist. Before addition of fertilizer, accurate tests need to beconducted to determine nitrogen levels in soil to prevent subsequent nitrogen-overload; realisticyield goals need to be determined; and the appropriate type of nitrogen fertilizer needs to beselected considering application method and timing. This “Nutrient Management” approachmakes most efficient use of fertilizer and helps protect the environment. Despite these availabletechnologies and recommended practices, nitrogen is often mismanaged (Peterson and Frye1989).
Outside of agricultural practices, nitrates can also come from septic systems and, to amuch lesser extent, naturally decaying organic matter (CAST 1992). Nitrate is highly soluble andcan thus migrate easily through the soil. Here it is able to contaminate a groundwater or a tiledrainage system. The Maximum Acceptable Concentration (MAC) for nitrate-nitrogen inCanadian drinking water has been established as 10 mg/L. Generally, Canadian municipal watersupplies have nitrate-N levels no higher than 5 mg/L (Health Canada 1987).
3. Procedures
In the mid-1960's, what is now the Ministry of the Environment (MOE) began an intensiveprogram of testing surface water in Ontario. Many sites were established and a range of waterquality parameters was examined. In 1994 and 1995, we contacted staff of the EnvironmentalMonitoring and Reporting Branch, Ministry of the Environment and Energy, to begin our study. We requested nitrate and total phosphorous data over a 30-year period for sites representing avariety of typical land uses in southern Ontario. In total, data for 49 sampling sites wereexamined. We characterized the various watersheds by predominant land use and found that we

Surface Water Quality Fleming & Fraser, 1999 Page 3
had sites with one main land use and sites with combinations. To simplify comparisons, thisreport will just look at the surface waters that drained mainly agricultural, urban, or naturalwatersheds.
We defined “Agricultural” watersheds as being located in an intensive agricultural area, orin a predominantly agricultural area with some small rural developments. “Urban” watershedsdrained one or more urban centers, and/or were located in a predominantly urban area. Lastly, “natural” watersheds were located in a mainly natural areas with little to no intensive agriculture,small rural developments or cottage areas. Land uses may include some logging, and outdoorrecreational activities such as hunting, fishing, skiing, boating, etc.. In total, we will be looking at24 sites: 11 agricultural, eight urban, and five natural.
Predominant Land Use Stream/RiverMOE sitenumber
Agricultural Bayfield River 8004000602
Big Creek (1) 4001303302
Big Creek (2) 16000100102
Bighead River 3003000202
Middle Maitland River 8005600902
Nanticoke Creek 16016400102
Ruscom River 4001000202
Scotch River 18207004002
South Nation River 18207002002
Sydenham River 3001600302
Tilbury Creek 4001302602
Urban Carruthers Creek 6010700102
Etobicoke Creek 6008000102
Humber River 6008300102
Little River 4000100102
Oakville Creek 6006300102
Oshawa Creek 6011100102
Rouge River 6009700202
Twelve Mile Creek 6001700102

Surface Water Quality Fleming & Fraser, 1999 Page 4
Natural Albemarble Brook 8013500402
Madawaska River 18349002002
Muskoka River 3008501202
Musquash River 3008500102
Rocky Saugeen River 8012300602
Yearly averages were calculated for each site – as some sites had multiple samples taken (up toabout 280 per year) while others had just a few – and the results were graphed. Though not allsites had samples taken each year, the overall sampling period covered the years from 1964-1994.
4. Results and Discussion:
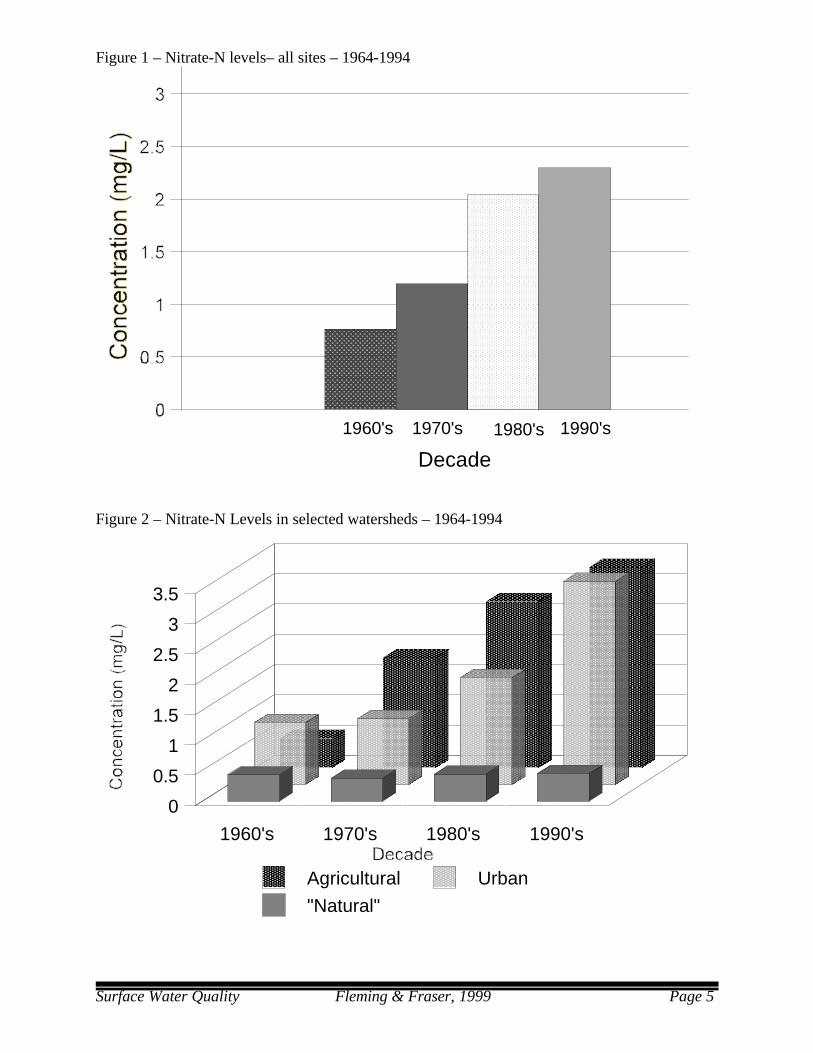
4.1 Nitrate-N - Figure 1 shows average nitrate-N levels for all 24 sampling sites, arranged bythe decade of sampling. This shows that overall levels of nitrates in surface waters have beenrising since the 1960's. The most significant jumps were seen between the 1960's and 1970's inagricultural areas and the 1980's and 1990's in urban areas (see Figure 2). The average nitratelevels for the 1960's in agriculture represent only five of the 11 sites (no data were available forthe other six sites during this time - see Figure 4). Three of the sites that did not have samplestaken in the 1960's have some of the highest numbers through the subsequent three decades. Thesame applies for the jump in nitrate concentrations between the 1980's and 1990's in the urbanareas. The jump could be excessively steep because the only river that collected data during the1990's had comparatively elevated levels in the preceding years (Figure 5). Although there is aslight increase in nitrate levels in natural watersheds, the increase is minimal (Figure 2). Levelshere should be regarded as “background” levels. All averages used for nitrate-N levels in Figure 2are shown in Table 1. Figure 3 shows a graph of the mean annual nitrate levels (mg/L) in selectedstreams arranged by land use.
Surface Water Quality Fleming & Fraser, 1999 Page 5
Figure 1 – Nitrate-N levels– all sites – 1964-1994
1960's 1970's 1980's 1990's
Decade
Figure 2 – Nitrate-N Levels in selected watersheds – 1964-1994
1960's 1970's 1980's 1990's
0
0.5
1
1.5
2
2.5
3
3.5
Agricultural Urban
"Natural"

Surface Water Quality Fleming & Fraser, 1999 Page 6
Table 1 Average NO3-N (mg/L) concentrations in surface water .
DecadeAgricultural
(11 sites)Urban
(8 sites)Natural (5 sites)
All (24 sites)
60's (1964-1969) 0.49 1.03 0.43 0.76 70's (1970-1979) 1.82 1.08 0.38 1.20 80's (1980-1989) 2.75 1.77 0.45 2.05 90's (1990-1994) 3.31 3.35 0.47 2.30
Figure 3 – Mean annual nitrate-N levels in selected streams arranged by land use
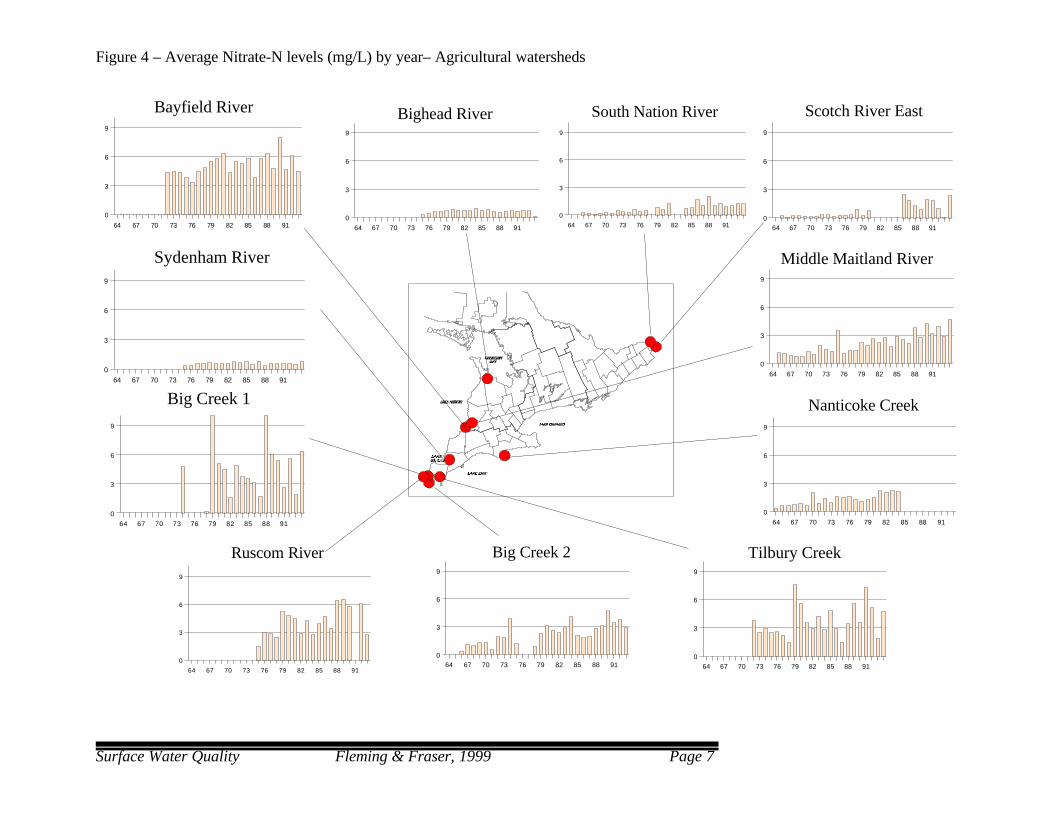
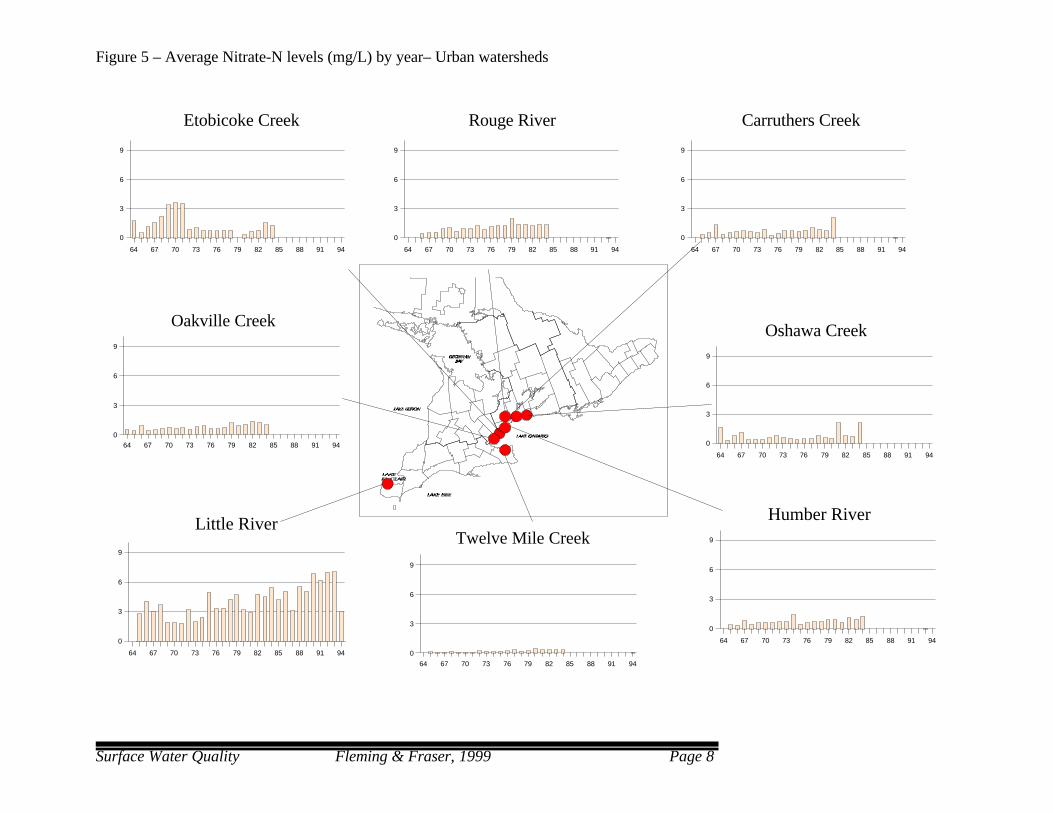
Figures 4, 5, and 6 show the data from the 24 sites grouped into area-type (agriculture,urban and natural) located on a map of southern Ontario. Especially in the agricultural areas(Figure 4), levels vary from site to site and year to year. This variance in levels probably mimicsthe variance in management practices and environmental conditions at each site (such as soil type,flow rate, rainfall, etc.). Means, minimums, maximums and standard deviation are shown for eachsite in Table 2. On all but one occasion (in Big Creek (1)), nitrate levels were below the MAC fordrinking water. However, seven agricultural, three urban, and one natural site had overall meanlevels above 1 mg/L – the level after which excessive plant growth and eutrophication may occur(CAST 1992).
Surface Water Quality Fleming & Fraser, 1999 Page 7
Figure 4 – Average Nitrate-N levels (mg/L) by year– Agricultural watersheds
64 67 70 73 76 79 82 85 88 91
0
3
6
9
South Nation River
64 67 70 73 76 79 82 85 88 910
3
6
9
Scotch River East
64 67 70 73 76 79 82 85 88 91
0
3
6
9
Bighead River
64 67 70 73 76 79 82 85 88 910
3
6
9
Tilbury Creek
64 67 70 73 76 79 82 85 88 91
0
3
6
9
Big Creek 1
64 67 70 73 76 79 82 85 88 91
0
3
6
9
Middle Maitland River
64 67 70 73 76 79 82 85 88 910
3
6
9
Big Creek 2
64 67 70 73 76 79 82 85 88 91
0
3
6
9
Nanticoke Creek
64 67 70 73 76 79 82 85 88 91
0
3
6
9
Bayfield River
64 67 70 73 76 79 82 85 88 91
0
3
6
9
Sydenham River
64 67 70 73 76 79 82 85 88 91
0
3
6
9
Ruscom River
Surface Water Quality Fleming & Fraser, 1999 Page 8
Figure 5 – Average Nitrate-N levels (mg/L) by year– Urban watersheds
64 67 70 73 76 79 82 85 88 91 94
0
3
6
9
Little River
64 67 70 73 76 79 82 85 88 91 94
0
3
6
9
Oakville Creek
64 67 70 73 76 79 82 85 88 91 94
0
3
6
9
Etobicoke Creek
64 67 70 73 76 79 82 85 88 91 94
0
3
6
9
Humber River
64 67 70 73 76 79 82 85 88 91 94
0
3
6
9
Rouge River
64 67 70 73 76 79 82 85 88 91 94
0
3
6
9
Carruthers Creek
64 67 70 73 76 79 82 85 88 91 94
0
3
6
9
Oshawa Creek
64 67 70 73 76 79 82 85 88 91 94
0
3
6
9
Twelve Mile Creek

Surface Water Quality Fleming & Fraser, 1999 Page 9
Figure 6 – Average Nitrate-N levels (mg/L) by year – Natural Watersheds
64 67 70 73 76 79 82 85 88 91
0
3
6
9
Musquash River
64 67 70 73 76 79 82 85 88 91 94
0
3
6
9
Albermarble Brook
64 67 70 73 76 79 82 85 88 91 94
0
3
6
9
Rocky Saugeen River64 67 70 73 76 79 82 85 88 91 94
0
3
6
9
Muskoka River
64 67 70 73 76 79 82 85 88 91 94
0
3
6
9
Madawaska River
Surface Water Quality Fleming & Fraser, 1999 Page 10
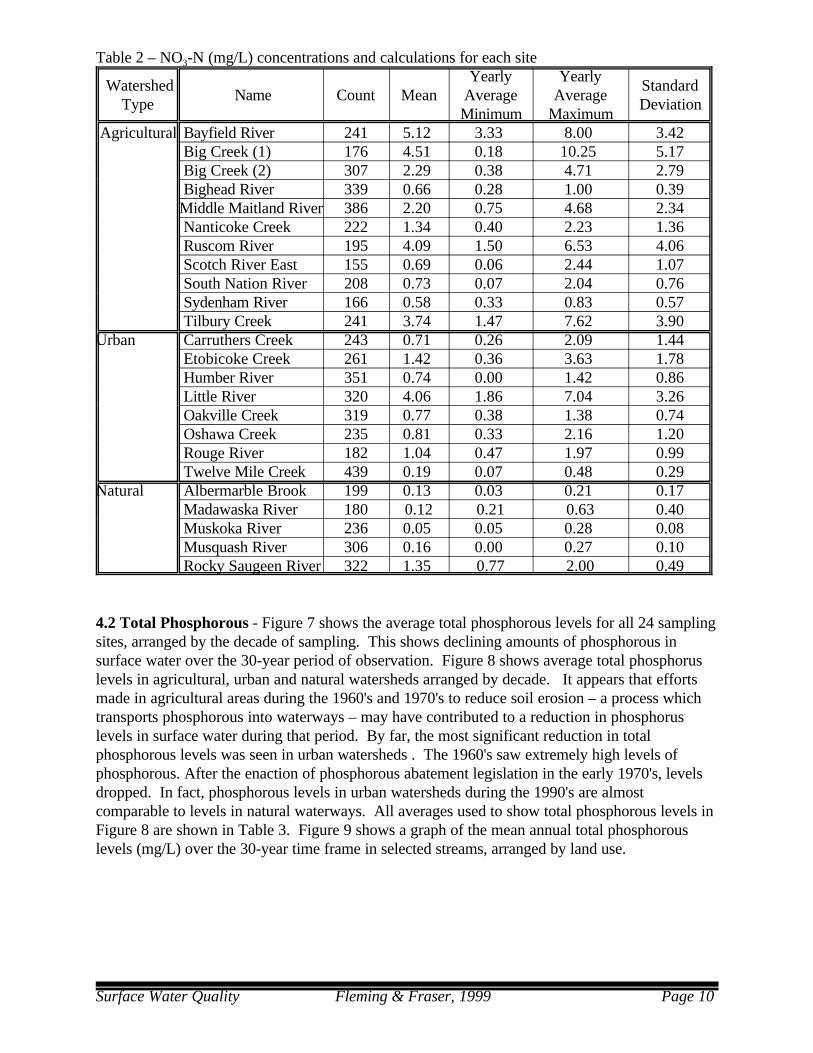
Table 2 – NO3-N (mg/L) concentrations and calculations for each site
WatershedType
Name Count MeanYearly
AverageMinimum
YearlyAverage
Maximum
StandardDeviation
Agricultural Bayfield River 241 5.12 3.33 8.00 3.42 Big Creek (1) 176 4.51 0.18 10.25 5.17 Big Creek (2) 307 2.29 0.38 4.71 2.79 Bighead River 339 0.66 0.28 1.00 0.39Middle Maitland River 386 2.20 0.75 4.68 2.34 Nanticoke Creek 222 1.34 0.40 2.23 1.36 Ruscom River 195 4.09 1.50 6.53 4.06 Scotch River East 155 0.69 0.06 2.44 1.07 South Nation River 208 0.73 0.07 2.04 0.76 Sydenham River 166 0.58 0.33 0.83 0.57 Tilbury Creek 241 3.74 1.47 7.62 3.90
Urban Carruthers Creek 243 0.71 0.26 2.09 1.44 Etobicoke Creek 261 1.42 0.36 3.63 1.78 Humber River 351 0.74 0.00 1.42 0.86 Little River 320 4.06 1.86 7.04 3.26 Oakville Creek 319 0.77 0.38 1.38 0.74 Oshawa Creek 235 0.81 0.33 2.16 1.20 Rouge River 182 1.04 0.47 1.97 0.99 Twelve Mile Creek 439 0.19 0.07 0.48 0.29
Natural Albermarble Brook 199 0.13 0.03 0.21 0.17 Madawaska River 180 0.12 0.21 0.63 0.40 Muskoka River 236 0.05 0.05 0.28 0.08 Musquash River 306 0.16 0.00 0.27 0.10 Rocky Saugeen River 322 1.35 0.77 2.00 0.49
4.2 Total Phosphorous - Figure 7 shows the average total phosphorous levels for all 24 samplingsites, arranged by the decade of sampling. This shows declining amounts of phosphorous insurface water over the 30-year period of observation. Figure 8 shows average total phosphoruslevels in agricultural, urban and natural watersheds arranged by decade. It appears that effortsmade in agricultural areas during the 1960's and 1970's to reduce soil erosion – a process whichtransports phosphorous into waterways – may have contributed to a reduction in phosphoruslevels in surface water during that period. By far, the most significant reduction in totalphosphorous levels was seen in urban watersheds . The 1960's saw extremely high levels ofphosphorous. After the enaction of phosphorous abatement legislation in the early 1970's, levelsdropped. In fact, phosphorous levels in urban watersheds during the 1990's are almostcomparable to levels in natural waterways. All averages used to show total phosphorous levels inFigure 8 are shown in Table 3. Figure 9 shows a graph of the mean annual total phosphorouslevels (mg/L) over the 30-year time frame in selected streams, arranged by land use.

Surface Water Quality Fleming & Fraser, 1999 Page 11
Figure 7 — Total phosphorous levels– all sites – 1964-1994
0
0.5
1
1.5
2
2.5
Figure 8 -- Average total phosphorous levels in selected watersheds – 1964-1994
1960's 1970's 1980's 1990's
0
0.5
1
1.5
2
2.5
Agricultural Urban
"Natural"

Surface Water Quality Fleming & Fraser, 1999 Page 12
Table 3 – Average Total-Phosphorous (mg/L) concentrations in surface water
DecadeAgricultural(11 sites)
Urban (8 sites)
Natural (5 sites)
All (24 sites)
60's (1964-1969) 0.40 2.17 0.02 1.24 70's (1970-1979) 0.24 0.33 0.04 0.26 80's (1980-1989) 0.23 0.14 0.02 0.15 90's (1990-1994) 0.19 0.09 0.03 0.12
Figure 9 — Mean annual total phosphorous levels in selected streams arranged by land use
Figures 10, 11 and 12 show each of the 24 sites grouped into their area-type (agriculture, urbanand natural) located on a map of southern Ontario. Although the overall trend for phosphorouslevels has been for levels to decline, it can be seen in the agricultural areas that some sites’ levelsincreased periodically throughout the later decades. Site minimums, maximums, means andstandard deviations are shown for the three different areas in Table 4. Note that a high number ofsites (ten agricultural, seven urban, and one natural) have total phosphorous levels above the 0.03mg/L maximum guideline.
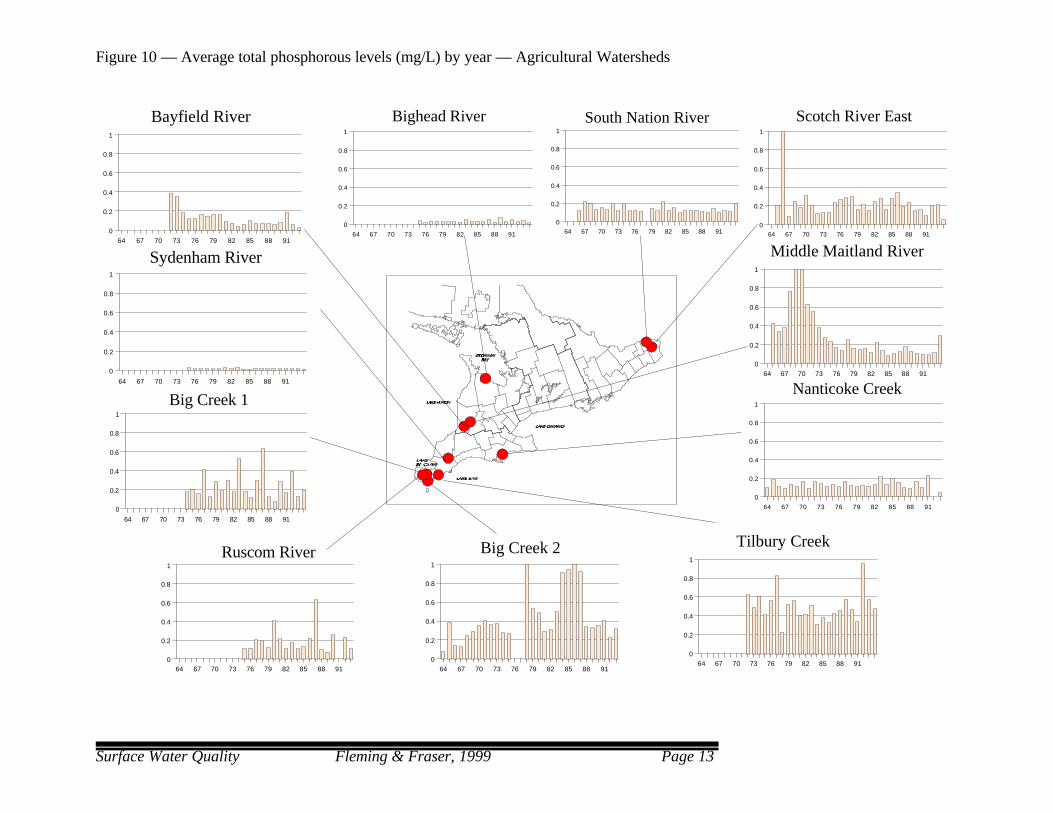
Surface Water Quality Fleming & Fraser, 1999 Page 13
Figure 10 — Average total phosphorous levels (mg/L) by year — Agricultural Watersheds
64 67 70 73 76 79 82 85 88 91
0
0.2
0.4
0.6
0.8
1
South Nation River
64 67 70 73 76 79 82 85 88 91
0
0.2
0.4
0.6
0.8
1
Scotch River East
64 67 70 73 76 79 82 85 88 91
0
0.2
0.4
0.6
0.8
1
Bighead River
64 67 70 73 76 79 82 85 88 910
0.2
0.4
0.6
0.8
1
Tilbury Creek
64 67 70 73 76 79 82 85 88 91
0
0.2
0.4
0.6
0.8
1
Big Creek 1
64 67 70 73 76 79 82 85 88 910
0.2
0.4
0.6
0.8
1
Middle Maitland River
64 67 70 73 76 79 82 85 88 910
0.2
0.4
0.6
0.8
1
Big Creek 2
64 67 70 73 76 79 82 85 88 91
0
0.2
0.4
0.6
0.8
1
Nanticoke Creek
64 67 70 73 76 79 82 85 88 910
0.2
0.4
0.6
0.8
1
Ruscom River
64 67 70 73 76 79 82 85 88 910
0.2
0.4
0.6
0.8
1
Bayfield River
64 67 70 73 76 79 82 85 88 91
0
0.2
0.4
0.6
0.8
1
Sydenham River

Surface Water Quality Fleming & Fraser, 1999 Page 14
Figure 11 — Average total phosphorous levels (mg/L) by year — Urban Watersheds
64 67 70 73 76 79 82 85 88 91 94
0
0.2
0.4
0.6
0.8
1
Little River
64 67 70 73 76 79 82 85 88 91 94
0
0.2
0.4
0.6
0.8
1
Twelve Mile Creek
64 67 70 73 76 79 82 85 88 91 94
0
0.2
0.4
0.6
0.8
1
Oakville Creek
64 67 70 73 76 79 82 85 88 91 94
0
0.2
0.4
0.6
0.8
1
Etobicoke Creek
64 67 70 73 76 79 82 85 88 91 94
0
0.2
0.4
0.6
0.8
1
Humber River
64 67 70 73 76 79 82 85 88 91 94
0
0.2
0.4
0.6
0.8
1
Rouge River
64 67 70 73 76 79 82 85 88 91 94
0
0.2
0.4
0.6
0.8
1
Carruthers Creek
64 67 70 73 76 79 82 85 88 91 94
0
0.2
0.4
0.6
0.8
1
Oshawa Creek

Surface Water Quality Fleming & Fraser, 1999 Page 15
Figure 12 — Average total phosphorous levels (mg/L) by year – Natural Watersheds
64 67 70 73 76 79 82 85 88 91
0
0.2
0.4
0.6
0.8
1
Musquash River
64 67 70 73 76 79 82 85 88 91 94
0
0.2
0.4
0.6
0.8
1
Muskoka River
64 67 70 73 76 79 82 85 88 91 94
0
0.2
0.4
0.6
0.8
1
Madawaska River
64 67 70 73 76 79 82 85 88 91 94
0
0.2
0.4
0.6
0.8
1
Rocky Saugeen River64 67 70 73 76 79 82 85 88 91 94
0
0.2
0.4
0.6
0.8
1
Albermarble Brook

Surface Water Quality Fleming & Fraser, 1999 Page 16
Table 4 – Total Phosphorous concentrations (mg/L) and calculations
Watershedtype
Name Count MeanYearly
AverageMinimum
YearlyAverageMaximum
StandardDeviation
Agricultural Bayfield River 240 0.119 0.031 0.386 0.18 Big Creek (1) 588 0.218 0.076 0.634 0.42 Big Creek (2) 316 0.425 1.288 0.078 0.39 Bighead River 342 0.034 0.014 0.069 0.07 Middle MaitlandRiver
386 0.374 0.085 1.249 0.54
Nanticoke Creek 298 0.134 0.042 0.224 0.11 Ruscom River 195 0.194 0.072 0.629 0.35 Scotch River East 197 0.400 0.054 3.930 2.36 South Nation River 238 0.138 0.101 0.218 0.10 Sydenham River 166 0.021 0.015 0.038 0.02 Tilbury Creek 242 0.501 0.229 0.959 0.58
Urban Carruthers Creek 364 0.079 0.020 0.275 0.16 Etobicoke Creek 426 1.068 0.058 15.800 2.50 Humber River 533 0.197 0.075 0.640 0.50 Little River 331 1.829 0.140 28.800 5.63 Oakville Creek 440 0.162 0.035 0.525 0.26 Oshawa Creek 350 0.155 0.016 1.690 0.19 Rouge River 258 0.126 0.024 0.315 0.14 Twelve Mile Creek 1078 0.042 0.024 0.170 0.04
Natural Albemarble Brook 199 0.022 0.008 0.056 0.03 Madawaska River 230 0.022 0.007 0.083 0.02 Muskoka River 238 0.022 0.003 0.150 0.08 Musquash River 306 0.024 0.004 0.102 0.10 Rocky SaugeenRiver
320 0.023 0.008 0.059 0.03
5.0 References
Bunce, N.J. 1993. Introduction to Environmental Chemistry. Wuerz Publishing, Winnipeg. pp 257-8.
Council for Agricultural Science and Technology (CAST). Dec 1992. Water Quality: Agriculture’s Role. pp 29-30.
Health and Welfare Canada. 1989. Guidelines for Canadian Drinking Water Quality, Fourth edition.
Ministry of the Environment. 1984. Water Management: Goals, Policies, Objectives and ImplementationProcedures of the Ministry of the Environment.
Peterson, G.A., and Frye, W.W.. 1989. Fertilizer and Nitrogen Management. In Nitrogen management andground water protection, ed R.F. Follett, 183-215. New York: Elsevier Science Publishers B.V.