nitrate –ams vs saga-aero
TRANSCRIPT

Nitrate – AMS vs SAGA-AEROAMS measurements include organic nitrate. SAGA measurements only include the inorganic ionic forms.
40
30
20
10
0
AM
S 60
s N
itrat
e (u
g sm
-3)
403020100
SAGA-AERO Nitrate (ug sm-3
)
1:1 All Data Points Data Points below DL fit All Data Points fit Data Points above DL
-4
-2
0
2
4
Nitr
ate
[SAG
A- A
MS
60s]
(ug
sm-3
)6 8
0.12 4 6 8
12 4 6 8
102
SAGA-AERO Nitrate (ug sm-3
)
Avg All Data Points = 0.2 ± 3.5Avg Data points above DL = 0.2 ± 3.5
Data Points Above DLY = a + bxa = -1.58 ± 0.19b = 1.388 ± 0.038R2 = 0.516
All Data Pointsy = a + bxa = -1.56 ± 0.19b = 1.385 ± 0.0374R2 = 0.517
• Uncertainty envelopes based on SAGA-AERO time base combined data uncertainty o AMS 60s calculated from data fileo SAGA = ± (0.02 ug std m-3 + 15%)
25th Percentile
75th PercentileMedian
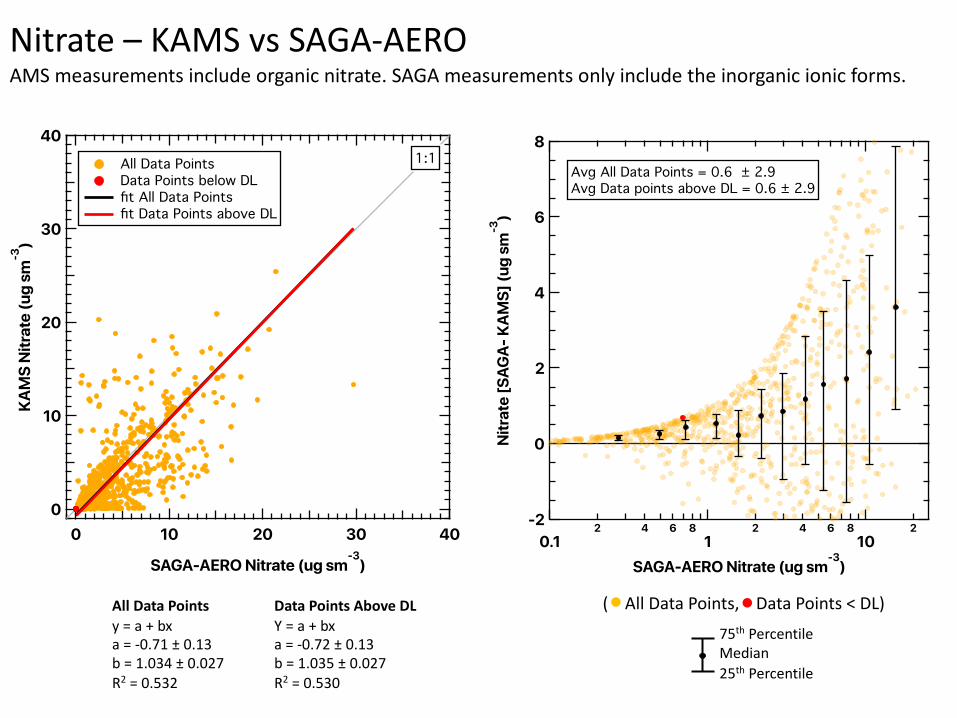
Nitrate – KAMS vs SAGA-AEROAMS measurements include organic nitrate. SAGA measurements only include the inorganic ionic forms.
Data Points Above DLY = a + bxa = -0.72 ± 0.13b = 1.035 ± 0.027R2 = 0.530
All Data Pointsy = a + bxa = -0.71 ± 0.13b = 1.034 ± 0.027R2 = 0.532
40
30
20
10
0
KAM
S N
itrat
e (u
g sm
-3)
403020100
SAGA-AERO Nitrate (ug sm-3
)
1:1 All Data Points Data Points below DL fit All Data Points fit Data Points above DL
8
6
4
2
0
-2N
itrat
e [S
AGA-
KA
MS]
(ug
sm-3
)
0.12 4 6 8
12 4 6 8
102
SAGA-AERO Nitrate (ug sm-3
)
Avg All Data Points = 0.6 ± 2.9Avg Data points above DL = 0.6 ± 2.9
25th Percentile
75th PercentileMedian
( All Data Points, Data Points < DL)
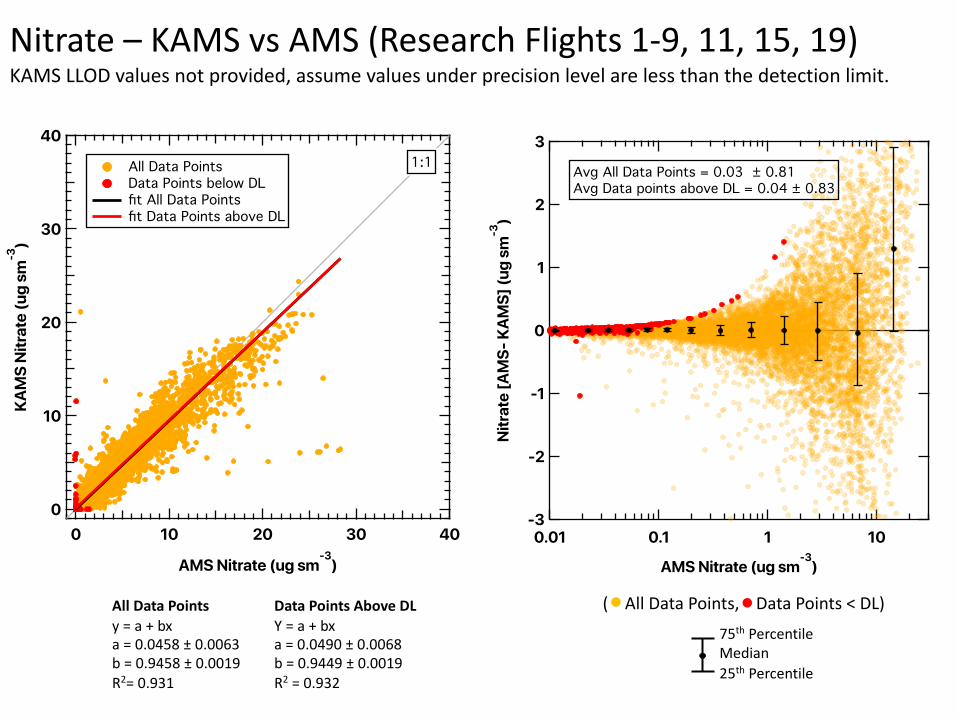
Nitrate – KAMS vs AMS (Research Flights 1-9, 11, 15, 19)KAMS LLOD values not provided, assume values under precision level are less than the detection limit.
40
30
20
10
0
KAM
S N
itrat
e (u
g sm
-3)
403020100
AMS Nitrate (ug sm-3
)
1:1 All Data Points Data Points below DL fit All Data Points fit Data Points above DL
-3
-2
-1
0
1
2
3
Nitr
ate
[AM
S- K
AM
S] (u
g sm
-3)
0.01 0.1 1 10
AMS Nitrate (ug sm-3
)
Avg All Data Points = 0.03 ± 0.81Avg Data points above DL = 0.04 ± 0.83
Data Points Above DLY = a + bxa = 0.0490 ± 0.0068b = 0.9449 ± 0.0019R2 = 0.932
All Data Pointsy = a + bxa = 0.0458 ± 0.0063b = 0.9458 ± 0.0019R2= 0.931 25th Percentile
75th PercentileMedian
( All Data Points, Data Points < DL)

Nitrate – KAMS vs AMS (Research Flights 10, 12-14, 16-18, 20)KAMS LLOD values not provided, assume values under precision level are less than the detection limit.
Data Points Above DLY = a + bxa = 0.3313 ± 0.018b = 0.7721 ± 0.0023R2= 0.895
All Data Pointsy = a + bxa = 0.308 ± 0.017b = 0.7739 ± 0.0023R2= 0.897
40
30
20
10
0
KAM
S N
itrat
e (u
g sm
-3)
403020100
AMS Nitrate (ug sm-3
)
1:1 All Data Points Data Points below DL fit All Data Points fit Data Points above DL
6
4
2
0
-2N
itrat
e [A
MS-
KA
MS]
(ug
sm-3
)
0.01 0.1 1 10
AMS Nitrate (ug sm-3
)
Avg All Data Points = 0.6 ± 2.3Avg Data Points above DL = 0.7 ± 2.3
25th Percentile
75th PercentileMedian
( All Data Points, Data Points < DL)

Data:• SAGA-AERO Merge: korusaq-mrgSAGA-AERO-dc8_merge_20160426_R3_thru20160609.ict (only data from flights 20160501-20160609
used in analysis – non-transit flights).• KORUSAQ-AMS-60s_DC8_########_R1.ict (######## = daily files from 20160501 – 20160609)• korusaq-SAGA-AERO_DC8_########_R1.ict (######## = daily files from 20160501 – 20160609)• KORUSAQ-KAMS_DC8_########_R3.ict (######## = daily files from 20160501 – 20160609)
Correlation:• Data reported at STP (273 K & 1013 mb).• Fit lines are derived from orthogonal distance regressions.• R2 values are calculated independently, not from orthogonal distance regression.• Data points below the DL/precision are colored red. • AMS/KAMS Comparison:
• Merged AMS 60s to KAMS time interval.• AMS 60s DL: reported in data file, propagated to KAMS time interval.• KAMS DL: LLOD values not provided, assume values under precision level are less than the detection limit.• Research flights separated per the recommendation of PIs, Research flights (1-9, 11, 15, 19) and Research Flights (10, 12-14, 16-
18, 20).• SAGA Comparison:
• AMS and KAMS reported DL and precision, respectively, propagated to SAGA time interval.• AMS/KAMS measurements include organic nitrate, whereas SAGA measurements only include the inorganic ionic forms.
Uncertainty propagation (Uncertainties provided by PIs).• AMS 1s precision reported in data file with 34% accuracy; SAGA-AERO time interval: calculated using quadrature average.• SAGA-AERO: ± [0.02 ug std m-3 + 15%].
Difference dependence on NO3 value:• AMS/KAMS Comparison:
• Difference calculated by AMS 60s - KAMS.• Median, 25th, and 75th percentiles based on 1500 data point bins (Early Flights) and 1000 data point bins (Late Flights) after
data is sorted by AMS 60s values.• SAGA Comparison:
• Difference calculated by SAGA-AERO – AMS 60s and SAGA-AERO – KAMS. • Median, 25th, and 75th percentiles based on 75 data point bins after data is sorted by SAGA-AERO values.• Uncertainty envelopes for SAGA/AMS comparison based on reported SAGA-AERO uncertainty and calculated AMS 1s total
uncertainty.