nist database for the simulation of electron … nist database for the simulation of electron...
TRANSCRIPT

1
NIST Database for the Simulation of Electron Spectra
For Surface Analysis (SESSA)*
Cedric Powell National Institute of Standards and Technology, Gaithersburg
1. What is it?
2. What can it do?
3. Summary
*https://www.nist.gov/srd/nist-standard-reference-database-100.

222
1. What is SESSA*?
SESSA can be used to simulate AES and XPS spectra of multilayer films and of
nanostructures such as islands, lines, spheres, and layered spheres on
surfaces. Users can specify the compositions and dimensions of each material
in the sample structure and the measurement configuration.
SESSA contains needed physical data: differential inverse inelastic mean free
paths, total inelastic mean free paths, differential elastic-scattering cross
sections, total elastic-scattering cross sections, transport cross sections,
photoionization cross sections, photoionization asymmetry parameters,
electron-impact ionization cross sections, photoelectron lineshapes, Auger-
electron lineshapes, fluorescence yields, and Auger-electron backscattering
factors.
SESSA can be operated through a graphical user interface (GUI) or through a
command line interface (CLI). The GUI enables a user to enter needed
information in an intuitive way (sample morphology, composition, dimensions,
instrument configuration, excitation source, spectrometer energy range) while
the CLI facilitates simulations for similar conditions (i.e., batch runs).
*https://www.nist.gov/srd/nist-standard-reference-database-100

3
GUI for a Planar Sample (C/SiO2/Si)

44
GUI for a Planar Sample (C/SiO2/Si)

55
GUI for Periodic Array of Cu Islands or Lines on a Si Substrate

666
GUI for Periodic Array of Au-core/C-shell Nanoparticles on a
Si Substrate

77
GUI for a Planar Sample (C/SiO2/Si): Peak Tab

8
GUI to Specify Excitation Source
GUI for Spectrometer: Specify Energy Range

999
GUI for Instrument Settings

10
GUI for Simulation [Example: Planar Sample (C/SiO2/Si)]
O 1s
C 1s Si 2s Si 2p

11
2. Examples of SESSA Applications
(a) Absolute Quantification of Surface Impurities on Layered Samples
Schematic of Multilayer Mirrors Used for Extreme Ultraviolet Lithography
XPS has been used to assess detect and quantify trace levels of surface
impurities on mirrors arising from outgassing of resists
We developed a procedure to quantify amounts of surface impurities rather than
assuming sample to be homogeneous and using instrumental software
N. S. Faradzhev, S. B. Hill, and C. J. Powell, Surf. Interface Anal. (in press);
DOI: 10.1002/sia.6289
(e.g., N, S, P, F, Cl, Br)

12
Comparison of Measured XPS Spectrum for a Multilayer Mirror Sample
(solid blue circles) and a Simulated Spectrum (solid red triangles) for
0.25 nm SiO2/0.25 nm CCl0.01/0.25 nm C/0.25 nm RuO2/3 nm Ru/4.3 nm Si/
3 nm Mo/Si
N. S. Faradzhev, S. B. Hill, and C. J. Powell, Surf. Interface Anal. (in press);
DOI: 10.1002/sia.6289
0
1
2
3
4
5
6
7
0100200300400500600700800
BB
Inte
nsity (
co
unts
x 1
0-5
)
Simulated Spectrum
Measured SpectrumRu
3d
Ru
3p
Ru
3s
O
1s
C
1s

13
Comparison of Measured XPS Spectrum for a Multilayer Mirror Sample
(solid blue circles) and a Simulated Spectrum (solid red triangles) for
0.25 nm SiO2/0.25 nm CCl0.01/0.25 nm C/0.25 nm RuO2/3 nm Ru/4.3 nm Si/
3 nm Mo/Si
Comparison of
measured and
simulated Cl 2p
intensities gives
a surface Cl
coverage of
0.20 ML (± 21 %)
N. S. Faradzhev, S. B. Hill, and C. J. Powell, Surf. Interface Anal. (in press);
DOI: 10.1002/sia.6289
0.0
0.2
0.4
0.6
0.8
050100150200250
BB
Inte
nsity (
counts
x 1
0-5
)
Binding Energy (eV)
Simulated Spectrum
Measured Spectrum
Ru
4sMo
3dCl
2p
Ru
4p
Si
2s
Si
2p

(b) Comparison of Simulated Cu 2p Spectra from Cu/Au Nanoparticles
We used SESSA to determine the Au-shell thicknesses that gave a selected
Cu 2p peak intensity for different Cu-core diameters
C. J. Powell, M. Chudzicki, W. S. M. Werner, and W. Smekal, J. Vac. Sci. Technol. A
33, 05E113 (2015).14
0.0
0.5
1.0
1.5
2.0
2.5
450 500 550
Spectrum 58Spectrum 56Spectrum 54Spectrum 52ASpectrum 60
Rela
tive I
nte
nsity
Electron Energy (eV)
Elastic scattering on
0.775 nm Au/10 nm Cu0.70 nm Au/5 nm Cu
0.475 nm Au/2 nm Cu0.255 nm Au/1 nm Cu0.085 nm Au/0.5 nm Cu
CuAu

15
We used SESSA to determine the Cu-shell thicknesses that gave a selected
Cu 2p peak intensity for different Au-core diameters
C. J. Powell, M. Chudzicki, W. S. M. Werner, and W. Smekal, J. Vac. Sci. Technol. A
33, 05E113 (2015).15
0.0
0.5
1.0
1.5
2.0
2.5
450 500 550
Spectrum 58Spectrum 56Spectrum 54Spectrum 52ASpectrum 60
Rela
tive I
nte
nsity
Electron Energy (eV)
Elastic scattering on
0.073 nm Cu/10 nm Au0.068 nm Cu/5 nm Au
0.060 nm Cu/2 nm Au0.050 nm Cu/1 nm Au0.050 nm Cu/0.5 nm Au
AuCu

16
We used SESSA to determine the Au-shell thicknesses that gave a selected
Cu 2p peak intensity from Au-core/1 nm Cu-shell/Au-shell nanoparticles for
different Au-core diameters
C. J. Powell, M. Chudzicki, W. S. M. Werner, and W. Smekal, J. Vac. Sci. Technol. A
33, 05E113 (2015).
0.0
0.5
1.0
1.5
2.0
2.5
450 500 550
Spectrum 58Spectrum 56Spectrum 54Spectrum 52ASpectrum 60
Rela
tive I
nte
nsity
Electron Energy (eV)
Elastic scattering on
0.51 nm Au/1 nm Cu/10 nm Au
0.49 nm Au/1 nm Cu/5 nm Au
0.45 nm Au/1 nm Cu/2 nm Au
0.40 nm Au/1 nm Cu/1 nm Au
0.34 nm Au/1 nm Cu/0.5 nm Au
AuAu
Cu

17
We used SESSA to determine the Au content of CuAux nanoparticles that gave
A selected Cu 2p intensity for different nanoparticle diameters
C. J. Powell, M. Chudzicki, W. S. M. Werner, and W. Smekal, J. Vac. Sci. Technol. A
33, 05E113 (2015).
0.0
0.5
1.0
1.5
2.0
2.5
450 500 550
Spectrum 58Spectrum 56Spectrum 54Spectrum 52ASpectrum 60
Rela
tive I
nte
nsity
Electron Energy (eV)
Elastic scattering on
d = 10 nm, x = 2.70
d = 5 nm, x = 2.60
d = 2 nm, x = 2.10
d = 1 nm, x = 1.32
d = 0.5 nm, x = 0.55
CuAux
18
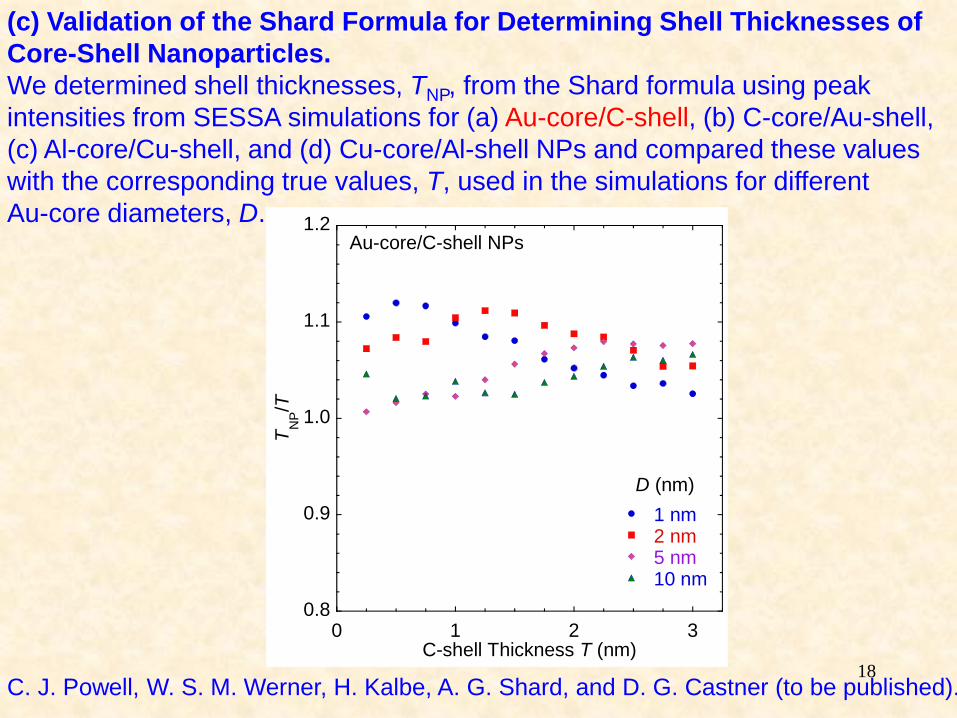
(c) Validation of the Shard Formula for Determining Shell Thicknesses of
Core-Shell Nanoparticles.
We determined shell thicknesses, TNP, from the Shard formula using peak
intensities from SESSA simulations for (a) Au-core/C-shell, (b) C-core/Au-shell,
(c) Al-core/Cu-shell, and (d) Cu-core/Al-shell NPs and compared these values
with the corresponding true values, T, used in the simulations for different
Au-core diameters, D.
C. J. Powell, W. S. M. Werner, H. Kalbe, A. G. Shard, and D. G. Castner (to be published).
0.8
0.9
1.0
1.1
1.2
0 1 2 3
1 nm2 nm5 nm10 nm
TN
P/T
C-shell Thickness T (nm)
Au-core/C-shell NPs
D (nm)

19
We determined shell thicknesses, TNP, from the Shard formula using peak
intensities from SESSA simulations for (a) Au-core/C-shell, (b) C-core/Au-shell,
(c) Al-core/Cu-shell, and (d) Cu-core/Al-shell NPs and compared these values
with the corresponding true values, T, used in the simulations for different
Au-core diameters, D.
C. J. Powell, W. S. M. Werner, H. Kalbe, A. G. Shard, and D. G. Castner (to be published).
0.8
0.9
1.0
1.1
1.2
0 1 2 3
1 nm2 nm5 nm10 nm
TN
P/T
Au-shell Thickness T (nm)
C-core/Au-shell NPs D (nm)

20
We determined shell thicknesses, TNP, from the Shard formula using peak
intensities from SESSA simulations for (a) Au-core/C-shell, (b) C-core/Au-shell,
(c) Al-core/Cu-shell, and (d) Cu-core/Al-shell NPs and compared these values
with the corresponding true values, T, used in the simulations for different
Au-core diameters, D.
C. J. Powell, W. S. M. Werner, H. Kalbe, A. G. Shard, and D. G. Castner (to be published).
0.8
0.9
1.0
1.1
1.2
0 1 2 3
1 nm2 nm5 nm10 nm
TN
P/T
Cu-shell Thickness T (nm)
Al-core/Cu-shell NPs D (nm)

21
We determined shell thicknesses, TNP, from the Shard formula using peak
intensities from SESSA simulations for (a) Au-core/C-shell, (b) C-core/Au-shell,
(c) Al-core/Cu-shell, and (d) Cu-core/Al-shell NPs and compared these values
with the corresponding true values, T, used in the simulations for different
Au-core diameters, D.
C. J. Powell, W. S. M. Werner, H. Kalbe, A. G. Shard, and D. G. Castner (to be published).
0.8
0.9
1.0
1.1
1.2
0 1 2 3
1 nm2 nm5 nm10 nm
TN
P/T
Al-shell Thickness T (nm)
Cu-core/Al-shell NPs D (nm)

22
3. Summary
SESSA* is a NIST database that contains extensive data for
quantitative AES and XPS
SESSA can be used to simulate AES and XPS spectra for
multilayer thin films and of nanostructures such as islands, lines,
spheres, and layered spheres on surfaces.
Users can specify the compositions and dimensions of each
material in the sample and the measurement configuration.
*https://www.nist.gov/srd/nist-standard-reference-database-100