nisheeth singh ch wam - epcc workshop 3/nisheeth... · epcc, lofthus, 2007 june 10 th-13 th 1/25 1....
TRANSCRIPT

EPCC, Lofthus, 2007 June 10th-13th 1/25
1. Why WAM
2. First Wide Area Application
3. System Structure
4. Monitoring of UCTE power system stability
5. Outlook
6. References
Content

EPCC, Lofthus, 2007 June 10th-13th 2/25
UCTE
NORDEL
UKTSOA
ATSOI
Border between UCTE North and South
Coordination center UCTE South – ETRANS, Switzerland
Coordination center UCTE North – RWE, Germany
Union for the Coordination of Transmission of Electricity
Mission: define technical rules for the use of the
transmission system
CH operating figures
7.3 million inhabitants
Peak load: 9.5 GW
Electric energy consumption/year: 59 TWh
UCTE operating figures
450 million inhabitants
Peak load: 300 – 370 GW
Electric energy consumption/year 2368 TWh
3% consumption
10% cross-border transit
Switzerland in the Middle of the System

EPCC, Lofthus, 2007 June 10th-13th 3/25
CH System in the Middle of High Transits

EPCC, Lofthus, 2007 June 10th-13th 4/25
WAM System Applications
• Transmission corridor monitoring
• Monitoring of power system stability
• Backbone for power system restoration

EPCC, Lofthus, 2007 June 10th-13th 5/25
Corridor Monitoring

EPCC, Lofthus, 2007 June 10th-13th 6/25
Monitoring more than one’s own system operation 10.04.2005 21:06:30 - Outage: Slovenia-Italy Link (Divaca-Redipuglia, Divaca-Padriciano)
1278 MW for complete Interconnection
0
2.5
5
7.5
10
21:05:45 21:06:00 21:06:15 21:06:30 21:06:45 21:07:00 21:07:15 21:07:31
∆φ [°]
550
600
650
700
750
800
850
900
950
1000
P [MW]
active Power: Lavorgo - Mettlen
100 MW
active Power: Soazza - Bulciago
voltage phase angle difference: Bassecourt - Soazza
voltage phase angle difference: Bassecourt -Lavorgo
~1.5°
~2.5°

EPCC, Lofthus, 2007 June 10th-13th 7/25
Ceuta
Merged WAM Recordings

EPCC, Lofthus, 2007 June 10th-13th 8/25
Ceuta
Locations of collected PMU data
Bassecourt
Mettlen
Lavorgo
Soazza
Robbia 1+2
Bulciago
Vignole
Latina
Ag. Stefanos
Wien SO
Ternitz
Zerjavinec
Tumbri
Divaca

EPCC, Lofthus, 2007 June 10th-13th 9/25
Three islands system operation
All measurements are synchronised by GPS signal
48.8
49
49.2
49.4
49.6
49.8
50
50.2
50.4
50.6
50.8
51
51.2
51.4
51.6
04.11.2006 22:00:00 04.11.2006 22:10:00 04.11.2006 22:20:00 04.11.2006 22:30:00 04.11.2006 22:40:00 04.11.2006 22:50:00 04.11.2006 23:00:00
f [Hz]
frequency Bassecourt frequency Ag. Stefanos frequency Ternitz

EPCC, Lofthus, 2007 June 10th-13th 10/25
39 Minutes of Network islanding
All measurements are synchronised by GPS signal
48.8
49
49.2
49.4
49.6
49.8
50
50.2
50.4
50.6
50.8
51
51.2
51.4
51.6
04.11.2006 22:00:00 04.11.2006 22:10:00 04.11.2006 22:20:00 04.11.2006 22:30:00 04.11.2006 22:40:00 04.11.2006 22:50:00 04.11.2006 23:00:00
f [Hz]
frequency Bassecourt frequency Ag. Stefanos frequency Ternitz

EPCC, Lofthus, 2007 June 10th-13th 11/25
Resynchronisation
22:47:23.400
22:49:26.300
All measurements are synchronised by GPS signal
49.7
49.9
50.1
50.3
50.5
50.7
50.9
51.1
04.11.2006 22:35:00 04.11.2006 22:40:00 04.11.2006 22:45:00 04.11.2006 22:50:00
f [Hz]
frequency Bassecourt frequency Ag. Stefanos frequency Ternitz

EPCC, Lofthus, 2007 June 10th-13th 12/25
WAM Application during UCTE Resynchronisation
ZONE 2
ZONE 1
PMU
PMU
Peak Load: 223 GW
Peak Load : 21 GW
PMU
PMU
2004 October 10th 9:34 – 10:58
Zagreb
European Electrical Reunification
5 x 380 kV
2 x 220 kV
1 x 110 kV
EPCC, Lofthus, 2007 June 10th-13th 13/25
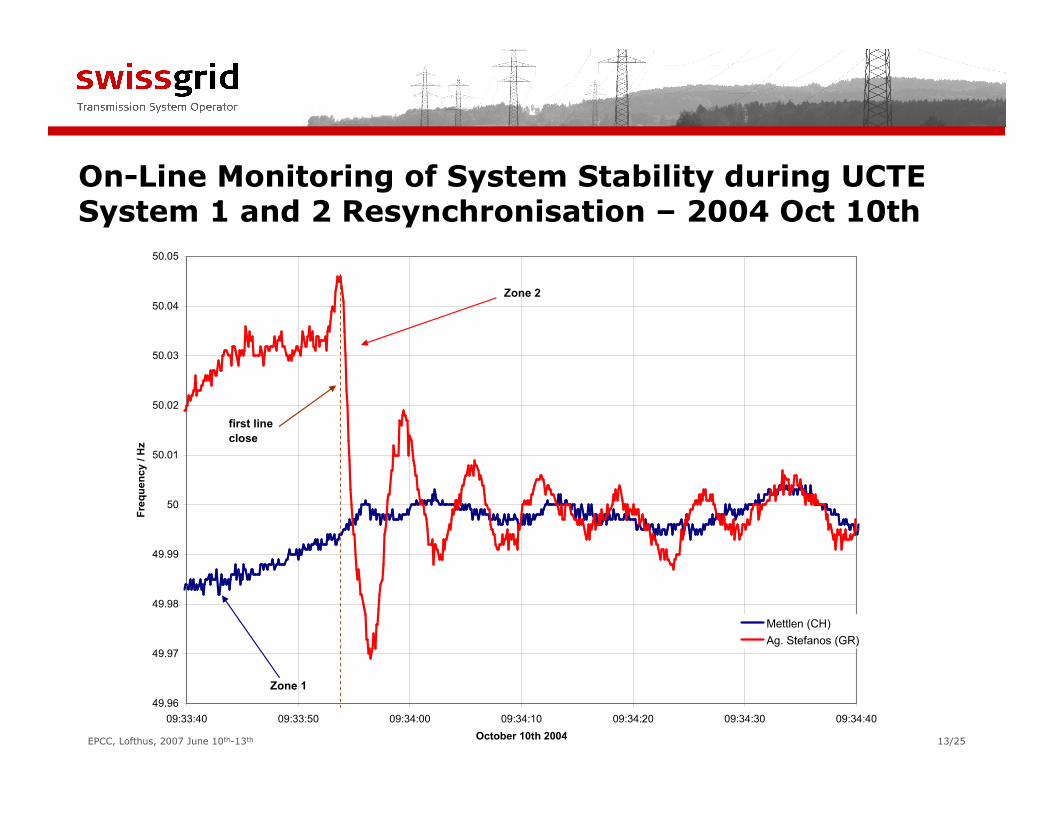
On-Line Monitoring of System Stability during UCTE System 1 and 2 Resynchronisation – 2004 Oct 10th
49.96
49.97
49.98
49.99
50
50.01
50.02
50.03
50.04
50.05
09:33:40 09:33:50 09:34:00 09:34:10 09:34:20 09:34:30 09:34:40
October 10th 2004
Frequency / Hz
Mettlen (CH)
Ag. Stefanos (GR)
Zone 2
Zone 1
first line
close

EPCC, Lofthus, 2007 June 10th-13th 14/25
System Structure
CommunicationSwitchgear Cubicle-PMU Data Concentrator
Current & Voltage
Phasor
Frequency
Accuracy
0.1 Degree
1 mHz
Time Resolution
20 msec
Substation
Feeder
VT, CT
Data Export
Alarms
Informa-
tion
Filter
SCADA
System
EPCC, Lofthus, 2007 June 10th-13th 15/25
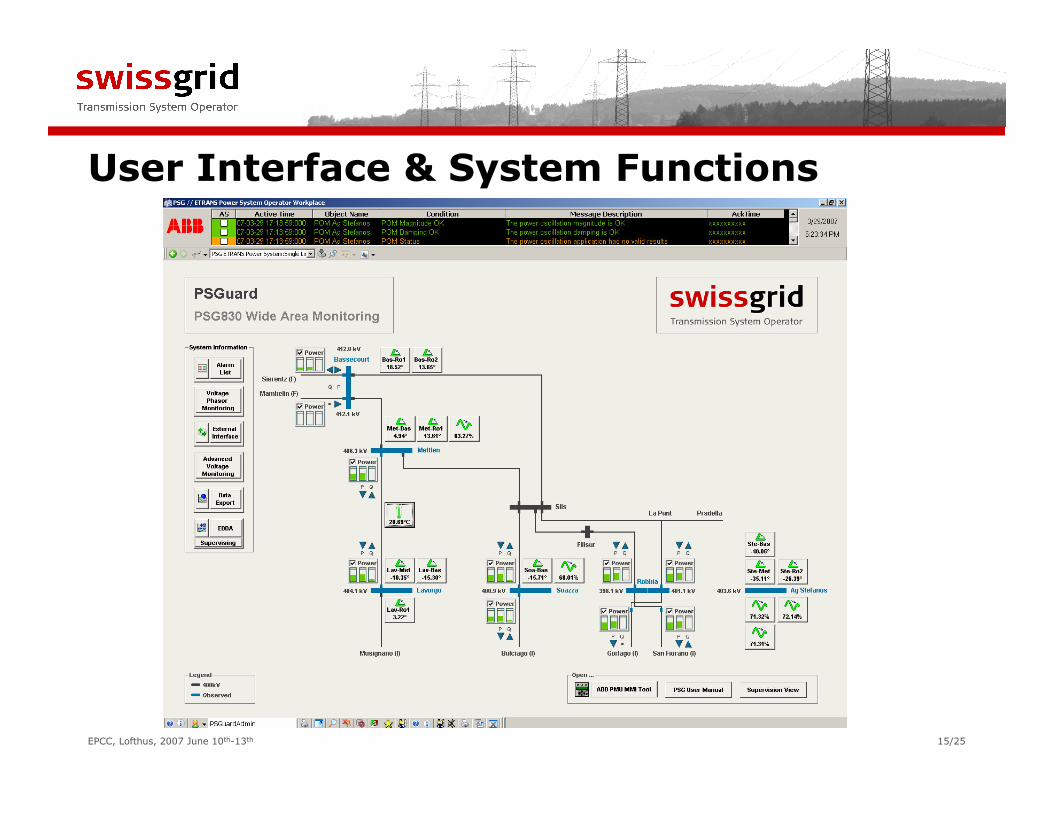
User Interface & System Functions

EPCC, Lofthus, 2007 June 10th-13th 16/25
Ceuta
Ceuta
Bassecourt
Mettlen
Lavorgo
Soazza
Robbia
Divaca
Ag. Stefanos
Wien SO
Ternitz
Zerjavinec
Tumbri
ThessalonikiSchaltanlage mit Transformatoren
Leitung mit 220kV in Betrieb
Leitung mit 380kV in Betrieb
Schaltanlage mit Transformatoren
Leitung mit 220kV in Betrieb
Leitung mit 380kV in Betrieb
Legende:
Schaltanlage
Legende:
Schaltanlage
Wide Area Monitoring –
Early W
arning System

EPCC, Lofthus, 2007 June 10th-13th 17/25
Data Transfer Chain
EPCC, Lofthus, 2007 June 10th-13th 18/25
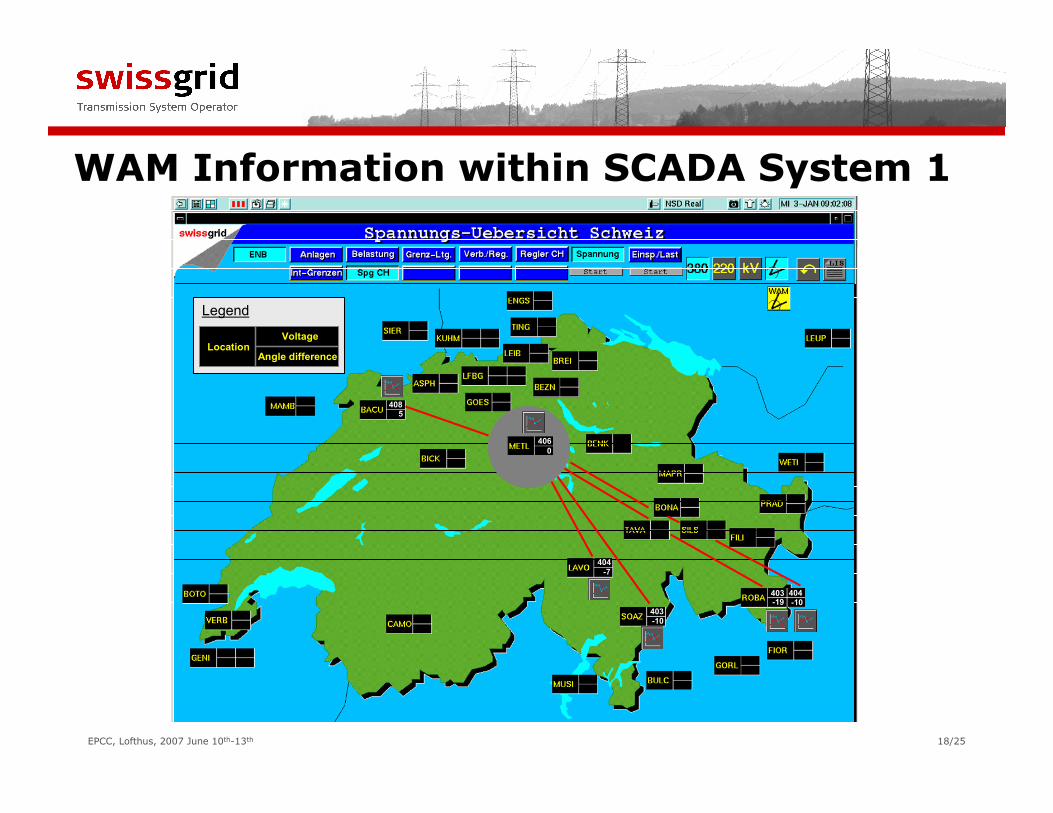
WAM Information within SCADA System 1
4085
0
406
-7
404
-10403
-19403
-10404
Legend
LocationVoltage
Angle difference

EPCC, Lofthus, 2007 June 10th-13th 19/25
WAM Information within SCADA System 2
Netzpendelverhalten
Legend
LocationFrequency
Angle difference
METL50.024
0METL
50.024
0
50.021
- 30STEF
50.021
- 30STEF
THESTHES
ZERJZERJ
DIVADIVA
TERNTERN

EPCC, Lofthus, 2007 June 10th-13th 20/25
Power System Oscillation Detection
0
5
10
15
20
25
30
35
40
45
50
08:00:00 08:05:00 08:10:00 08:15:00 08:20:00 08:25:00 08:30:00
Amplitude [MW]
-100
-80
-60
-40
-20
0
20
40
60
80
100
Dämpfung [%]
Amplitude Soazza Dämpfung Soazza
-11 %
14 MW
2007, April 1st

EPCC, Lofthus, 2007 June 10th-13th 21/25
800
820
840
860
880
900
920
940
960
980
1000
08:00:00 08:05:00 08:10:00 08:15:00 08:20:00 08:25:00 08:30:00
P [MW]
Mettlen - Lavorgo Sils - Soazza Robbia - San Fiorano Robbia - Gorlago
UCTE North-South Inter-Area Oscillation
2007, April 1st

EPCC, Lofthus, 2007 June 10th-13th 22/25
920
930
940
950
960
970
980
990
1000
08:14:00 08:14:30 08:15:00 08:15:30 08:16:00 08:16:30 08:17:00 08:17:30 08:18:00
P [MW]
3 Minuten
4 Sekunden
25 MW
2007, April 1st
Robbia-Gorlago Active Power Flow

EPCC, Lofthus, 2007 June 10th-13th 23/25
Voltagephase Angle - Indication of Network loading
Voltagephase Angle(º)
Fig. D1a: Voltage phase
angle differences in the
UCTE system at 22:00
/ELES/
Quelle: UCTE Abschlussbericht
zur Systemstörung 4. Nov. 2006
Initial loadingbefore disturbance

EPCC, Lofthus, 2007 June 10th-13th 24/25
WAM Measurements Visualisation Example

EPCC, Lofthus, 2007 June 10th-13th 25/25
PMUs in Slovenia
MARIBOR
KRŠKO
OKROGLO
DIVAČČČČA
BERIČČČČEVO
PODLOG
HR
AT
IT
REDIPUGLIA
KAINACHTAL
MELINA
TUMBRI
S l o v e n i a
HUHEVIZ
ERNESTINOVO
ZERJAVINEC

EPCC, Lofthus, 2007 June 10th-13th 26/25
Data Visualization
Source: ELES

EPCC, Lofthus, 2007 June 10th-13th 27/25
Monitoring System Damping in Real-Time
-10
0
10
20
30
40
50
60
70
80
90
14:27:00 14:27:30 14:28:00 14:28:30 14:29:00 14:29:30 14:30:00
Damping [%]; Frequency 100 [Hz];
Angle [°]
49.825
49.845
49.865
49.885
49.905
49.925
49.945
49.965
49.985
50.005
50.025
Frequency [Hz]
Damping [%] Eigen-Frequency*100 [Hz] Oscillation magnitude*10 [°deg]
dφ: Ag.Stefanos-Bassecourt [°deg] Frequency Bassecourt [Hz] Frequency Ag.Stefanos [Hz]

EPCC, Lofthus, 2007 June 10th-13th 28/25
Use of WAMS
•Monitoring of voltage angle between substations
•Stability monitoring
•Post-mortem analyses
•Modeling improvement
•Measurement of line temperature
•Real-Time monitoring of System Damping

EPCC, Lofthus, 2007 June 10th-13th 29/25
Conclusion and Outlook
• Successful Implementation of WAM Technology
• Comprehensive System Information based on few measurements
• Link between on-line dynamic system monitoring and steady-state SCADA overview
• Key Points
• Reliable communication infrastructure
• GPS satellite visibility
• Intelligent data computation and storage
• Basis for UCTE wide awareness system
• Measurements of strategic substations with own GPS time stamp
• Central Data acquisition and web-based data distribution
EPCC, Lofthus, 2007 June 10th-13th 30/25
References
W. Sattinger, R. Baumann, Ph. Rothermann, “A New Dimension in Grid Monitoring”, Transmission and Distribution World, February 2007
W. Sattinger, J. Bertsch, P. Reinhardt, “Operational Experience with Wide Area Monitoring Systems”, B5-216, CIGRE 2006 Session, August 27th – September 1st Paris
W. Sattinger, “Methods of Processing Provided Information and Use of Monitoring Results for Power System Dynamic Characteristic Analysis – Monitoring of Power System Dynamic Performance”, Tutorial Part 2, CIGRE 2006 International Scientific Conference –Monitoring of Power System Dynamics Performance, April 25-27 2006, Moscow
P. Reinhard, C. Carnal, W. Sattinger, “Reconnecting Europe”, Power Engineering
International, January 2005