(nir-ci) on pharmaceutical solid dosage forms - for the · pdf filejournal of pharmaceutical...
TRANSCRIPT

Journal of Pharmaceutical and Biomedical Analysis 48 (2008) 554–561
Contents lists available at ScienceDirect
Journal of Pharmaceutical and Biomedical Analysis
journa l homepage: www.e lsev ier .com/ locate / jpba
Near-infrared chemical imaging (NIR-CI) on pharmaceutical solid dosageforms—Comparing common calibration approaches
Carsten Ravna,b,∗, Erik Skibstedb, Rasmus Broc
a Department of Pharmaceutics and Analytical Chemistry, Faculty of Pharmaceutical Sciences, University of Copenhagen, Universitetsparken 2, 2100 Copenhagen, Denmarkb CMC Formulation and Analysis, Novo Nordisk A/S, Novo Nordisk Park, 2760 Maaloev, Denmarkc Department of Food Science, Faculty of Life Sciences, University of Copenhagen, Rolighedsvej 30, 1958 Frederiksberg C, Denmark
a r t i c l e i n f o
Article history:Received 27 May 2008Received in revised form 21 July 2008Accepted 21 July 2008Available online 31 July 2008
Keywords:NIR chemical imaging (NIR-CI)Chemical imagingHyperspectral imageHyperspectral data cubeImage analysisSolid dosage formsClassical/partial least squares
a b s t r a c t
Near-infrared chemical imaging (NIR-CI) is the fusion of near-infrared spectroscopy and image analysis.It can be used to visualize the spatial distribution of the chemical compounds in a sample (providing achemical image). Each sample measurement generates a hyperspectral data cube containing thousandsof spectra. An important part of a NIR-CI analysis is the data processing of the hyperspectral data cube.The aim of this study was to compare the ability of different commonly used calibration methods togenerate accurate chemical images. Three common calibration approaches were compared: (1) usingsingle wavenumber, (2) using classical least squares regression (CLS) and (3) using partial least squaresregression (PLS1). Each method was evaluated using two different preprocessing methods.
A calibration data set of tablets with five constituents was used for analysis. Chemical images of the activepharmaceutical ingredient (API) and the two major excipients cellulose and lactose in the formulationwere made. The accuracy of the generated chemical images was evaluated by the concentration predictionability. The most accurate predictions for all three compounds were generated by PLS1. The drawback ofPLS1 is that it requires a calibration data set and CLS, which does not require a calibration data set,therefore proved to be an excellent alternative. CLS also generated accurate predictions and only requiresthe pure compound spectrum of each constituent in the sample. All three calibration approaches werefound applicable for hyperspectral image analysis but their relevance of use depends on the purpose ofanalysis and type of data set. As expected, the single wavenumber method was primarily found useful for
compounds with a distinct spectral band that was not overlapped by bands of other constituents.s guid
1
nwsptsCbN
N
rnweisdf
0d
This paper also providetypical steps involved.
. Introduction
Near-infrared chemical imaging (NIR-CI) is an emerging tech-ology within the pharmaceutical industry compared to the nowell-established traditional NIR spectroscopy. Pharmaceutical NIR
pectroscopy applications range from raw material testing throughrocess monitoring to final product analysis [1–5]. The conven-ional single point NIR spectroscopy measures a bulk average NIR
pectrum and reflects an average composition of the sample. NIR-I adds spatial distribution information to the spectral informationy combining traditional NIR spectroscopy with digital imaging. InIR-CI, a NIR spectrum is recorded in each pixel of the sample image∗ Corresponding author at: Novo Nordisk A/S, CMC Formulation and Analysis,ovo Nordisk Park, B6.1.070, 2760 Maaloev, Denmark. Tel.: +45 44431481.
E-mail addresses: [email protected], [email protected] (C. Ravn).
vitducicta
731-7085/$ – see front matter © 2008 Elsevier B.V. All rights reserved.oi:10.1016/j.jpba.2008.07.019
ance for hyperspectral image (or NIR-CI) analysis describing each of the
© 2008 Elsevier B.V. All rights reserved.
esulting in a hyperspectral data cube. Translating the spectral sig-ature from each pixel into, for example, chemical concentrationsill generate a set of chemical images showing the distribution of
ach ingredient within the sample matrix. This visualization of thenternal structure and elucidation of the distribution and clusterize of each constituent in the sample is valuable in formulationevelopment and manufacturing of solid dosage forms as well asor troubleshooting quality defects. NIR-CI has the potential to pro-ide increased process and product understanding which goes welln hand with the process analytical technology (PAT) initiative ofhe FDA [6]. Briefly, the concept of PAT is to build in quality byesign instead of merely passively testing the quality of the prod-cts and manufacturing processes. PAT promotes technologies that
an identify and monitor critical process parameters and the goals to enhance understanding and control the manufacturing pro-ess. NIR-CI is such a technology and has received attention byhe FDA, which has evaluated NIR-CI for different pharmaceuticalpplications [7–10].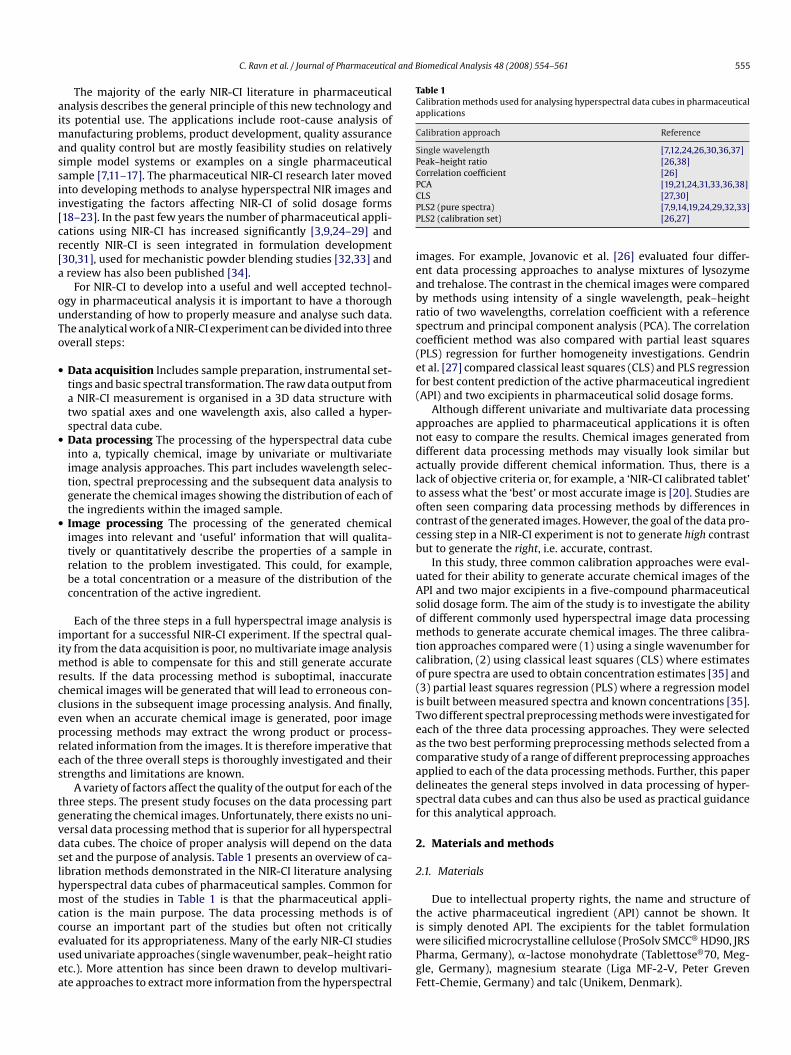
l and Biomedical Analysis 48 (2008) 554–561 555
aimassii[cr[a
ouTo
•
•
•
iimrccepres
tgvdslhmcceuea
Table 1Calibration methods used for analysing hyperspectral data cubes in pharmaceuticalapplications
Calibration approach Reference
Single wavelength [7,12,24,26,30,36,37]Peak–height ratio [26,38]Correlation coefficient [26]PCA [19,21,24,31,33,36,38]CPP
ieabrsc(ef(
andaltoccb
uAsomtco(iTeacadsf
2
2
t
C. Ravn et al. / Journal of Pharmaceutica
The majority of the early NIR-CI literature in pharmaceuticalnalysis describes the general principle of this new technology andts potential use. The applications include root-cause analysis of
anufacturing problems, product development, quality assurancend quality control but are mostly feasibility studies on relativelyimple model systems or examples on a single pharmaceuticalample [7,11–17]. The pharmaceutical NIR-CI research later movednto developing methods to analyse hyperspectral NIR images andnvestigating the factors affecting NIR-CI of solid dosage forms18–23]. In the past few years the number of pharmaceutical appli-ations using NIR-CI has increased significantly [3,9,24–29] andecently NIR-CI is seen integrated in formulation development30,31], used for mechanistic powder blending studies [32,33] andreview has also been published [34].
For NIR-CI to develop into a useful and well accepted technol-gy in pharmaceutical analysis it is important to have a thoroughnderstanding of how to properly measure and analyse such data.he analytical work of a NIR-CI experiment can be divided into threeverall steps:
Data acquisition Includes sample preparation, instrumental set-tings and basic spectral transformation. The raw data output froma NIR-CI measurement is organised in a 3D data structure withtwo spatial axes and one wavelength axis, also called a hyper-spectral data cube.Data processing The processing of the hyperspectral data cubeinto a, typically chemical, image by univariate or multivariateimage analysis approaches. This part includes wavelength selec-tion, spectral preprocessing and the subsequent data analysis togenerate the chemical images showing the distribution of each ofthe ingredients within the imaged sample.Image processing The processing of the generated chemicalimages into relevant and ‘useful’ information that will qualita-tively or quantitatively describe the properties of a sample inrelation to the problem investigated. This could, for example,be a total concentration or a measure of the distribution of theconcentration of the active ingredient.
Each of the three steps in a full hyperspectral image analysis ismportant for a successful NIR-CI experiment. If the spectral qual-ty from the data acquisition is poor, no multivariate image analysis
ethod is able to compensate for this and still generate accurateesults. If the data processing method is suboptimal, inaccuratehemical images will be generated that will lead to erroneous con-lusions in the subsequent image processing analysis. And finally,ven when an accurate chemical image is generated, poor imagerocessing methods may extract the wrong product or process-elated information from the images. It is therefore imperative thatach of the three overall steps is thoroughly investigated and theirtrengths and limitations are known.
A variety of factors affect the quality of the output for each of thehree steps. The present study focuses on the data processing partenerating the chemical images. Unfortunately, there exists no uni-ersal data processing method that is superior for all hyperspectralata cubes. The choice of proper analysis will depend on the dataet and the purpose of analysis. Table 1 presents an overview of ca-ibration methods demonstrated in the NIR-CI literature analysingyperspectral data cubes of pharmaceutical samples. Common forost of the studies in Table 1 is that the pharmaceutical appli-
ation is the main purpose. The data processing methods is of
ourse an important part of the studies but often not criticallyvaluated for its appropriateness. Many of the early NIR-CI studiessed univariate approaches (single wavenumber, peak–height ratiotc.). More attention has since been drawn to develop multivari-te approaches to extract more information from the hyperspectraliwPgF
LS [27,30]LS2 (pure spectra) [7,9,14,19,24,29,32,33]LS2 (calibration set) [26,27]
mages. For example, Jovanovic et al. [26] evaluated four differ-nt data processing approaches to analyse mixtures of lysozymend trehalose. The contrast in the chemical images were comparedy methods using intensity of a single wavelength, peak–heightatio of two wavelengths, correlation coefficient with a referencepectrum and principal component analysis (PCA). The correlationoefficient method was also compared with partial least squaresPLS) regression for further homogeneity investigations. Gendrint al. [27] compared classical least squares (CLS) and PLS regressionor best content prediction of the active pharmaceutical ingredientAPI) and two excipients in pharmaceutical solid dosage forms.
Although different univariate and multivariate data processingpproaches are applied to pharmaceutical applications it is oftenot easy to compare the results. Chemical images generated fromifferent data processing methods may visually look similar butctually provide different chemical information. Thus, there is aack of objective criteria or, for example, a ‘NIR-CI calibrated tablet’o assess what the ‘best’ or most accurate image is [20]. Studies areften seen comparing data processing methods by differences inontrast of the generated images. However, the goal of the data pro-essing step in a NIR-CI experiment is not to generate high contrastut to generate the right, i.e. accurate, contrast.
In this study, three common calibration approaches were eval-ated for their ability to generate accurate chemical images of thePI and two major excipients in a five-compound pharmaceuticalolid dosage form. The aim of the study is to investigate the abilityf different commonly used hyperspectral image data processingethods to generate accurate chemical images. The three calibra-
ion approaches compared were (1) using a single wavenumber foralibration, (2) using classical least squares (CLS) where estimatesf pure spectra are used to obtain concentration estimates [35] and3) partial least squares regression (PLS) where a regression models built between measured spectra and known concentrations [35].wo different spectral preprocessing methods were investigated forach of the three data processing approaches. They were selecteds the two best performing preprocessing methods selected from aomparative study of a range of different preprocessing approachespplied to each of the data processing methods. Further, this paperelineates the general steps involved in data processing of hyper-pectral data cubes and can thus also be used as practical guidanceor this analytical approach.
. Materials and methods
.1. Materials
Due to intellectual property rights, the name and structure ofhe active pharmaceutical ingredient (API) cannot be shown. It
s simply denoted API. The excipients for the tablet formulationere silicified microcrystalline cellulose (ProSolv SMCC® HD90, JRSharma, Germany), �-lactose monohydrate (Tablettose®70, Meg-le, Germany), magnesium stearate (Liga MF-2-V, Peter Grevenett-Chemie, Germany) and talc (Unikem, Denmark).

5 l and B
2
ltm(mndw±nmc
aaoaccacutr
2
fft
lwlst2el
2
cibtorN
iu
2
tAfrc
2
wftstea2a
2
tcb
2
bris(frFatv
2
mtioct
ctcNpcd[h
patbwSo
56 C. Ravn et al. / Journal of Pharmaceutica
.2. Samples
A five-compound conventional pharmaceutical tablet formu-ation was used to produce the calibration data set analysedhroughout this study. The nominal composition was active phar-
aceutical ingredient (API: 6.3%, w/w), microcrystalline celluloseMCC: 20.0%, w/w), lactose (lact: 71.5%, w/w), and the lubricants
agnesium stearate (0.75%, w/w) and talc (1.5%, w/w). From thisominal composition a calibration data set of 9 batches wasesigned by a D-optimal formulation design using Modde soft-are [39]. The design was constructed to vary the API and cellulose30% from their nominal values. The content of the lubricants mag-esium stearate and talc were fixed and lactose was adjusted toake a total of 100%. Table 2 shows the concentrations of the five
ompounds for each of the 9 calibration batches.The dry-blend formulations were all mixed in a drum-mixer
nd compressed into tablets of 175 mg by direct compression on6-punch station rotary tablet press. A flat punch-set was used tobtain a flat sample surface. The diameter of the tablets was 8 mmnd the thickness 2.6 mm. Batch sizes were 500 g and tablets wereollected from start, mid and end of the tabletting process. Pureompound reference samples of the API and the excipients werelso produced. Approximately 250 mg of each raw material wasompressed into 8 mm diameter wafers on a hydraulic tablet presssing 10 kN pressure for 10 s. The wafers were analysed similar tohe pharmaceutical tablets and used to generate pure compoundeference spectra.
.3. Data acquisition
To get a representative sampling from each batch two tabletsrom start, mid and end of the tabletting process were analysedrom each of the 9 calibration batches, i.e. a total of 54 samples (6ablets from each of 9 batches).
Each tablet was fixed onto a microscope slide using cyanoacry-ate glue and measured directly on the flat tablet surface. Samples
ere analysed on a NIR line mapping system (Spectrum Spot-ight 350 FT-NIR Microscope, PerkinElmer, UK) from which 16pectra were collected in each acquisition from a linear MCT detec-or array. An area of 2 mm× 2 mm were analysed using pixel size5 �m × 25 �m thus obtaining a total of 6400 spectra (= pixels) forach image. Each spectrum was the average of 8 scans from wave-ength region 7800–4000 cm−1 using a 16 cm−1 spectral resolution.
.3.1. Spectral correctionAs the spectral responses obtained from a NIR-CI measurement
ontain information from both the sample and the instrument its necessary to correct for the instrument response by using aackground reference. The raw data from the data acquisition ishus relative NIR diffuse reflectance data (R = Rsample/Rbackground)rganised in a 3D structure (hyperspectral data cube). The high-eflectance standard SpectralonTM (Labsphere, Inc., North Sutton,ew Hampshire) was used as background reference in this study.
The background corrected 3D image data files were importednto Matlab software [40]. All image data processing was performedsing in-house scripts together with PLS Toolbox [41].
.3.2. Conversion to absorbance
Prior to data analysis all raw reflectance data (R) wereransformed into absorbance (A) by the relation A = −log10 (1/R).ssuming the path length on average is constant for the NIR dif-
use reflectance mapping measurements of the sample, a linearelationship exists between absorbance and chemical compoundoncentration (Beer–Lambert law).
tt
2
t
iomedical Analysis 48 (2008) 554–561
.3.3. Unfold 3D hyperspectral data cubeHyperspectral image data can be analysed by both ordinary two-
ay and three-way methods but the two-way methods have beenound most suitable for this type of data [42]. In our study, ordinarywo-way multivariate methods are compared and to make hyper-pectral image data amenable for two-way methods it is necessaryo unfold the 3D hyperspectral data cube to a 2D matrix, in whichach row is a spectrum related to one of the pixels. Once all datacquisition and data processing has been performed the resultingD matrix is refolded to retain the pixel location of each spectrumnd generate the chemical image.
.4. Data processing
Prior to applying the actual data analysis method that generateshe chemical image the wavenumber range and spectral prepro-essing methods must be selected. These two steps are describedelow together with the specific settings used in this study.
.4.1. Variable selectionMultivariate methods often excel above univariate methods
ecause of their ability to use the entire measured wavenumberange. Nevertheless, the precision of a multivariate method can,n some cases, be improved by a proper variable selection. In thistudy, variable selection by variable importance in the projectionVIP) [43,44] was used to select the optimal wavenumber range(s)or the PLS1 model. For CLS the noisy wavenumber ends wereemoved and the spectral range was reduced to 7500–4200 cm−1.or the single wavenumber method the wavenumber was selectedt positions with a distinct spectral absorption band having lit-le spectral overlap from the other compounds. This was assessedisually.
.4.2. Spectral preprocessingThe raw NIR diffuse reflectance spectra obtained from a NIR-CI
easurement contain both chemical and non-chemical informa-ion about the solid sample [45]. The source of the non-chemicalnformation may be from the sample (e.g. uneven sample surfacer differences in sample density) and/or the instrumentation (e.g.hanges in lamp intensity or detector response). The effects areypically observed as spectral baseline offsets or a sloping baseline.
As it is the chemical information that is of interest the non-hemical biases are sought and removed by different preprocessingechniques. These preprocessing techniques are routinely used inonventional NIR spectroscopy and their effects on hyperspectralIR images have also been investigated [21,27]. The most commonreprocessing approaches used in NIR-CI experiments on pharma-eutical solid dosage forms are first and second Savitzky–Golayerivative transformation [46], standard normale variate (SNV)47], multiplicative scatter correction (MSC) [48] or a combinationereof.
In this study a calibration data set was available. It was thusossible to perform regression analysis by all three calibrationpproaches trying different preprocessing treatments and choosinghe preprocessing giving best results. Using this approach the twoest preprocessing methods found for each data processing methodere selected and used for comparison throughout this study.
avitzky–Golay derivative transform implies choosing derivativerder, filter width and polynomial order. For example a first deriva-ive transform with a nine-point filter width and polynomial order
hree is denoted here as “first (or 1st) derivative (9/3)”..4.3. Calibration methodsAt this stage of the overall NIR-CI analysis the spectral data are
ranslated into concentrations producing the NIR chemical images.
C. Ravn et al. / Journal of Pharmaceutical and Biomedical Analysis 48 (2008) 554–561 557
Table 2Composition (% w/w) of the five-compound pharmaceutical tablet formulations constituting the 9 calibration batches
Ingredients (particle size*) 1 2 3 4 5 6 7 8 9
API (2.4/11/129) 4.38 8.14 4.38 8.14 4.38 8.14 6.26 6.26 6.26Cellulose (43/121/272) 14.00 14.00 26.00 26.00 20.00 20.00 14.00 26.00 20.00Lactose (13/62/152) 79.37 75.61 67.37 63.61 73.37 69.61 77.49 65.49 71.49MT
the 10M
Scdt
mtiw
cmicdCm
tAcdots
2meviiaasspwhot
fdptg
2sahmtois
csattchv
bbotm
2mia
TC
C
S
C
P
agnesium stearate (1.7/4.7/19) 0.75 0.75 0.75alc (3.5/13/44) 1.50 1.50 1.50
* Particle size measures (�m) of the cumulative volume distribution given byastersizer 2000 laser diffraction system.
imilar to preprocessing treatments there do not exist any standardalibration method that is superior for analysing all hyperspectralata cubes. The choice of calibration method will depend on theype of data set and the purpose of analysis.
The goal of this study was to compare the ability of three com-on calibration methods to generate accurate chemical images of
he major ingredients in a solid dosage form. Hyperspectral NIRmage data from 54 tablets (6 tablets from 9 calibration batches)
ere analysed by a single wavenumber method, CLS and PLS1.The nine predicted concentrations (mean of 6 replicates) were
alculated for API, cellulose and lactose for each of the threeethods. The method that generated the most accurate chemical
mages was evaluated by the accuracy of prediction of the overalloncentration in the image, which was assessed by the model pre-iction error (root mean square error of cross-validation; RMSECV).haracteristics of the three common calibration methods are sum-arized in Table 3.All commonly used calibration approaches share the feature that
hey do not actively exploit the spatial information in the images.lternatives that do exploit this are available [49] but they are notommonly used and are hence not included in this work. A generalescription of the principles for each of the three calibration meth-ds used to analyse hyperspectral NIR images follows together withhe specific settings used for each data processing method in thistudy.
.4.3.1. Single wavenumber method. The single wavenumberethod is a univariate approach and the chemical images gen-
rated from this method are based on the absorbance intensityalues in each pixel at one specific wavenumber. To obtain anmage with chemical information for a specific compound it ismportant to select a wavenumber with a strong and distinctbsorption band for that particular compound, i.e. with as littlebsorption interference as possible from the other compound’spectra in the sample. The most distinct absorption band is bestelected from the pure compounds NIR spectra if available and
referably from a derivative form of the spectra as this transformill enhance the spectral resolution of overlapping bands andighlight subtle spectral peaks. Second derivatives spectra areften preferred as the absorption peaks from this preprocessingechnique appear at the same position as for the original peaks.tclbp
able 3omparison of the three calibration methods used to analyse the hyperspectral NIR data c
alibration method Samples required for method
ingle wavenumber (univariate) NIR spectra of pure compounds (todistinct absorption peaks)
LS (multivariate—supervised) NIR spectra of pure compounds
LS (multivariate—supervised) Calibration data set of known comp
0.75 0.75 0.75 0.75 0.75 0.751.50 1.50 1.50 1.50 1.50 1.50
%, 50% and 90% percentiles (D[v,0.1]/D[v,0.5]/D[v,0.9]) obtained using a Malvern
In this study, pure compound spectra normalised using SNVollowed by second derivative (9/3) were used to select the mostistinct absorption band for each of the three analysed com-ounds in the tablets. This preprocessing method was selectedogether with a second derivative (15/3) preprocessing for the sin-le wavenumber regression analyses.
.4.3.2. Classical least squares (CLS). The multivariate classical leastquares (CLS) algorithm is often used in simpler spectroscopicpplications and also appears to be an obvious choice for analysingyperspectral images such as those in this paper [35]. The CLSodel is based on the assumption that the measured spectra are
he sum of pure compound spectra weighted by the concentrationf the compounds. The relative concentrations of the compoundsn the sample can thus be estimated using only the pure compoundpectra according to Beer–Lambert’s law.
In our study, the pure compound spectrum for each of the fiveonstituents was calculated as the mean spectrum of the hyper-pectral data cube for each pure compound reference sample. Usingll five pure compound spectra and the image cube mean spec-rum of a sample the relative concentrations of the compounds inhe sample matrix were estimated by the CLS model. To generate ahemical image for each compound in a sample, all spectra from theyperspectral data cube were used to estimate the concentrationalues for each compound in each pixel.
The wavenumber range used for CLS in our study was selectedy removing the noisy end channels thus reducing the wavenum-er range to 7500–4200 cm−1. The lowest prediction error wasbtained using either the first derivative (9/3) or the second deriva-ive (9/3) preprocessing of spectra and these two preprocessing
ethods were therefore selected for comparison.
.4.3.3. Partial least squares (PLS1). PLS is a multivariate regressionethod used to build quantitative calibration models [35,50]. It
s a regression method that relates two data matrices, X (spectra)nd Y (reference values), with each other. PLS requires a calibra-
ion data set composed of several samples spanning an appropriateoncentration range to build a model for new predictions. This mayimit the use of the PLS method as calibration data sets can oftene difficult to obtain, for example, in the early development of aharmaceutical formulation.ubes in this study
Characteristics of method and preferred use
identify Qualitative use. Easy, seemingly intuitive and fast.Exploratory analysis, valid for simple sample matrices.Distinct spectral band for compounds required.
Quantitative use.Relatively accurate, fast and easy.Requires only pure compound spectra. Assumes Beer’s law valid.
ositions Quantitative use.Accurate, robust predictive precision.Requires full calibration data set.

558 C. Ravn et al. / Journal of Pharmaceutical and Biomedical Analysis 48 (2008) 554–561
Table 4Results from concentration predictions of API, cellulose and lactose for the single wavenumber method, CLS and PLS1
F mentso
iicp(ic
mslftwmabav
(af
3
3s
psleb
Fs
or each calibration method results are presented for the two preprocessing treatbtained.
When a new hyperspectral data cube of a sample with identicalngredients but unknown concentrations is applied to a PLS modelt will convert the spectral information of each pixel into predictedoncentrations. The generated PLS prediction image of each com-ound therefore shows the predicted concentration in each pixel= chemical image). The predicted compound concentration of themaged sample is calculated by the mean value of all predicted pixeloncentrations.
In our study, PLS1 models were developed for each of the threeajor compounds API, cellulose and lactose. The image cube mean
pectrum for each of the 54 calibration samples was first calcu-ated followed by computing the mean spectrum of the 6 replicatesor each of the 9 calibration batches. The resulting 9 mean spec-ra formed the data matrix X. The reference values in the Y matrixere the 9 theoretical concentrations (% w/w) for each of the three
ajor constituents given in Table 2. Each PLS1 model was developednd optimised regarding number of PLS components, wavenum-er range(s) and preprocessing methods evaluated from regressionnalysis. Cross-validation was performed by leave-one-out cross-alidation. The chosen preprocessing methods were first derivative
ttbst
ig. 1. Pure compound reference spectra of the three major compounds constituting theecond derivative (9/3) (right). The arrows point out the wavenumbers used for the single
showing best predictions. The grey-shaded area points out the best predictions
9/3) and second derivative (9/3) both followed by mean centeringnd the wavenumber ranges optimised for each model can be readrom Table 4.
. Results and discussion
.1. Pure compound spectra and mean spectra of calibrationamples
The normalised (SNV) NIR absorbance spectra of the pure com-onents API, cellulose and lactose were first examined to selectpecific wavenumbers for the single wavenumber analysis (Fig. 1,eft). A distinct, sharp absorption band for API at 5984 cm−1 wasasily identified. It was more difficult to identify distinct absorptionands for cellulose and lactose. They both showed broad absorp-
ion bands and were difficult to distinguish from each other dueo their similar spectral pattern caused by their chemical resem-lance. The second derivative (9/3) of the NIR normalised (SNV)pectra were therefore generated (Fig. 1, right). A distinct absorp-ion band for lactose at 5168 cm−1 was now resolved but it was stillcalibration batches. Spectra are preprocessed by SNV (left) and SNV followed bywavenumber analysis.
C. Ravn et al. / Journal of Pharmaceutical and B
Fn
dscao
Fhc
3
e(ra
(tspnAp
gmactsT
tf(hcmd
lPlFc
((bs
3
apaatbCtc
s
Fg
ig. 2. Image cube mean spectra of the 9 calibration batches normalised by standardormal variate (SNV).
ifficult to find a characteristic band for cellulose. Enlargement ofpectral regions finally identified wavenumber at 4280 cm−1 forellulose single wavenumber analysis although it was not as clearnd well resolved as for the two other compounds and selection ofther wavenumbers could be argued.
The CLS method used the pure compound spectra shown inig. 1 together with those of the two minor ingredients (not shownere). The PLS1 method used the mean spectra from each of the 9alibration samples as matrix X (Fig. 2).
.2. Prediction of concentrations
The concentration predictions of API, cellulose and lactosevaluated by correlation coefficient, slope and prediction errorRMSECV) are shown in Table 4. In general, reasonable predictionesults (low RMSECV values) were obtained by all three methodsnd for each of the two preprocessing methods examined.
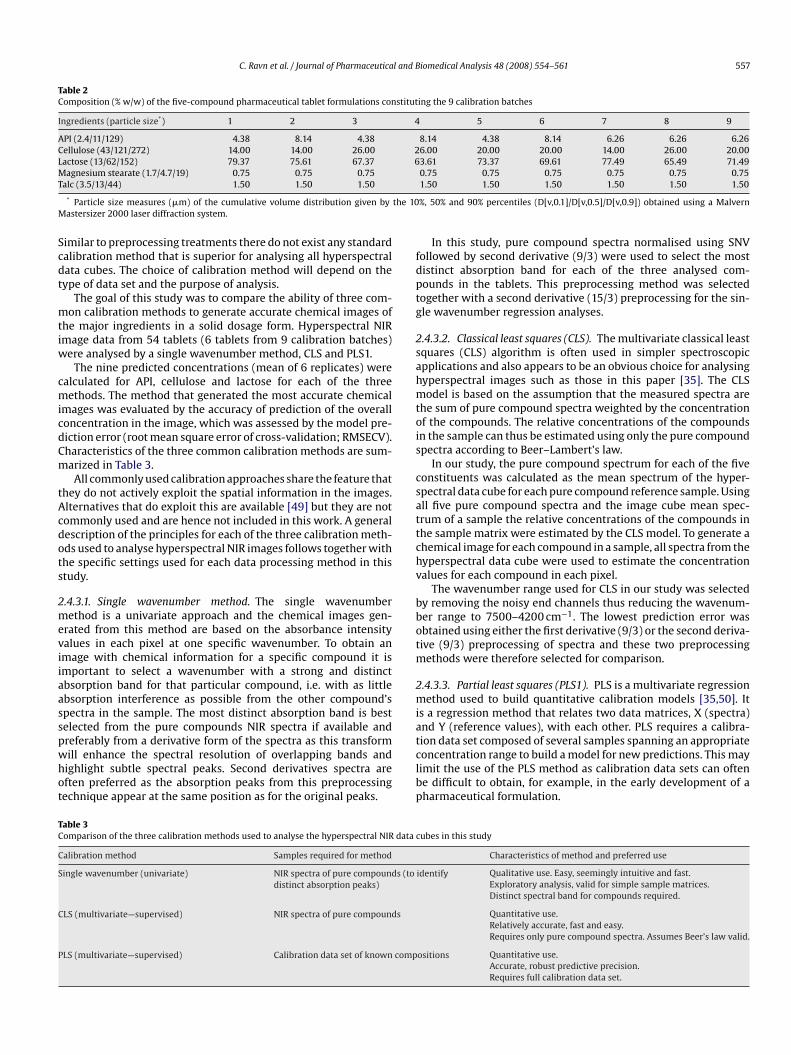
For all three calibration methods the predictions of APIRMSECV: 0.18–0.54%) were more accurate compared to predic-ions of the two excipients (RMSECV: 0.62–3.38%). This is not
urprising as the API component showed a very distinct absorptioneak with no large spectral interference from the other compo-ents in the pharmaceutical tablet (Fig. 1). The predictions ofPI for all three methods with the preprocessing giving the bestredictions are shown in Fig. 3.eba
t
ig. 3. Linear regression results of API concentration for single wavenumber method (leftiving the best regression and concentration predictions.
iomedical Analysis 48 (2008) 554–561 559
Excipient predictions were less accurate for API and with aenerally poorer prediction of lactose compared to cellulose. Thisay be surprising as lactose had a more resolved and characteristic
bsorption peak than could be found for cellulose. The differenceould probably be explained by the more narrow lactose concen-ration range between the different calibration batches (9 levels inteps of ∼ 2%) compared to cellulose (3 levels in steps of 30%, cf.able 2).
PLS1 was the superior regression method to predict concentra-ions for all three compounds. The best predictions were obtainedor PLS1 using first derivative (9/3) followed by mean centeringTable 4, shaded area). For this PLS1 model API prediction wasighly accurate with low prediction error (RMSECV = 0.18%) andorrelation 0.99. The API prediction for the two other calibrationethods showed less accurate but still reliable results with CLS pre-
ictions being slightly better than the single wavenumber method.The better concentration predictions of cellulose compared to
actose were observed for CLS and single wavenumber but not forLS1. The PLS1 predictions of the two major excipients were simi-ar and quite accurate with RMSECV < 0.88% and correlation > 0.97.or CLS and single wavenumber the prediction error values andorrelations followed API < cellulose < lactose.
For the PLS1 models the results illustrate that first derivative9/3) preprocessing gave better prediction than second derivative9/3) preprocessing both followed by mean centering. This may onlye the case for this data set and it should also be noted that the re-ults were only slightly better for the first derivative preprocessing.
.3. Chemical images
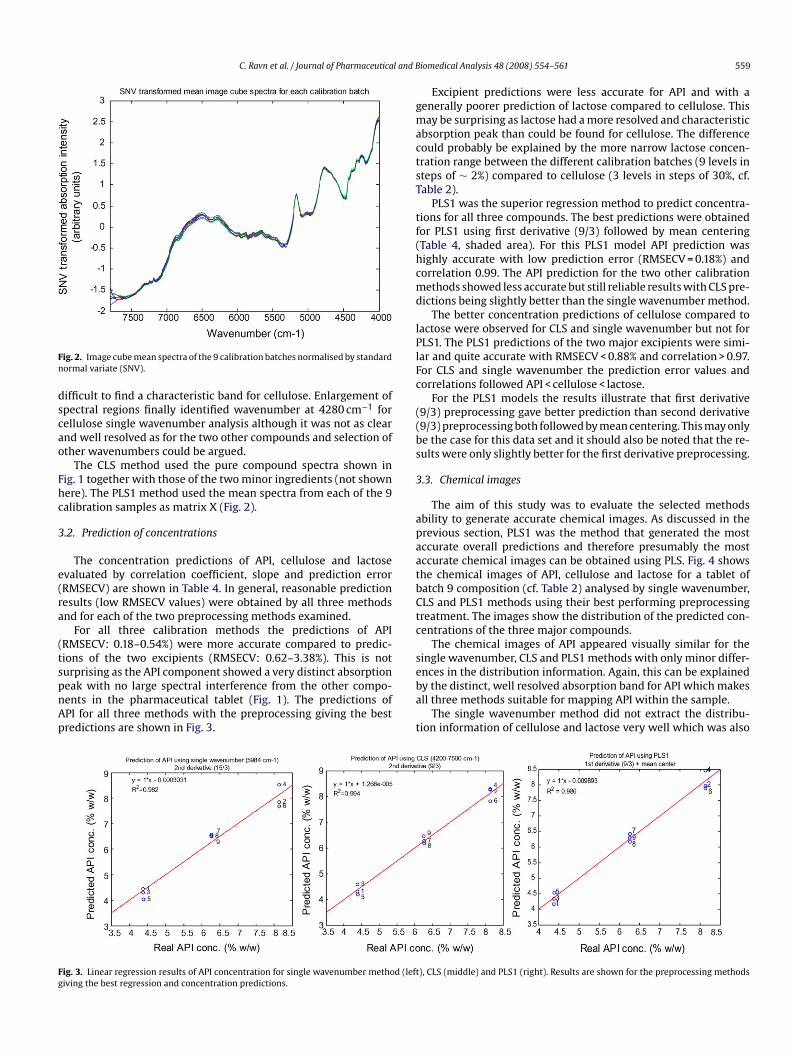
The aim of this study was to evaluate the selected methodsbility to generate accurate chemical images. As discussed in therevious section, PLS1 was the method that generated the mostccurate overall predictions and therefore presumably the mostccurate chemical images can be obtained using PLS. Fig. 4 showshe chemical images of API, cellulose and lactose for a tablet ofatch 9 composition (cf. Table 2) analysed by single wavenumber,LS and PLS1 methods using their best performing preprocessingreatment. The images show the distribution of the predicted con-entrations of the three major compounds.
The chemical images of API appeared visually similar for theingle wavenumber, CLS and PLS1 methods with only minor differ-
nces in the distribution information. Again, this can be explainedy the distinct, well resolved absorption band for API which makesll three methods suitable for mapping API within the sample.The single wavenumber method did not extract the distribu-ion information of cellulose and lactose very well which was also
), CLS (middle) and PLS1 (right). Results are shown for the preprocessing methods
560 C. Ravn et al. / Journal of Pharmaceutical and Biomedical Analysis 48 (2008) 554–561
Fig. 4. Chemical images of a tablet of batch 9 composition (cf. Table 2) generated from data processing using single wavenumber, CLS or PLS1. The chemical images showt ctionc r intet
rpwibtbnuoh
iafi
dadgTurae
he distribution of the three major compounds API, cellulose and lactose. The prediolor intensities relates to high/low concentration of the component of interest. (Fohe web version of the article.)
eflected in the higher RMSECV values. CLS and PLS1 provided com-arable visual distribution information of cellulose and lactose butith differences in the image contrast. The highest contrast for the
mages of cellulose was obtained by CLS whereas for lactose it wasy PLS1. In both instances the best concentration prediction, andhus presumably the most accurate chemical image, was obtainedy PLS1. The observation that the best concentration predictionot necessarily produces images with the highest contrast is notnusual (and could, for example, also be shown for images by thether preprocessing methods used in this study but not presented
ere).This also delineates one of the limitations of NIR chemical imag-ng. No tablet calibration standard exists for NIR chemical imagingnd it is therefore not possible to set any objective criteria or con-rm what the ‘correct’ chemical image is. Only with a calibration
4
oi
errors (RMSECV) from Table 4 are shown beneath each image. High/low (red/blue)rpretation of the references to colour in this figure legend, the reader is referred to
ata set available is it possible to statistically evaluate the mostccurate generated images as performed in this study. A calibrationata set is a prerequisite and always available for PLS but not for theeneral use of the single wavenumber method and CLS (cf. Table 3).his is both the advantage and disadvantage of PLS. Data processingsing PLS may generate the most accurate chemical images but itequires a calibration data set which is time consuming to producend often not available (e.g. for a single trouble-shooting case or inarly formulation development).
. Conclusion
This study emphasizes the importance of data processing as partf a successful near-infrared chemical imaging analysis. Compar-ng a single wavenumber method, CLS and PLS1 by their ability to
l and B
pcaasic
aBaseapsCsPtitiHwa
tTwott
cph
idtctsigshffofpsn
R
[
[[
[[[[[[
[[[[
[[
[
[
[[
[
[
[
[
[[
[
[[
[
[[[[
[
[[
C. Ravn et al. / Journal of Pharmaceutica
redict API and excipient concentrations from hyperspectral dataubes of pharmaceutical solid dosage forms, PLS1 proved mostccurate. This means that PLS1 can be assumed to provide the mostccurate chemical images when using the model on single-pixelpectra. PLS1 is therefore also the preferred method when furthermage processing to extract process-related information from thehemical images is needed.
All three calibration approaches were found applicable fornalysing hyperspectral data cubes and generate chemical images.ut their use depends on the purpose of analysis, type of data setnd the accuracy of the generated chemical images required. Theingle wavenumber method should primarily be used for initialxploration of compound distribution in a sample and it requiresdistinct NIR absorption band for the compound of interest. CLSroved to be an excellent alternative to PLS1 generating onlylightly less accurate concentration predictions. An advantage ofLS is that it is relatively fast as it only requires pure compoundpectra of the sample constituents to perform the data processing.LS1 is the method of choice when accurate concentration predic-ions are required but the disadvantage is that a calibration data sets needed which in many cases may not be available. Other calibra-ion approaches to analyse hyperspectral image data cubes thannvestigated in this study may also be used with similar success.owever, the three common calibration approaches presented hereill cover a wide range of possible pharmaceutical samples and
pplications.The wavenumber and preprocessing selections were also found
o be an important part of data processing hyperspectral images.his study indicated the importance of a careful selection of bothavenumber range(s) and preprocessing treatment in order tobtain the most accurate results but a more thorough investiga-ion of the issue is needed to fully understand the impact of thesewo factors.
The general principles of each calibration approach and the typi-al steps involved in a NIR-CI analysis is described in this work. Thisaper may therefore be used as practical guidance for analysingyperspectral image data of pharmaceutical solid dosage forms.
This study demonstrates the usefulness of NIR chemical imag-ng when spatial distribution information of compounds in a solidosage form is needed. But the message is also that care should beaken not to over-interpret the chemical images. Chemical imagesan be obtained by several different data processing methods buthe obtained accuracy might be quite different as shown in thistudy. One should not be misled by images with high contrast as its not high contrast but the right, i.e. accurate, contrast that is theoal. And the right contrast or accuracy of the chemical images cano far only be evaluated using a calibration data set as demonstratedere. Generating accurate chemical images is of high importance
or the subsequent image processing analyses used to extract use-ul information and, for example, numerically describe the qualityf the images. Different pharmaceutical conclusions may be drawnrom chemical images of the same sample analysed by differentrocessing methods having different accuracies as shown in thistudy. Developing image processing tools is not simple but is highlyeeded to further develop the technology of NIR chemical imaging.
eferences
[1] M. Blanco, J. Coello, H. Iturriage, S. Maspoch, C. de la Pezuela, Analyst 123 (1998)135R–150R.
[[[[[
iomedical Analysis 48 (2008) 554–561 561
[2] E.W. Ciurczak, J.K. Drennen III (Eds.), Pharmaceutical and Medical Applicationsof Near-Infrared Spectroscopy, Marcel Dekker Inc., New York, 2002.
[3] G. Reich, Adv. Drug Deliv. Rev. 57 (2005) 1109–1143.[4] E. Räsanen, N. Sandler, J. Pharm. Pharmacol. 59 (2007) 147–155.[5] Y. Roggo, P. Chalus, L. Maurer, C.L. Martinez, A. Edmond, N. Jent, J. Pharm.
Biomed. Anal. 44 (2007) 683–7000.[6] U.S. Food and Drug Administration (FDA), Guidance for Industry, PAT – A Frame-
work for Innovative Pharmaceutical Development, Manufacturing, and QualityAssurance, FDA (CDER), 2004 (http://www.fda.gov/cder/OPS/PAT.htm).
[7] R.C. Lyon, D.S. Lester, E.N. Lewis, E. Lee, L.X. Yu, E.H. Jefferson, A.S. Hussain, AAPSPharm.Sci.Tech. 3 (2002) 1–15.
[8] R.C. Lyon, E.H. Jefferson, C.D. Ellison, L.F. Buhse, J.A. Spencer, M.M. Nasr, A.S.Hussain, Am. Pharm. Rev. 6 (2003) 62–70.
[9] B.J. Westenberger, C.D. Ellison, A.S. Fussner, S. Jenney, R.E. Kolinski, T.G. Lipe,R.C. Lyon, T.W. Moore, L.K. Revelle, A.P. Smith, J.A. Spencer, K.D. Story, D.Y. Toler,A.M. Wokovich, L.F. Buhse, Int. J. Pharm. 306 (2005) 56–70.
10] M.L. Hamad, C.D. Ellison, M.A. Khan, R.C. Lyon, J. Pharm. Sci. 96 (2007)3390–3401.
11] S.V. Hammond, Eur. Pharm. Rev. 3 (1998) 47–51.12] A.S. El-Hagrasy, H.R. Morris, F. D’Amico, R.A. Lodder, J.K. Drennen III, J. Pharm.
Sci. 90 (2001) 1298–1307.13] E.N. Lewis, J.E. Carroll, F. Clarke, NIR News 12 (2001) 16–18.14] F.W. Koehler, E. Lee, L.H. Kidder, E.N. Lewis, Spectrosc. Eur. 14 (2002) 12–19.15] F. Clarke, S. Hammond, Eur. Pharm. Rev. 8 (2003) 41–50.16] E.N. Lewis, J. Schoppelrei, E. Lee, Spectroscopy 19 (2004) 26–36.17] E.N. Lewis, E. Lee, L.H. Kidder, Microsc. Today (2004) 8–12.18] F.C. Clarke, S.V. Hammond, R.D. Jee, A.C. Moffat, Appl. Spectrosc. 56 (2002)
1475–1483.19] F. Clarke, Vib. Spectrosc. 34 (2004) 25–35.20] F. LaPlant, Am. Pharm. Rev. 7 (2004) 16–24.21] J. Burger, P. Geladi, J. Near Infrared Spectrosc. 15 (2007) 29–37.22] S.J. Hudak, K. Haber, G. Sando, L.H. Kidder, E.N. Lewis, NIR News 18 (2007)
6–8.23] H. Ma, C.A. Anderson, J. Near Infrared Spectrosc. 15 (2007) 137–151.24] E.N. Lewis, J. Schoppelrei, E. Lee, L.H. Kidder, in: K.A. Bakeev (Ed.), Process
Analytical Technology, Blackwell Publishing Ltd, Oxford, 2005, pp. 187–225.25] E. Lee, W.X. Huang, P. Chen, E.N. Lewis, V. Vivilecchia, Spectroscopy 21 (2006)
24–32.26] N. Jovanovic, A. Gerich, A. Bouchard, W. Jiskoot, Pharm. Res. 23 (2006)
2002–2013.27] C. Gendrin, Y. Roggo, C. Collet, Talanta 73 (2007) 733–741.28] E.N. Lewis, J. Dubois, L.H. Kidder, K.S. Haber, in: H.F. Grahn, P. Geladi (Eds.),
Techniques and Applications of Hyperspectral Image Analysis, John Wiley &Sons Ltd, 2007, pp. 335–361.
29] T. Furukawa, H. Sato, H. Shinzawa, I. Noda, S. Ochiai, Anal. Sci. 23 (2007)871–876.
30] C. Gendrin, Y. Roggo, C. Spiegel, C. Collet, Eur. J. Pharm. Biopharm. 68 (2008)828–837.
31] L.R. Hilden, C.J. Pommier, S.I.F. Badawy, E.M. Friedman, Int. J. Pharm. 353 (2008)283–290.
32] L. Weiyong, A. Woldu, R. Kelly, J. McCool, R. Bruce, H. Rasmussen, J. Cunningham,D. Winstead, Int. J. Pharm. 350 (2008) 369–373.
33] H. Ma, C.A. Anderson, J. Pharm. Sci. 97 (2008) 3305–3320.34] A.A. Gowen, C.P. O’Donnell, P.J. Cullen, S.E.J. Bell, Eur. J. Pharm. Biopharm. 69
(2008) 10–22.35] H. Martens, T. Naes, Multivariate Calibration, John Wiley & Sons, Chichester,
1989.36] S. Sasic, Appl. Spectrosc. 61 (2007) 239–250.37] Y. Roggo, N. Jent, A. Edmond, P. Chalus, M. Ulmschneider, Eur. J. Pharm. Bio-
pharm. 61 (2005) 100–110.38] Y. Roggo, A. Edmond, P. Chalus, M. Ulmschneider, Anal. Chim. Acta 535 (2005)
79–87.39] Modde software version 8.0, Umetrics (www.umetrics.com).40] Mathworks Inc., Matlab version 7.2.0 R2006a (www.mathworks.com).41] Eigenvector Research Inc., PLS Toolbox version 4.1.1 (www.eigenvector.com).42] J. Huang, H. Wium, K.B. Qvist, K.H. Esbensen, Chemom. Intell. Lab. Syst. 66
(2003) 141–158.43] S. Wold, E. Johansson, M. Cocchi, in: H. Kubinyi (Ed.), 3D-QSAR in Drug Design,
Theory, Methods and Applications, Escom Science Publishers, Leiden, 1993, pp.523–550.
44] I.-G. Chong, C.-H. Jun, Chemom. Intell. Lab. Syst. 78 (2005) 103–112.45] M.W. Borer, X. Zhou, D.M. Hays, J.D. Hofer, K.C. White, J. Pharm. Biomed. Anal.
17 (1998) 641–650.46] A. Savitzky, M.J.E. Golay, Anal. Chem. 36 (1964) 1627–1639.47] R.J. Barnes, M.S. Dhanoa, S. Lister, Appl. Spectrosc. 43 (1989) 772–777.48] P. Geladi, D. MacDougall, H. Martens, Appl. Spectrosc. 39 (1985) 491–500.49] R. Larsen, J. Chemom. 16 (2002) 427–435.50] S. Wold, M. Sjöström, L. Eriksson, Chem. Intell. Lab. Syst. 58 (2001) 109–130.