ning chai and robert p. lucht purdue university, west lafayette, indiana 47907 sukesh roy
DESCRIPTION
Electronic-Resonance-Enhanced Coherent Anti-Stokes Raman Scattering of Nitric Oxide: Non-Perturbative Time-Dependent Modeling. Ning Chai and Robert P. Lucht Purdue University, West Lafayette, Indiana 47907 Sukesh Roy Spectral Energies, LLC, 2513 Pierce Avenue, Ames, IA 50010 James R. Gord - PowerPoint PPT PresentationTRANSCRIPT

APPLIED LASER SPECTROSCOPY LABORATORYSCHOOL OF MECHANICAL ENGINEERING
Electronic-Resonance-Enhanced Coherent Anti-Stokes Raman Scattering of Nitric
Oxide: Non-Perturbative Time-Dependent Modeling
Electronic-Resonance-Enhanced Coherent Anti-Stokes Raman Scattering of Nitric
Oxide: Non-Perturbative Time-Dependent Modeling
Ning Chai and Robert P. Lucht Purdue University, West Lafayette, Indiana 47907
Sukesh RoySpectral Energies, LLC, 2513 Pierce Avenue, Ames, IA 50010
James R. GordAir Force Research Laboratory, Propulsion Directorate, Wright-
Patterson AFB, Ohio 45433
AIAA Aerospace Sciences Meeting Orlando, FL January 7, 2010
APPLIED LASER SPECTROSCOPY LABORATORYSCHOOL OF MECHANICAL ENGINEERING
AcknowledgmentsAcknowledgments
Funding for this research was provided by the Air Force Office of Scientific Research under Contract No. FA9550-05-C-0096 (Dr. Julian Tishkoff, Program Manager) and by
the Air Force Research Laboratory,Propulsion Directorate, Wright-Patterson Air Force Base,
under Contract No. F33615-03-D-2329, and by the U.S. Department of Energy, Division of Chemical Sciences,
Geosciences and Biosciences, under Grant No. DE-FG02-03ER15391.
APPLIED LASER SPECTROSCOPY LABORATORYSCHOOL OF MECHANICAL ENGINEERING
Outline of the Presentation Outline of the Presentation
• Introduction and Motivation
• Scanning Stokes ERE CARS
• Density Matrix Modeling: Saturation and Stark Shifting Effects
• Broadband Stokes Vibrational ERE CARS
• Density Matrix Modeling of Broadband Stokes Vibrational ERE CARS
• Conclusions and Future Work
APPLIED LASER SPECTROSCOPY LABORATORYSCHOOL OF MECHANICAL ENGINEERING
Introduction and MotivationIntroduction and Motivation
• Oxides of nitrogen (NOx) are important atmospheric pollutants their major source being emissions is from combustion during transportation and power generation. Most NOx is produced in the form of nitric oxide (NO).
• ERE CARS is a very promising method for detecting NO in high-pressure combustion systems, overcomes numerous issues associated with LIF detection (quenching, laser beam absorption, interfering species, soot interferences).
APPLIED LASER SPECTROSCOPY LABORATORYSCHOOL OF MECHANICAL ENGINEERING
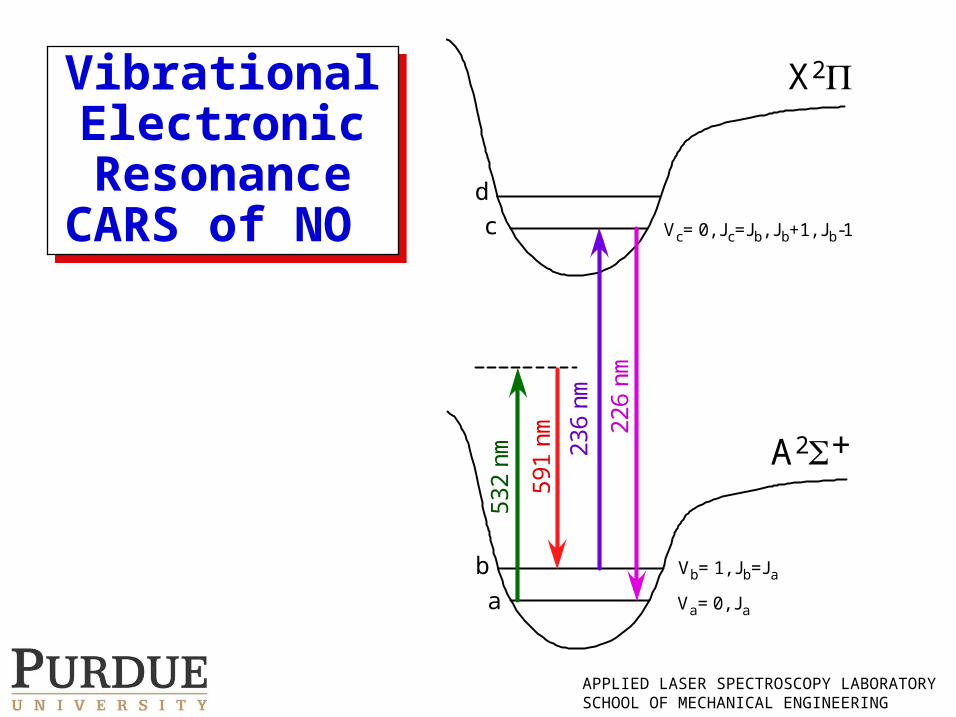
Vibrational Electronic Resonance
CARS of NO
Vibrational Electronic Resonance
CARS of NO
53
2n
m
59
1n
m
23
6n
m
22
6n
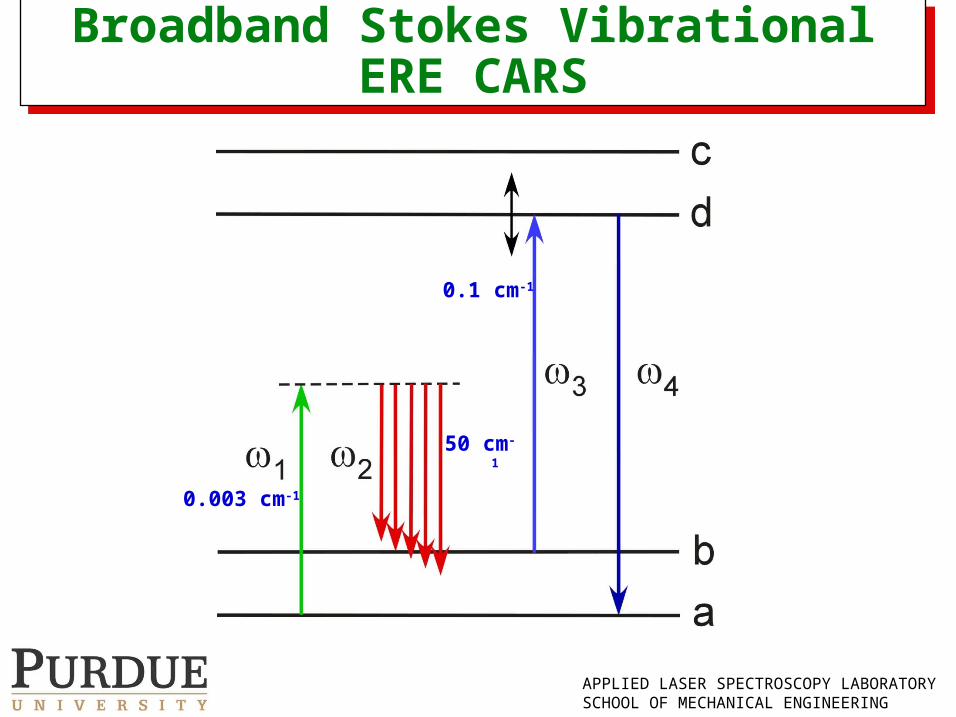
ma
b
c
d
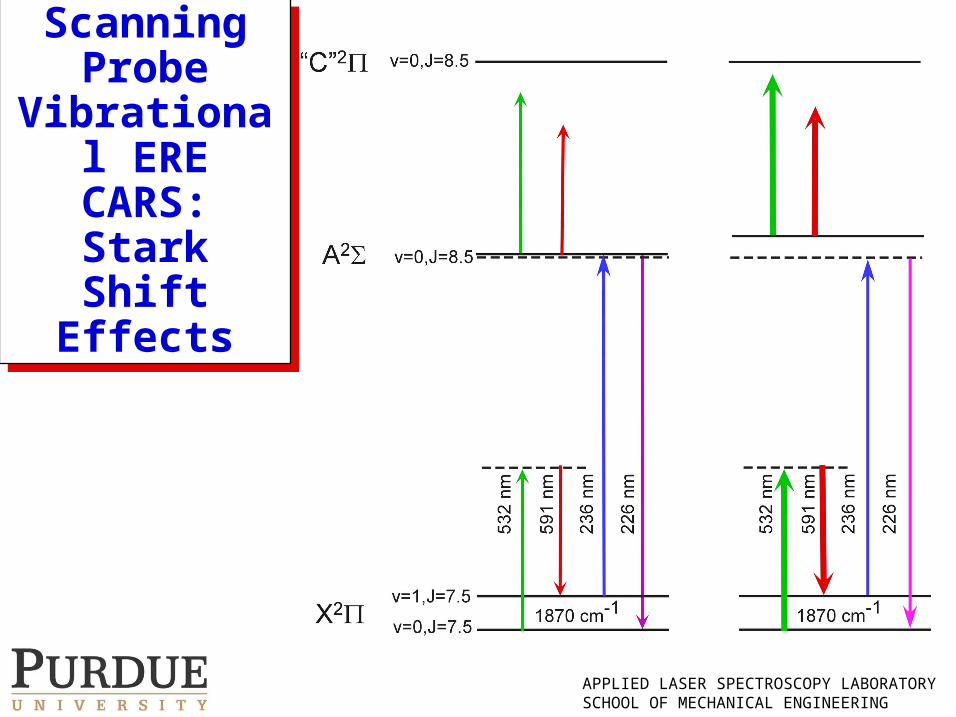
A2+
X2
Va= 0, Ja
Vb= 1, Jb=Ja
Vc= 0, Jc=Jb, Jb+1, Jb-1
APPLIED LASER SPECTROSCOPY LABORATORYSCHOOL OF MECHANICAL ENGINEERING
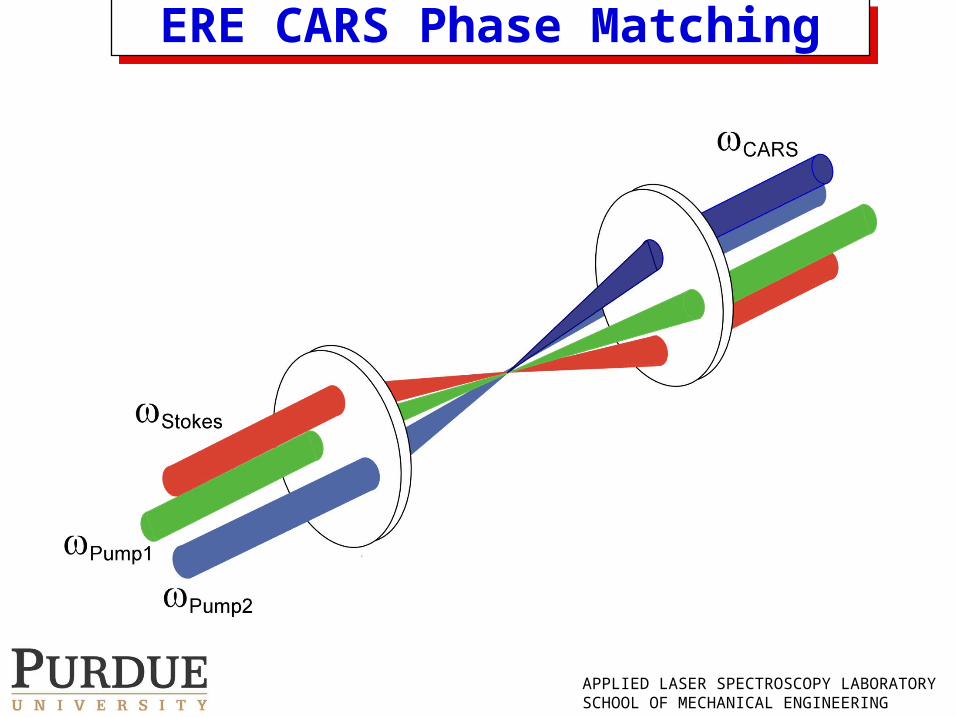
ERE CARS Phase MatchingERE CARS Phase Matching
APPLIED LASER SPECTROSCOPY LABORATORYSCHOOL OF MECHANICAL ENGINEERING
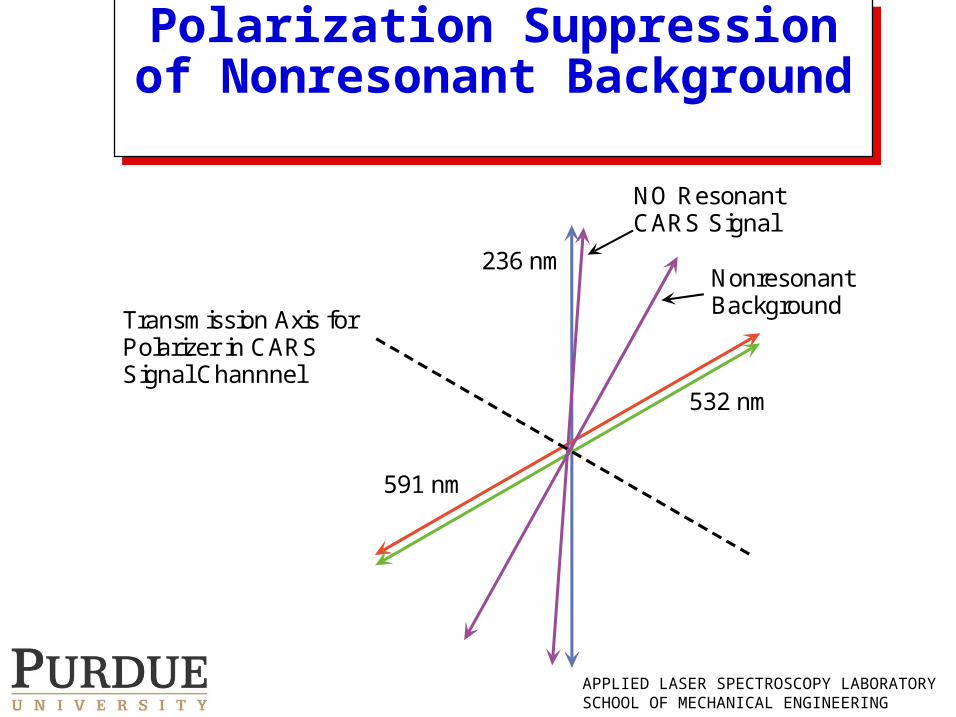
Polarization Suppression of Nonresonant Background
Polarization Suppression of Nonresonant Background
532 nm
591 nm
236 nmNonresonantBackground
NO ResonantCARS Signal
Transmission Axis forPolarizer in CARSSignal Channnel
APPLIED LASER SPECTROSCOPY LABORATORYSCHOOL OF MECHANICAL ENGINEERING
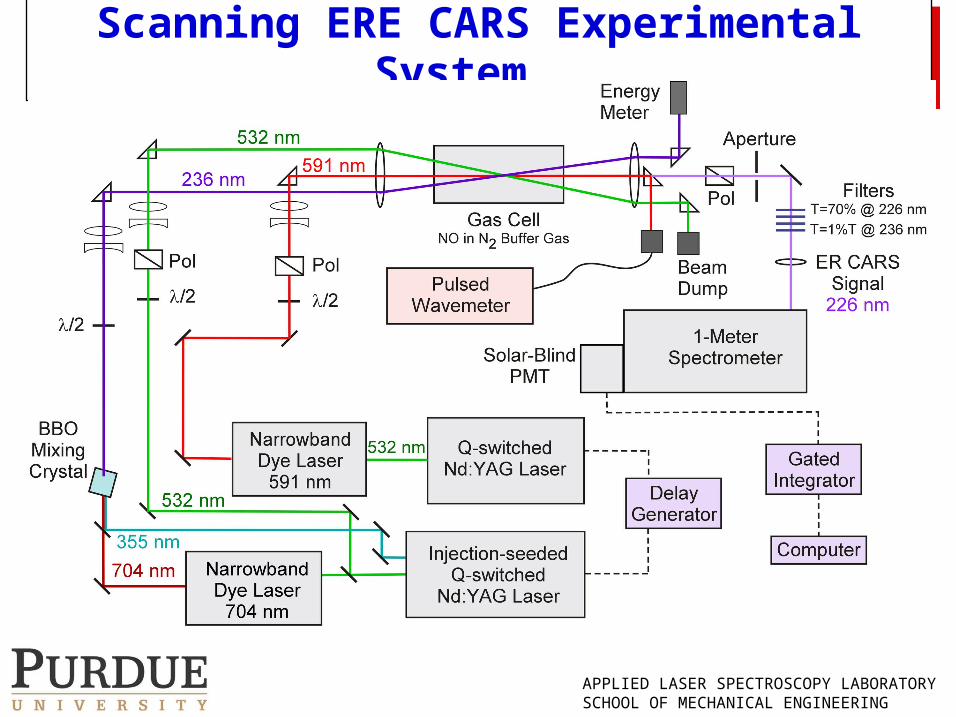
Scanning ERE CARS Experimental System Scanning ERE CARS Experimental System
APPLIED LASER SPECTROSCOPY LABORATORYSCHOOL OF MECHANICAL ENGINEERING
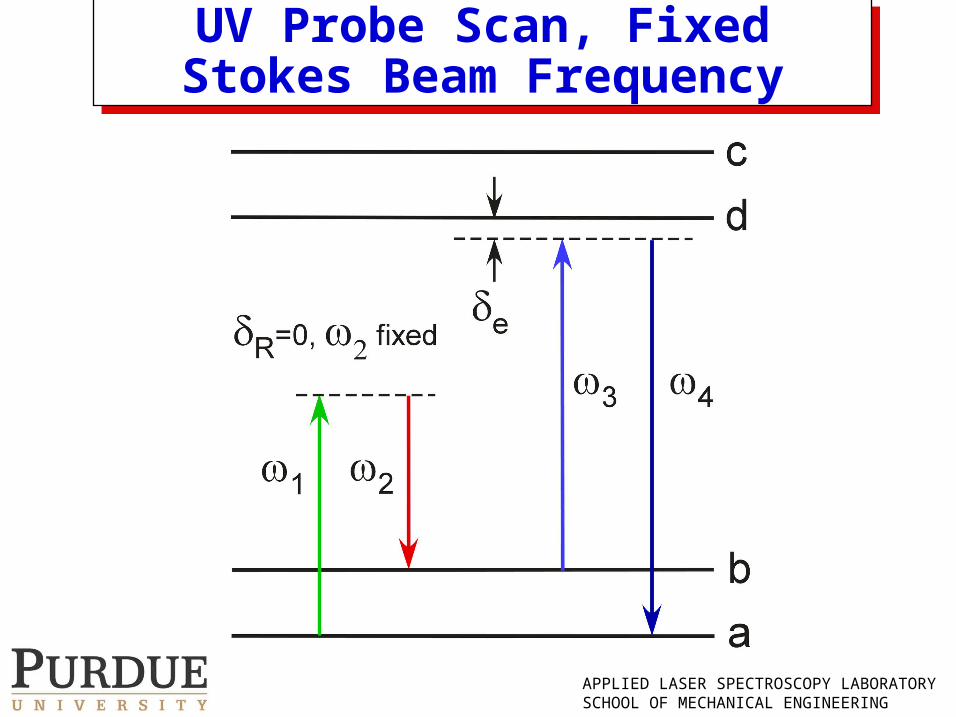
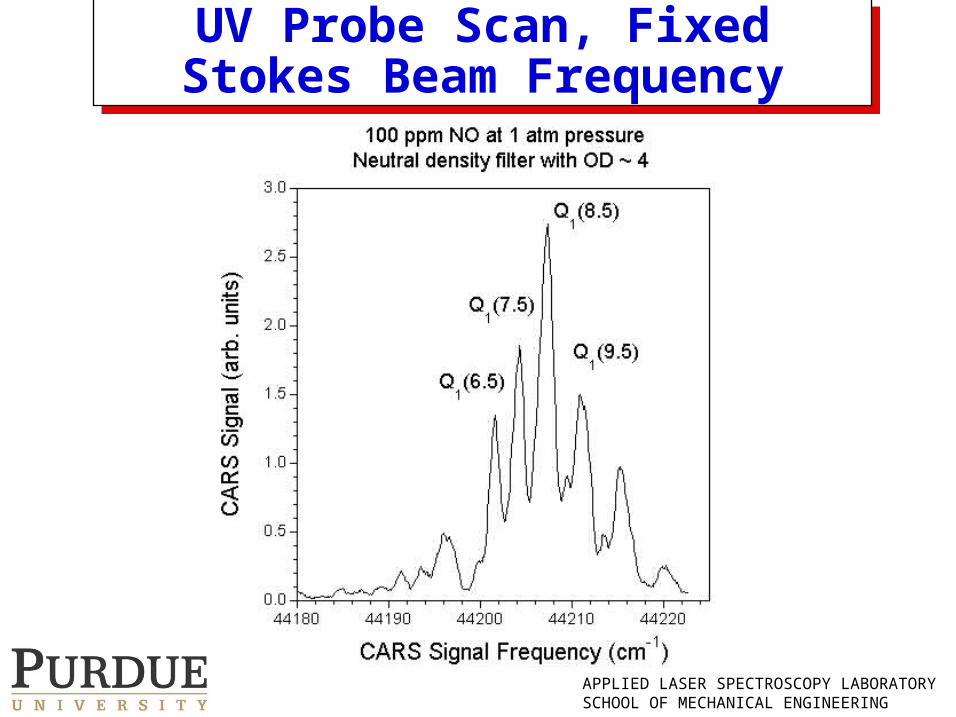
UV Probe Scan, Fixed Stokes Beam Frequency
UV Probe Scan, Fixed Stokes Beam Frequency
APPLIED LASER SPECTROSCOPY LABORATORYSCHOOL OF MECHANICAL ENGINEERING
UV Probe Scan, Fixed Stokes Beam Frequency
UV Probe Scan, Fixed Stokes Beam Frequency
APPLIED LASER SPECTROSCOPY LABORATORYSCHOOL OF MECHANICAL ENGINEERING
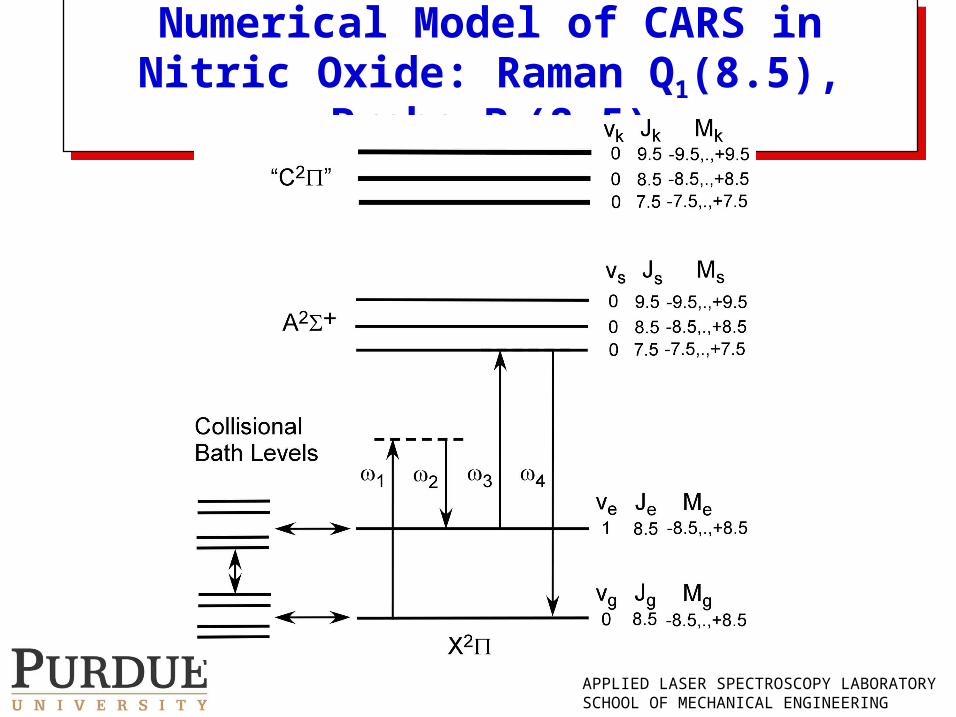
Numerical Model of CARS in Nitric Oxide: Raman Q1(8.5), Probe P1(8.5)
Numerical Model of CARS in Nitric Oxide: Raman Q1(8.5), Probe P1(8.5)

APPLIED LASER SPECTROSCOPY LABORATORYSCHOOL OF MECHANICAL ENGINEERING
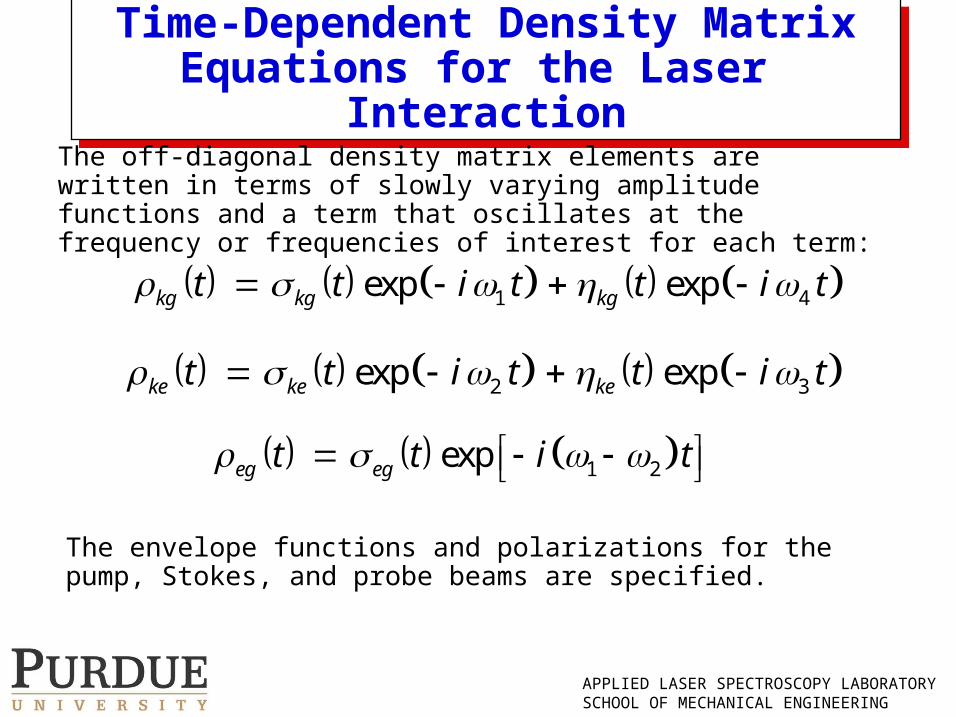
Time-Dependent Density Matrix Equations for the Laser Interaction
Time-Dependent Density Matrix Equations for the Laser Interaction
Rate of change of population of state j:
Time development of coherence between states i and j:
Coupling of laser radiation and dipole moment for states j and m:
1 2 3, , , ,jm jm jmV E r t E r t E r t E r t
( )jjjm mj jm mj j jj mj mm
m m
iV V
t
( ) ( )ijij ij ij im mj im mj
m
ii V V
t
APPLIED LASER SPECTROSCOPY LABORATORYSCHOOL OF MECHANICAL ENGINEERING
1 4exp expkg kg kgt t i t t i t
2 3exp expke ke ket t i t t i t
1 2expeg egt t i t
Time-Dependent Density Matrix Equations for the Laser Interaction
Time-Dependent Density Matrix Equations for the Laser Interaction
The off-diagonal density matrix elements are written in terms of slowly varying amplitude functions and a term that oscillates at the frequency or frequencies of interest for each term:
The envelope functions and polarizations for the pump, Stokes, and probe beams are specified.
APPLIED LASER SPECTROSCOPY LABORATORYSCHOOL OF MECHANICAL ENGINEERING
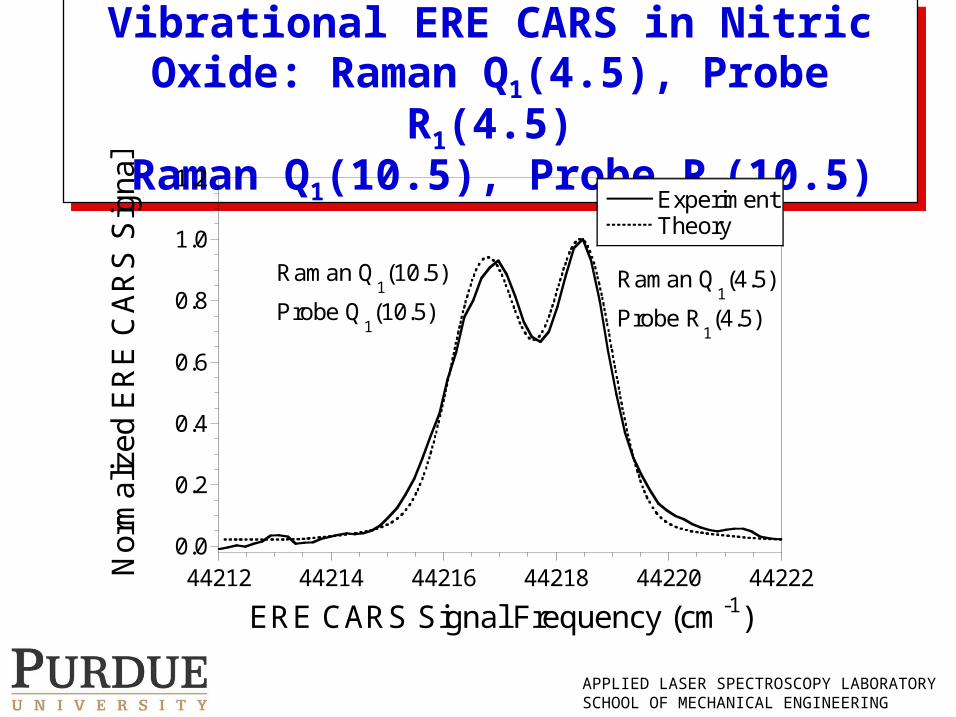
Vibrational ERE CARS in Nitric Oxide: Raman Q1(4.5), Probe R1(4.5)
Raman Q1(10.5), Probe R1(10.5)
Vibrational ERE CARS in Nitric Oxide: Raman Q1(4.5), Probe R1(4.5)
Raman Q1(10.5), Probe R1(10.5)
0.0
0.2
0.4
0.6
0.8
1.0
1.2
44212 44214 44216 44218 44220 44222
ExperimentTheory
Nor
mal
ized
ER
E C
AR
S S
igna
l
ERE CARS Signal Frequency (cm-1)
Raman Q1(4.5)
Probe R1(4.5)
Raman Q1(10.5)
Probe Q1(10.5)
APPLIED LASER SPECTROSCOPY LABORATORYSCHOOL OF MECHANICAL ENGINEERING
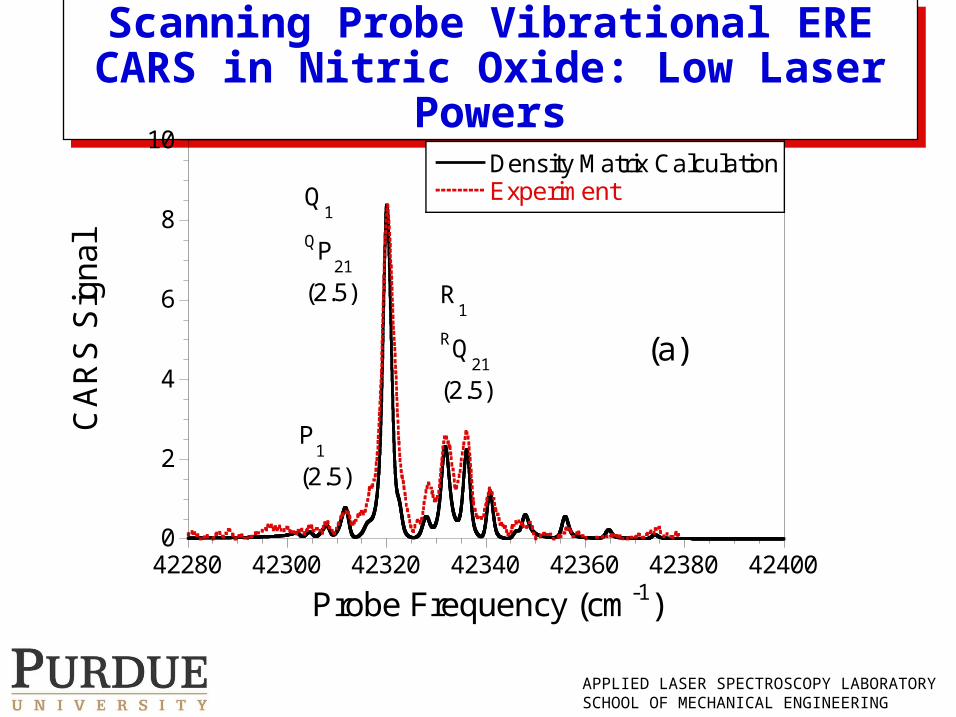
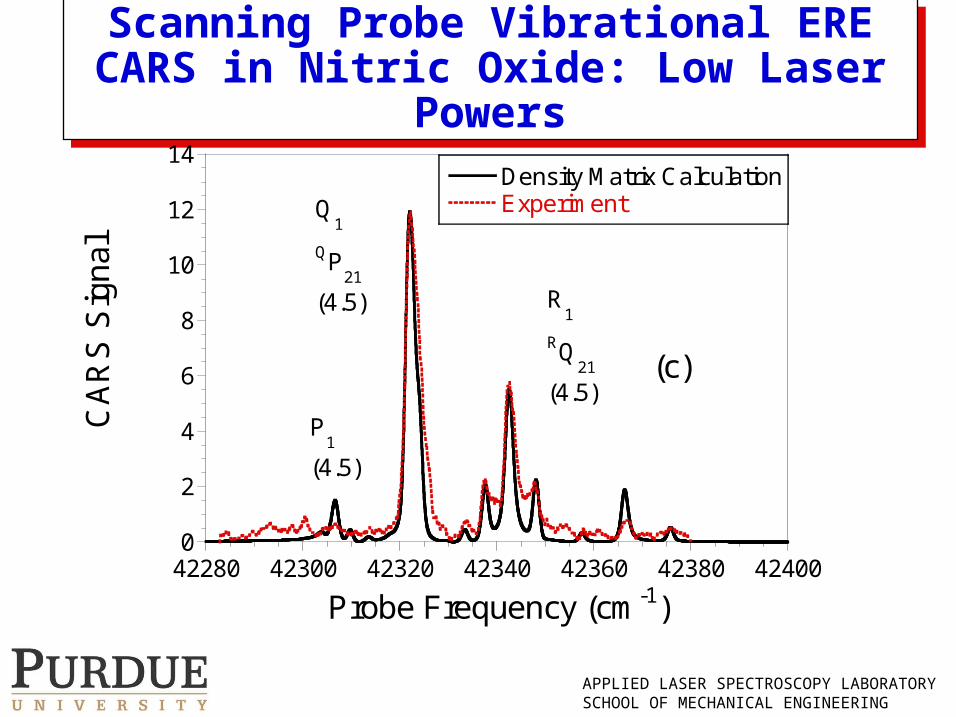
Scanning Probe Vibrational ERE CARS in Nitric Oxide: Low Laser Powers
Scanning Probe Vibrational ERE CARS in Nitric Oxide: Low Laser Powers
0
2
4
6
8
10
42280 42300 42320 42340 42360 42380 42400
Density Matrix CalculationExperiment
CA
RS
Sig
nal
Probe Frequency (cm-1)
Q1
QP21
(2.5) R1
RQ21
(2.5)
P1
(2.5)
0
2
4
6
8
10
12
14
42280 42300 42320 42340 42360 42380 42400
Density Matrix CalculationExperiment
CA
RS
Sig
nal
Probe Frequency (cm-1)
Q1
QP21
(4.5) R1
RQ21
(4.5)
P1
(4.5)
(a) (b)
(c) (d)
0
2
4
6
8
10
42280 42300 42320 42340 42360 42380 42400
Density Matrix CalculationExperiment
CA
RS
Sig
nal
Probe Frequency (cm-1)
Q1
QP21
(3.5)R
1
RQ21
(3.5)
P1
(3.5)
0
2
4
6
8
10
42280 42300 42320 42340 42360 42380 42400
Density Matrix CalculationExperiment
CA
RS
Sig
nal
Probe Frequency (cm-1)
Q1
QP21
(7.5)
R1
RQ21
(7.5)P
1
(7.5)
APPLIED LASER SPECTROSCOPY LABORATORYSCHOOL OF MECHANICAL ENGINEERING
Scanning Probe Vibrational ERE CARS in Nitric Oxide: Low Laser Powers
Scanning Probe Vibrational ERE CARS in Nitric Oxide: Low Laser Powers0
2
4
6
8
10
42280 42300 42320 42340 42360 42380 42400
Density Matrix CalculationExperiment
CA
RS
Sig
nal
Probe Frequency (cm-1)
Q1
QP21
(2.5) R1
RQ21
(2.5)
P1
(2.5)
0
2
4
6
8
10
12
14
42280 42300 42320 42340 42360 42380 42400
Density Matrix CalculationExperiment
CA
RS
Sig
nal
Probe Frequency (cm-1)
Q1
QP21
(4.5) R1
RQ21
(4.5)
P1
(4.5)
(a) (b)
(c) (d)
0
2
4
6
8
10
42280 42300 42320 42340 42360 42380 42400
Density Matrix CalculationExperiment
CA
RS
Sig
nal
Probe Frequency (cm-1)
Q1
QP21
(3.5)R
1
RQ21
(3.5)
P1
(3.5)
0
2
4
6
8
10
42280 42300 42320 42340 42360 42380 42400
Density Matrix CalculationExperiment
CA
RS
Sig
nal
Probe Frequency (cm-1)
Q1
QP21
(7.5)
R1
RQ21
(7.5)P
1
(7.5)
APPLIED LASER SPECTROSCOPY LABORATORYSCHOOL OF MECHANICAL ENGINEERING
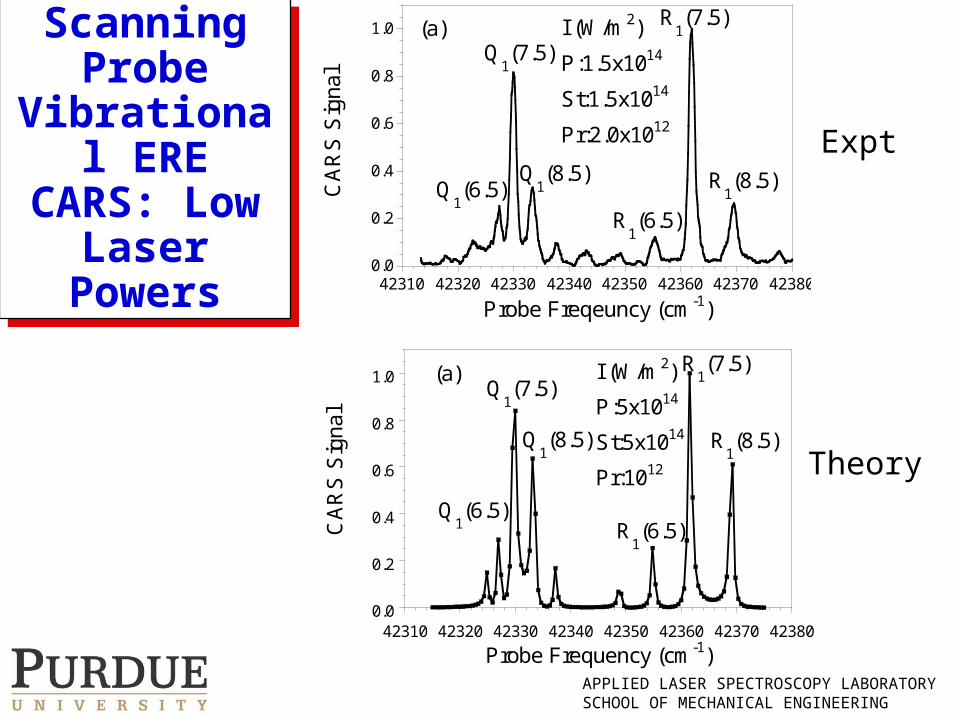
Scanning Probe
Vibrational ERE CARS: Low Laser
Powers
Scanning Probe
Vibrational ERE CARS: Low Laser
Powers 0.0
0.2
0.4
0.6
0.8
1.0
42310 42320 42330 42340 42350 42360 42370 42380
CA
RS
Sig
nal
Probe Freqeuncy (cm-1)
0.0
0.2
0.4
0.6
0.8
1.0
42310 42320 42330 42340 42350 42360 42370 42380
CA
RS
Sig
nal
Probe Frequency (cm-1)
0.0
0.2
0.4
0.6
0.8
1.0
42310 42320 42330 42340 42350 42360 42370 42380
CA
RS
Sig
nal
Probe Frequency (cm-1)
0.0
0.2
0.4
0.6
0.8
1.0
42310 42320 42330 42340 42350 42360 42370 42380
CA
RS
Sig
nal
Probe Frequency (cm-1)
(a) (b)
(c) (d)
I (W/m2)
P:1.5x10¹⁴
St:1.5x10¹⁴
Pr:2.0x10¹²
I (W/m2)
P:3.0x10¹⁴
St:3.0x10¹⁴
Pr:2.0x10¹²
I (W/m2)
P:1.5x10¹⁵
St:1.5x10¹⁵
Pr:2.0x10¹²
I (W/m2)
P:3.0x10¹⁴
St:3.0x10¹⁴
Pr:5.0x10¹³
Q1(7.5)
R1(7.5)
R1(8.5)
R1(6.5)
Q1(8.5)
Q1(6.5)
0.0
0.2
0.4
0.6
0.8
1.0
42310 42320 42330 42340 42350 42360 42370 42380
CA
RS
Sig
nal
Probe Frequency (cm-1)
0.0
0.2
0.4
0.6
0.8
1.0
42310 42320 42330 42340 42350 42360 42370 42380
CA
RS
Sig
nal
Probe Frequency (cm-1)
0.0
0.2
0.4
0.6
0.8
1.0
42310 42320 42330 42340 42350 42360 42370 42380
CA
RS
Sig
nal
Probe Frequency (cm-1)
0.0
0.2
0.4
0.6
0.8
1.0
42310 42320 42330 42340 42350 42360 42370 42380
CA
RS
Sig
nal
Probe Frequency (cm-1)
I (W/m2)
P:5x10¹⁴
St:5x10¹⁴
Pr:1012
(a) I (W/m2)
P:1x10¹⁵
St:1x10¹⁵
Pr:1012
I (W/m2)
P:1016
St:1016
Pr:1012
I (W/m2)
P:1x10¹⁵
St:1x10¹⁵
Pr:3x10¹³
(b)
(c) (d)
R1(7.5)
R1(8.5)
R1(6.5)
Q1(7.5)
Q1(8.5)
Q1(6.5)
Expt
Theory
APPLIED LASER SPECTROSCOPY LABORATORYSCHOOL OF MECHANICAL ENGINEERING
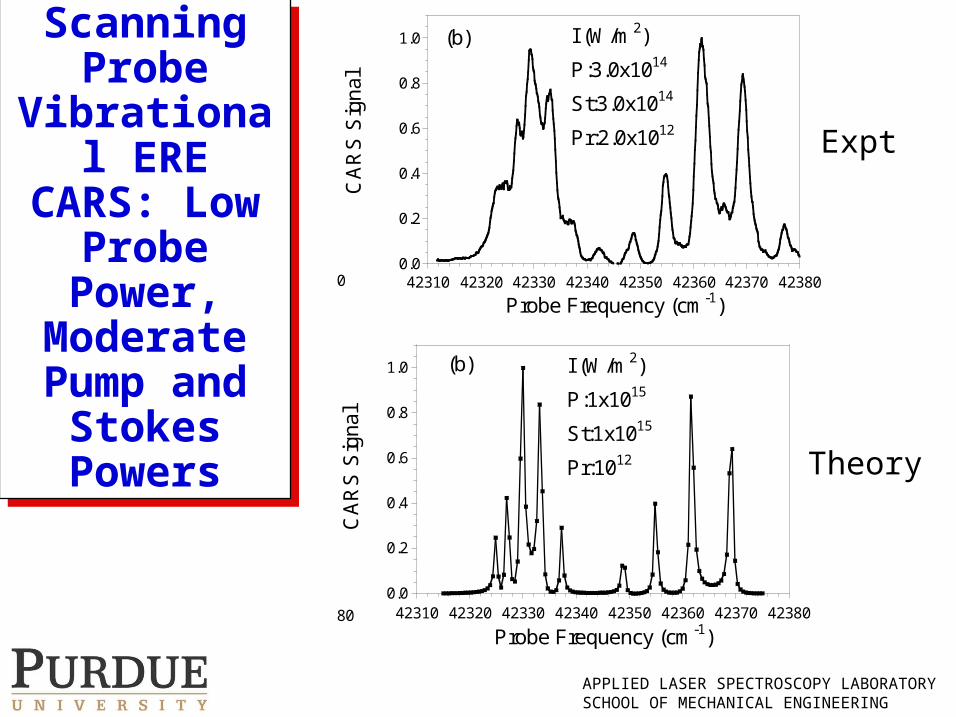
Scanning Probe
Vibrational ERE CARS: Low Probe
Power, Moderate Pump and
Stokes Powers
Scanning Probe
Vibrational ERE CARS: Low Probe
Power, Moderate Pump and
Stokes Powers
Expt
Theory
0.0
0.2
0.4
0.6
0.8
1.0
42310 42320 42330 42340 42350 42360 42370 42380
CA
RS
Sig
nal
Probe Frequency (cm-1)
0.0
0.2
0.4
0.6
0.8
1.0
42310 42320 42330 42340 42350 42360 42370 42380
CA
RS
Sig
nal
Probe Frequency (cm-1)
0.0
0.2
0.4
0.6
0.8
1.0
42310 42320 42330 42340 42350 42360 42370 42380
CA
RS
Sig
nal
Probe Frequency (cm-1)
0.0
0.2
0.4
0.6
0.8
1.0
42310 42320 42330 42340 42350 42360 42370 42380
CA
RS
Sig
nal
Probe Frequency (cm-1)
I (W/m2)
P:5x10¹⁴
St:5x10¹⁴
Pr:1012
(a) I (W/m2)
P:1x10¹⁵
St:1x10¹⁵
Pr:1012
I (W/m2)
P:1016
St:1016
Pr:1012
I (W/m2)
P:1x10¹⁵
St:1x10¹⁵
Pr:3x10¹³
(b)
(c) (d)
R1(7.5)
R1(8.5)
R1(6.5)
Q1(7.5)
Q1(8.5)
Q1(6.5)
0.0
0.2
0.4
0.6
0.8
1.0
42310 42320 42330 42340 42350 42360 42370 42380
CA
RS
Sig
nal
Probe Freqeuncy (cm-1)
0.0
0.2
0.4
0.6
0.8
1.0
42310 42320 42330 42340 42350 42360 42370 42380
CA
RS
Sig
nal
Probe Frequency (cm-1)
0.0
0.2
0.4
0.6
0.8
1.0
42310 42320 42330 42340 42350 42360 42370 42380
CA
RS
Sig
nal
Probe Frequency (cm-1)
0.0
0.2
0.4
0.6
0.8
1.0
42310 42320 42330 42340 42350 42360 42370 42380
CA
RS
Sig
nal
Probe Frequency (cm-1)
(a) (b)
(c) (d)
I (W/m2)
P:1.5x10¹⁴
St:1.5x10¹⁴
Pr:2.0x10¹²
I (W/m2)
P:3.0x10¹⁴
St:3.0x10¹⁴
Pr:2.0x10¹²
I (W/m2)
P:1.5x10¹⁵
St:1.5x10¹⁵
Pr:2.0x10¹²
I (W/m2)
P:3.0x10¹⁴
St:3.0x10¹⁴
Pr:5.0x10¹³
Q1(7.5)
R1(7.5)
R1(8.5)
R1(6.5)
Q1(8.5)
Q1(6.5)
APPLIED LASER SPECTROSCOPY LABORATORYSCHOOL OF MECHANICAL ENGINEERING
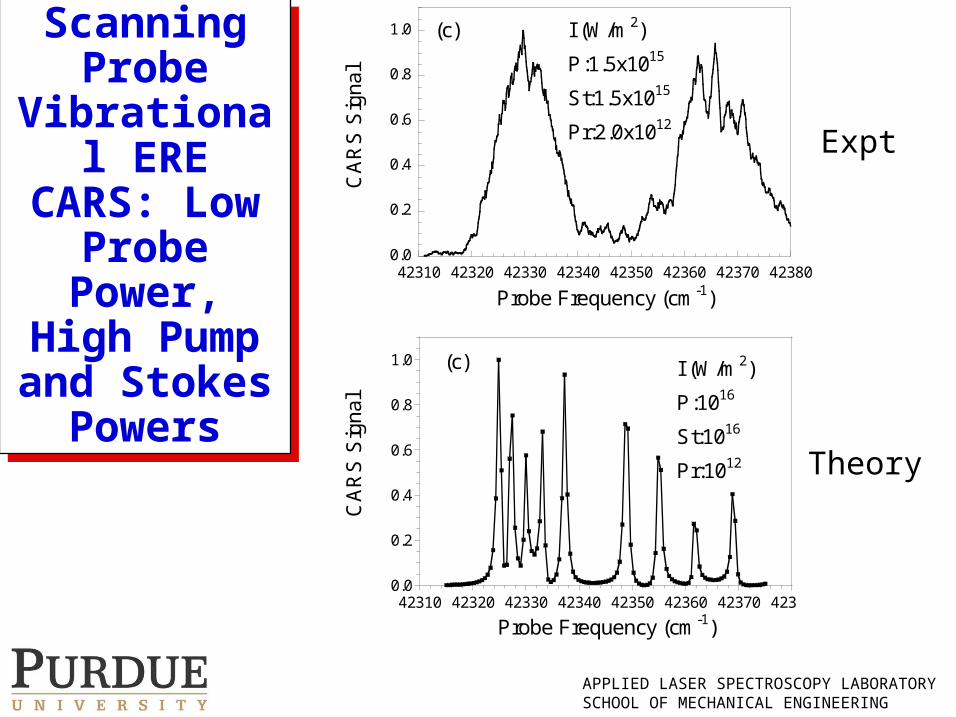
Scanning Probe
Vibrational ERE CARS: Low Probe
Power, High Pump and
Stokes Powers
Scanning Probe
Vibrational ERE CARS: Low Probe
Power, High Pump and
Stokes Powers
Expt
Theory
0.0
0.2
0.4
0.6
0.8
1.0
42310 42320 42330 42340 42350 42360 42370 42380
CA
RS
Sig
nal
Probe Frequency (cm-1)
0.0
0.2
0.4
0.6
0.8
1.0
42310 42320 42330 42340 42350 42360 42370 42380
CA
RS
Sig
nal
Probe Frequency (cm-1)
0.0
0.2
0.4
0.6
0.8
1.0
42310 42320 42330 42340 42350 42360 42370 42380
CA
RS
Sig
nal
Probe Frequency (cm-1)
0.0
0.2
0.4
0.6
0.8
1.0
42310 42320 42330 42340 42350 42360 42370 42380
CA
RS
Sig
nal
Probe Frequency (cm-1)
I (W/m2)
P:5x10¹⁴
St:5x10¹⁴
Pr:1012
(a) I (W/m2)
P:1x10¹⁵
St:1x10¹⁵
Pr:1012
I (W/m2)
P:1016
St:1016
Pr:1012
I (W/m2)
P:1x10¹⁵
St:1x10¹⁵
Pr:3x10¹³
(b)
(c) (d)
R1(7.5)
R1(8.5)
R1(6.5)
Q1(7.5)
Q1(8.5)
Q1(6.5)
0.0
0.2
0.4
0.6
0.8
1.0
42310 42320 42330 42340 42350 42360 42370 42380
CA
RS
Sig
nal
Probe Freqeuncy (cm-1)
0.0
0.2
0.4
0.6
0.8
1.0
42310 42320 42330 42340 42350 42360 42370 42380
CA
RS
Sig
nal
Probe Frequency (cm-1)
0.0
0.2
0.4
0.6
0.8
1.0
42310 42320 42330 42340 42350 42360 42370 42380
CA
RS
Sig
nal
Probe Frequency (cm-1)
0.0
0.2
0.4
0.6
0.8
1.0
42310 42320 42330 42340 42350 42360 42370 42380
CA
RS
Sig
nal
Probe Frequency (cm-1)
(a) (b)
(c) (d)
I (W/m2)
P:1.5x10¹⁴
St:1.5x10¹⁴
Pr:2.0x10¹²
I (W/m2)
P:3.0x10¹⁴
St:3.0x10¹⁴
Pr:2.0x10¹²
I (W/m2)
P:1.5x10¹⁵
St:1.5x10¹⁵
Pr:2.0x10¹²
I (W/m2)
P:3.0x10¹⁴
St:3.0x10¹⁴
Pr:5.0x10¹³
Q1(7.5)
R1(7.5)
R1(8.5)
R1(6.5)
Q1(8.5)
Q1(6.5)
APPLIED LASER SPECTROSCOPY LABORATORYSCHOOL OF MECHANICAL ENGINEERING
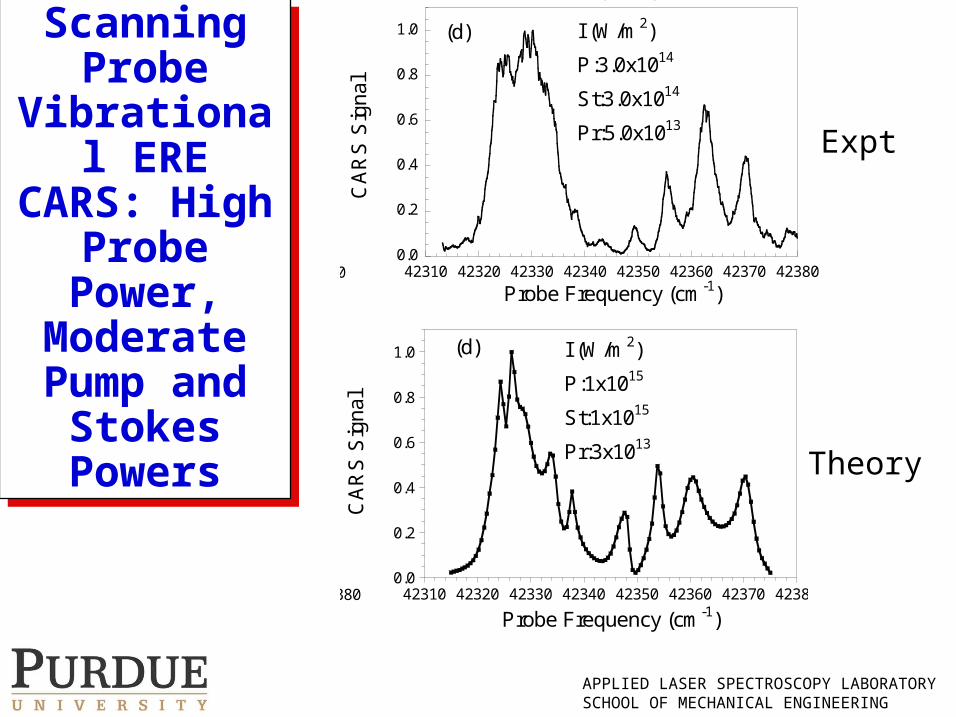
Scanning Probe
Vibrational ERE CARS: High Probe
Power, Moderate Pump and
Stokes Powers
Scanning Probe
Vibrational ERE CARS: High Probe
Power, Moderate Pump and
Stokes Powers
Expt
Theory
0.0
0.2
0.4
0.6
0.8
1.0
42310 42320 42330 42340 42350 42360 42370 42380
CA
RS
Sig
nal
Probe Frequency (cm-1)
0.0
0.2
0.4
0.6
0.8
1.0
42310 42320 42330 42340 42350 42360 42370 42380
CA
RS
Sig
nal
Probe Frequency (cm-1)
0.0
0.2
0.4
0.6
0.8
1.0
42310 42320 42330 42340 42350 42360 42370 42380
CA
RS
Sig
nal
Probe Frequency (cm-1)
0.0
0.2
0.4
0.6
0.8
1.0
42310 42320 42330 42340 42350 42360 42370 42380
CA
RS
Sig
nal
Probe Frequency (cm-1)
I (W/m2)
P:5x10¹⁴
St:5x10¹⁴
Pr:1012
(a) I (W/m2)
P:1x10¹⁵
St:1x10¹⁵
Pr:1012
I (W/m2)
P:1016
St:1016
Pr:1012
I (W/m2)
P:1x10¹⁵
St:1x10¹⁵
Pr:3x10¹³
(b)
(c) (d)
R1(7.5)
R1(8.5)
R1(6.5)
Q1(7.5)
Q1(8.5)
Q1(6.5)
0.0
0.2
0.4
0.6
0.8
1.0
42310 42320 42330 42340 42350 42360 42370 42380
CA
RS
Sig
nal
Probe Freqeuncy (cm-1)
0.0
0.2
0.4
0.6
0.8
1.0
42310 42320 42330 42340 42350 42360 42370 42380
CA
RS
Sig
nal
Probe Frequency (cm-1)
0.0
0.2
0.4
0.6
0.8
1.0
42310 42320 42330 42340 42350 42360 42370 42380
CA
RS
Sig
nal
Probe Frequency (cm-1)
0.0
0.2
0.4
0.6
0.8
1.0
42310 42320 42330 42340 42350 42360 42370 42380
CA
RS
Sig
nal
Probe Frequency (cm-1)
(a) (b)
(c) (d)
I (W/m2)
P:1.5x10¹⁴
St:1.5x10¹⁴
Pr:2.0x10¹²
I (W/m2)
P:3.0x10¹⁴
St:3.0x10¹⁴
Pr:2.0x10¹²
I (W/m2)
P:1.5x10¹⁵
St:1.5x10¹⁵
Pr:2.0x10¹²
I (W/m2)
P:3.0x10¹⁴
St:3.0x10¹⁴
Pr:5.0x10¹³
Q1(7.5)
R1(7.5)
R1(8.5)
R1(6.5)
Q1(8.5)
Q1(6.5)
APPLIED LASER SPECTROSCOPY LABORATORYSCHOOL OF MECHANICAL ENGINEERING
Scanning Probe
Vibrational ERE CARS: Stark Shift
Effects
Scanning Probe
Vibrational ERE CARS: Stark Shift
Effects
APPLIED LASER SPECTROSCOPY LABORATORYSCHOOL OF MECHANICAL ENGINEERING
Broadband Stokes Vibrational ERE CARS
Broadband Stokes Vibrational ERE CARS
0.003 cm-1
50 cm-1
0.1 cm-1
APPLIED LASER SPECTROSCOPY LABORATORYSCHOOL OF MECHANICAL ENGINEERING
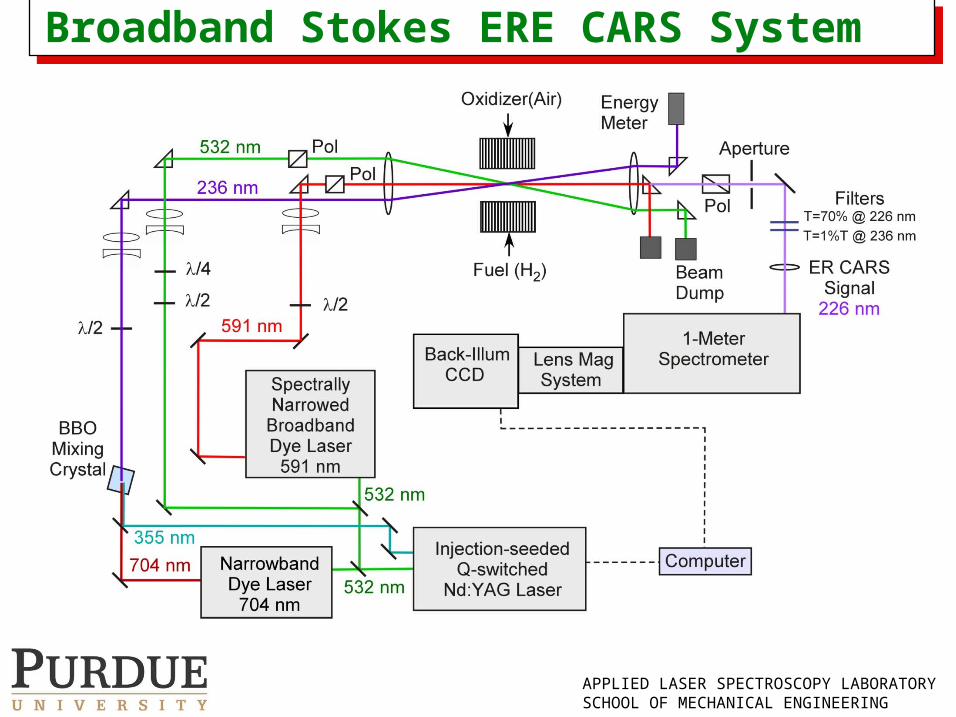
Broadband Stokes ERE CARS System Broadband Stokes ERE CARS System

APPLIED LASER SPECTROSCOPY LABORATORYSCHOOL OF MECHANICAL ENGINEERING
Broadband Stokes ERE CARS System: Spectrally Narrowed BBDL
Broadband Stokes ERE CARS System: Spectrally Narrowed BBDL

APPLIED LASER SPECTROSCOPY LABORATORYSCHOOL OF MECHANICAL ENGINEERING
Broadband Stokes ERE CARS Signal in Jet of N2 with 1000 ppm NO at 300 K
Broadband Stokes ERE CARS Signal in Jet of N2 with 1000 ppm NO at 300 K
APPLIED LASER SPECTROSCOPY LABORATORYSCHOOL OF MECHANICAL ENGINEERING
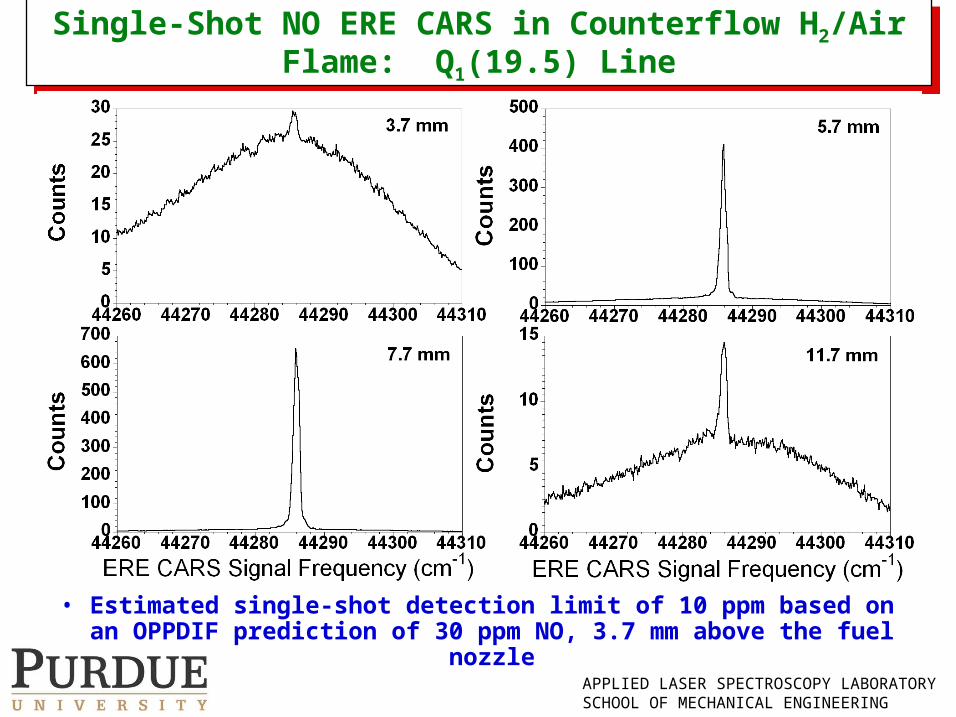
Single-Shot NO ERE CARS in Counterflow H2/Air Flame: Q1(19.5) Line
Single-Shot NO ERE CARS in Counterflow H2/Air Flame: Q1(19.5) Line
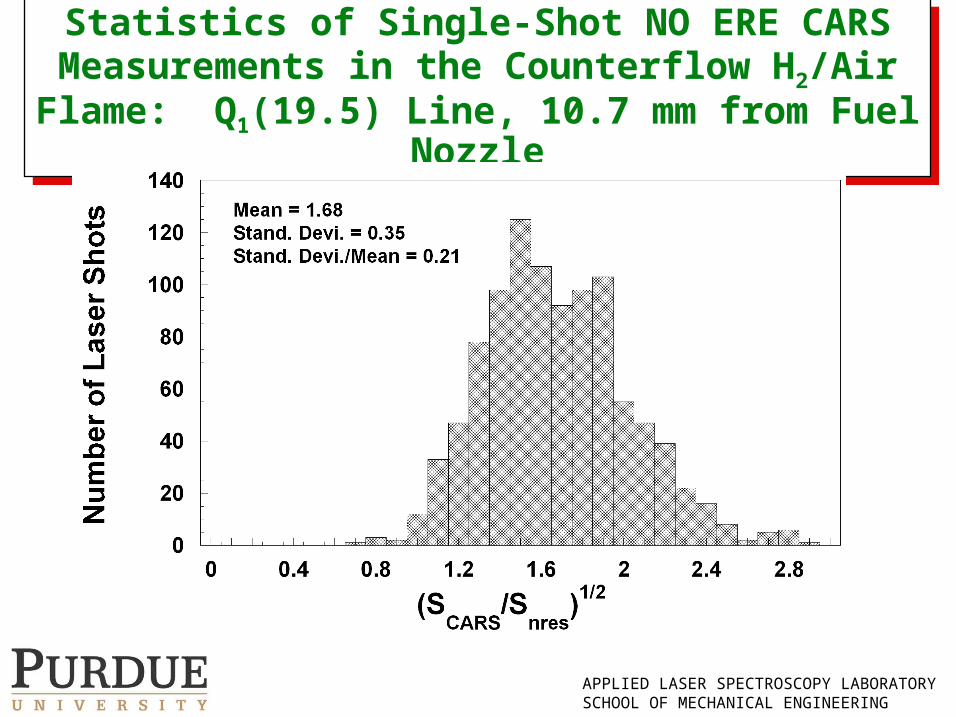
• Estimated single-shot detection limit of 10 ppm based on an OPPDIF prediction of 30 ppm NO, 3.7 mm above the fuel nozzle
APPLIED LASER SPECTROSCOPY LABORATORYSCHOOL OF MECHANICAL ENGINEERING
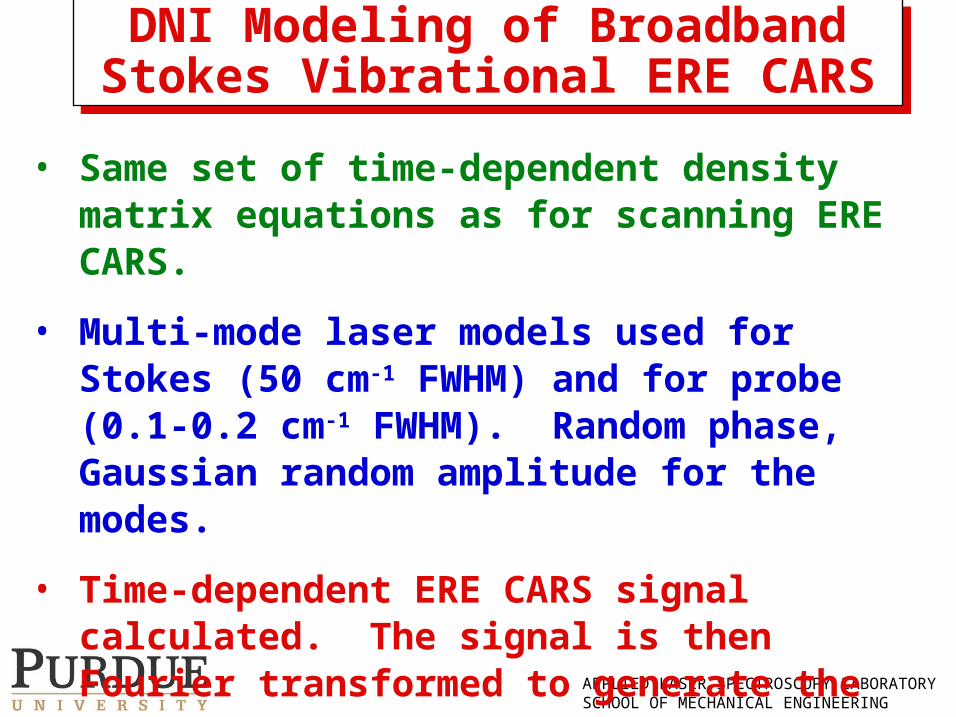
DNI Modeling of Broadband Stokes Vibrational ERE CARS
DNI Modeling of Broadband Stokes Vibrational ERE CARS
• Same set of time-dependent density matrix equations as for scanning ERE CARS.
• Multi-mode laser models used for Stokes (50 cm-1 FWHM) and for probe (0.1-0.2 cm-1 FWHM). Random phase, Gaussian random amplitude for the modes.
• Time-dependent ERE CARS signal calculated. The signal is then Fourier transformed to generate the ERE CARS spectrum.
APPLIED LASER SPECTROSCOPY LABORATORYSCHOOL OF MECHANICAL ENGINEERING
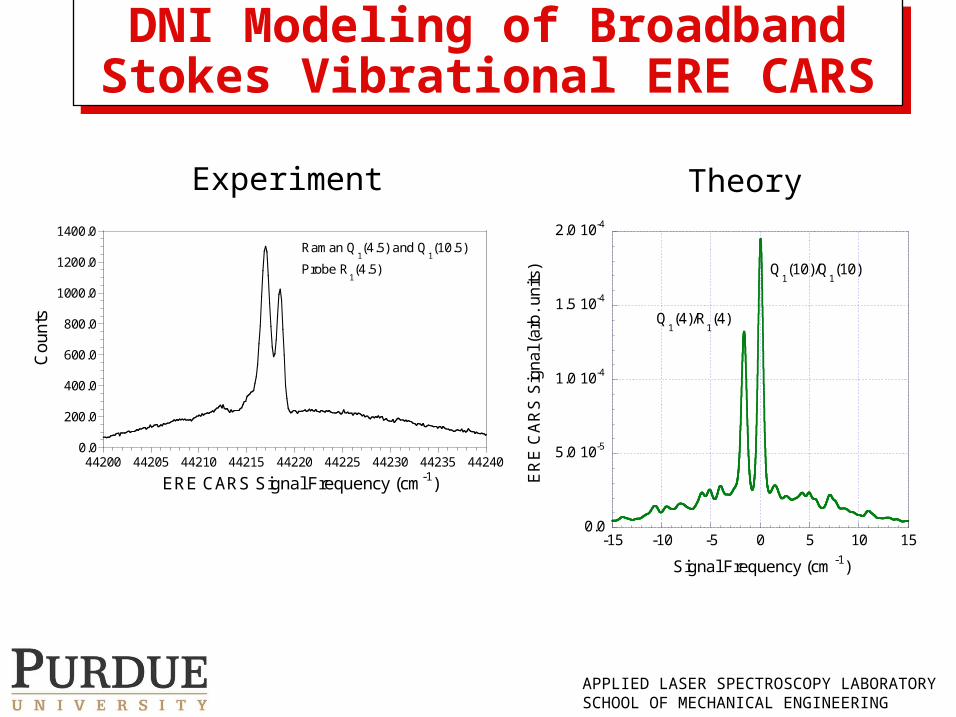
DNI Modeling of Broadband Stokes Vibrational ERE CARS
DNI Modeling of Broadband Stokes Vibrational ERE CARS
0.0
200.0
400.0
600.0
800.0
1000.0
1200.0
1400.0
44200 44205 44210 44215 44220 44225 44230 44235 44240
Raman Q1(4.5) and Q
1(10.5)
Probe R1(4.5)
Cou
nts
ERE CARS Signal Frequency (cm-1)
0.0
5.0 10-5
1.0 10-4
1.5 10-4
2.0 10-4
-15 -10 -5 0 5 10 15E
RE
CA
RS
Sig
nal
(ar
b.
units
)
Signal Frequency (cm -1)
Q1(10)/Q
1(10)
Q1(4)/R
1(4)
Experiment Theory
APPLIED LASER SPECTROSCOPY LABORATORYSCHOOL OF MECHANICAL ENGINEERING
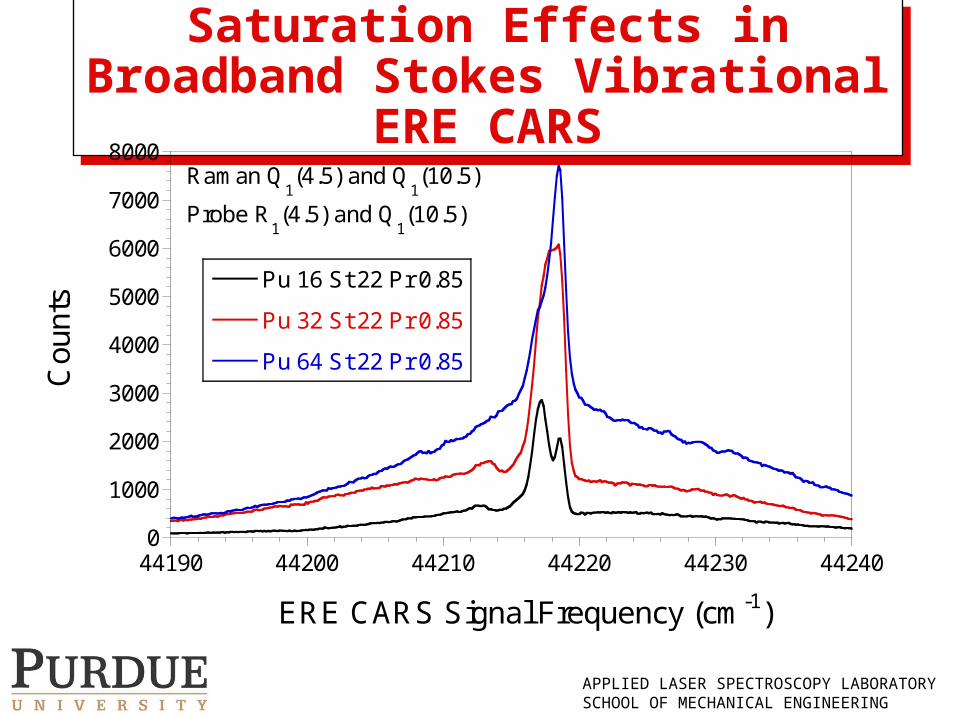
Saturation Effects in Broadband Stokes Vibrational ERE CARS
Saturation Effects in Broadband Stokes Vibrational ERE CARS
0
1000
2000
3000
4000
5000
6000
7000
8000
44190 44200 44210 44220 44230 44240
Raman Q1(4.5) and Q
1(10.5)
Probe R1(4.5) and Q
1(10.5)
Pu 16 St 22 Pr 0.85
Pu 32 St 22 Pr 0.85
Pu 64 St 22 Pr 0.85
Cou
nts
ERE CARS Signal Frequency (cm-1)

APPLIED LASER SPECTROSCOPY LABORATORYSCHOOL OF MECHANICAL ENGINEERING
ConclusionsConclusions
• Density matrix model for NO ERE CARS developed for both scanning and broadband ERE CARS.
• Theoretical spectra are in good agreement with experiment except for probe scans with high pump and Stokes powers.
• Multimode laser models for the Stokes and UV probe beams appear to give good results for the broadband Stokes ERE CARS process.
APPLIED LASER SPECTROSCOPY LABORATORYSCHOOL OF MECHANICAL ENGINEERING
Future WorkFuture Work
• Comparison of NO measurements by ERE CARS and LIF in high-pressure counterflow flames – the high-pressure flame facility at Purdue needed some extensive modification, should be operational this spring.
• Incorporation of the AC Stark effect in the density matrix code.
• Investigation of saturation and Stark effects for broadband Stokes ERE CARS.
APPLIED LASER SPECTROSCOPY LABORATORYSCHOOL OF MECHANICAL ENGINEERING
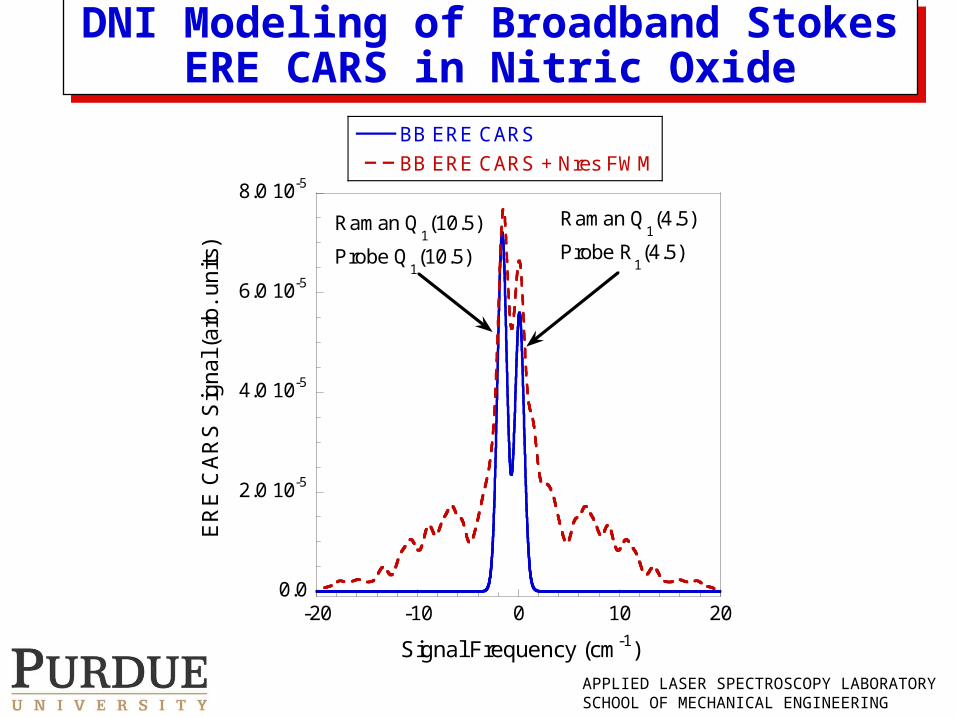
DNI Modeling of Broadband Stokes ERE CARS in Nitric Oxide
DNI Modeling of Broadband Stokes ERE CARS in Nitric Oxide
0.0
2.0 10-5
4.0 10-5
6.0 10-5
8.0 10-5
-20 -10 0 10 20
BB ERE CARS
BB ERE CARS + Nres FWM
ER
E C
AR
S S
ign
al (
arb
. un
its)
Signal Frequency (cm-1)
Raman Q1(4.5)
Probe R1(4.5)
Raman Q1(10.5)
Probe Q1(10.5)
APPLIED LASER SPECTROSCOPY LABORATORYSCHOOL OF MECHANICAL ENGINEERING
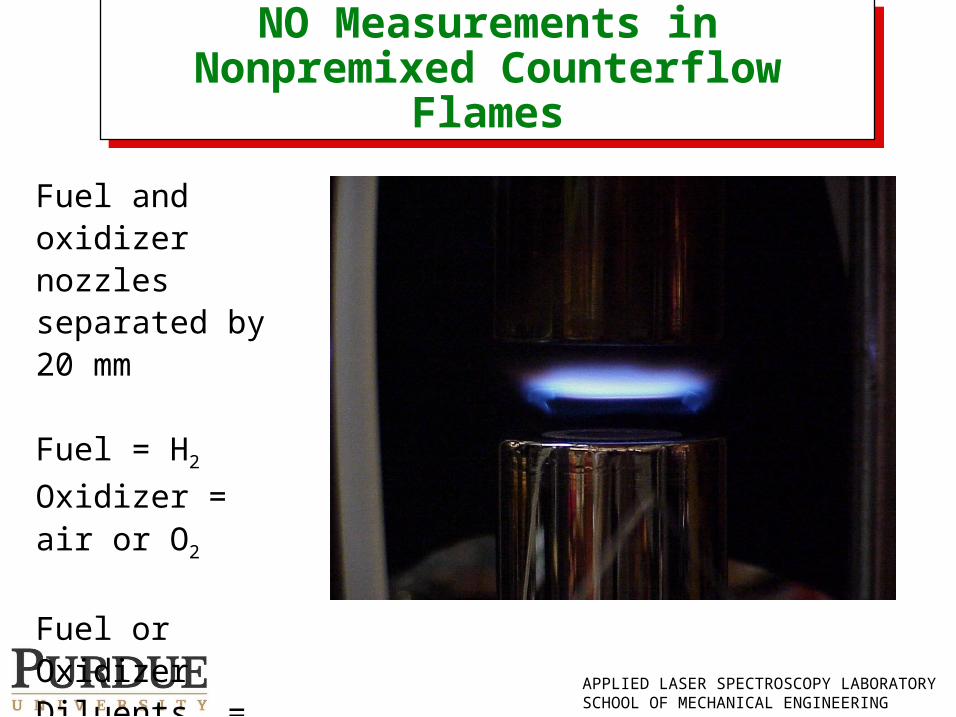
NO Measurements in Nonpremixed Counterflow Flames
NO Measurements in Nonpremixed Counterflow Flames
Seeded YAGPro 290
Dye Laser
Dye Laser
UnseededYAG
Powerlite9010
SPEX 1000M
PMT
355 nm
704 nm
532 nm
236 nm
591 nm
/2
/2
/2
Filters
Pol.@60
Pol.@60
Pol.@0
Joule Meter
Pol.@-30
WEX
L3
L1
L2
Counter-flow FlameFuel and oxidizer nozzles separated by 20 mm
Fuel = H2
Oxidizer = air or O2
Fuel or Oxidizer Diluents = N2,
CO2
APPLIED LASER SPECTROSCOPY LABORATORYSCHOOL OF MECHANICAL ENGINEERING
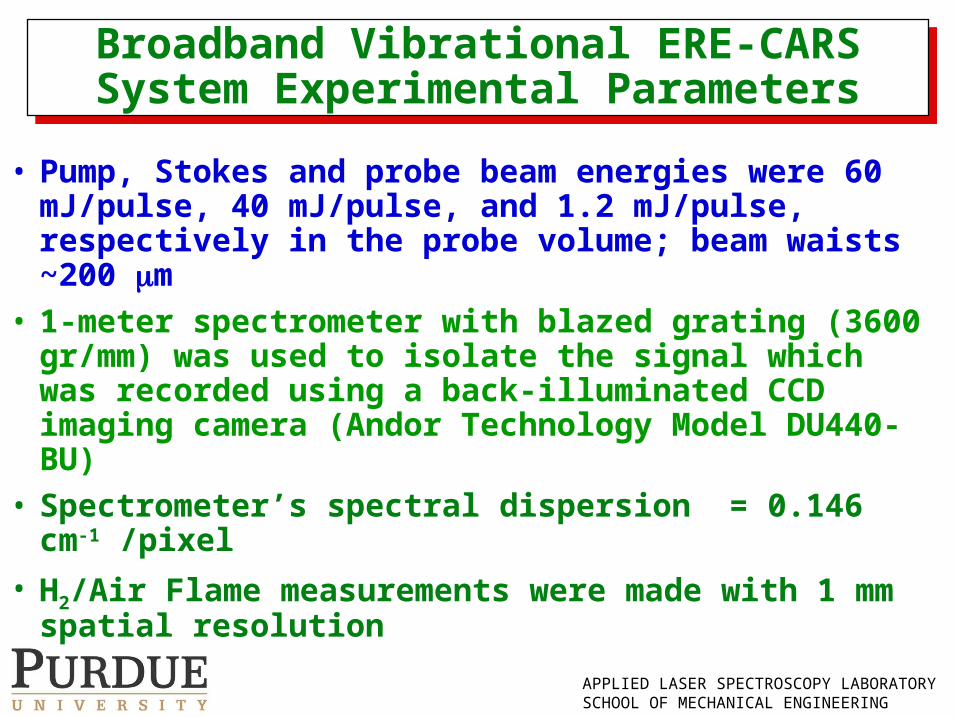
• Pump, Stokes and probe beam energies were 60 mJ/pulse, 40 mJ/pulse, and 1.2 mJ/pulse, respectively in the probe volume; beam waists ~200 m
• 1-meter spectrometer with blazed grating (3600 gr/mm) was used to isolate the signal which was recorded using a back-illuminated CCD imaging camera (Andor Technology Model DU440-BU)
• Spectrometer’s spectral dispersion = 0.146 cm-1 /pixel
• H2/Air Flame measurements were made with 1 mm spatial resolution
Broadband Vibrational ERE-CARS System Experimental Parameters
Broadband Vibrational ERE-CARS System Experimental Parameters
APPLIED LASER SPECTROSCOPY LABORATORYSCHOOL OF MECHANICAL ENGINEERING
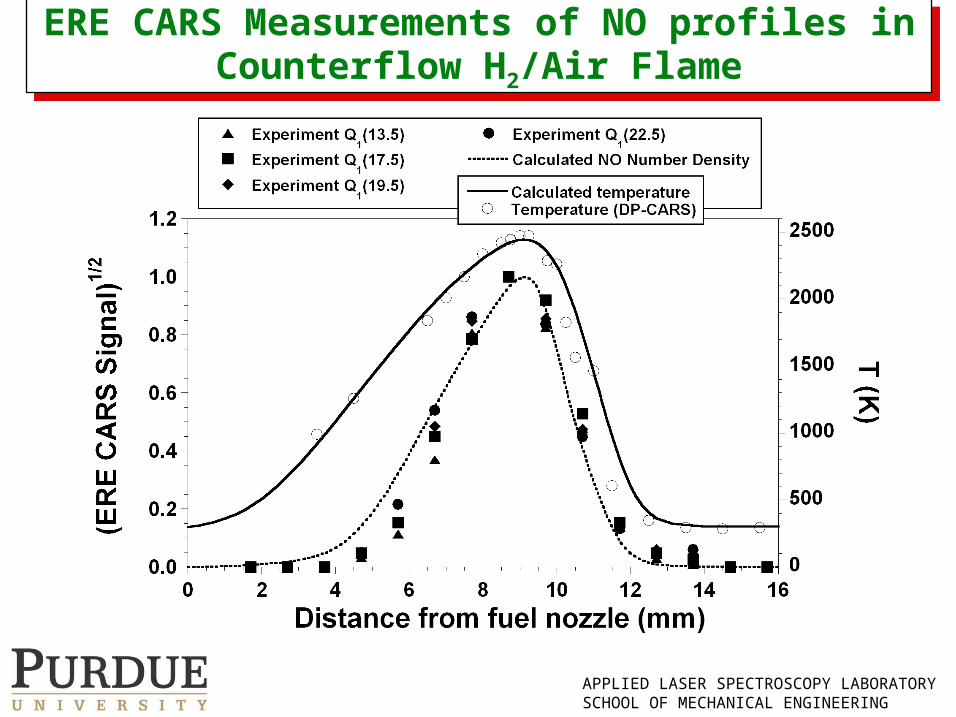
ERE CARS Measurements of NO profiles in Counterflow H2/Air Flame
ERE CARS Measurements of NO profiles in Counterflow H2/Air Flame
APPLIED LASER SPECTROSCOPY LABORATORYSCHOOL OF MECHANICAL ENGINEERING
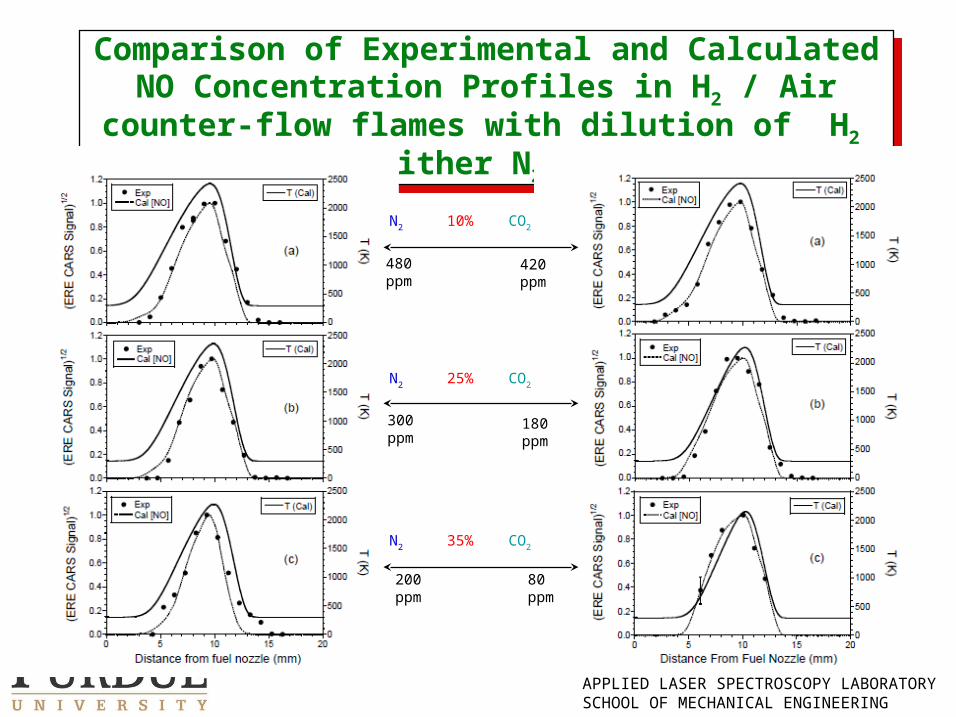
Comparison of Experimental and Calculated NO Concentration Profiles in H2 / Air counter-flow
flames with dilution of H2 with either N2 or CO2
Comparison of Experimental and Calculated NO Concentration Profiles in H2 / Air counter-flow
flames with dilution of H2 with either N2 or CO2
N2 10% CO2
N2 25% CO2
N2 35% CO2
480 ppm
420 ppm
300 ppm
200 ppm
180 ppm
80 ppm
APPLIED LASER SPECTROSCOPY LABORATORYSCHOOL OF MECHANICAL ENGINEERING
Statistics of Single-Shot NO ERE CARS Measurements in the Counterflow H2/Air Flame:
Q1(19.5) Line, 10.7 mm from Fuel Nozzle
Statistics of Single-Shot NO ERE CARS Measurements in the Counterflow H2/Air Flame:
Q1(19.5) Line, 10.7 mm from Fuel Nozzle
APPLIED LASER SPECTROSCOPY LABORATORYSCHOOL OF MECHANICAL ENGINEERING
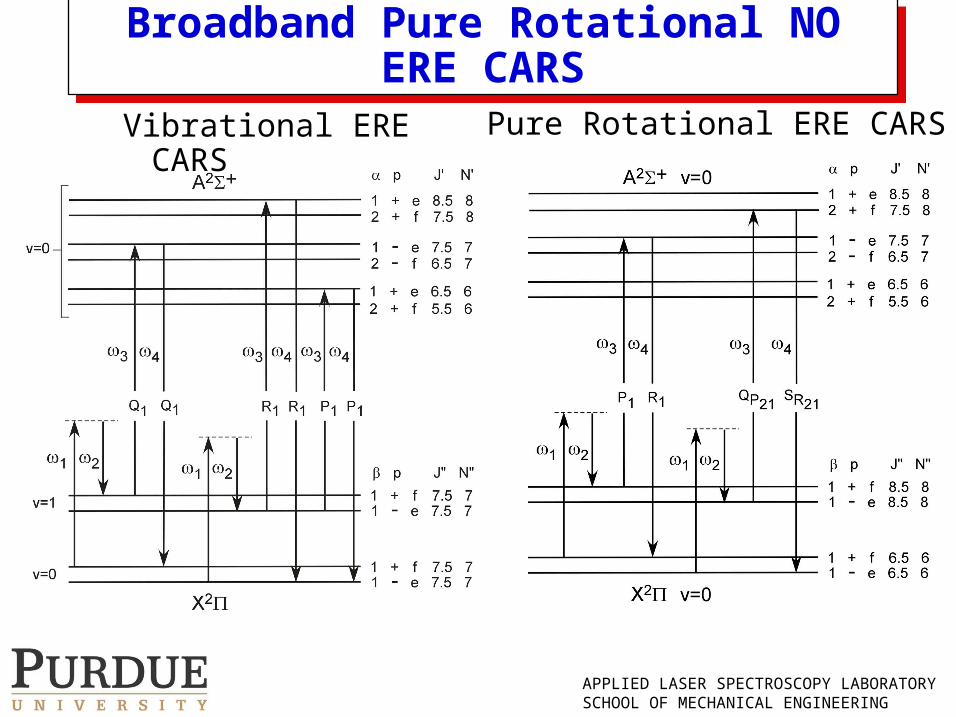
Broadband Pure Rotational NO ERE CARS
Broadband Pure Rotational NO ERE CARS
Vibrational ERE CARS
Pure Rotational ERE CARS
APPLIED LASER SPECTROSCOPY LABORATORYSCHOOL OF MECHANICAL ENGINEERING
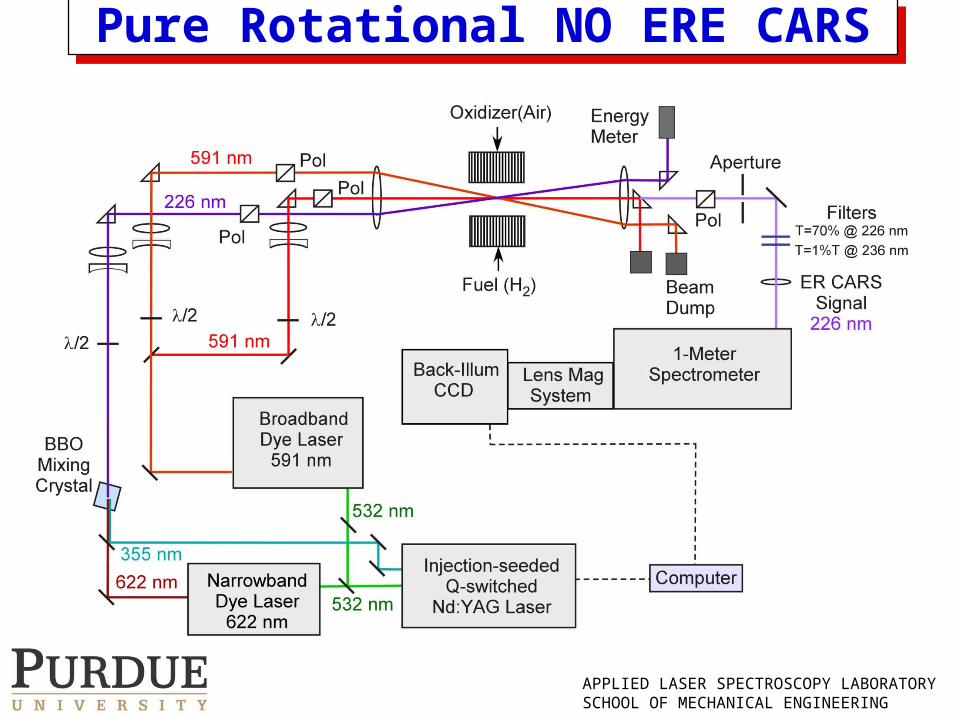
Pure Rotational NO ERE CARSPure Rotational NO ERE CARS
APPLIED LASER SPECTROSCOPY LABORATORYSCHOOL OF MECHANICAL ENGINEERING
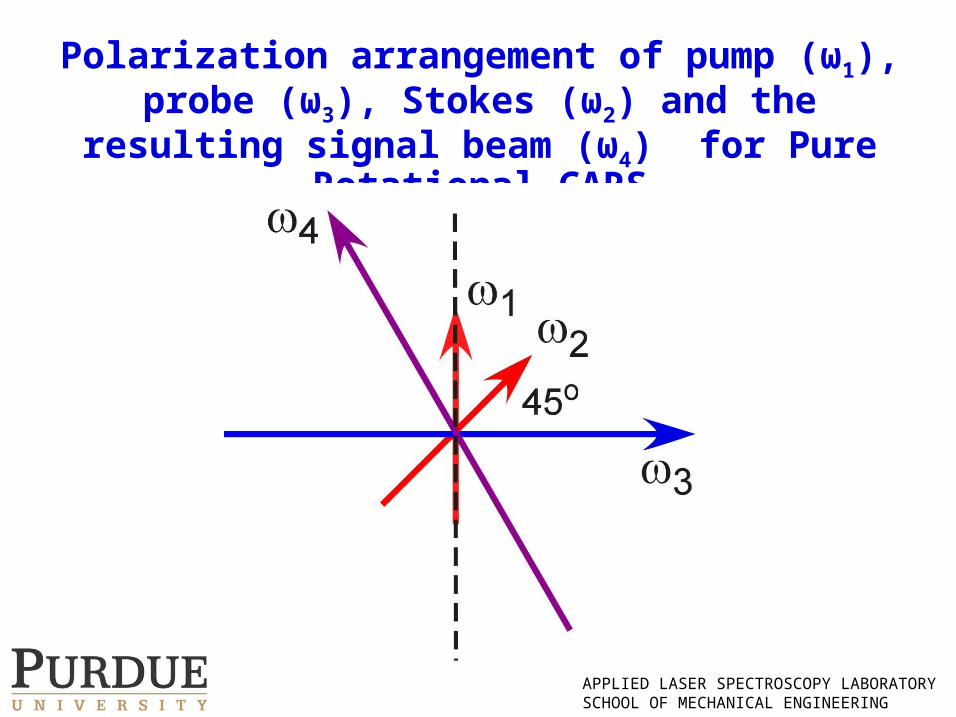
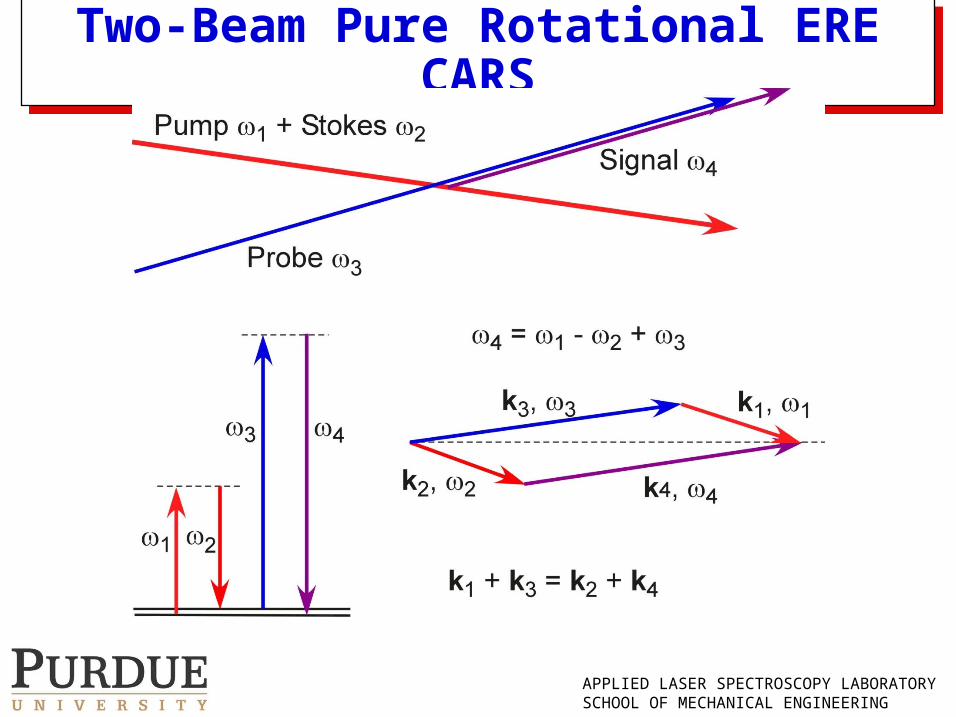
Polarization arrangement of pump (ω1), probe (ω3), Stokes (ω2) and the resulting signal beam
(ω4) for Pure Rotational CARS
APPLIED LASER SPECTROSCOPY LABORATORYSCHOOL OF MECHANICAL ENGINEERING
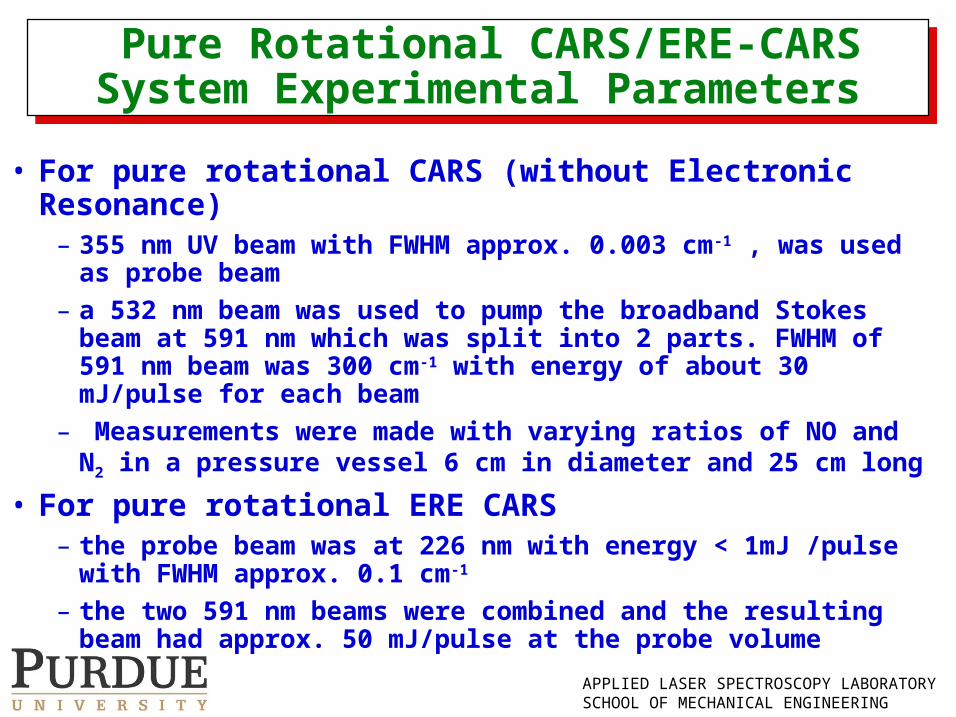
• For pure rotational CARS (without Electronic Resonance)– 355 nm UV beam with FWHM approx. 0.003 cm-1 , was used as
probe beam
– a 532 nm beam was used to pump the broadband Stokes beam at 591 nm which was split into 2 parts. FWHM of 591 nm beam was 300 cm-1 with energy of about 30 mJ/pulse for each beam
– Measurements were made with varying ratios of NO and N2 in a pressure vessel 6 cm in diameter and 25 cm long
• For pure rotational ERE CARS – the probe beam was at 226 nm with energy < 1mJ /pulse with
FWHM approx. 0.1 cm-1
– the two 591 nm beams were combined and the resulting beam had approx. 50 mJ/pulse at the probe volume
Pure Rotational CARS/ERE-CARS System Experimental Parameters
Pure Rotational CARS/ERE-CARS System Experimental Parameters
APPLIED LASER SPECTROSCOPY LABORATORYSCHOOL OF MECHANICAL ENGINEERING
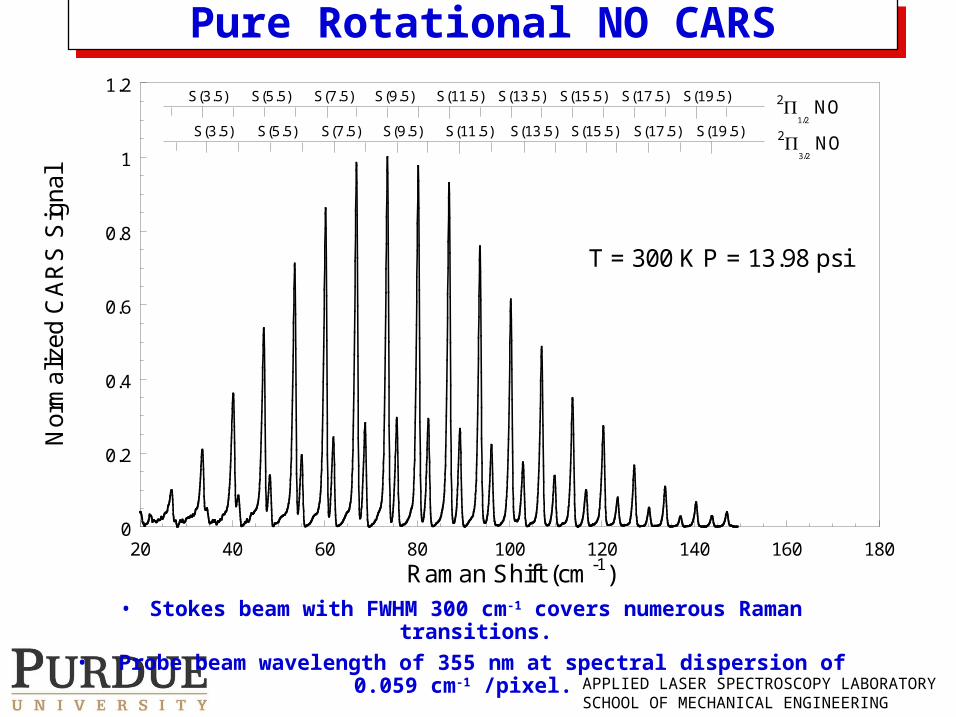
Pure Rotational NO CARSPure Rotational NO CARS
0
0.2
0.4
0.6
0.8
1
1.2
20 40 60 80 100 120 140 160 180
Nor
mal
ized
CA
RS
Sig
nal
Raman Shift (cm-1)
21/2
NOS(9.5)S(7.5)S(5.5)S(3.5) S(11.5) S(13.5) S(15.5) S(17.5) S(19.5)
S(9.5)S(7.5)S(5.5)S(3.5) S(11.5) S(13.5) S(15.5) S(17.5) S(19.5) 23/2
NO
T = 300 K P = 13.98 psi
• Stokes beam with FWHM 300 cm-1 covers numerous Raman transitions.
• Probe beam wavelength of 355 nm at spectral dispersion of 0.059 cm-1 /pixel.
APPLIED LASER SPECTROSCOPY LABORATORYSCHOOL OF MECHANICAL ENGINEERING
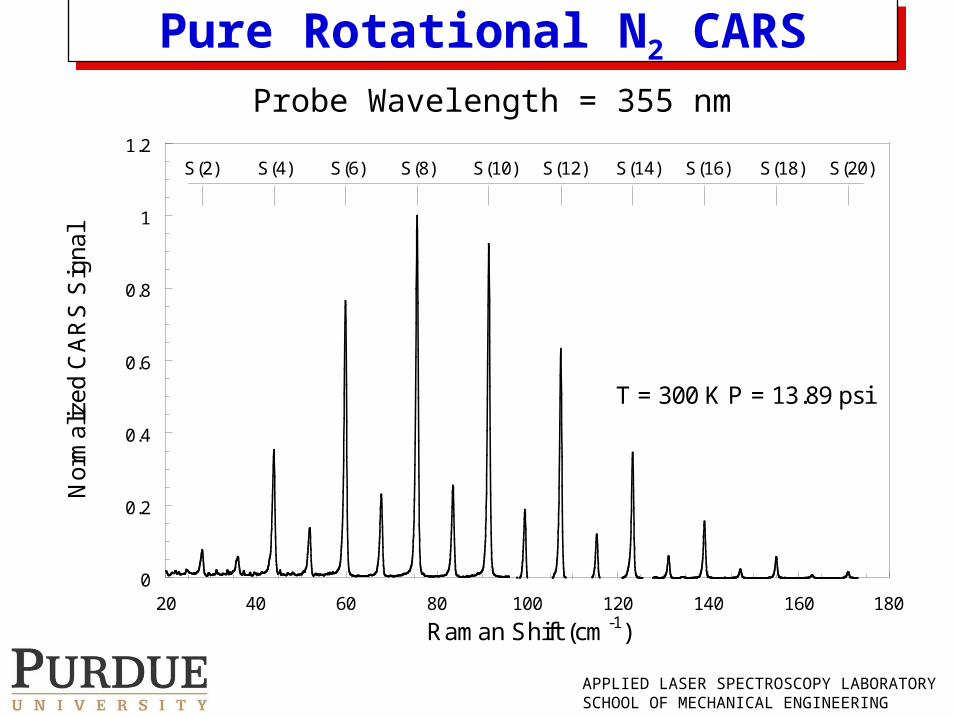
Pure Rotational N2 CARSPure Rotational N2 CARSProbe Wavelength = 355 nm
0
0.2
0.4
0.6
0.8
1
1.2
20 40 60 80 100 120 140 160 180
Nor
mal
ize
d C
AR
S S
igna
l
Raman Shift (cm-1)
T = 300 K P = 13.89 psi
S(8) S(10) S(12) S(14) S(16) S(18) S(20)S(6)S(4)S(2)
APPLIED LASER SPECTROSCOPY LABORATORYSCHOOL OF MECHANICAL ENGINEERING
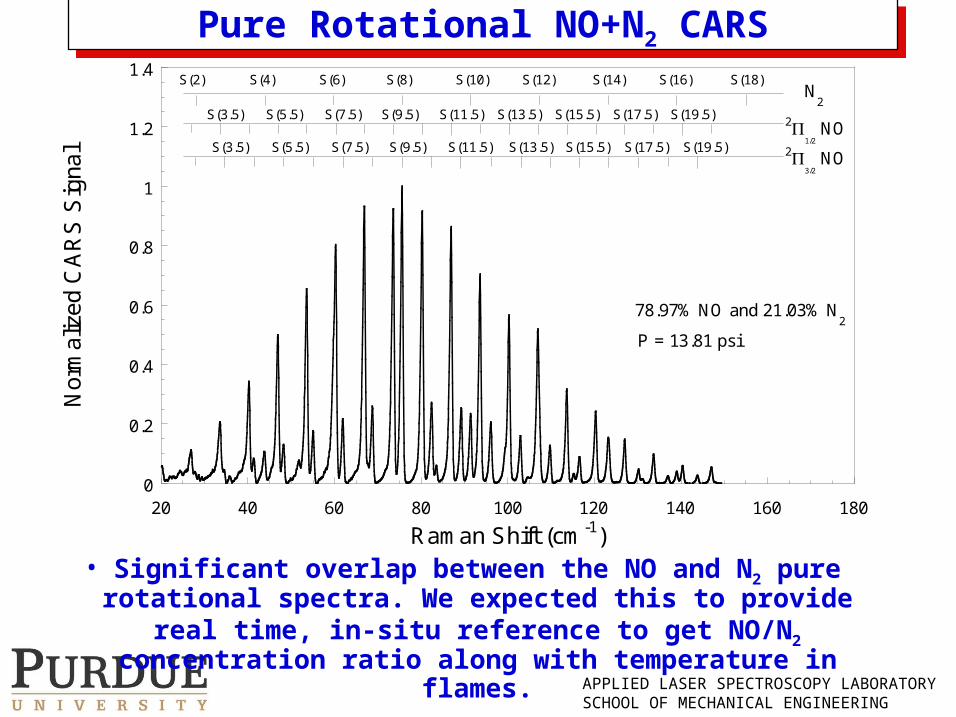
Pure Rotational NO+N2 CARSPure Rotational NO+N2 CARS
0
0.2
0.4
0.6
0.8
1
1.2
1.4
20 40 60 80 100 120 140 160 180
Nor
mal
ized
CA
RS
Sig
nal
Raman Shift (cm-1)
S(8) S(10) S(12) S(14) S(16) S(18)S(6)S(4)S(2)N
2
78.97% NO and 21.03% N2
P = 13.81 psi
21/2
NOS(9.5)S(7.5)S(5.5)S(3.5) S(11.5) S(13.5) S(15.5) S(17.5) S(19.5)
S(9.5)S(7.5)S(5.5)S(3.5) S(11.5) S(13.5) S(15.5) S(17.5) S(19.5) 23/2
NO
• Significant overlap between the NO and N2 pure rotational spectra. We expected this to provide real time, in-situ reference to get NO/N2 concentration ratio along with
temperature in flames.
APPLIED LASER SPECTROSCOPY LABORATORYSCHOOL OF MECHANICAL ENGINEERING
Two-Beam Pure Rotational ERE CARSTwo-Beam Pure Rotational ERE CARS
APPLIED LASER SPECTROSCOPY LABORATORYSCHOOL OF MECHANICAL ENGINEERING
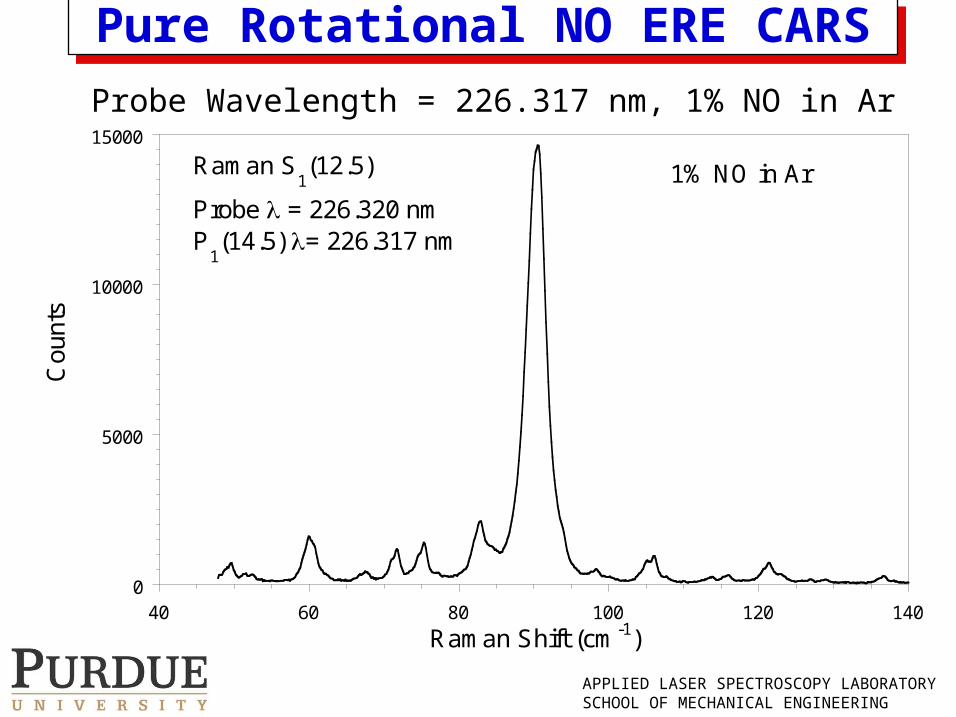
Pure Rotational NO ERE CARSPure Rotational NO ERE CARS
Probe Wavelength = 226.317 nm, 1% NO in Ar
0
5000
10000
15000
40 60 80 100 120 140
Cou
nts
Raman Shift (cm-1)
1% NO in ArRaman S1(12.5)
Probe = 226.320 nmP
1(14.5) = 226.317 nm
APPLIED LASER SPECTROSCOPY LABORATORYSCHOOL OF MECHANICAL ENGINEERING
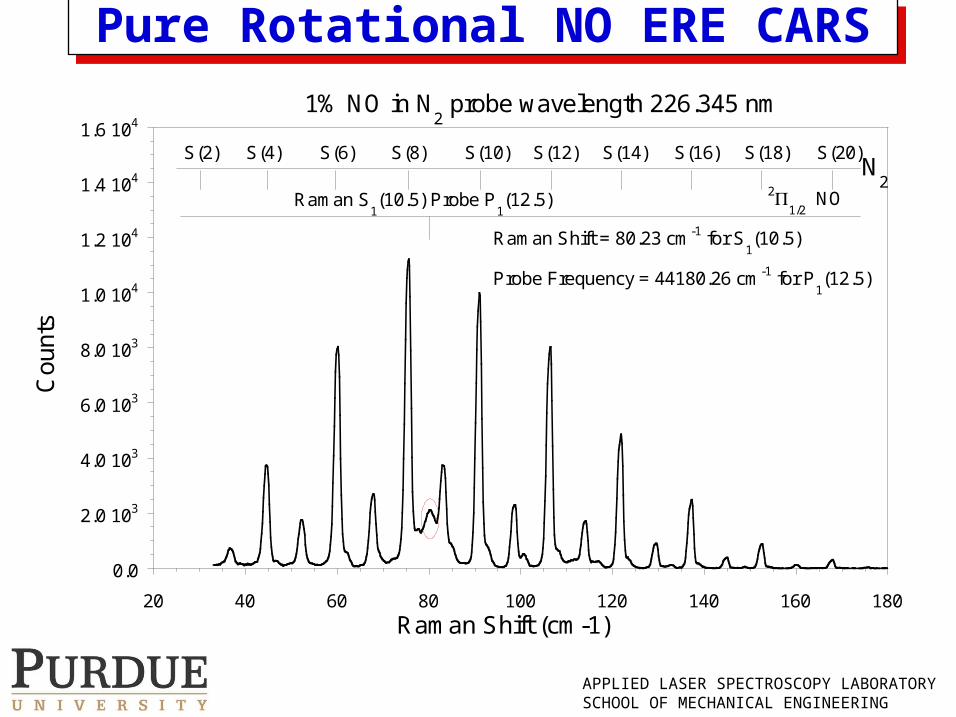
Pure Rotational NO ERE CARSPure Rotational NO ERE CARS
0.0
2.0 103
4.0 103
6.0 103
8.0 103
1.0 104
1.2 104
1.4 104
1.6 104
20 40 60 80 100 120 140 160 180
Co
unts
Raman Shift (cm-1)
1% NO in N2 probe wavelength 226.345 nm
S(8) S(10) S(12) S(14) S(16) S(18) S(20)S(6)S(4)S(2)
Raman S1(10.5) Probe P
1(12.5)
21/2
NO
Raman Shift = 80.23 cm-1 for S1(10.5)
Probe Frequency = 44180.26 cm-1 for P1(12.5)
N2
APPLIED LASER SPECTROSCOPY LABORATORYSCHOOL OF MECHANICAL ENGINEERING
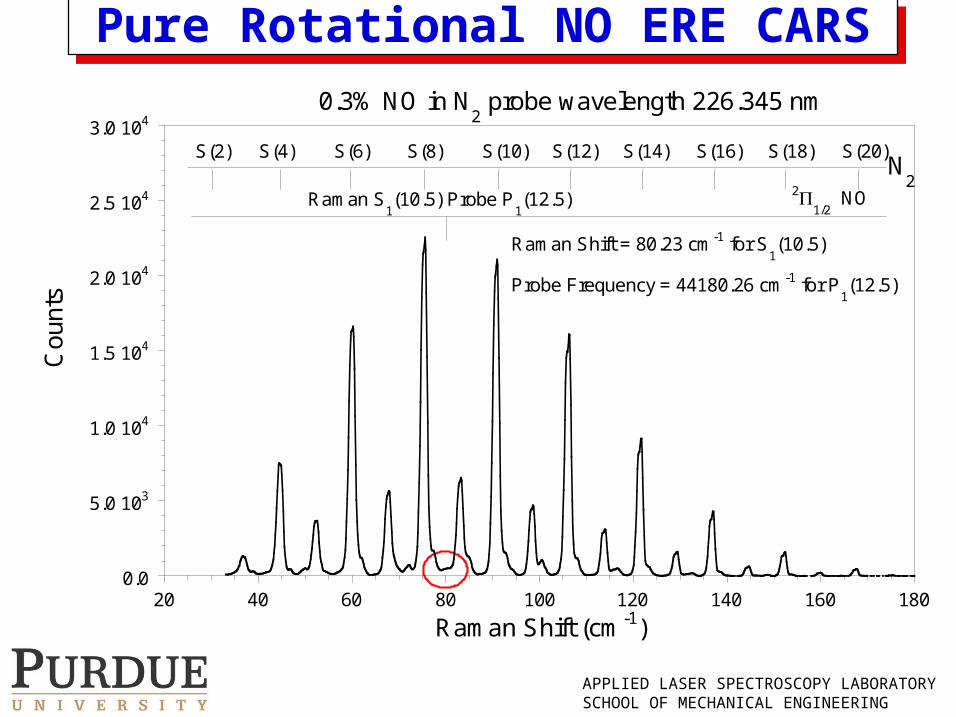
Pure Rotational NO ERE CARSPure Rotational NO ERE CARS
0.0
5.0 103
1.0 104
1.5 104
2.0 104
2.5 104
3.0 104
20 40 60 80 100 120 140 160 180
Co
unts
Raman Shift (cm-1)
S(8) S(10) S(12) S(14) S(16) S(18) S(20)S(6)S(4)S(2)
Raman S1(10.5) Probe P
1(12.5)
21/2
NO
Raman Shift = 80.23 cm-1 for S1(10.5)
Probe Frequency = 44180.26 cm-1 for P1(12.5)
0.3% NO in N2 probe wavelength 226.345 nm
N2