nine months results 2014 - nestlé us...nine months results 2014 nestlé malaysia bhd . 2 agenda...
TRANSCRIPT

1
Financial Analysts’ Briefing 28th October 2014
Nine Months Results 2014
Nestlé Malaysia Bhd

2
Agenda
Introduction & overview
Financials
Questions & answers

3
This presentation contains forward looking statements
which reflect Management’s current views and
estimates. The forward looking statements involve
certain risks and uncertainties that could cause actual
results to differ materially from those contained in the
forward looking statements. Potential risks and
uncertainties include such factors as general
economic conditions, foreign exchange fluctuations,
competitive product and pricing pressures and
regulatory developments.
Disclaimer

4
FINANCIALS
5
Nestlé Model
Nestlé Model – every year
• 5%-6% organic growth
• Margin & EPS growth
• Improving capital efficiency
• Market leadership
6
SALES GROWTH
7
7
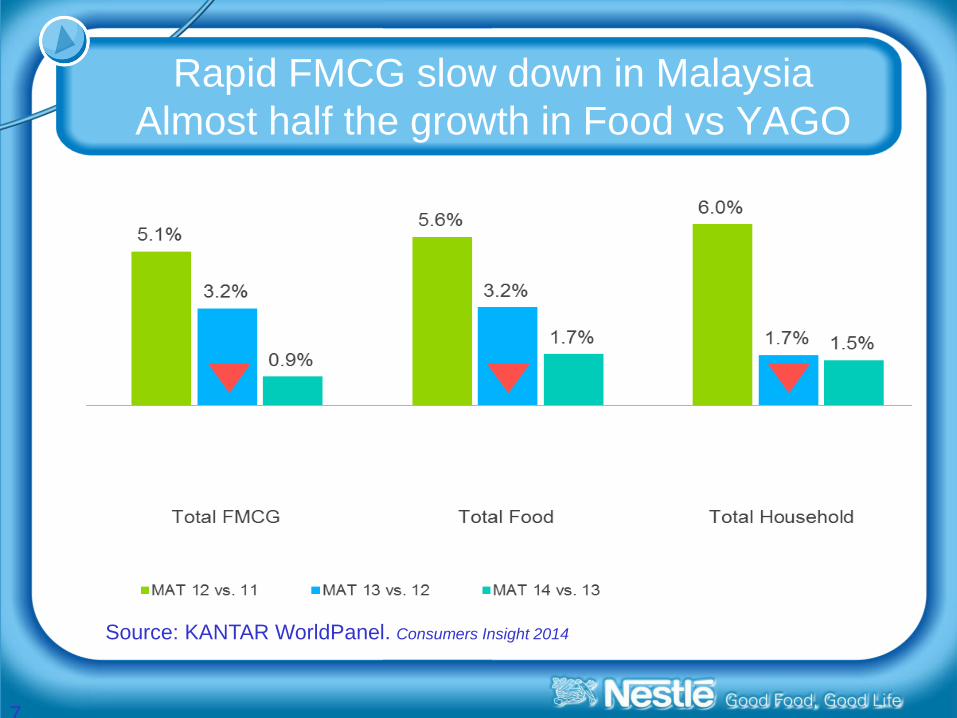
Rapid FMCG slow down in Malaysia
Almost half the growth in Food vs YAGO
Source: KANTAR WorldPanel. Consumers Insight 2014
8
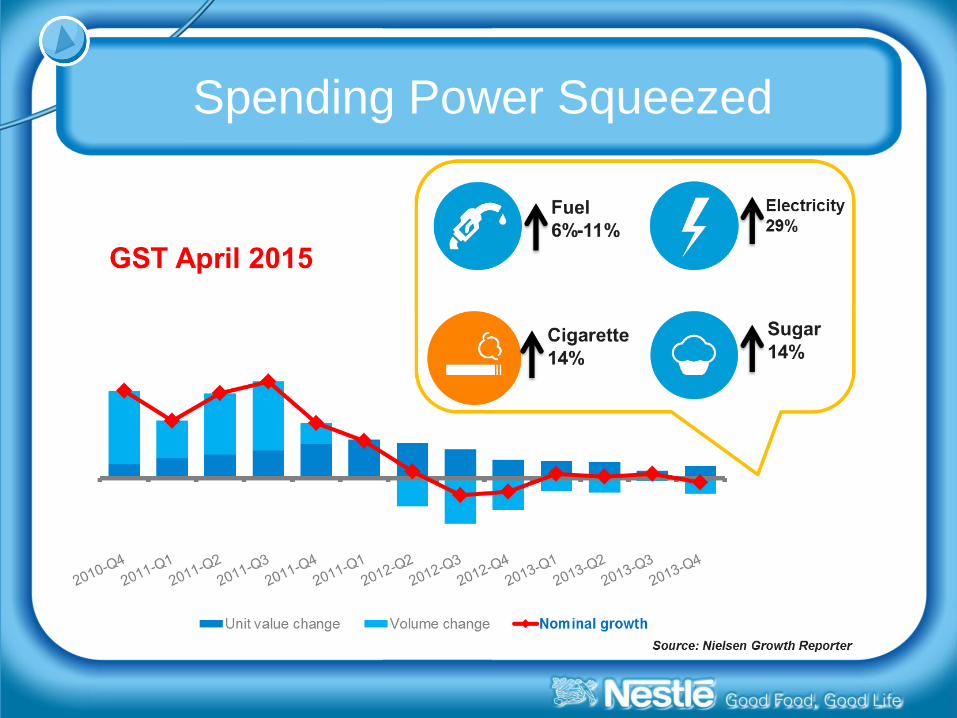
Spending Power Squeezed
9
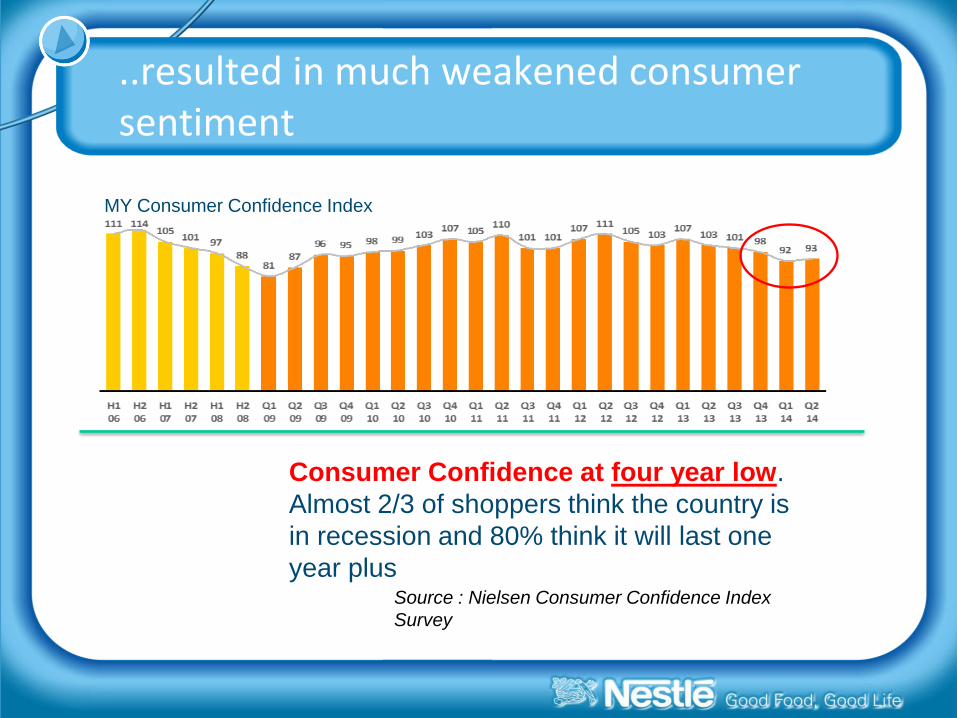
..resulted in much weakened consumer sentiment
Source : Nielsen Consumer Confidence Index
Survey
Consumer Confidence at four year low.
Almost 2/3 of shoppers think the country is
in recession and 80% think it will last one
year plus
MY Consumer Confidence Index

10
2.79 2.95
0.86 0.75
-1
1
3
5
9M 2013 9M 2014
Export sales
Domestic sales
Domestic Sales +5.8%
Export Sales -13.1% +1.4%
RM3.65 Bio RM3.70 Bio
Sales Evolution 9M 2014 vs 9M 2013
11
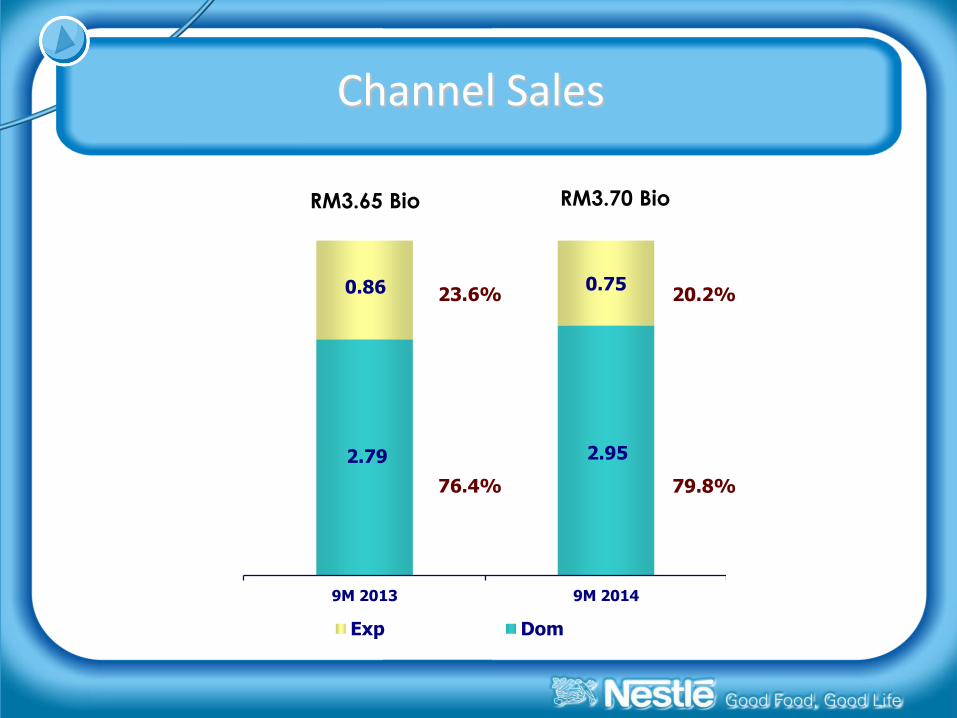
2.79 2.95
0.86 0.75
20%
40%
60%
80%
100%
9M 2013 9M 2014
Exp Dom
23.6%
76.4%
20.2%
79.8%
RM3.65 Bio RM3.70 Bio
Channel Sales

12
Sales by Product Categories

13
Innovation Drive 9M 2014

14
EBITDA MARGIN
15
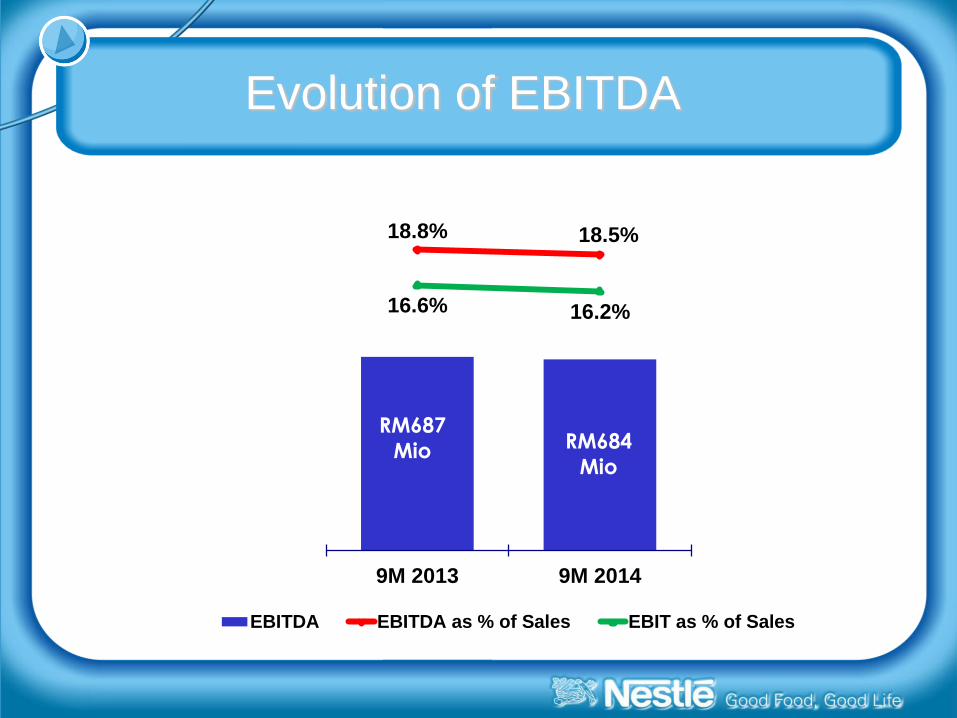
18.8% 18.5%
16.6% 16.2%
0.0%
3.0%
6.0%
9.0%
12.0%
15.0%
18.0%
21.0%
450
500
550
600
650
700
750
800
850
900
9M 2013 9M 2014
EBITDA EBITDA as % of Sales EBIT as % of Sales
Evolution of EBITDA
RM687
Mio RM684
Mio

16

17
Net Profit Evolution
12.6% 12.2%
0%
2%
4%
6%
8%
10%
12%
14%
16%
200
250
300
350
400
450
500
550
600
9M 2013 9M 2014
% of Sales
RM461
Mio RM452
Mio
18
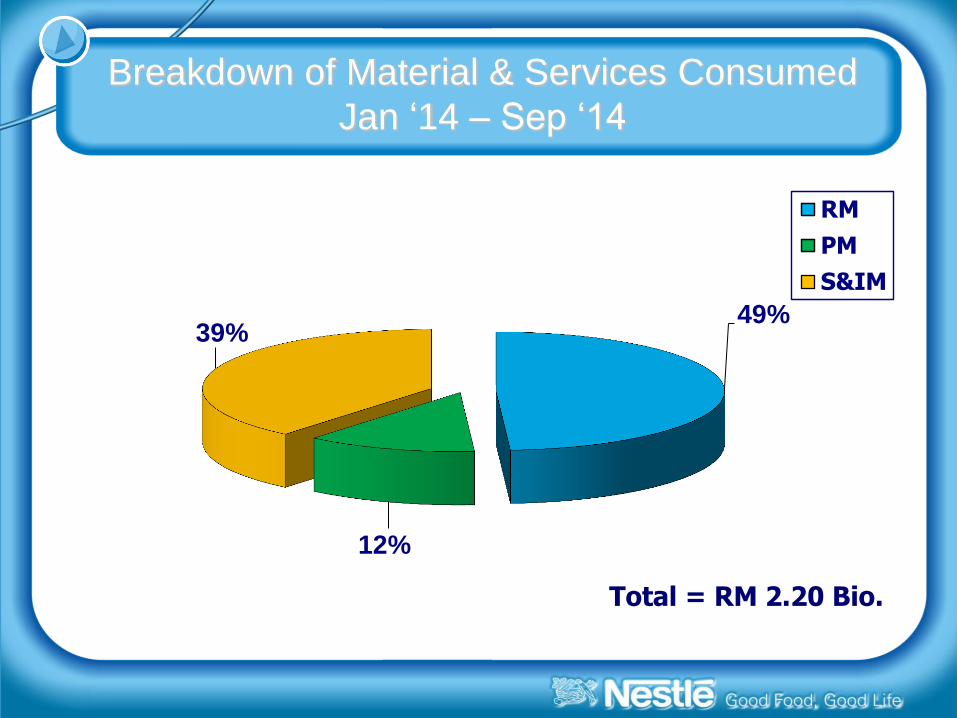
49%
12%
39%
RM
PM
S&IM
Breakdown of Material & Services Consumed
Jan ‘14 – Sep ‘14
Total = RM 2.20 Bio.

19
COMMODITY UPDATES
20
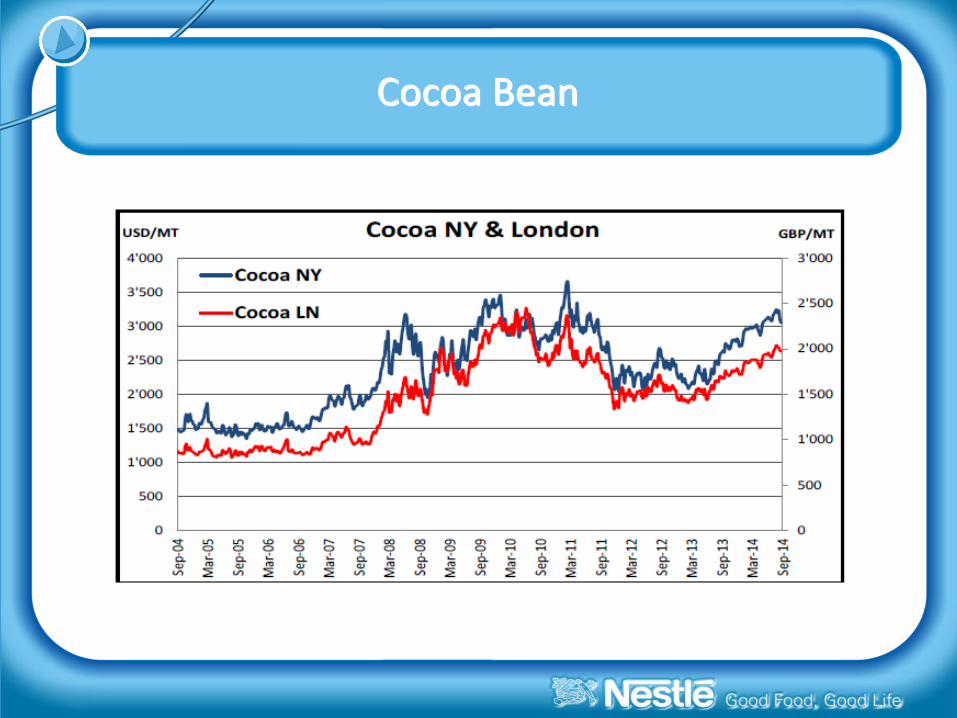
Cocoa Bean
21
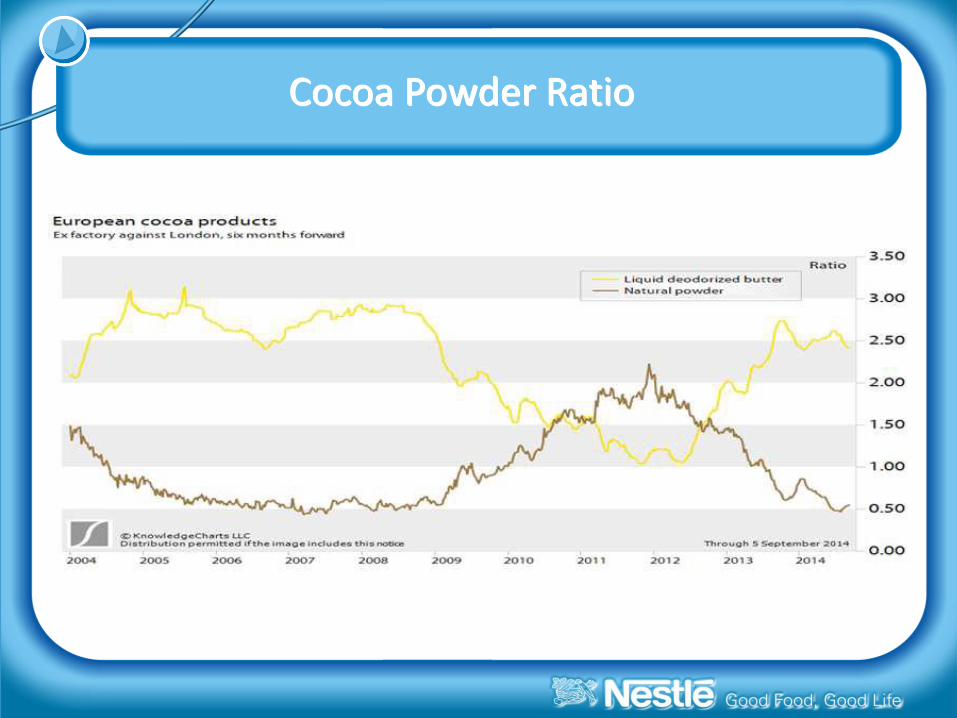
Cocoa Powder Ratio
22
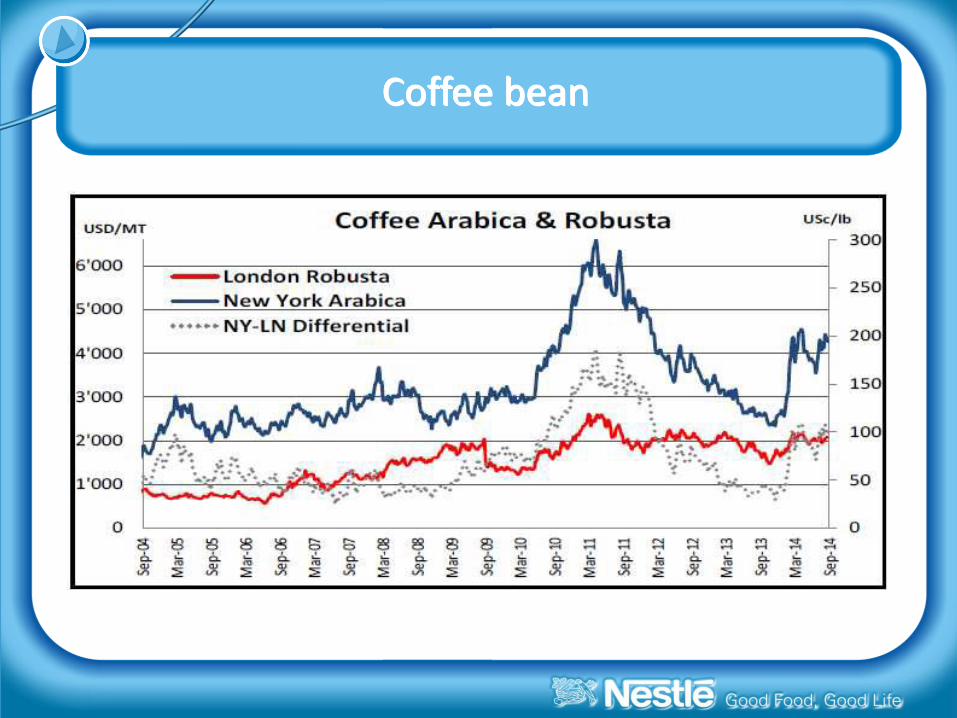
Coffee bean

23
Milk Solids

24
Crude Palm Oil

25
Wheat
26
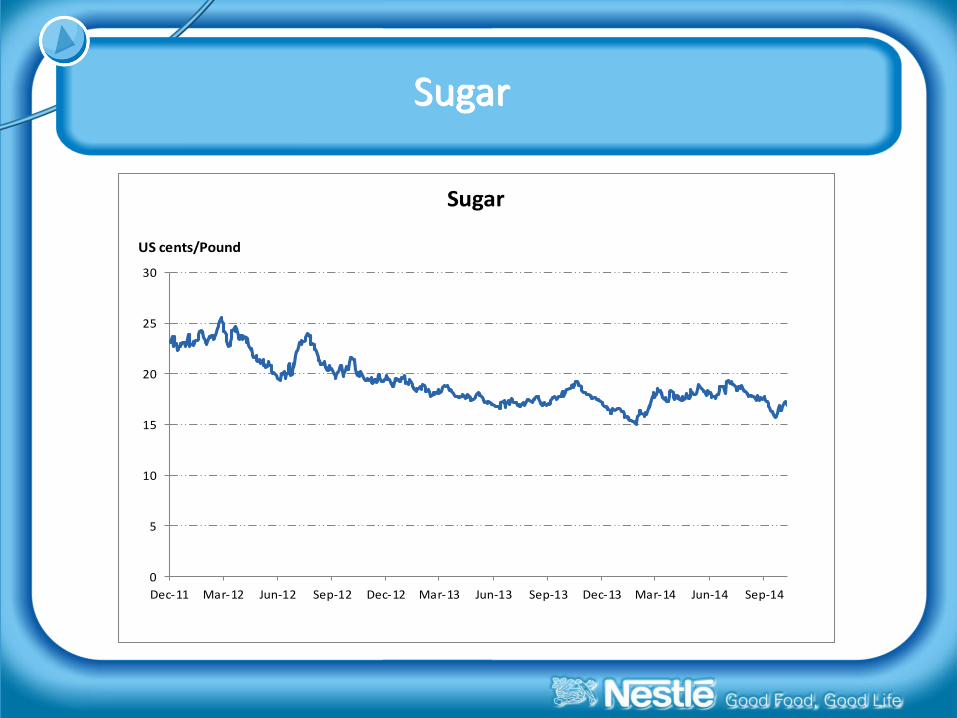
Sugar
0
5
10
15
20
25
30
Dec-11 Mar-12 Jun-12 Sep-12 Dec-12 Mar-13 Jun-13 Sep-13 Dec-13 Mar-14 Jun-14 Sep-14
Sugar
US cents/Pound
27
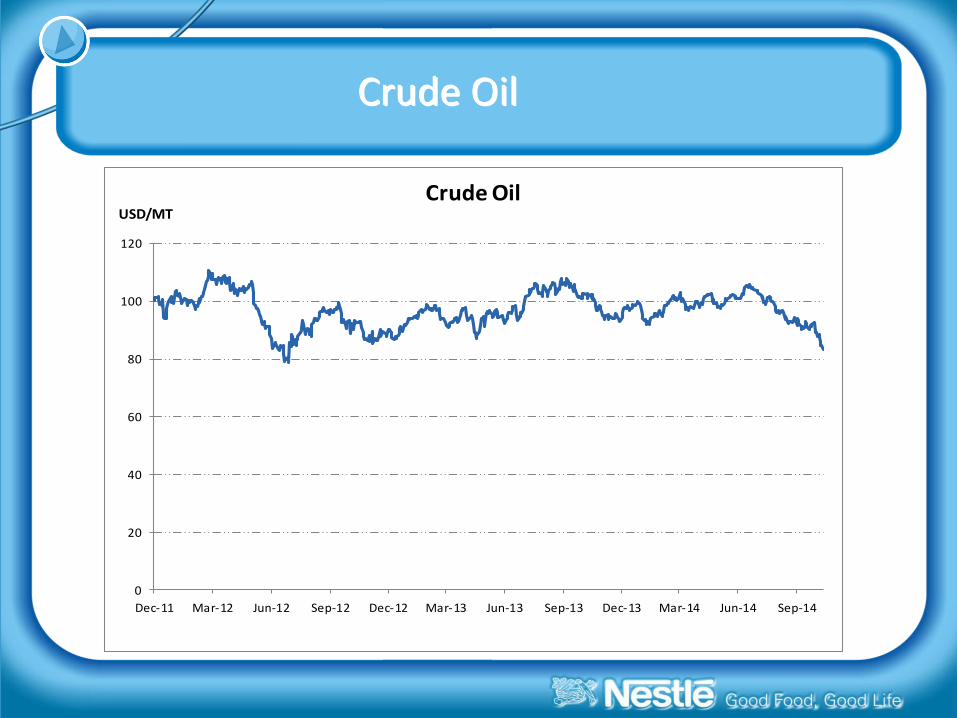
Crude Oil
0
20
40
60
80
100
120
Dec-11 Mar-12 Jun-12 Sep-12 Dec-12 Mar-13 Jun-13 Sep-13 Dec-13 Mar-14 Jun-14 Sep-14
Crude OilUSD/MT

28
NET PROFIT MARGIN

29
MY Trade Net Working Capital
11
.0%
9.3
%
7.3
%
6.6
%
3.7
%
3.6
%
0.0%
2.0%
4.0%
6.0%
8.0%
10.0%
12.0%
200
9
201
0
201
1
201
2
201
3
9M
20
14
ATNWC
30
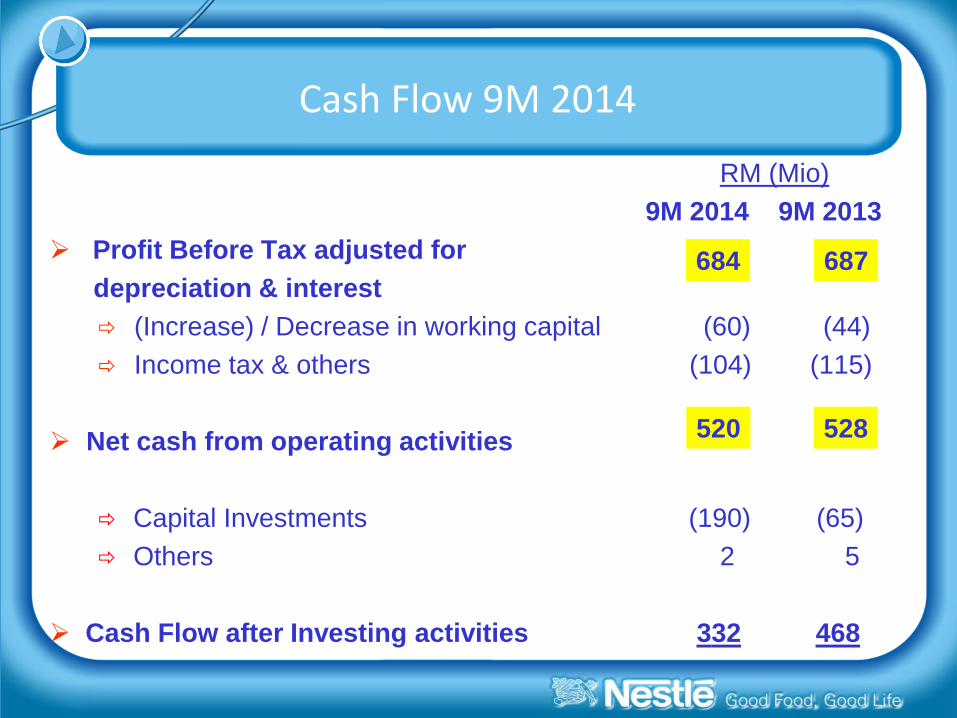
Cash Flow 9M 2014
RM (Mio)
9M 2014 9M 2013
Profit Before Tax adjusted for
depreciation & interest
(Increase) / Decrease in working capital (60) (44)
Income tax & others (104) (115)
Net cash from operating activities
Capital Investments (190) (65)
Others 2 5
Cash Flow after Investing activities 332 468
684 687
520 528

31
Thank You