nine-month financial report 2008 - logwin logistics...business segments 2008 2007 ∆ in % 2008 2007...
TRANSCRIPT
Nine-Month Financial Report 2008Logwin AG

Nine-Month Financial Report 2008
Logwin AG
Key Figures January 1 – September 30, 2008
3rd Quarter
3rd Quarter
in thousand 2
in thousand 2
in thousand 2
Business Segments 2008 2007 ∆ in % 2008 2007 ∆ in %
SolutionsSales 550,564 571,832 –3.7 184,161 198,968 –7.4
Segment Result before Restructuring Costs and Impairments 11,561 21,116 –45.2 4,585 6,848 –32.8Margin 2.1 % 3.7 % 2.5 % 3.4 %
Air + OceanSales 415,694 384,002 8.3 146,712 145,201 1.0
Segment Result before Restructuring Costs and Impairments 16,484 14,102 16.9 6,193 5,736 8.0Margin 4.0 % 3.7 % 4.2 % 4.0 %
Road + RailSales 651,460 608,712 7.0 219,202 190,258 15.2
Segment Result before Restructuring Costs and Impairments 1,620 57 – 509 663 –23.2Margin 0.2 % 0.0 % 0.2 % 0.3 %
9 Months
9 Months
Sept. 30, 2008 Dec. 31, 2007 ∆ in % Sept. 30, 2008 June 30, 2008 ∆ in %
Equity Ratio 26.7 % 34.8 % 26.7 % 34.9 %
Net Financial Debt 134,143 142,786 –6.1 134,143 151,185 –11.3
Number of Employees 8,718 8,483 2.8 8,718 8,580 –1.6
Group 2008 2007 ∆ in % 2008 2007 ∆ in %
Sales 1,572,653 1,527,892 2.9 532,967 526,992 1.1
Gross Profit 118,843 118,165 0.6 40,548 39,489 2.7Margin 7.6 % 7.7 % 7.6 % 7.5 %
Earnings before Interest and Taxes (EBIT) before Restructuring Costs and Impairments 25,005 30,154 –17.1 9,566 12,180 –21.5
Margin 1.6 % 2.0 % 1.8 % 2.3 %
Earnings before Interest and Taxes (EBIT) –72,995 22,291 – –88,434 5,876 –Margin – 1.5 % – 1.1 %
Net Result –90,306 1,464 –94,207 –3,278Attributable to Shareholders of Logwin AG –90,760 752 –94,291 –3,405
Earnings per Share (in €) –0.81 0.01 –0.85 –0.03
Operating Cash Flow 19,026 11,754 23,833 21,480
Net Cash Flow 13,480 -6,679 20,741 16,138
1
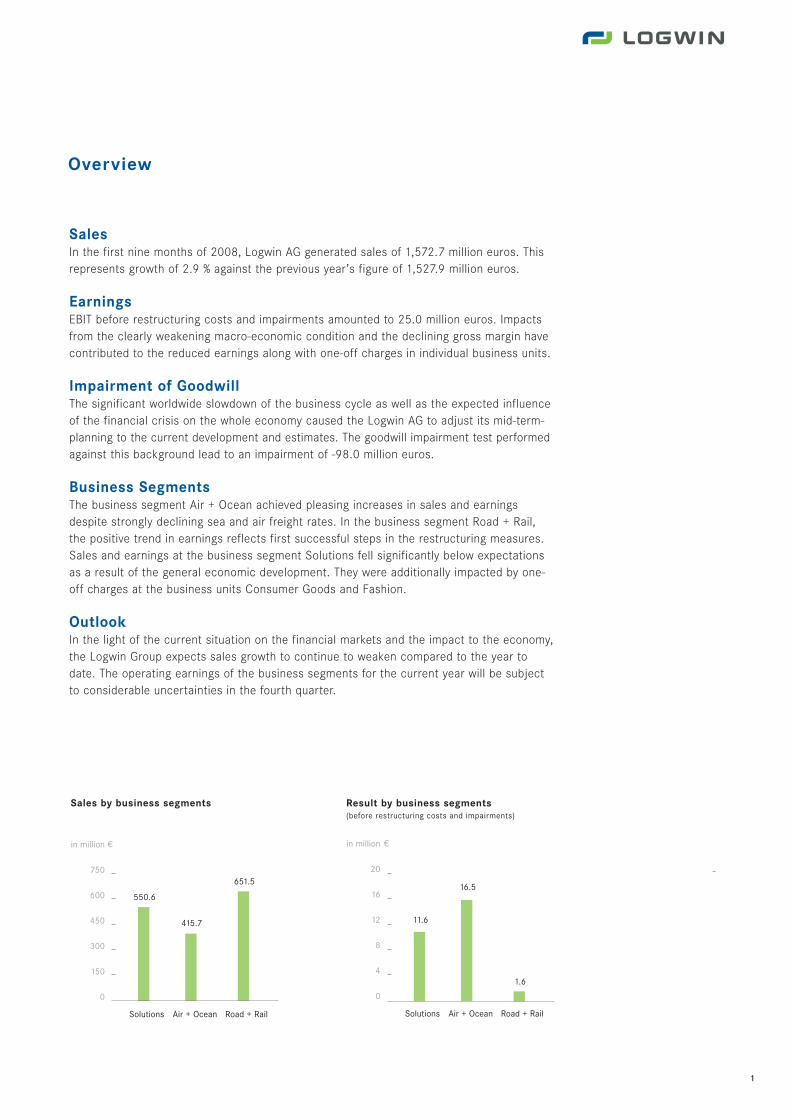
SalesIn the first nine months of 2008, Logwin AG generated sales of 1,572.7 million euros. Thisrepresents growth of 2.9 % against the previous year’s figure of 1,527.9 million euros.
EarningsEBIT before restructuring costs and impairments amounted to 25.0 million euros. Impactsfrom the clearly weakening macro-economic condition and the declining gross margin havecontributed to the reduced earnings along with one-off charges in individual business units.
Impairment of Goodwill The significant worldwide slowdown of the business cycle as well as the expected influenceof the financial crisis on the whole economy caused the Logwin AG to adjust its mid-term-planning to the current development and estimates. The goodwill impairment test performedagainst this background lead to an impairment of -98.0 million euros.
Business SegmentsThe business segment Air + Ocean achieved pleasing increases in sales and earnings despite strongly declining sea and air freight rates. In the business segment Road + Rail,the positive trend in earnings reflects first successful steps in the restructuring measures.Sales and earnings at the business segment Solutions fell significantly below expectationsas a result of the general economic development. They were additionally impacted by one-off charges at the business units Consumer Goods and Fashion.
OutlookIn the light of the current situation on the financial markets and the impact to the economy,the Logwin Group expects sales growth to continue to weaken compared to the year todate. The operating earnings of the business segments for the current year will be subjectto considerable uncertainties in the fourth quarter.
Overview
€in million
750
600
450
300
150
0
Sales by business segments
in million
20
16
12
8
4
0
Result by business segments (before restructuring costs and impairments)
€
550.6
Solutions
415.7
Air + Ocean
651.5
Road + Rail
11.6
Solutions
16.5
Air + Ocean
1.6
Road + Rail

2
Focussed: customers, projects and locations in the 3rd quarter
Logwin's operational highlights in the third quarter included in particular two successfulheavy load projects, the expansion of its network, for example in Brazil, and the furtherdevelopment of cooperation with customers.
Heavy load projects In July Logwin transported a 75 tonne plant for exhaust air treatmentby flat-bed truck and barge from Niemodlin in Poland to Heinsberg near Aachen (Germany)on behalf of Dürr Systems. The second exceptional load followed one month later: in AugustLogwin shipped Russia's largest and most modern sawmill from Germany to Lake Baikal.
New location in Brazil Positive business developments in Brazil were the reasons forLogwin to strengthen its presence there in September. In addition to its existing location inSantos and São Paulo, Logwin is now also present there with two offices in Campinas.
Expansion of cooperation with customers The business unit Fashion assumed respon-sibility for the distribution of hanging garments to Eastern Europe for the Hugo Boss fashiongroup as of October 1. This is effected from the Hugo Boss logistics centre in Metzingen(Germany) to specialist stores in Poland, Hungary, Slovakia, Slovenia, and the Czech Republic.
Logwin will be operating for the new Aldi distribution centre in Domdidier situated in thewest of Switzerland, in the area of transportation, beginning in autumn 2008. In JanuaryLogwin had already increased its area devoted to perishable goods at the Pratteln locationfrom 2,000 square metres to 4,500 square metres. As a result, Logwin now boasts one ofthe largest cold storage capacities in Switzerland.
16 metres long, a good 5 metres wide, over 4 metres high - and that twice over: Logwin transported two halves of a thermal reactor for exhaust air treatment by flat-bed truck and barge over 1,000 kilometres fromNiemodlin in Poland to Heinsberg near Aachen in Germany.
Nine-Month Financial Report 2008
Logwin AG
3
Content
1 Overview
Group Interim Management Report
4 Economic Conditions and Report on the Stock and Corporate Bond
7 Sales and Earnings Development
12 Impairment of Goodwill
13 Financial Position
15 Employees
16 Other Reporting
16 Outlook
Consolidated Interim Financial Statements
18 Consolidated Statement of Income
19 Consolidated Statement of Cash Flows
20 Consolidated Balance Sheet
22 Consolidated Statement of Changes in Shareholders’ Equity
24 Notes to Consolidated Statements
Financial Calendar (Cover)
Imprint (Cover)
Group Interim Management Report
Economic Conditions and Report on the Stock and Corporate Bond
4
Economic Conditions and Report on the Stock
and Corporate Bond
Global economic conditions Macroeconomic developments over the course of the yearhave been dominated by the severe turbulences in the global financial markets. As a conse-quence, the global economic development deteriorated to an unforeseen degree. The maincause for this was the dampened economic activity in the United States already in the firsthalf of the year. Along with the sharp decline in the exchange rate of the US dollar againstthe euro and numerous other currencies, this had a negative effect on economic develop-ment in Asia and, over the course of the year, in Europe as well. The growth of the globaleconomy slowed down noticeably and was already declining in some regions.
As the unpredictable turbulences in the global financial markets occurred, uncertainty grewabout the further development of economies all over the world. The economic forecast for2008 and 2009 has been revised downwards to an increasingly noticeable extent. However,it is still unclear how severe the anticipated recession will be. The OECD has reduced itsexpectations for economic growth in the euro region for 2008 and is now expecting growthof 1.3 % compared with last year, down from its earlier prediction of 1.7 %. Besides thedominant financial crisis, the massive increase in raw material prices had a significanteffect on economic growth in the first half of the year. However, increase slowed to astandstill during the course of the third quarter.
The German economy showed strong growth at the beginning of the year. In the light of thelarge price increases for raw materials and the increasingly unfavourable euro exchangerate, economic development deteriorated in the course of the year 2008. The economic climate in Germany was also characterised by partially drastic reductions in growth fore-casts since it is generally assumed that the German market will be particularly impacted bythe consequences of the financial crisis. DIW Berlin is forecasting economic growth of 1.9 %for 2008. The economy is expected to stagnate in 2009.
Developments in the logistics industry The weakening economy had an impact on salesfigures in transportation. Cost pressures in the German logistics industry stabilised in thethird quarter after significant increases in the first six months of the year. However, therehas thus still been no ease to the industry's cost situation. Due to continuing high competi-tive pressures necessary prices adjustments could not be passed on to customers in fullduring the reporting period.
In addition, growth in the logistics industry was hampered by the partly considerable dropin volumes in the automotive industry as well as in the German textile industry, the otherconsumer goods industry as well as retail.
Developments on the German and European stock markets The stock markets haveexperienced significant losses in the course of 2008. In the first six months of the year,persistent fears about an imminent slowdown in the US economy and further fallout fromthe global financial crisis were responsible for declining stock markets. Owing to thechange in sentiment in many commodity shares and in the US dollar, the stock marketsexperienced a slight recovery at the beginning of the third quarter. Following these initialprice gains, the turbulence generated by the financial crisis resulted in a slump on the globalstock markets. In this volatile market environment the German DAX share index closed at

5
5,831 points on September 30, 2008, representing a loss of 27.7 % compared to the end ofthe previous year. Across the board, small and mid-cap stocks were affected even more sig-nificantly from the financial crisis and the uncertain economic expectations. At the end ofthe reporting period, the development of the SDAX lagged behind the DAX and lost 34.6 %over the same period.
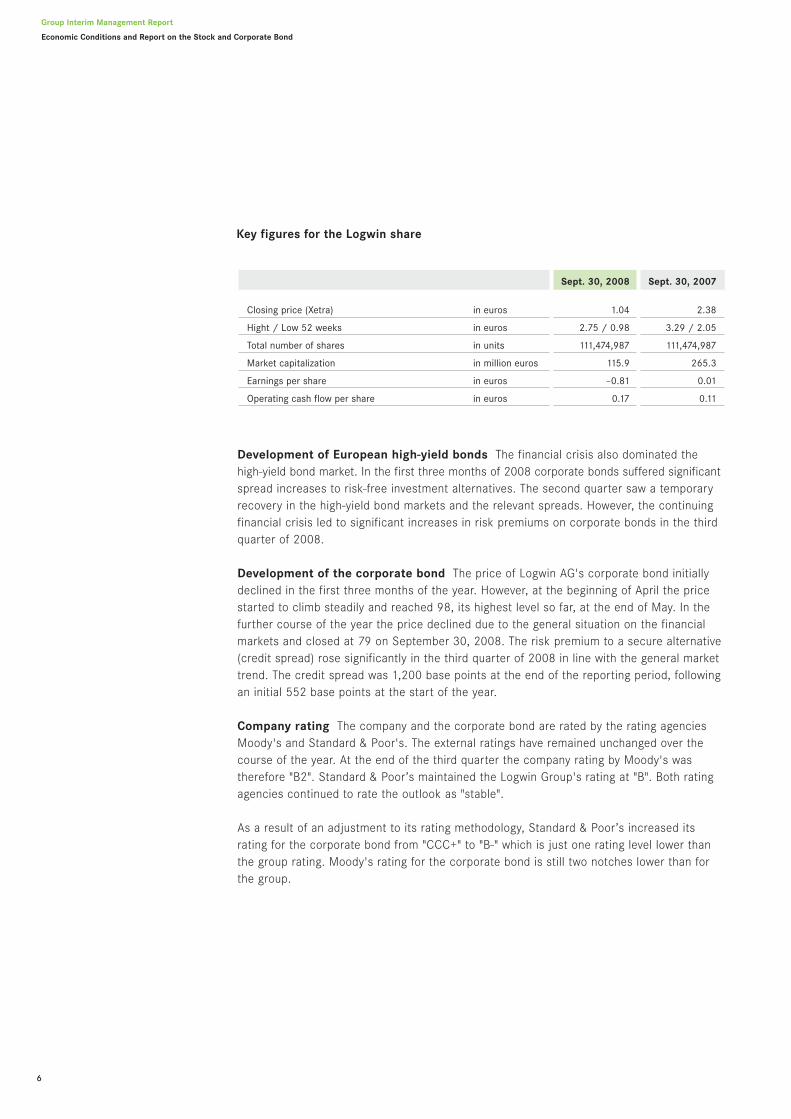
Development of the Logwin share The share price of Logwin AG could not escape theturbulences on the stock markets, despite stable growth in operations during the reportingperiod and despite the successful reorganisation that included the change in companyname. The Logwin AG share price closed at 1.04 euros on September 30, 2008.
A total of 10.7 million Logwin AG shares were traded on all German stock exchanges in thereporting period. This represents a turnover of 18.3 million euros, with the average volumeper trading day amounting to 55,663 shares.
Share ownership and shareholder structure As of September 30, 2008 DELTON AG,Bad Homburg, (Germany), held a majority of shares in Logwin AG through its wholly-ownedsubsidiary DELTON Vermögensverwaltung AG, Bad Homburg.
The members of the Board of Directors and the Executive Committee of Logwin AG do nothold any shares or options to purchase shares in Logwin AG.
Share of Logwin AG vs. benchmark indices (rebased)
in %December 31, 2007 September 30, 2008
Logwin AG SDAX Prime Transport
120
100
80
60
40
20
in %
Development of European high-yield bonds The financial crisis also dominated thehigh-yield bond market. In the first three months of 2008 corporate bonds suffered significantspread increases to risk-free investment alternatives. The second quarter saw a temporaryrecovery in the high-yield bond markets and the relevant spreads. However, the continuingfinancial crisis led to significant increases in risk premiums on corporate bonds in the thirdquarter of 2008.
Development of the corporate bond The price of Logwin AG's corporate bond initiallydeclined in the first three months of the year. However, at the beginning of April the pricestarted to climb steadily and reached 98, its highest level so far, at the end of May. In thefurther course of the year the price declined due to the general situation on the financialmarkets and closed at 79 on September 30, 2008. The risk premium to a secure alternative(credit spread) rose significantly in the third quarter of 2008 in line with the general markettrend. The credit spread was 1,200 base points at the end of the reporting period, followingan initial 552 base points at the start of the year.
Company rating The company and the corporate bond are rated by the rating agenciesMoody's and Standard & Poor's. The external ratings have remained unchanged over thecourse of the year. At the end of the third quarter the company rating by Moody's wastherefore "B2". Standard & Poor’s maintained the Logwin Group's rating at "B". Both ratingagencies continued to rate the outlook as "stable".
As a result of an adjustment to its rating methodology, Standard & Poor’s increased itsrating for the corporate bond from "CCC+" to "B-" which is just one rating level lower thanthe group rating. Moody's rating for the corporate bond is still two notches lower than forthe group.
Group Interim Management Report
Economic Conditions and Report on the Stock and Corporate Bond
6
Sept. 30, 2008 Sept. 30, 2007
Closing price (Xetra) in euros 1.04 2.38
Hight / Low 52 weeks in euros 2.75 / 0.98 3.29 / 2.05
Total number of shares in units 111,474,987 111,474,987
Market capitalization in million euros 115.9 265.3
Earnings per share in euros –0.81 0.01
Operating cash flow per share in euros 0.17 0.11
Key figures for the Logwin share
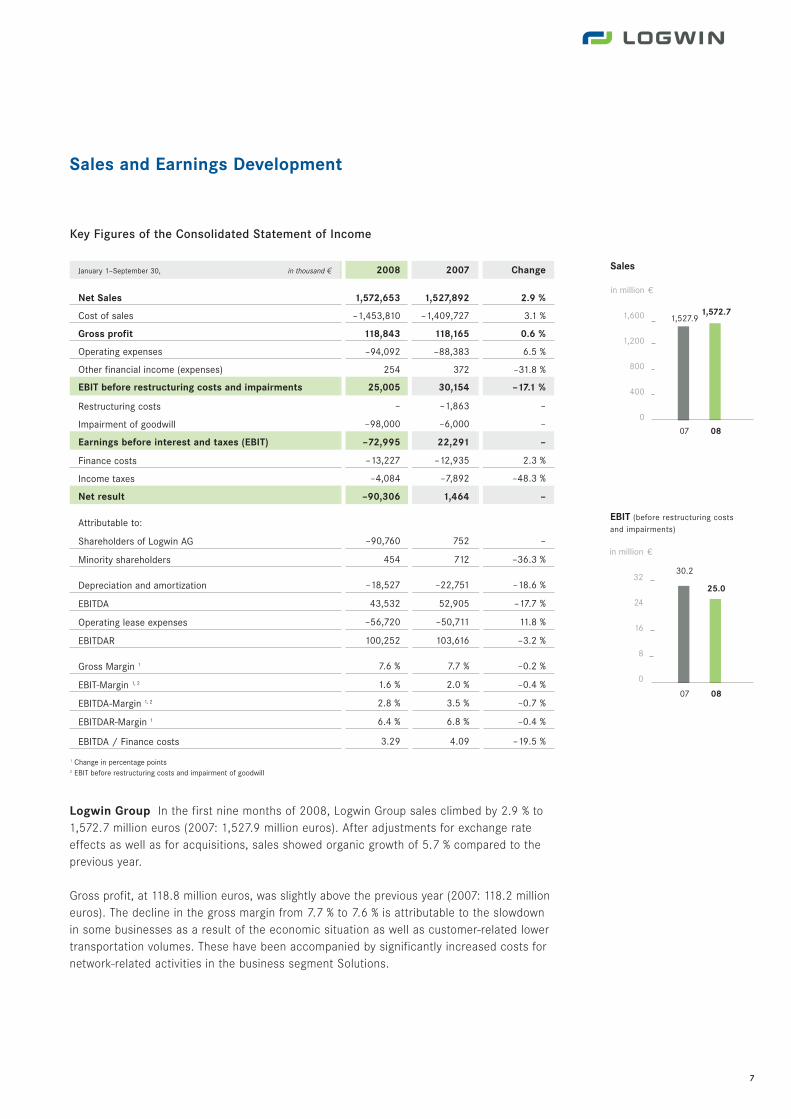
Sales
1,527.91,572.7
07 08
in million
1,600
1,200
800
400
0
Sales and Earnings Development
Logwin Group In the first nine months of 2008, Logwin Group sales climbed by 2.9 % to1,572.7 million euros (2007: 1,527.9 million euros). After adjustments for exchange rateeffects as well as for acquisitions, sales showed organic growth of 5.7 % compared to theprevious year.
Gross profit, at 118.8 million euros, was slightly above the previous year (2007: 118.2 millioneuros). The decline in the gross margin from 7.7 % to 7.6 % is attributable to the slowdownin some businesses as a result of the economic situation as well as customer-related lowertransportation volumes. These have been accompanied by significantly increased costs fornetwork-related activities in the business segment Solutions.
Key Figures of the Consolidated Statement of Income
January 1–September 30, in thousand 2 2008 2007 Change
Net Sales 1,572,653 1,527,892 2.9 %
Cost of sales –1,453,810 –1,409,727 3.1 %
Gross profit 118,843 118,165 0.6 %
Operating expenses –94,092 –88,383 6.5 %
Other financial income (expenses) 254 372 –31.8 %
EBIT before restructuring costs and impairments 25,005 30,154 –17.1 %
Restructuring costs – –1,863 –
Impairment of goodwill –98,000 –6,000 –
Earnings before interest and taxes (EBIT) –72,995 22,291 –
Finance costs –13,227 –12,935 2.3 %
Income taxes –4,084 –7,892 –48.3 %
Net result –90,306 1,464 –
Attributable to:
Shareholders of Logwin AG –90,760 752 –
Minority shareholders 454 712 –36.3 %
Depreciation and amortization –18,527 –22,751 –18.6 %
EBITDA 43,532 52,905 –17.7 %
Operating lease expenses –56,720 –50,711 11.8 %
EBITDAR 100,252 103,616 –3.2 %
Gross Margin 1 7.6 % 7.7 % –0.2 %
EBIT-Margin 1, 2 1.6 % 2.0 % –0.4 %
EBITDA-Margin 1, 2 2.8 % 3.5 % –0.7 %
EBITDAR-Margin 1 6.4 % 6.8 % –0.4 %
EBITDA / Finance costs 3.29 4.09 –19.5 %
1 Change in percentage points2 EBIT before restructuring costs and impairment of goodwill
7
€
EBIT (before restructuring costs and impairments)
€in million
32
24
16
8
0
30.2
25.0
07 08
Group Interim Management Report
Sales and Earnings Development
8
In the nine-month period ending September 30, 2008, operating costs were -94.1 millioneuros compared to -88.4 million euros in the previous year. In addition to growth effects,the comparison to the previous year reveals planned additional expenditures for the imple-mentation of the new brand and noticeably higher cost of bad debts.
Depreciation included in the cost of sales and operating expenses amounted to -18.5 millioneuros (2007: -22.8 million euros). The reason for the reduction is the additional adjustmentof business models to leasing solutions tailored to market needs that resulted in a plannedreduction in depreciation.
EBIT before restructuring costs and impairments amounted to 25.0 million euros. Thisamount includes around 3.0 million euros incurred for the implementation of the Logwinbrand across the group. In addition to the one-off expenses in individual units of the busi-ness segment Solutions, the earnings also suffered as a result of the noticeably weakeningeconomic situation and the decline in the gross margin. Adjusted for one-off effects, theoperating income for the nine months was slightly lower than the previous year figure(2007: 30.2 million euros).
The altered conditions and the correspondingly adjusted medium-term planning of theLogwin Group’s business segments effected a goodwill impairment test. The test resulted inan impairment of goodwill in the amount of -98.0 million euros (2007: -6.0 million euros).Thereof, -62.5 million euros (2007: -6.0 million euros) is attributable to the business seg-ment Solutions and -35.5 million euros (2007: 0.0 million euros) is attributable to the busi-ness segment Road + Rail. Burdened by the impairment, EBIT of the Logwin Group amountsto -73.0 million euros (2007: 22.3 million euros). For detailed information on the goodwillimpairment test, please refer to section “Impairment of Goodwill” on page 12 in this report.
At -13.2 million euros, finance expenses are slightly above the previous year’s level (2007: -12.9 million euros). At -4.1 million euros, income taxes were in line with expectations(2007: -7.9 million euros). Net result amounted to -90.3 million euros. Excluding the impairment of goodwill, the net result would have resulted in 7.7 million euros.
Solutions The business segment Solutions implements comprehensive full-service solutionsfor its customers. The portfolio of services ranges from industry-specific supply chainmanagement and warehousing to logistics value-added services and complete outsourcingprojects. Owing to its close integration with customer processes, the business segmentSolutions provides a high level of competence in process management and the develop-ment of customised IT solutions. With its four business units Industrial Goods, ConsumerGoods, Fashion and Media, Solutions implements innovative and comprehensive customersolutions using its unique industry know-how.
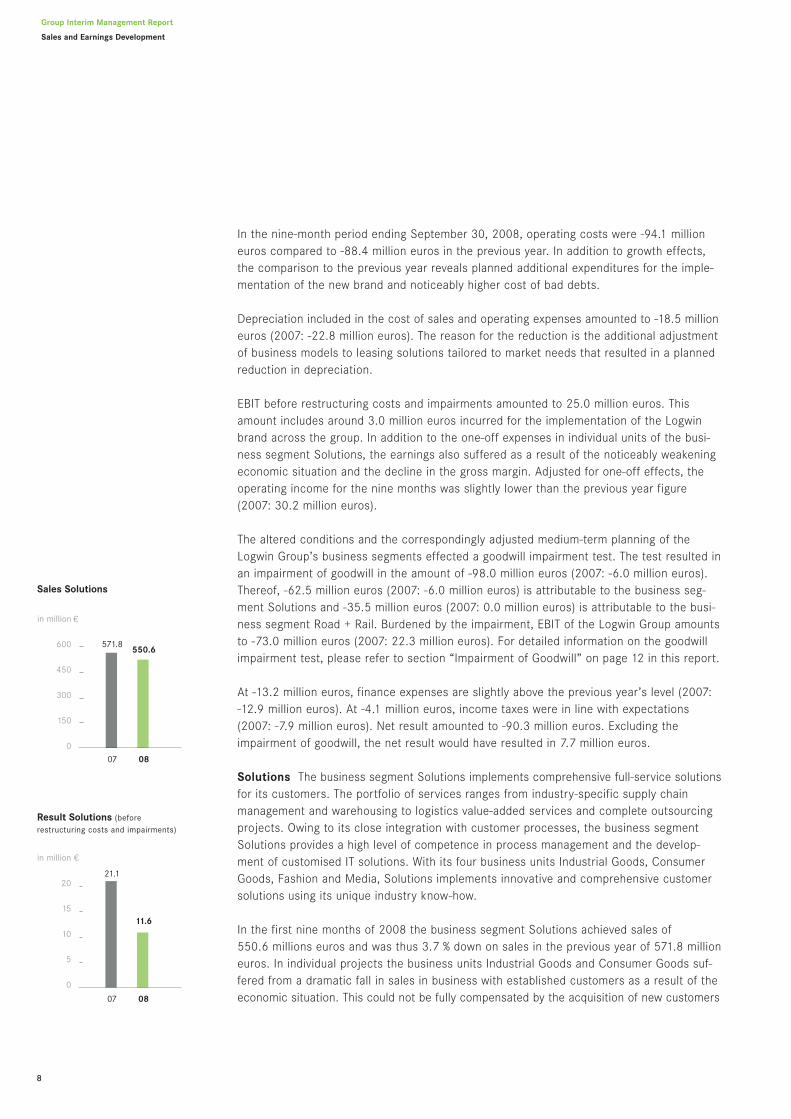
In the first nine months of 2008 the business segment Solutions achieved sales of 550.6 millions euros and was thus 3.7 % down on sales in the previous year of 571.8 millioneuros. In individual projects the business units Industrial Goods and Consumer Goods suf-fered from a dramatic fall in sales in business with established customers as a result of theeconomic situation. This could not be fully compensated by the acquisition of new customers
Result Solutions (before restructuring costs and impairments)
in million
20
15
10
5
0
Sales Solutions
in million
600
450
300
150
0
€
€
571.8550.6
07 08
21.1
11.6
07 08

9
and the planned expansion of activities for existing customers. Moreover, the business unitFashion is experiencing declining sales due to one-off effects and against the backgroundof weak growth in the fashion retail in Germany. These are partially resulting in an under-utilisation of the special network and clearly curbing the business unit's sales growth. Salesin the business unit Media also declined due to lower transportation volumes.
The result of the business segment Solutions in the reporting period amounted to 11.6 millioneuros, following 21.1 million euros in the same period last year. The operating margin was2.1 % (2007: 3.7 %). The period for the previous year includes earnings contributions fromdiscontinued customer projects as well as the proceeds from a disposal. The developmentin the result at the business unit Fashion was due to declining hanging garment volumes inbusiness with existing customers and significantly increased transportation costs, accom-panied by continuing strong competitive pressures. The acquisition of new customers andgrowth in flat-packed volumes were not able to compensate for these negative effects onearnings. Bad debt caused an additional burden. Despite similar declining sales, the businessunit Media achieved a slight increase in earnings compared to the previous year.
In the first nine months of 2008, the business segment Solutions optimised and expandedits network of locations in Eastern Europe. Textile logistics are successfully extending theservice range of the business segment Road + Rail in this region. In the reporting period,the business segment was able to conclude an agreement for services such as storage,picking and transport as well as quality control for incoming and outgoing perishable goodsfor a retail chain in Switzerland.
Air + Ocean The business segment Air + Ocean organises air and ocean transportationworldwide and develops efficient and comprehensive logistics solutions. The business seg-ment provides tailored and customer-specific transportation and logistics solutions withadditional services such as warehousing, picking and distribution. The business segmentcoordinates the complete supply chain from the selection of the right carrier through toreliable transportation services. Air + Ocean develops individual logistics solutions for itscustomers supported by a large international network of locations in its business unitsEurope Middle East, South East Asia, Far East, Americas and Africa.
In the first nine months of 2008 the business segment Air + Ocean increased sales by 8.3 %from 384.0 million euros in the previous year to 415.7 million euros. The decline in sea andair freight rates caused a slowdown in sales growth in the third quarter. While the develop-ment in the core European market continued to be in line with expectations, the reportingperiod saw a noticeable cooling off in the previously extremely positive growth dynamics inparticular in the Asian business units. The partially dramatic decline in freight rates had adirect effect on sales growth in the business segment Air + Ocean. Exchange rates effectsdue to the development of the US dollar served contributed to the situation, in particular inthe first half of the year.
Result Air + Ocean (before restructuring costs and impairments)
in million
20
15
10
5
0
Sales Air + Ocean
in million
450
300
150
0
€
€
384.0415.7
07 08
14.1
16.5
07 08
10
Group Interim Management Report
Sales and Earnings Development
In the weakening market environment, earnings in the business segment climbed from 14.1 million euros in the previous year to 16.5 million euros. This corresponds to a verypleasing growth of 16.9 %. The operating margin increased to 4.0 % (2007: 3.7 %). The earnings increase was the result of growth generated in the reporting period and the conti-nued improvement of internal processes, in particular in the business unit Europe MiddleEast. In contrast, earnings growth in the first nine months of 2008 slowed down as a resultof declining business with existing customers in the business unit Americas and by reducedvolumes in the business unit Africa. Against the background of a noticeable slowing salesgrowth, the trend in operating profit and margin underlines the success of the intendedexpansion in the air and ocean transportation business within the Logwin Group.
The business segment continued to extend its network in the first nine months of the year.A new country organisation was established in Mexico, a new location opened in Campinasin Brazil, the country organisation in Peru was integrated into the globally standardised ITsystem for freight processing and a new office was opened in Taiwan. The automated pick-by-light system in Poland operating as part of a successful comprehensive customer projectreached the anticipated level of productivity following its completion.
New customers were acquired mainly in the business units Far East and South East Asia.The focus is on customers in the manufacturing and trading of consumer and industrialgoods industries with activities in China, Hong Kong, Thailand, Vietnam, Indonesia andAustralia. Positive impulses were to be seen towards the end of the reporting period intransportation between Mexico and its main trading partner, the United States. Impulsesfor growth in the business units Europe Middle East and South East Asia came primarilyfrom business with existing customers.
Road + Rail With its business segment Road + Rail, Logwin provides its customers withefficient concepts in road and rail transportation. Logwin is a specialist in land transportationand has many years experience in special pan-European transportation and customer-specificand industry-related solutions. With its business units Western Europe, Central Europe andEastern Europe, the business segment Road + Rail integrates the economic centres ofWestern and Eastern Europe into one network. In addition to offering access to its network,Road + Rail provides customised transport concepts for individual and special loads suchas regional transportation, block trains or tank and silo logistics.
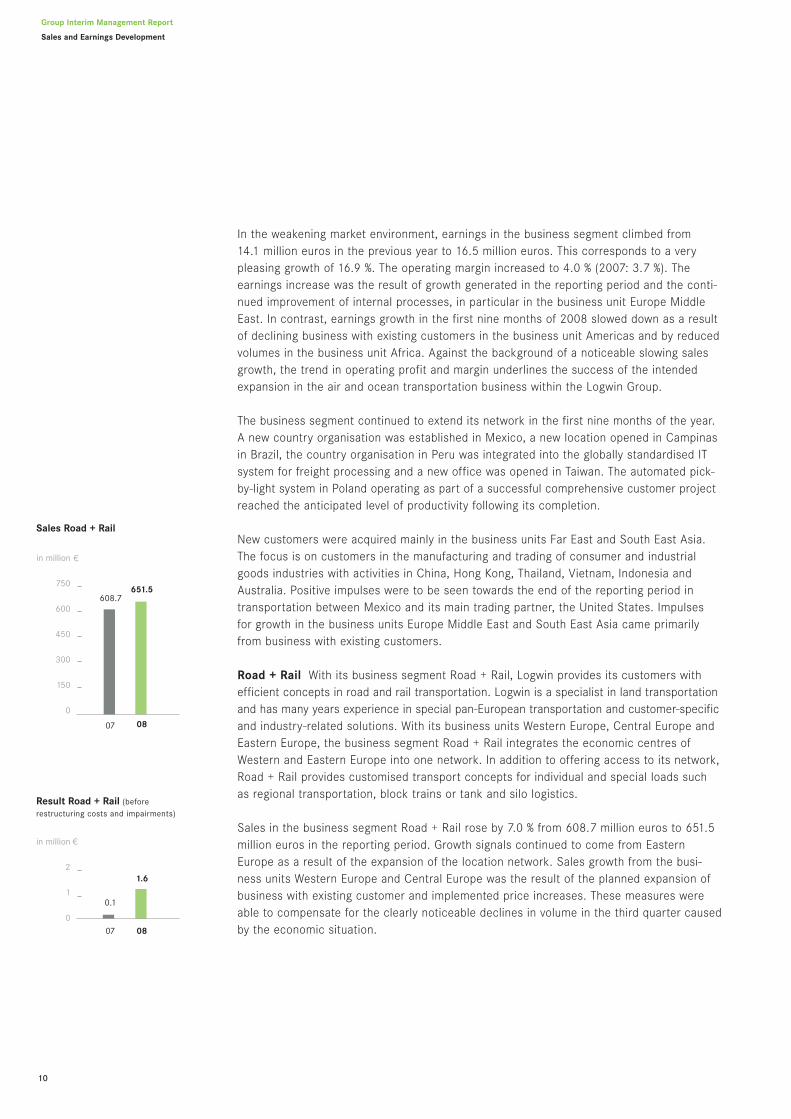
Sales in the business segment Road + Rail rose by 7.0 % from 608.7 million euros to 651.5million euros in the reporting period. Growth signals continued to come from EasternEurope as a result of the expansion of the location network. Sales growth from the busi-ness units Western Europe and Central Europe was the result of the planned expansion ofbusiness with existing customer and implemented price increases. These measures wereable to compensate for the clearly noticeable declines in volume in the third quarter causedby the economic situation.
€
€
Result Road + Rail (before restructuring costs and impairments)
in million
2
1
0
Sales Road + Rail
in million
750
600
450
300
150
0
0.1
1.6
07 08
608.7651.5
07 08

11
The business segment Road + Rail achieved a result of 1.6 million euros after 0.1 millioneuros in the previous year. The positive trend in earnings reflects first successful steps in itsrestructuring measures: costs have been reduced at locations with insufficient profitabilityand clear progress has been made in capacity utilisation and the profitability of individualcustomer transactions. Activities showing little prospect of satisfactory profitability in theshort term are being terminated. Increased earnings were primarily the result of developmentsin the business units Central Europe and Western Europe.
The business segment Road + Rail continued to expand its customer-specific internationaltransport concepts in the reporting period. In line with the strategy of consistently increa-sing profitability, the focus lay on continuing to harmonise processes for freight handlingand in the administrative area. The measures introduced helped to offset the increasedcosts due to the development of diesel prices particularly apparent in the first half of 2008and the weakening economic conditions in the main European markets. New customerswere gained in all business units.

12
Group Interim Management Report
Impairment of Goodwill | Financial Position
Impairment of Goodwill
Incoming orders and business volumes of the Logwin Group have deteriorated significantlyfor mainly cyclical reasons in recent weeks. Customers’ expectations indicate a subduedeconomic activity for the business cycle in the coming years. For example, this relates tothe noticeably weaker demand on high-quality fashion and garment, or the temporary stopof production by some automotive manufacturers. This has a direct impact on Logwin as alogistics provider in the supply chain of these industries. It will result in a significantincrease in the competition for logistics business.
Furthermore, the worldwide financial crisis and its effects on the economy makes a reliablemid-term-planning much more difficult. An aggravation of the debt financing conditions las-ting over the mid-term has to be expected. Despite the fact that the financial situation ofthe Logwin Group is currently stable due to the Corporate Bond, increases in the financingcosts cannot be ruled out.
For these reasons, the Board of Directors and the Executive Committee of the Logwin AGhave decided to adjust its medium-term planning taking into account the current develop-ment and estimates. The new plan also contains the estimates for the fourth quarter of thecurrent year as well as the figures of the 2009 business plan of the business segments.The information gained from these processes were the trigger to perform a goodwill impair-ment test.
As a result of the impairment test, the goodwill of the business segments Solutions andRoad + Rail has to be impaired significantly. The adjusted medium-term planning shows anEBIT margin of 2.5 %. This leads to an impairment of goodwill for the business segmentSolutions of -62.5 million euros and of -35.5 million euros for the business segment Road + Rail. For the business segment Solutions, an enduring EBIT margin of 3.0 % and forthe business segment Air + Ocean an EBIT margin of 3.2 % was estimated, while for thebusiness segment Road + Rail an EBIT margin of 2.0 % was applied. The “Weighted AverageCosts of Capital” (WACC) amounted to 8.5 %. For the calculation of the so called “TerminalValue” a growth rate of 1.5 % was assumed and an accordant discount on the WACC wasconsidered.
Assuming only a slight increase in the EBIT margin compared to the actual level over a lon-ger period of time, an even stronger increase in the costs of capital cannot be ruled out. Insuch a scenario, the impairment on the goodwill of the business segments Solutions andRoad + Rail would be even higher.

Financial Position
Cash flow The Logwin Group's operating cash flow developed extremely positively andcame in at 19.0 million euros at the end of the reporting period (2007: 11.8 million euros).Markedly lower funds were tied up in working capital than in the previous year.
The continued restrained investing activity along with adjustments in the asset structuredue to operations and aimed at making business models more flexible contribute to thechange in the cash flow from investing activities from -18.4 million euros to -5.5 millioneuros. In the previous year, payments included investment outflows for the location atFeldkirch-Tosters. Payments from divestments amounting to 8.1 million euros (2007: 4.1 million euros) are due to the sale of real estate, miscellaneous equipment and marginalactivities. The acquisition of subsidiaries concerned the planned payment of instalments forbolt-on acquisitions from previous years.
13
Net cash flow = Operating cash flow - Cash flow from investing activitiesFree cash flow = Operating cash flow - Capital expenditure (payments)
Cash Flow Statement
January 1–September 30, in thousand 2 2008 2007
Earnings before interest and taxes (EBIT) –72,995 22,291
Depreciation and amortization 116,527 28,751
Restructuring costs – 1,863
Earnings before interest, taxes, depreciation and amortization (EBITDA) 43,532 52,905
Interest payments –8,297 –8,706
Income tax payments –9,610 –9,745
Changes in working capital –8,492 –19,804
Other reconciliations 1,893 –2,896
Operating cash flow 19,026 11,754
Capital expenditure –9,951 –13,838
Desinvestments 8,147 4,099
Aquisitions of subsidiaries –4,545 –8,462
Other changes in cash flow from financing activities 803 –232
Cash flow from investing activities –5,546 –18,433
Net cash flow 13,480 –6,679
Changes in financial liabilities –2,963 524
Other changes in cash flow from financing activities –6,003 –7,104
Cash flow from financing activities –8,966 –6,580
Effects of exchange rate changes on cash 435 – 300
Changes in cash and cash equivalents 4,949 –13,559
Cash and cash equivalents at the end of period 70,575 50,216
Free cash flow 9,075 –2,084
€
€
Operating cash flow
in million
20
15
10
5
0
Net cash flow
in million
15
10
5
0
–5
–10
11.8
19.0
07 08
–6.7
13.5
07 08

14
Group Interim Management Report
Financial Position | Employees
At 13.5 million euros, net cash flow was significantly up on last year's level of -6.7 millioneuros as a result of the improvement in operating cash flow and the reduced outflows frominvesting activities.
Cash flow from financing activities was -9.0 million euros (2007: -6.6 million euros).Outflows were attributable to the planned reduction in long-term liabilities and the prematu-re repayment of leasing liabilities based on operational needs.
Asset and Capital Structure
in thousand 2 Sept. 30, 2008 Dec. 31, 2007 Change
Assets
Cash and cash equivalents 70,575 65,626 7.5 %
Trade accounts receivable 317,423 285,572 11.2 %
Prepaid expenses and other current assets 52,229 46,658 11.9 %
Property, plant and equipment 183,223 195,764 –6.4 %
Intangible assets 15,087 15,735 –4.1 %
Goodwill 181,584 277,133 –34.4 %
Other long-term assets 25,652 25,816 –2.0 %
Total assets 845,773 912,304 –7.3 %
Liabilities and shareholders’ equity
Short-term financial liabilities 10,032 8,537 17.5 %
Trade accounts payable 275,763 253,043 9.0 %
Other short-term provisions and liabilities 89,521 83,094 7.7 %
Long-term financial liabilities 32,964 33,693 –2.2 %
Bonds payable 127,037 126,642 0.3 %
Other long-term provisions and liabilities 84,700 89,376 –5.2 %
Shareholders’ equity (including minority interests) 225,756 317,919 –28.9 %
Total liabilities and shareholders’ equity 845,773 912,304 –7.3 %
Key figures to the Balance Sheet
Equity ratio 1 26.7 % 34.8 % –8.1 %
Gross financial debt 204,717 208,412 –1.8 %
Net financial debt 134,143 142,786 –6.1 %1 Changes in percentage points
Shareholders’ equity(incl. minority interests)
317.9
225.8
07 08
in million
400
300
200
100
0
Gross financial debt
208.4 204.7
07 08
in million
250
200
150
100
50
0
€
€
Balance sheet Total assets decreased from 912.3 million euros to 845.8 million euros dueto the impairment of goodwill compared to the end of last year. Liquidity increased to 70.6 million euros (2007: 65.6 million euros).

As a result of seasonal effects, trade accounts receivable at 317.4 million euros rose significantly by 31.8 million euros compared to the corresponding value of the previous year(2007: 285.6 million euros).
Based on the significant impairment, the goodwill decreased to 181.6 million euros compa-red to the corresponding value of the previous year (2007: 277.1 million euros).
For seasonal reasons, trade accounts payable amounted to 275.8 million euros comparedwith 253.0 million euros at the reporting date at the end of the fiscal year 2007. This almostoffset the increase in trade accounts receivable.
Liabilities from the bond issuance amounted to 127.0 million euros (2007: 126.6 millioneuros).
Due to the impairment of goodwill the shareholders’ equity decreased to 225.8 millioneuros (2007: 317.9 million euros). Equity ratio was at 26.7 % (2007: 34.8 %).
The group's gross financial debt decreased by -3.7 million euros to 204.7 million euros(2007: 208.4 million euros). Net debt decreased by -8.7 million euros to 134.1 million euros(2007: 142.8 million euros) owing mainly to the planned repayment of financial liabilitiesfrom operational cash flow earnings. Compared to September 30, 2007 net financial debtfell by -29.3 million euros.
Employees
As of September 30, 2008 the Logwin Group employed 8,718 people. Compared withDecember 31, 2007 this represents an increase in the number of employees of 235. Thiswas mainly due to new customer business and various initial consolidation measures.
15
Sept. 30, 2008 Dec. 31, 2007
Germany 3,767 3,600
Austria 1,399 1,450
Eastern Europe 1,242 1,151
Asia, Pacific region, Africa 1,017 933
Switzerland 350 402
Other 943 947
Total 8,718 8,483
16
Group Interim Management Report
Other Reporting | Outlook
Other Reporting
For the Logwin Group, the reporting period up to September 30, 2008 was dominated bythe almost universal introduction of the new joint brand. The Extraordinary General Meetingof Thiel Logistik AG held on April 9, 2008 approved the rebranding of the company toLogwin AG by an almost unanimous vote. Following extensive preparations, companies inthe main European markets and significant non-European markets were renamed to thenew brand with effect from July 1, 2008, with a second wave following on September 1.Logwin has been present with its new joint brand almost worldwide since September. Allgroup companies will have changed their market presence in a total of 45 countries by theend of the year. With its new market presence, the group demonstrates the organisationalconclusion of an integration process lasting several years and its relaunch as an integratedlogistics services provider. The positive experience of the past few months and in particularthe positive customer reaction underlines the significance and the potential of the newLogwin brand.
At the annual general meeting, the shareholders decided to authorise the Board ofDirectors to acquire shares in the company up to an amount of 10 % of the share capital.
Outlook
The Logwin Group's year has so far been characterised by an overall stable developmentamid a weakening economic environment and the turbulent events on the global financialmarkets. Uncertainty about the further macroeconomic developments in the relevant mar-kets for the Logwin Group influenced the situation in particular towards the end of thereporting period. Individual developments showed distinct signs of a deterioration in theoverall condition and increased the uncertainty surrounding forecasts.
Against this background, the Logwin Group expects an increase in group sales for the 2008business year that will, however, continue to weaken when compared with the year to date.The operating earnings of the business segments for the current year will be subject toconsiderable uncertainty in the fourth quarter.
In the current situation, both planned investment and the consistent management of receiv-ables throughout the group will continue to contribute to a positive net cash flow.
Maintaining the Logwin Group's stable financial position will continue to have high priority.Given the economic and market uncertainty Logwin AG will take increased steps to ensurethat sustainable stability is maintained at all times. This will create the basis to participatesuccessfully in the further growth in the logistics market in the longer term, after overalleconomic conditions will have improved.

17
Consolidated Interim Financial Statements
18 Consolidated Statement of Income
19 Consolidated Statement of Cash Flows
20 Consolidated Balance Sheet
22 Consolidated Statement of Changes in Shareholders’ Equity
Notes to Consolidated Interim Financial Statements
24 Basis of Accounting
24 Consolidation Scope
24 Business Combinations
24 Impairment of Goodwill
25 Segment Reporting
30 Other Income (Expenses)
30 Restructuring Costs
31 Property, Plant and Equipment and Intangible Assets
31 Shareholders’ Equity
32 Supplemental Disclosures of Cash Information
32 Contingencies
32 External Review
32 Subsequent Events
18
Group Interim Financial Statements
Consolidated Statement of Income | Consolidated Statement of Cash Flows
in thousand 2
January 1 -Sept. 30,
2008
January 1 - Sept. 30,
2007
July 1 - Sept. 30,
2008
July 1 - Sept. 30,
2007
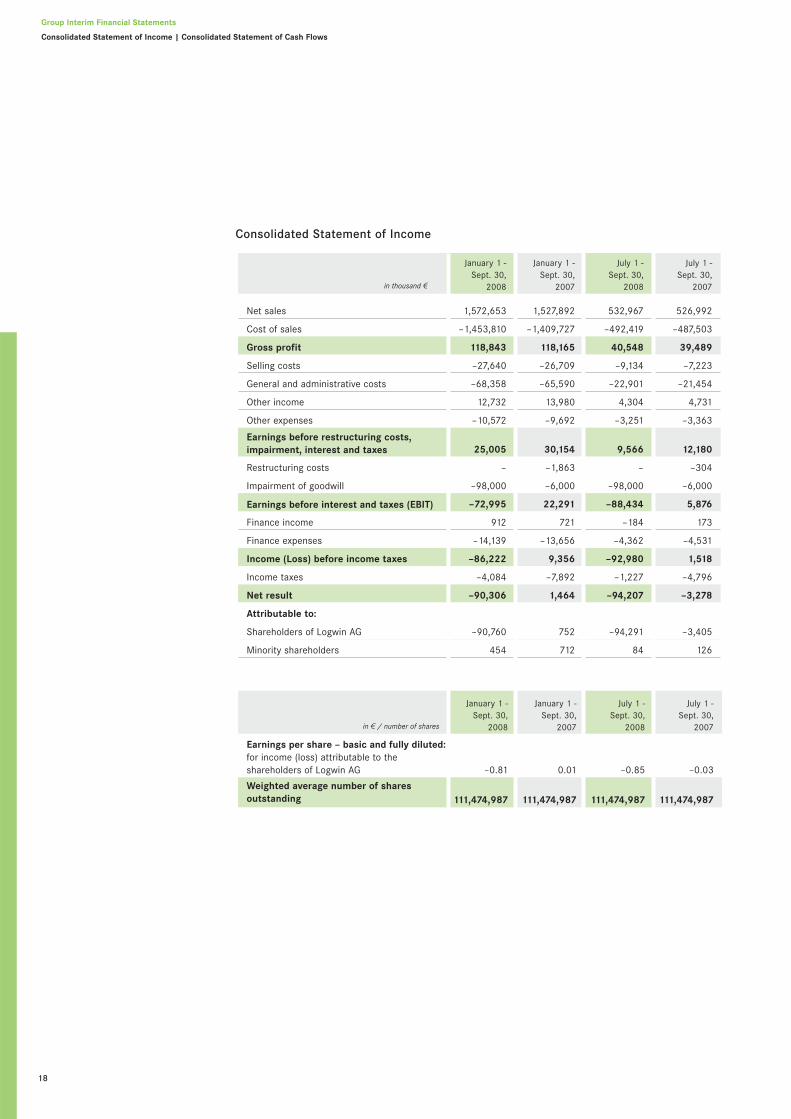
Net sales 1,572,653 1,527,892 532,967 526,992
Cost of sales –1,453,810 –1,409,727 –492,419 –487,503
Gross profit 118,843 118,165 40,548 39,489
Selling costs –27,640 –26,709 –9,134 –7,223
General and administrative costs –68,358 –65,590 –22,901 –21,454
Other income 12,732 13,980 4,304 4,731
Other expenses –10,572 –9,692 –3,251 –3,363
Earnings before restructuring costs, impairment, interest and taxes 25,005 30,154 9,566 12,180
Restructuring costs – –1,863 – –304
Impairment of goodwill –98,000 –6,000 –98,000 –6,000
Earnings before interest and taxes (EBIT) –72,995 22,291 –88,434 5,876
Finance income 912 721 –184 173
Finance expenses –14,139 –13,656 –4,362 –4,531
Income (Loss) before income taxes –86,222 9,356 –92,980 1,518
Income taxes –4,084 –7,892 –1,227 –4,796
Net result –90,306 1,464 –94,207 –3,278
Attributable to:
Shareholders of Logwin AG –90,760 752 –94,291 –3,405
Minority shareholders 454 712 84 126
in 2 / number of shares
January 1 -Sept. 30,
2008
January 1 -Sept. 30,
2007
July 1 - Sept. 30,
2008
July 1 - Sept. 30,
2007
Earnings per share – basic and fully diluted:for income (loss) attributable to the shareholders of Logwin AG –0.81 0.01 –0.85 –0.03
Weighted average number of shares outstanding 111,474,987 111,474,987 111,474,987 111,474,987
Consolidated Statement of Income
19
January 1-September 30 in thousand 2 2008 2007
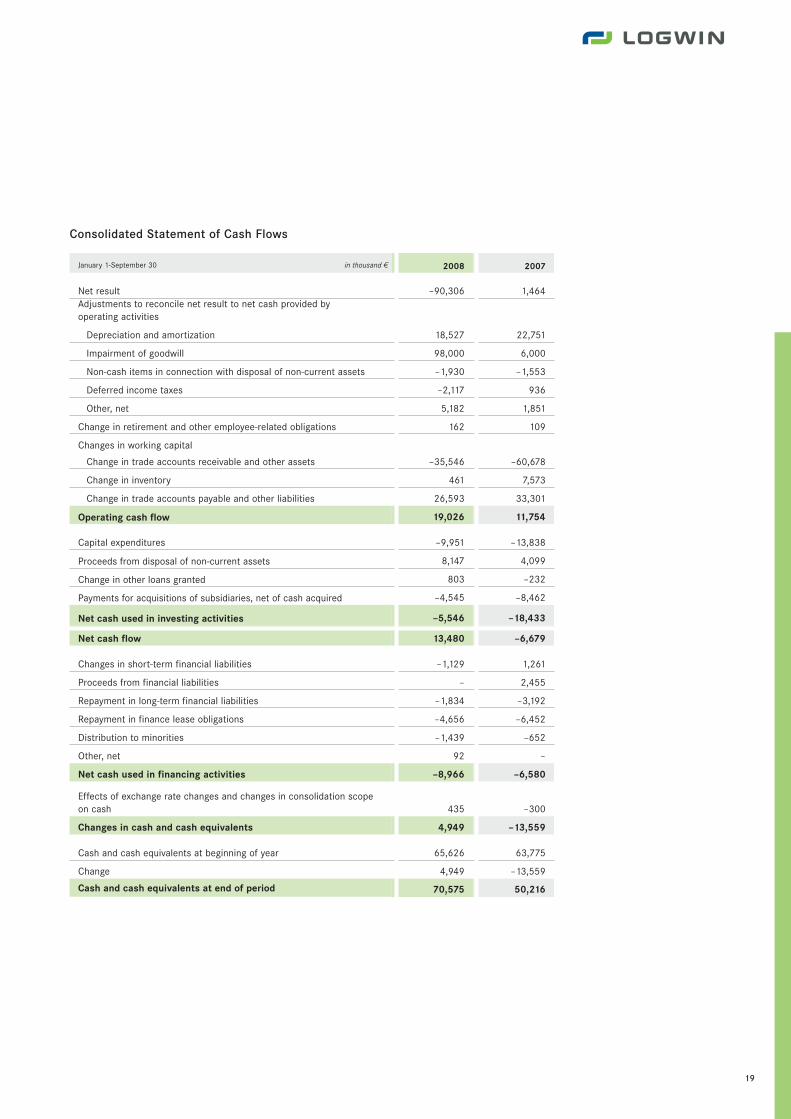
Net result –90,306 1,464Adjustments to reconcile net result to net cash provided by operating activities
Depreciation and amortization 18,527 22,751
Impairment of goodwill 98,000 6,000
Non-cash items in connection with disposal of non-current assets –1,930 –1,553
Deferred income taxes –2,117 936
Other, net 5,182 1,851
Change in retirement and other employee-related obligations 162 109
Changes in working capital
Change in trade accounts receivable and other assets –35,546 –60,678
Change in inventory 461 7,573
Change in trade accounts payable and other liabilities 26,593 33,301
Operating cash flow 19,026 11,754
Capital expenditures –9,951 –13,838
Proceeds from disposal of non-current assets 8,147 4,099
Change in other loans granted 803 –232
Payments for acquisitions of subsidiaries, net of cash acquired –4,545 –8,462
Net cash used in investing activities –5,546 –18,433
Net cash flow 13,480 –6,679
Changes in short-term financial liabilities –1,129 1,261
Proceeds from financial liabilities – 2,455
Repayment in long-term financial liabilities –1,834 –3,192
Repayment in finance lease obligations –4,656 –6,452
Distribution to minorities –1,439 –652
Other, net 92 –
Net cash used in financing activities –8,966 –6,580
Effects of exchange rate changes and changes in consolidation scope on cash 435 –300
Changes in cash and cash equivalents 4,949 –13,559
Cash and cash equivalents at beginning of year 65,626 63,775
Change 4,949 –13,559
Cash and cash equivalents at end of period 70,575 50,216
Consolidated Statement of Cash Flows
20
Group Interim Financial Statements
Consolidated Balance Sheet
in thousand 2 Sept. 30, 2008 Dec. 31, 2007
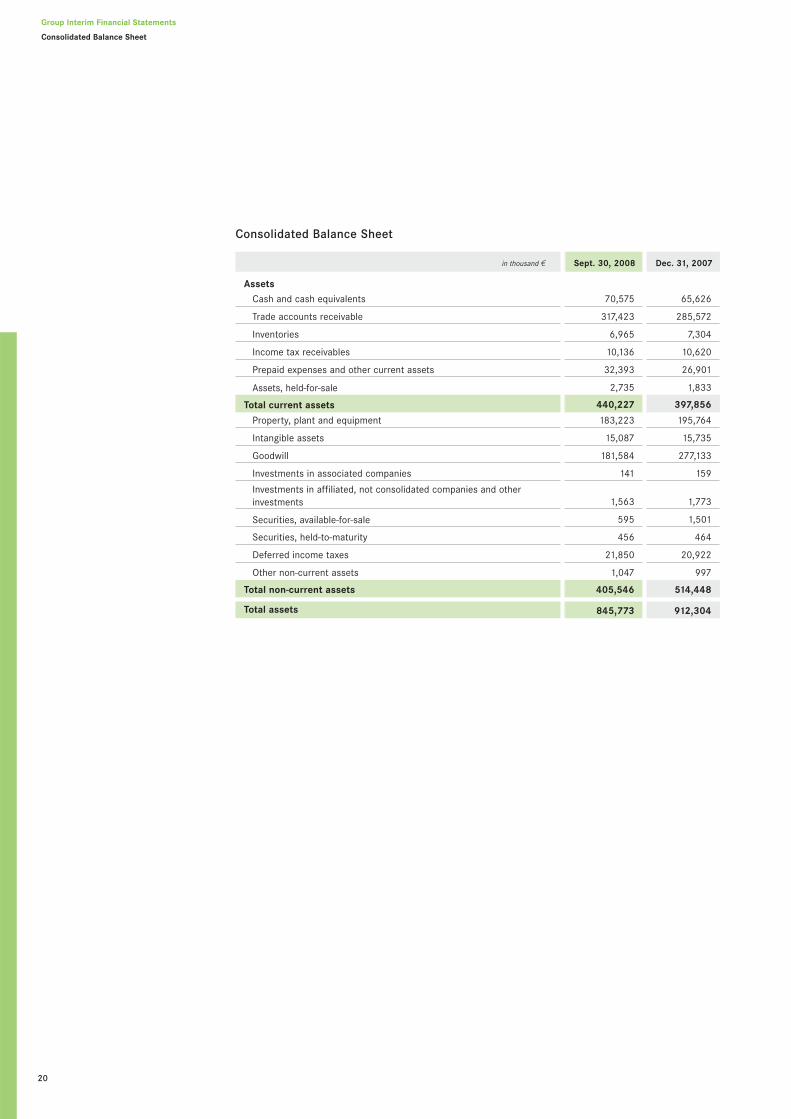
AssetsCash and cash equivalents 70,575 65,626
Trade accounts receivable 317,423 285,572
Inventories 6,965 7,304
Income tax receivables 10,136 10,620
Prepaid expenses and other current assets 32,393 26,901
Assets, held-for-sale 2,735 1,833
Total current assets 440,227 397,856
Property, plant and equipment 183,223 195,764
Intangible assets 15,087 15,735
Goodwill 181,584 277,133
Investments in associated companies 141 159
Investments in affiliated, not consolidated companies and other investments 1,563 1,773
Securities, available-for-sale 595 1,501
Securities, held-to-maturity 456 464
Deferred income taxes 21,850 20,922
Other non-current assets 1,047 997
Total non-current assets 405,546 514,448
Total assets 845,773 912,304
Consolidated Balance Sheet
21
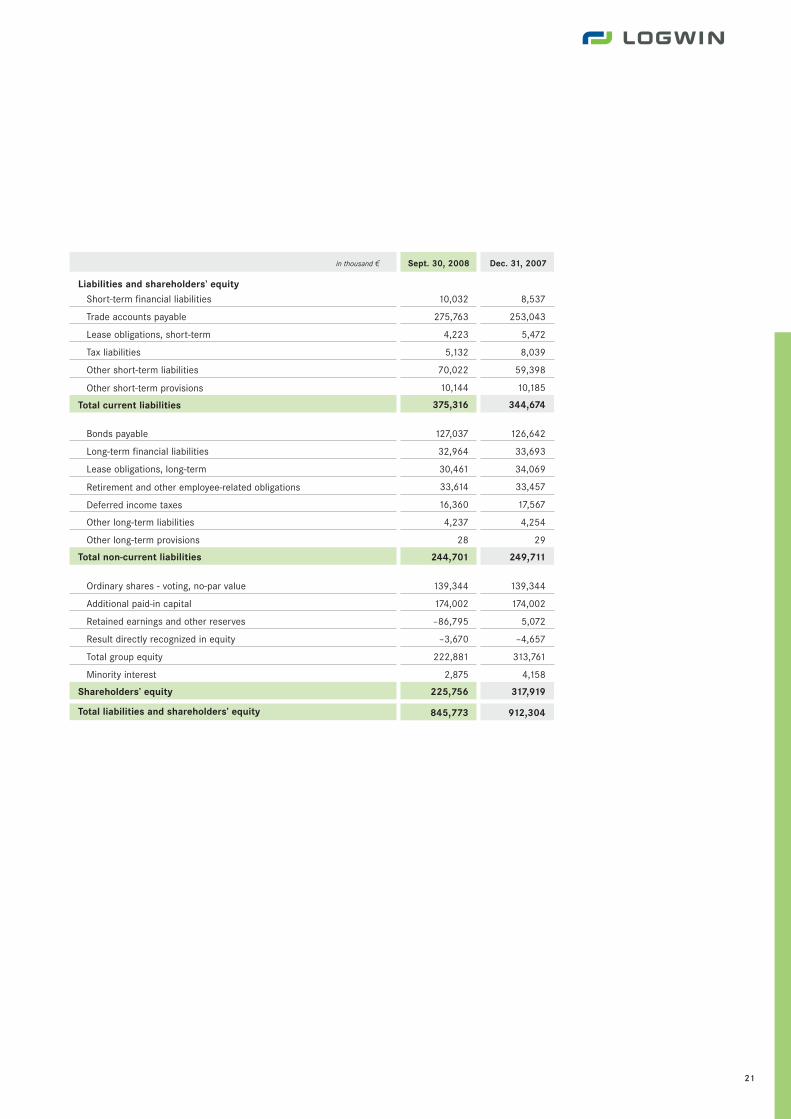
in thousand 2 Sept. 30, 2008 Dec. 31, 2007
Liabilities and shareholders’ equityShort-term financial liabilities 10,032 8,537
Trade accounts payable 275,763 253,043
Lease obligations, short-term 4,223 5,472
Tax liabilities 5,132 8,039
Other short-term liabilities 70,022 59,398
Other short-term provisions 10,144 10,185
Total current liabilities 375,316 344,674
Bonds payable 127,037 126,642
Long-term financial liabilities 32,964 33,693
Lease obligations, long-term 30,461 34,069
Retirement and other employee-related obligations 33,614 33,457
Deferred income taxes 16,360 17,567
Other long-term liabilities 4,237 4,254
Other long-term provisions 28 29
Total non-current liabilities 244,701 249,711
Ordinary shares - voting, no-par value 139,344 139,344
Additional paid-in capital 174,002 174,002
Retained earnings and other reserves –86,795 5,072
Result directly recognized in equity –3,670 –4,657
Total group equity 222,881 313,761
Minority interest 2,875 4,158
Shareholders’ equity 225,756 317,919
Total liabilities and shareholders’ equity 845,773 912,304

22
Group Interim Financial Statements
Consolidated Statement of Changes in Shareholders’ Equity
in thousand 2
Ordinaryshares - voting,
no-par value
Additionalpaid-in capital
Retainedearnings
and other reserves
Result directly
recognized in equity
January 1, 2007 139,344 174,002 8,057 –4,170 317,233 3,819 321,052
Net result 752 752 712 1,464
Neutral effects from minority interests –1,404 –1,404Result directly recognized in equity, net of tax
Translation reserve –1,327 –1,327 –1,327
Fair value reserve 22 22 22
Revaluation reserve 151 151 151
Actuarial gains and losses from pensions
September 30, 2007 139,344 174,002 8,809 –5,324 316,831 3,127 319,958
Net result 910 910 960 1,870
Acquisition of outstanding minority interests –4,647 –4,647 –4,647
Neutral effects from minority interests 71 71Result directly recognized in equity, net of tax
Translation reserve –428 –428 –428
Fair value reserve –175 –175 –175
Revaluation reserve –151 –151 –151
Actuarial gains and losses from pensions 1,421 1,421 1,421
December 31, 2007 139,344 174,002 5,072 –4,657 313,761 4,158 317,919
Net result –90,760 –90,760 454 –90,306
Acquisition of outstanding minority interests –1,107 –1,107 –1,107
Neutral effects from minority interests –1,737 –1,737Result directly recognized in equity, net of tax
Translation reserve 341 341 341
Fair value reserve 27 27 27
Revaluation reserve 619 619 619
Actuarial gains and losses from pensions
September 30, 2008 139,344 174,002 –86,795 –3,670 222,881 2,875 225,756
Consolidated Statement of Changes in Shareholders’ Equity
Total shareholders’
equity
Minorityinterest
Totalgroupequity
Capital and reserves attributable to the equity holders of Logwin AG

23
Notes to Consolidated Interim Financial Statements
24 Basis of Accounting
24 Consolidation Scope
24 Business Combinations
24 Impairment of Goodwill
25 Segment Reporting
30 Other Income (Expenses)
30 Restructuring Costs
31 Property, Plant and Equipment and Intangible Assets
31 Shareholders’ Equity
32 Supplemental Disclosures of Cash Information
32 Contingencies
32 External Review
32 Subsequent Events
24
Group Interim Financial Statements
Notes to Consolidated Statements
1 Basis of accounting
2 Consolidation scope
3 Business combinations
4 Impairment of Goodwill
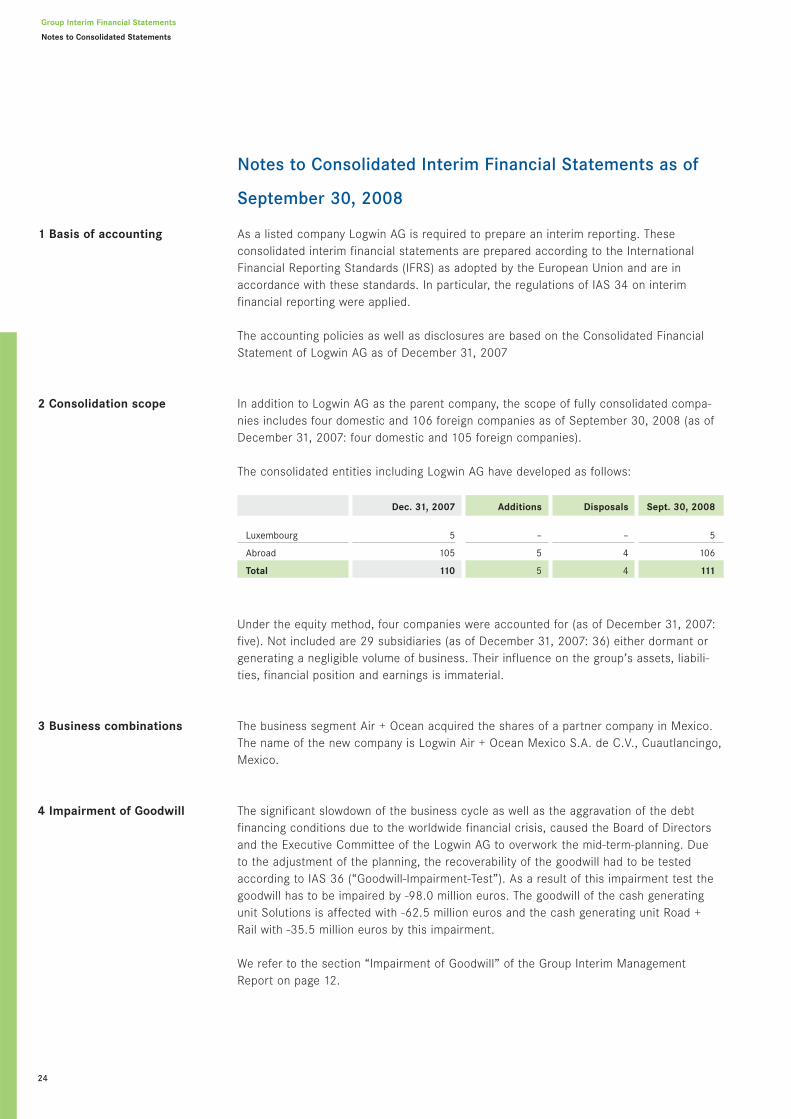
As a listed company Logwin AG is required to prepare an interim reporting. These consolidated interim financial statements are prepared according to the InternationalFinancial Reporting Standards (IFRS) as adopted by the European Union and are in accordance with these standards. In particular, the regulations of IAS 34 on interim financial reporting were applied.
The accounting policies as well as disclosures are based on the Consolidated FinancialStatement of Logwin AG as of December 31, 2007
In addition to Logwin AG as the parent company, the scope of fully consolidated compa-nies includes four domestic and 106 foreign companies as of September 30, 2008 (as ofDecember 31, 2007: four domestic and 105 foreign companies).
The consolidated entities including Logwin AG have developed as follows:
Under the equity method, four companies were accounted for (as of December 31, 2007:five). Not included are 29 subsidiaries (as of December 31, 2007: 36) either dormant orgenerating a negligible volume of business. Their influence on the group’s assets, liabili-ties, financial position and earnings is immaterial.
The business segment Air + Ocean acquired the shares of a partner company in Mexico.The name of the new company is Logwin Air + Ocean Mexico S.A. de C.V., Cuautlancingo,Mexico.
The significant slowdown of the business cycle as well as the aggravation of the debtfinancing conditions due to the worldwide financial crisis, caused the Board of Directorsand the Executive Committee of the Logwin AG to overwork the mid-term-planning. Dueto the adjustment of the planning, the recoverability of the goodwill had to be testedaccording to IAS 36 (“Goodwill-Impairment-Test”). As a result of this impairment test thegoodwill has to be impaired by -98.0 million euros. The goodwill of the cash generatingunit Solutions is affected with -62.5 million euros and the cash generating unit Road +Rail with -35.5 million euros by this impairment.
We refer to the section “Impairment of Goodwill” of the Group Interim ManagementReport on page 12.
Notes to Consolidated Interim Financial Statements as of
September 30, 2008
Dec. 31, 2007 Additions Disposals Sept. 30, 2008
Luxembourg 5 – – 5
Abroad 105 5 4 106
Total 110 5 4 111
25
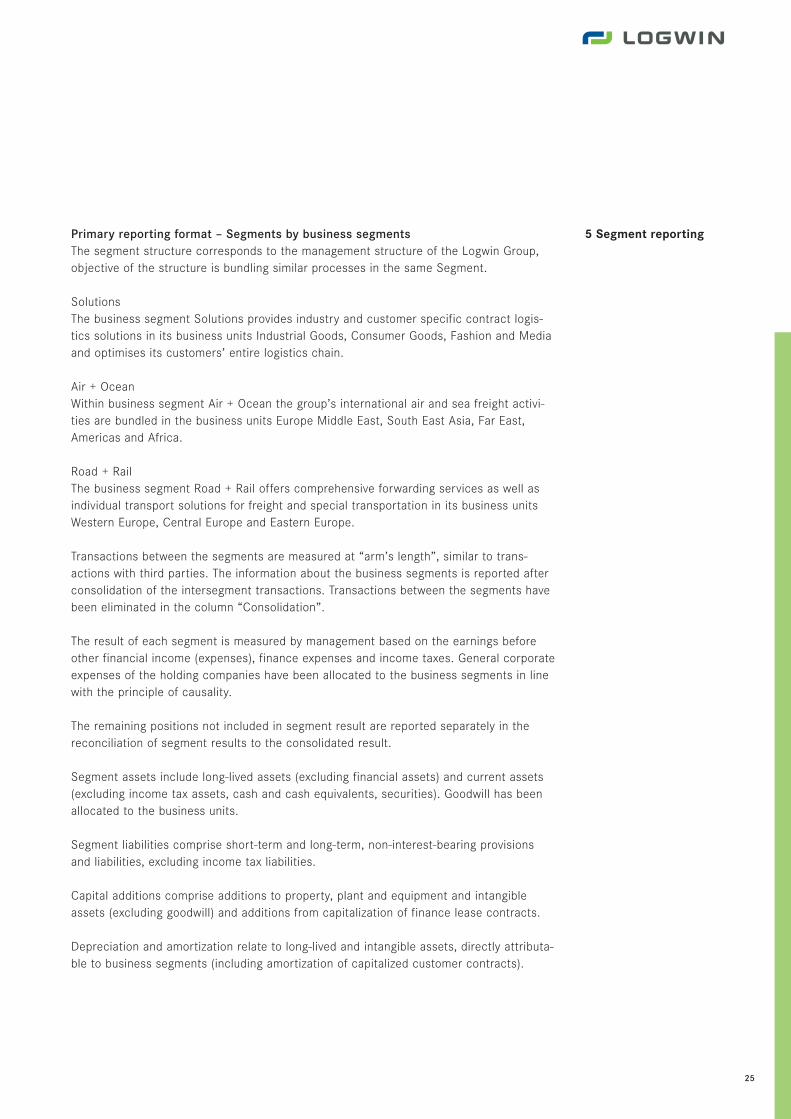
Primary reporting format – Segments by business segmentsThe segment structure corresponds to the management structure of the Logwin Group,objective of the structure is bundling similar processes in the same Segment.
SolutionsThe business segment Solutions provides industry and customer specific contract logis-tics solutions in its business units Industrial Goods, Consumer Goods, Fashion and Mediaand optimises its customers’ entire logistics chain.
Air + OceanWithin business segment Air + Ocean the group’s international air and sea freight activi-ties are bundled in the business units Europe Middle East, South East Asia, Far East,Americas and Africa.
Road + RailThe business segment Road + Rail offers comprehensive forwarding services as well asindividual transport solutions for freight and special transportation in its business unitsWestern Europe, Central Europe and Eastern Europe.
Transactions between the segments are measured at “arm’s length”, similar to trans-actions with third parties. The information about the business segments is reported afterconsolidation of the intersegment transactions. Transactions between the segments havebeen eliminated in the column “Consolidation”.
The result of each segment is measured by management based on the earnings beforeother financial income (expenses), finance expenses and income taxes. General corporateexpenses of the holding companies have been allocated to the business segments in linewith the principle of causality.
The remaining positions not included in segment result are reported separately in thereconciliation of segment results to the consolidated result.
Segment assets include long-lived assets (excluding financial assets) and current assets(excluding income tax assets, cash and cash equivalents, securities). Goodwill has beenallocated to the business units.
Segment liabilities comprise short-term and long-term, non-interest-bearing provisionsand liabilities, excluding income tax liabilities.
Capital additions comprise additions to property, plant and equipment and intangibleassets (excluding goodwill) and additions from capitalization of finance lease contracts.
Depreciation and amortization relate to long-lived and intangible assets, directly attributa-ble to business segments (including amortization of capitalized customer contracts).
5 Segment reporting

26
Group Interim Financial Statements
Notes to Consolidated Statements
The tables below set forth segment information of the business segments for the periodsended September 30, 2008 and 2007:
January 1–September 30, 2008 in thousand 2 Solutions Air + Ocean Road + Rail Holdings Consolidation Group
Net sales
External sales 542,203 405,516 623,654 1,280 – 1,572,653
Intersegment sales 8,361 10,178 27,806 – –46,345 –
Total net sales 550,564 415,694 651,460 1,280 –46,345 1,572,653
Earnings
Segment result before restructuring costs andimpairment 11,561 16,484 1,620 –4,914 – 24,751
Restructuring costs – – – – – –
Impairment of goodwill –62,500 – –35,500 – – –98,000
Segment result –50,939 16,484 –33,880 –4,914 – –73,249
Other financial income (expenses), net 254
Earnings before interest and taxes (EBIT) –72,995
Finance expenses, net –13,227
Income (Loss) before income taxes –86,222
Income taxes –4,084
Net result –90,306
The Segment result includes:
Depreciation and amortization –7,224 –1,233 –8,062 –2,008 – –18,527
Thereof amortization of customer contracts –390 – –544 – – –934
September 30, 2008 in thousand 2 Solutions Air + Ocean Road + Rail Holdings Consolidation Group
Balance sheet
Segment assets 273,351 151,659 294,403 20,018 – 739,413
Unallocated assets 106,342
Total consolidated assets 845,773
Segment liabilities 105,715 72,189 167,862 48,038 – 393,804
Unallocated liabilities 226,213
Total consolidated liabilities 620,017
The Segment assets include:
Capital additions 3,594 1,340 2,984 2,798 – 10,716
27
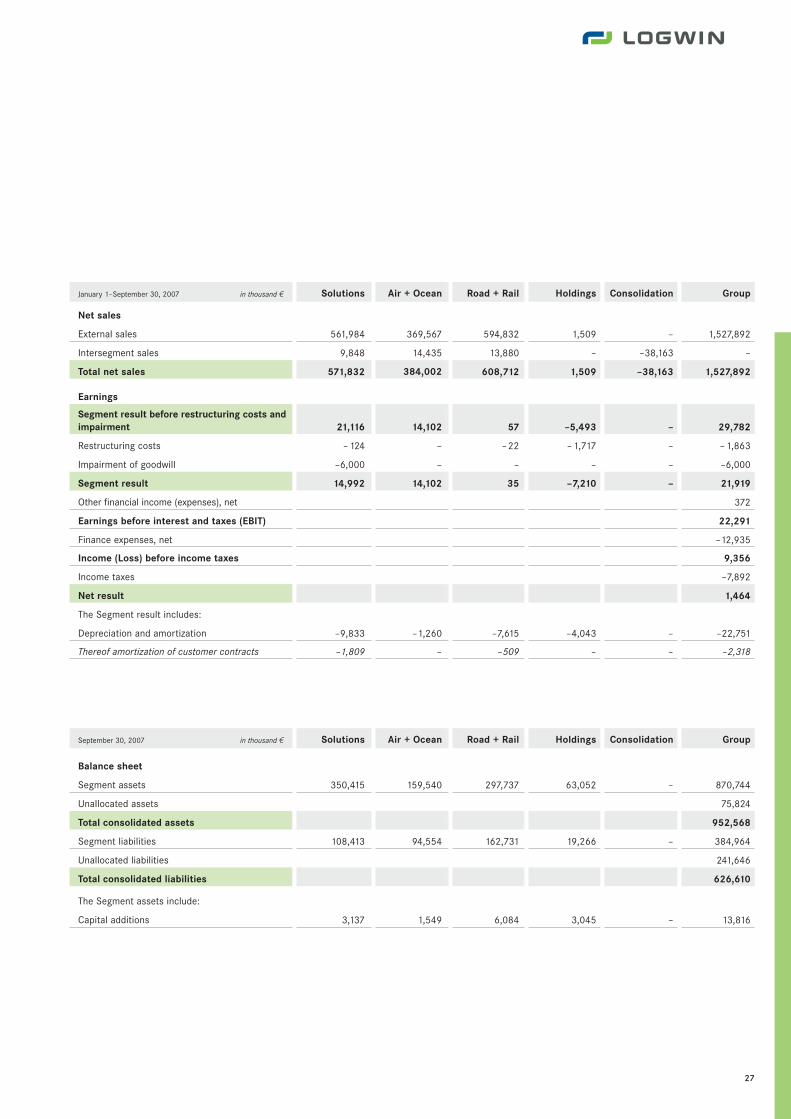
January 1–September 30, 2007 in thousand 2 Solutions Air + Ocean Road + Rail Holdings Consolidation Group
Net sales
External sales 561,984 369,567 594,832 1,509 – 1,527,892
Intersegment sales 9,848 14,435 13,880 – –38,163 –
Total net sales 571,832 384,002 608,712 1,509 –38,163 1,527,892
Earnings
Segment result before restructuring costs andimpairment 21,116 14,102 57 –5,493 – 29,782
Restructuring costs –124 – –22 –1,717 – –1,863
Impairment of goodwill –6,000 – – – – –6,000
Segment result 14,992 14,102 35 –7,210 – 21,919
Other financial income (expenses), net 372
Earnings before interest and taxes (EBIT) 22,291
Finance expenses, net –12,935
Income (Loss) before income taxes 9,356
Income taxes –7,892
Net result 1,464
The Segment result includes:
Depreciation and amortization –9,833 –1,260 –7,615 –4,043 – –22,751
Thereof amortization of customer contracts –1,809 – –509 – – –2,318
September 30, 2007 in thousand 2 Solutions Air + Ocean Road + Rail Holdings Consolidation Group
Balance sheet
Segment assets 350,415 159,540 297,737 63,052 – 870,744
Unallocated assets 75,824
Total consolidated assets 952,568
Segment liabilities 108,413 94,554 162,731 19,266 – 384,964
Unallocated liabilities 241,646
Total consolidated liabilities 626,610
The Segment assets include:
Capital additions 3,137 1,549 6,084 3,045 – 13,816

28
Group Interim Financial Statements
Notes to Consolidated Statements
Secondary reporting format – Segments by regionsThe Logwin Group is subdivided into six geographical regions according to their materiali-ty. Asia is headed by China with just over 50 % of the segment’s net sales, followed bySingapore and Korea. The segment “Other” is dominated by European countries withabout 80 %, the remaining share comprises Australia and countries in South America andAfrica.
Net sales from external customers have been allocated according to the geographicallocation of the assets.
Segment assets as well as any additional geographical information are allocated to therespective assets. Segment assets are defined as long-lived assets excluding financialassets and goodwill as well as current assets excluding income tax assets, cash and cashequivalents and securities. Long-lived assets and capital additions comprise property,plant and equipment and intangible assets excluding goodwill, both including the acquisi-tion and capitalization of finance lease contracts.
The tables below present geographic information on net sales from external customers,segment assets, capital additions and long-lived assets for the periods ended September 30,2008 and 2007:
in thousand 2
Germany 215,929 38.7 % 225,668 38.3 %
Austria 143,193 25.7 % 155,648 26.4 %
Eastern Europe 56,539 10.1 % 62,882 10.7 %
Asia 29,624 5,3 % 28,913 4.9 %
Switzerland 38,572 6.9 % 38,107 6.5 %
Other 73,990 13.3 % 78,108 13.3 %
Total segment assets 557,847 100.0 % 589,326 100.0 %
Goodwill 181,584 281,418
Other unallocated assets 106,342 75,824
Total consolidated assets 845,773 946,568
January 1–September 30, in thousand 2
Germany 660,200 42.0 % 621,788 40.7 %
Austria 419,233 26.7 % 431,965 28.3 %
Eastern Europe 156,164 9.9 % 146,025 9.6 %
Asia 102,692 6.5 % 96,866 6.3 %
Switzerland 73,804 4.7 % 68,337 4.5 %
Other 160,560 10.2 % 162,911 10.6 %
Total net sales 1,572,653 100.0 % 1,527,892 100.0 %
2008 2007
September 30, 2008 September 30, 2007

29
in thousand 2
Germany 77,693 39.2 % 87,357 40.6 %
Austria 65,718 33.1 % 68,830 32.0 %
Eastern Europe 18,434 9.3 % 19,034 8.8 %
Asia 1,406 0.7 % 1,483 0.7 %
Switzerland 20,791 10.5 % 19,371 9.0 %
Other 14,268 7.2 % 19,083 8.9 %
Total long-lived assets 198,310 100.0 % 215,158 100.0 %
January 1–September 30, in thousand 2
Germany 3,727 34.8 % 4,171 30.2 %
Austria 2,043 19.1 % 5,090 36.8 %
Eastern Europe 907 8.5 % 641 4.6 %
Asia 437 4.0 % 590 4.3 %
Switzerland 1,145 10.7 % 451 3.3 %
Other 2,457 22.9 % 2,873 20.8 %
Total capital additions 10,716 100.0 % 13,816 100.0 %
2008 2007
September 30, 2008 September 30, 2007

30
Group Interim Financial Statements
Notes to Consolidated Statements
6 Other income andexpenses
7 Restructuring costs
Net income from foreign exchange gains and losses is as follows:
In 2007 other operating income mainly comprises the gain from disposal of intermodalactivities at a Salzburg location amounting to 970 TEUR.
Expenses which are linked to the reorganization of the Logwin Group decided by the Boardof Directors are accounted for as restructuring costs in 2007. In 2008 no restructuringcosts have been incurred (2007: 1,863 TEUR).
January 1–September 30, in thousand 2
Foreign exchange gains 8,456 7,888
Foreign exchange losses –9,472 –8,428
Foreign exchange effects, net –1,016 –540
2008 2007
January 1–September 30, in thousand 2
Foreign exchange gains 8,456 7,888
Gains from disposal of long-lived assets 2,122 1,861
Other operating income 1,755 3,242
Other financial income 399 989
Other income 12,732 13,980
2008 2007
January 1–September 30, in thousand 2
Foreign exchange losses –9,472 –8,428
Loss from disposal of long-lived assets –479 –195
Other operating expenses –477 –454
Other financial expenses – 144 –616
Other expenses –10,572 –9,693
2008 2007

31
in thousand 2
Acquisition cost
Accumulatedamortization/
depreciation
Carrying amount
Sept. 30, 2008
Carrying amount
Dec. 31, 2007
Land and buildings 238,837 –95,894 142,943 150,929
Machinery and equipment 58,199 –46,017 12,182 13,439
Tools, fixtures, furniture, office equipment 71,165 –56,078 15,087 15,803
Fleet of cars 53,293 –41,620 11,673 14,120
Construction in progress 1,338 – 1,338 1,473
Property, plant and equipment 422,832 –239,609 183,223 195,764
Concessions, licenses, copyrights 5,115 –3,533 1,582 1,526
Customer contracts acquired 21,089 –19,500 1,589 2,405
Software 45,942 –34,484 11,458 10,147
Construction in progress 458 – 458 1,657
Intangible Assets 72,604 –57,517 15,087 15,735
The decrease in Land and buildings mainly results from the sale of the property at theGrevenmacher (Luxemburg) location. The final execution was approved by the statutory aut-hority in the third quarter.
Ordinary sharesAs of September 30, 2008, the Company had 111,474,987 ordinary shares, voting withoutnominal value, issued and outstanding, representing common stock amounting to139,344 TEUR. Each share represents a calculated par value of 1.25 EUR.
8 Property, plant and equip-ment and intangible assets
9 Shareholders’ equity
32
Group Interim Financial Statements
Notes to Consolidated Statements
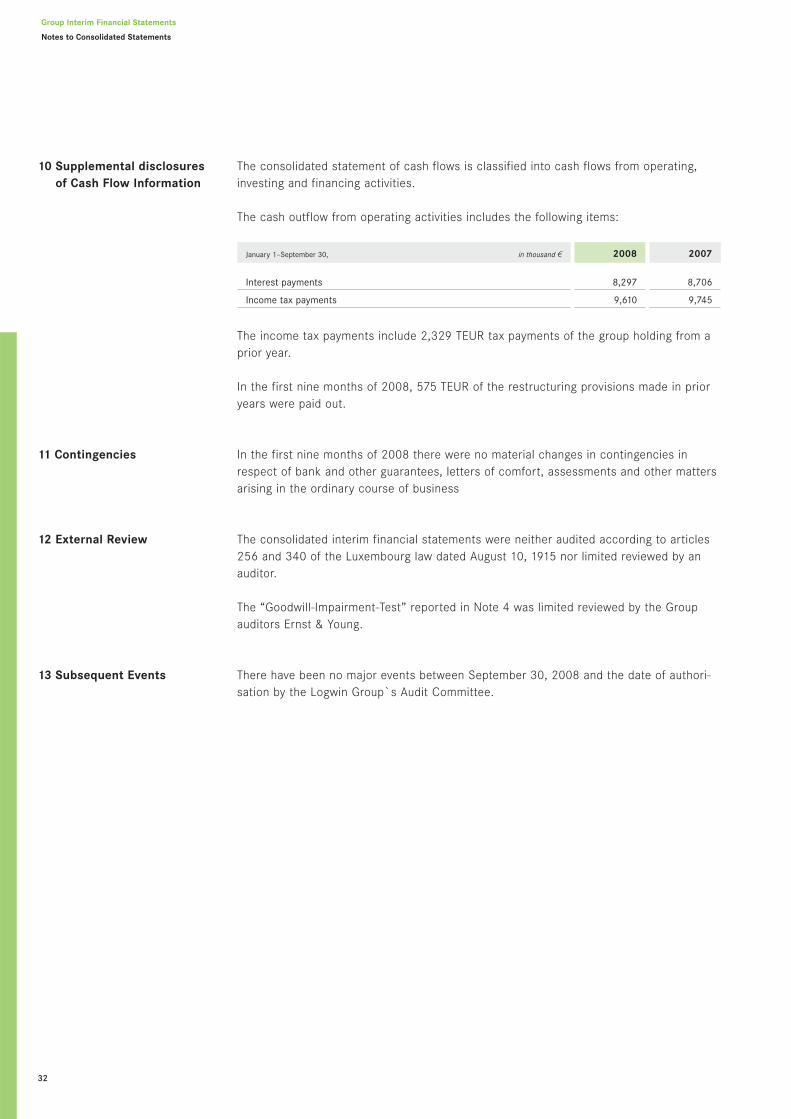
The consolidated statement of cash flows is classified into cash flows from operating,investing and financing activities.
The cash outflow from operating activities includes the following items:
The income tax payments include 2,329 TEUR tax payments of the group holding from aprior year.
In the first nine months of 2008, 575 TEUR of the restructuring provisions made in prioryears were paid out.
In the first nine months of 2008 there were no material changes in contingencies inrespect of bank and other guarantees, letters of comfort, assessments and other mattersarising in the ordinary course of business
The consolidated interim financial statements were neither audited according to articles256 and 340 of the Luxembourg law dated August 10, 1915 nor limited reviewed by anauditor.
The “Goodwill-Impairment-Test” reported in Note 4 was limited reviewed by the Groupauditors Ernst & Young.
There have been no major events between September 30, 2008 and the date of authori-sation by the Logwin Group`s Audit Committee.
January 1–September 30, in thousand 2
Interest payments 8,297 8,706
Income tax payments 9,610 9,745
2008 2007
10 Supplemental disclosuresof Cash Flow Information
11 Contingencies
12 External Review
13 Subsequent Events

Imprint
PublisherLogwin AG | 5, an de Laengten | 6776 Grevenmacher | Luxembourg
ResponsiblePublic Relations
This report is available in both German and English and can be downloaded from our website www.logwin-logistics.com.
Further copies of the report and additional information can be obtained from us free ofcharge.
Telephone: +352 719690-1112 | Fax: +352 719690-1359 | [email protected]
Dates 2009
March 11, 2009Annual Press Conference
April 8, 2009Annual General Meeting
Contact
Public RelationsMara HanckerPhone: +352 719690-1353Telefax: +352 [email protected]
Investor Relations Sebastian EsserPhone: +352 719690-1112Telefax: +352 [email protected]

Logwin AG | ZIR Potaschberg | 5, an de Laengten | 6776 Grevenmacher | Luxembourg