nikki warren. website log analysis: approaches for the library of
TRANSCRIPT

Nikki Warren. Website Log Analysis: Approaches for the Library of the National Institute Of Environmental Health Sciences. A Master’s Paper for the M.S. in L.S. degree. July, 2002. 75 pages. Advisor: Gregory B. Newby.
Much of the literature on web log analysis focuses on how to collect summary statistics,
the anatomy of web logs, how to choose analysis software, and the strengths and
weaknesses of log analysis. These issues are important to understand, but less research
has been done on how to comprehensively apply web logs to higher-level issues within
libraries. This study shows that web statistics are a tool to help librarians make
management, marketing, and collection development decisions. This paper will cover the
basic issues of web log analysis in addition to exploring practical application concepts for
the library of the National Institute of Environmental Health Sciences (NIEHS). The
library’s web logs were analyzed from January to March 2002. In addition, a database
was queried to track usage of specific resources on the library’s website from March to
May 2002.
Headings:
Internet -- Environmental libraries and collections.
Internet -- Statistics.
Use studies -- Internet.
Web sites -- Case studies.
World Wide Web -- Statistics.

WEBSITE LOG ANALYSIS:
APPROACHES FOR THE LIBRARY OF THE NATIONAL INSTITUTE OF ENVIRONMENTAL HEALTH SCIENCES
by Nikki Warren
A Master’s Paper submitted to the faculty of the School of Information and Library Science of the University of North Carolina at Chapel Hill
in partial fulfillment of the requirements for the degree of Master of Science in
Library Science.
Chapel Hill, North Carolina
July, 2002
Approved by:
_____________________________
Gregory B. Newby Advisor
iii
ACKNOWLEDGMENTS The following people at NIEHS were instrumental in the completion of this project. I would like to thank all of them for helping me gather the data, giving me guidance, and providing a sense of professional camaraderie. Liz Hall Systems Librarian Dav Robertson Director, Library & Information Services Branch Bill Watson Web Services Group Lois Widmer User Services Librarian
iv
TABLE OF CONTENTS INTRODUCTION 1
Background: National Institute of Environmental Health Sciences 2 Library and Information Services 2 NIEHS Library Website 3 Web Logs at NIEHS 3
LITERATURE REVIEW 4
Web Server Log Files 4 Distinguishing Hits, Page Views, and Visits 5 Limitations of Web Log Analysis 8 Benefits of Web Log Analysis 9 Practical Applications 10
Management 10 Marketing 11 Collection Development 11
METHODOLOGY 12
Standard Reports 12 Customized Reports 14 ClickCount Database 16
RESULTS 19
General Summary of Requests 20 Requests by Time Period 21 Requests by Operating System, Browser, and Status Code 27 Requests by Domain 29 Requests by Referrer 30 Requests by Search Query 31 Top Requests for Pages on Library Website 33 Electronic Journals (E-Journals) 35 Electronic Databases 39 Web Starting Points 42 Consumer Resources 44 Frequently Asked Questions 46 New Books and Other News 47
DISCUSSION 53
General Usage Patterns 54 Specific Usage Patterns 54
v
Future Directions 56 CONCLUSION 58 REFERENCES 60 APPENDIX A 62 APPENDIX B 66 APPENDIX C 67
vi
LIST OF TABLES Table 1: General Summary of Activity for NIEHS Library Website, Jan. - Mar. 2002 20 Table 2: Requests for Web Pages by Month, Jan. - Mar. 2002 21 Table 3: Requests for Web Pages by Day of the Week, Jan. – Mar. 2002 22 Table 4: Requests for Web Pages by Hour of the Day, Jan. – Mar. 2002 22 Table 5: Requests for Web Pages by Library Public Workstations, Jan. – Mar. 2002 23 Table 6: Requests for Web Pages by Day, January 2002 24 Table 7: Requests for Web Pages by Day, February 2002 25 Table 8: Requests for Web Pages by Day, March 2002 26 Table 9: Operating Systems Used to Request Pages by NIEHS Staff, Excluding Library Staff, Jan. – Mar. 2002 27 Table 10: Browsers Used to Request Pages by NIEHS Staff, Excluding Library Staff, Jan. – Mar. 2002 28 Table 11: Status Codes for Page Requests by NIEHS Staff, Excluding Library Staff, Jan. – Mar. 2002 28 Table 12: Top Number of Page Requests by Domain, Jan. – Mar. 2002 29 Table 13: Top 20 Referring Sites, Excluding Library Staff, Jan. – Mar. 2002 30 Table 14: Top Search Queries, Excluding Library Staff, Jan. – Mar.2002 32 Table 15: Top Pages Requested by NIEHS Staff (excluding Library Staff) and the General Public, Jan. – Mar. 2002 34 Table 16: Total Clicks for All E-journal Titles, Excluding Library Staff, Mar. – May 2002 35
vii
Table 17: Top Electronic Journals, Excluding Library Staff, Mar. – May 2002 36 Table 18: Low-Use Electronic Journals, Excluding Library Staff, Mar. – May 2002 38 Table 19: Top Databases, Excluding Library Staff, Mar. – May 2002 39 Table 20: Accesses for Medline via Three Different Interfaces, Excluding Library Staff, May 2002 40 Table 21: Requests and Referrers for Essential Science Indicators, Excluding Library Staff, March – May 2002 41 Table 22: Requests for “Web Starting Points” Pages by NIEHS Staff (excluding Library Staff) and the General Public, Jan. – Mar. 2002 42 Table 23: Clicks on “Scientific Resources,” Excluding Library Staff, May 29 – June 13, 2002 43 Table 24: Requests for “Consumer Resources” Pages by NIEHS Staff (excluding Library Staff) and the General Public, Jan. – Mar. 2002 44 Table 25: Top 15 Consumer Resources, Excluding Library Staff, Mar. – May 2002 45 Table 26: Requests for “FAQs” Pages by NIEHS Staff (excluding Library Staff) and the General Public, Jan. – Mar. 2002 46 Table 27: Requests for “New Index,” “New Books,” and “New Articles” Pages, Excluding Library Staff, Jan. - Mar. 2002 47 Table 28: Requests for “January New Books” and “January New Bibliography” Pages by Day, Excluding Library Staff, February 11 – March 18, 2002 48 Table 29: Requests for “February New Books” and “February New Bibliography” Pages by Day, Excluding Library Staff, March 7 – April 25, 2002 49 Table 30: Total Requests for “March New Books” and “March New Bibliography” Pages by Day, Excluding Library Staff, April 4 – May 9, 2002 50 Table 31: Clicks on Web of Science Abstracts from “New Articles” Pages, Excluding Library Staff, Jan. – May 2002 51 Table 32: Requests for “Bibliography” Pages by NIEHS Staff (excluding Library Staff) and the General Public, Jan. – Mar. 2002 52

1
INTRODUCTION
In the past, libraries had only a couple of service points for providing information.
Patrons could personally consult librarians at the reference desk or use the phone to
contact the library. Now, libraries rely on their websites to provide access to electronic
journals, online databases, and other services. Although it is standard procedure for most
librarians to count the number of questions they receive at the reference desk or via the
phone, collecting statistics about library website usage is a more recent practice. Even if
libraries collect web statistics, raw web logs must be transformed into a more “readable”
format by appropriate software. Librarians must know how to interpret the reports
generated from such software in order to understand what web statistics can and cannot
measure. Further, web statistics must be interpreted so that the data can impact decision-
making practices within libraries.
The Library & Information Services Branch at the National Institute of
Environmental Health Sciences (NIEHS) is taking the initiative to integrate web log
statistics into its overall management practices. This study will show that web log
analysis produces information about the overall use of the NIEHS Library website, in
addition to providing insight for collection development, marketing, and management
issues within the library. Data for this paper was collected from two utilities: web log
analysis software called Analog and a ClickCount script that counted the number of
clicks on certain web links. The data was then summarized to highlight trends and
provide a template for future analysis of the library’s website statistics.
2
Background: National Institute of Environmental Health Sciences
The National Institute of Environmental Health Sciences (NIEHS) was
established in 1966 and is one of the twenty-five institutes and centers of the National
Institutes of Health (NIH). NIEHS is located in Research Triangle Park, North Carolina,
with a primary mission of exploring how environmental factors impact human health.
Scientists at NIEHS are actively pursuing research in the areas of breast cancer, birth
defects, neurologic disorders, lead poisoning, signal error, and agricultural pollution.
NIEHS also participates in numerous community-outreach programs.
Library and Information Services
The NIEHS Library’s mission is to be an integrated and effective partner for the
research needs and accomplishments at the Institute. The library staff concentrates its
efforts on user services, reference, collection development and access, and document
delivery. The library provides access to approximately 20,000 books and 600 journal
titles. About 400 of these journal titles are available in electronic format. There are
approximately 600 databases available to NIEHS employees, covering everything from
toxicology and medicine to public administration. Library staff members provide
services that include chemical name searching, literature reviews, bibliography
compilations, and current awareness alerts. Librarians also conduct training classes for
researchers, demonstrating databases and other products.
3
NIEHS Library Website
The URL for the library’s homepage is http://library.niehs.nih.gov/. There is a
link to the library’s website from the NIEHS homepage, providing quick access for
researchers. The library’s site contains a variety of buttons that link to various sections:
New Books and Other News, Electronic Journals, Journals in the Library, Photocopy
Requests, Database Searching, Web Starting Points (includes Scientific and Consumer
Resources), Book Catalog, Reference Resources, NIEHS Publications, Library Staff,
FAQs, and an Orientation. The top of the page has space for new products and services.
Each page of the library’s site offers the same look and feel as the homepage.
Most pages have annotated lists of various resources, arranged in a combination of ways.
Some products are arranged alphabetically, such as electronic journals, while others are
arranged topically or by date. Other sections of the site, such as the Book Catalog and
the NIEHS Publications Database, utilize search interfaces. See Appendix A for screen
shots of selected pages on the website.
Web Logs at NIEHS
The Web Services Group at NIEHS collects web log statistics for many different
departments at the Institute, including the library. The Web Group’s Bill Watson
generates monthly reports with these statistics and posts them internally via a web-based
directory. In addition to the monthly reports, there are historical statistics available for
the past few years. NIEHS uses Analog 5.03 to analyze its raw web logs. Analog is
available for free at http://www.analog.cx/. In order to understand what log analysis
software does, it is necessary to understand what log files are and what they track.

4
LITERATURE REVIEW
Web Server Log Files
Log files are simply text files that record website traffic during a certain period of
time. Such files range in size and may be anywhere from 1 to 100 megabytes or more,
depending on the amount of traffic and the time frame recorded (Bertot, McClure, Moen
& Rubin, 1997). There are four different types of web server logs. Almost every web
server uses the access (or transfer) log and the error log. Many web servers also utilize
the referrer and agent logs (Bertot et al., 1997; Stout, 1997). The web server at NIEHS
utilizes all four types of logs (access, agent, error, and referrer) in a combined format.
When an Internet user pulls up a web page, the web server that hosts the page will
register the request and make an entry in the access log (Hightower, Sih, & Tilghman,
1998). The access log records the domain name or IP address, the date and time of the
request, and the item requested. The agent log provides information about the browser
name, browser version, and operating system a host is using. The error log gives the
status codes for failed requests to the server. Finally, the referrer log shows what
websites link to a particular web server. (Bertot et al., 1997; Stout, 1997). Appendix B
shows sample entries from the NIEHS Library website’s raw logs. The entries
demonstrate how the different log components come together. Note that the host fields of
the entries have been altered to ensure the privacy of users.
5
Distinguishing Hits, Page Views, and Visits
As stated previously, each request for a web page is recorded as a line, or “hit,” in
the access log (Hightower et al., 1998). A request for a single page, however, may
involve a multitude of transactions, each of which is counted. Not only is a hit recorded
for the web page itself, each graphic on the page generates a separate hit (Bertot et al.,
1997; Stout, 1997; Zawitz 1998). If a request for a page results in a redirect, both the
original request for the page and the redirected request are recorded (Stout, 1997).
Although hits are a valuable measure for determining whether a web server is robust
enough to accommodate demand, hits are likely to overestimate the actual use of a
website (Zawitz, 1998).
In order to understand the number of pages that users are actually viewing, it is
beneficial to examine HTML page requests only (Hightower et al., 1998; Zawitz, 1998).
This excludes other file types such as images files (i.e., .gif, .jpg, .jpeg, .png, etc.).
Instead of counting each component of one individual page as a hit, this type of measure
more accurately depicts a single page view. Still, using this method may overestimate
“true” page views because it is likely that some pages are visited for purely navigational
purposes. Also, tracking only HTML page requests may miss important information
about the use of downloadable files types such as .pdf, .zip, or .exe (Zawitz, 1998).
If consecutive page views of a unique user are grouped together over a specific
time frame, the resulting information describes a user “visit” (Stout, 1997) or “session”
(Zawitz, 1998). Data about how unique users navigate websites is interesting to both
librarians and advertisers. In fact, Kirsner calls such data “the holy grail of site
measurement” (1997, p. 36). There are a few different approaches for identifying user

6
“visits” to a website, including the utilization of cookies, registered usernames, and
hostnames (Stout, 1997).
Many websites utilize “cookies” to track visits. When a client accesses a website,
the server sends a packet of information called a cookie to the client browser. When the
browser accepts a cookie, it is stored to disk as a data file. The next time the client
accesses the same site, the browser sends a cookie back to the server so that the client can
be “recognized” as a previous visitor (Stout, 1997). The type of cookie just described is
called a persistent, or permanent, cookie. Persistent cookies work well for many
commercial websites, but U.S. government websites are legally barred from utilizing
persistent cookies because of privacy concerns. Instead, some federal websites employ
session cookies in order to increase functionality during a user’s visit. Session cookies
are temporarily stored in a computer’s RAM, not saved to disk, and should automatically
expire when a user closes the web browser (Harris, 2001; Houser, 2000). However,
session cookies cannot provide insight into patterns of website use by an individual. For
many reasons, cookies are not a viable option for federal agencies to consider in the quest
to understand user visits.
Some websites can track users by requiring them to register upon their first visit
to the site. The user will then be prompted to log in with a username and password for
each subsequent visit (Bauer, 2000; Stout, 1997). Websites that require users to register
generally offer some sort of special service that would make such registration worthwhile
(Stout, 1997). However, many web surfers would not want to bother with registering to
use the majority of the sites available on the Internet. Similarly, most websites want to
provide easy access to their site so that people can explore the content without
7
restrictions. It is not feasible for most websites, especially federal government websites,
to utilize such authentication methods to track user visits.
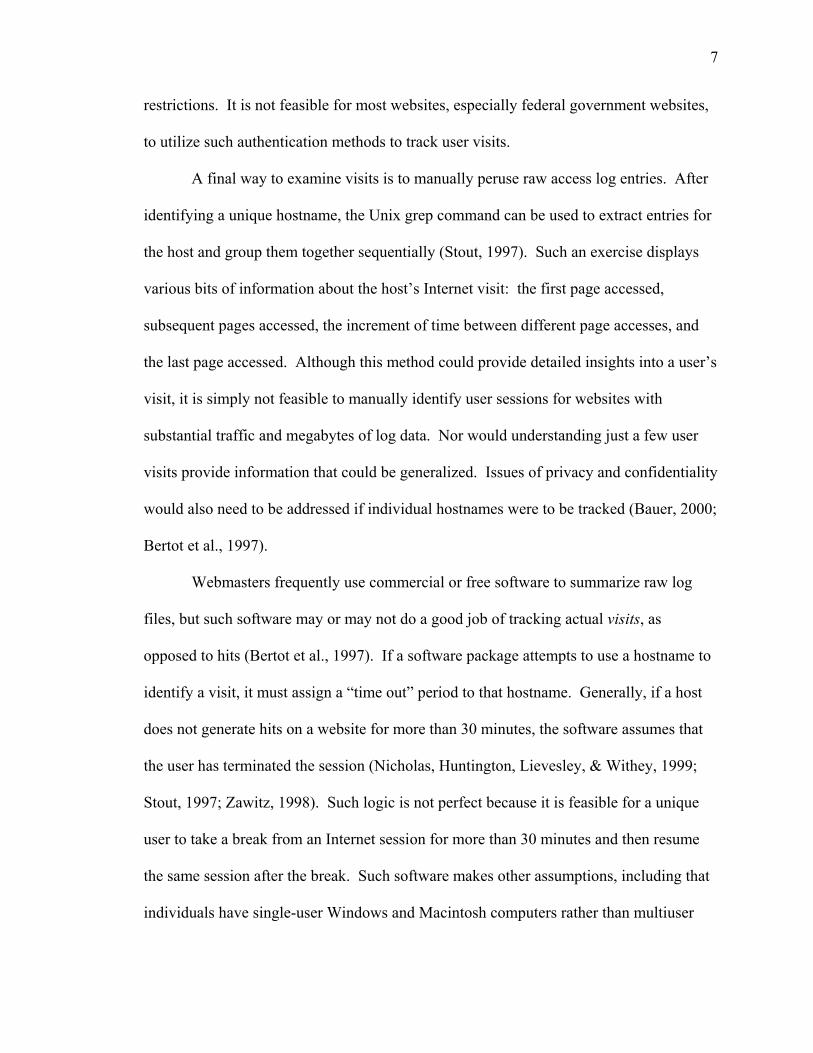
A final way to examine visits is to manually peruse raw access log entries. After
identifying a unique hostname, the Unix grep command can be used to extract entries for
the host and group them together sequentially (Stout, 1997). Such an exercise displays
various bits of information about the host’s Internet visit: the first page accessed,
subsequent pages accessed, the increment of time between different page accesses, and
the last page accessed. Although this method could provide detailed insights into a user’s
visit, it is simply not feasible to manually identify user sessions for websites with
substantial traffic and megabytes of log data. Nor would understanding just a few user
visits provide information that could be generalized. Issues of privacy and confidentiality
would also need to be addressed if individual hostnames were to be tracked (Bauer, 2000;
Bertot et al., 1997).
Webmasters frequently use commercial or free software to summarize raw log
files, but such software may or may not do a good job of tracking actual visits, as
opposed to hits (Bertot et al., 1997). If a software package attempts to use a hostname to
identify a visit, it must assign a “time out” period to that hostname. Generally, if a host
does not generate hits on a website for more than 30 minutes, the software assumes that
the user has terminated the session (Nicholas, Huntington, Lievesley, & Withey, 1999;
Stout, 1997; Zawitz, 1998). Such logic is not perfect because it is feasible for a unique
user to take a break from an Internet session for more than 30 minutes and then resume
the same session after the break. Such software makes other assumptions, including that
individuals have single-user Windows and Macintosh computers rather than multiuser

8
computers such as Unix systems. Additionally, the software assumes that users have
fixed IP addresses, when in reality some users may have dynamic IPs (Stout, 1997). For
these reasons, tracking user visits on a mass scale can be difficult and inaccurate.
Limitations of Web Log Analysis
There are numerous articles that discuss what web logs cannot reveal, and it is
imperative to understand the limits of web log analysis in order to maximize their
potential benefits. Dynamic IP addressing masks some individual users, meaning that
there is no foolproof way to determine how many users are new to a website and how
many are repeat visitors (Nicholas et al., 1999; Zawitz, 1998). Even if a significant
number of users were to have static IPs, one could not total up all of the IP addresses
present in the log files and expect to have an accurate “count” of individual users. Since
the same static IP could access the Internet numerous times, duplicate IPs would need to
be stripped out of the files in order to have a more accurate number of individual users.
Unless log analysis software does this, log data simply provides an estimation of hits or
page views.
Another limitation to web log analysis stems from a phenomenon known as
caching (Bauer, 2000). If an individual visits a web page, the browser stores the page in
its memory. When the user requests the same URL later, the browser will search to see if
the page is still cached, or stored in memory. If the page is cached, the browser will find
it in memory and display it rather than making a request to the web server. The result is
that the transaction will never be recorded in the web logs. As Fieber (2002) and
9
Goldberg (2001) reiterate, caching results in an underestimation of transactions between
the client and server.
Finally, web logs in themselves cannot provide insight into who is not visiting a
website, whether users find the answers to their inquiries, and whether individuals are
satisfied with the overall website experience (Zawitz, 1998). However, part of the value
of web log analysis is that it requires information professionals to define the goals of their
web presence, which in turn leads to more questions about an organization’s overall
objectives. As Nicholas et al. asserts, “The data raises questions, it does not in itself
provide answers. But just knowing what questions to ask is progress in itself” (1999, p.
266). Indeed, web statistics enable librarians to ask more informed questions to patrons
during usability studies, questionnaires, and interviews.
Benefits of Web Log Analysis
Web logs provide an unobtrusive way to observe a great deal of information. In
summary, web logs can uncover the following: what web pages are being requested, the
IP addresses/hostnames of computers making requests, the date and time of requests,
whether a request is successful or not, and the web page and/or search terms which lead
an individual to the site of interest (Bauer, 2000). Logs also reveal whether a user’s
computer is able to access enhanced features on a website, such as JavaScript and forms,
helping webmasters make appropriate design decisions (Bertot et al., 1997).
Considering all of the raw data that web logs offer, it is easy to see how
webmasters could become overwhelmed. Even when software is used to analyze raw
logs, the resulting reports must still be interpreted on a consistent basis (Bertot et al.,
10
1997). It is unfortunate the web logs in many organizations “have a habit of wriggling
away from any form of evaluation and assertion” (Nicholas et al., 1999, p. 265-266)
Indeed, it takes effort to extrapolate conclusions from web log reports, but the value in
such endeavors is the ability to compare patterns over time (Mariner, 2002; Nicholas et
al., 1999).
Librarians and other information professionals have an opportunity to take the
lead in determining how web statistics can benefit their organizations in various realms.
Web logs can provide a foundation to study management, marketing, and collection
development issues.
Practical Applications
Management
Bauer (2000) utilized web logs to try to determine if the people who accessed her
organization’s website were the same people who came into the library. Bertot et al.
(1997) and Hightower et al. (1998) isolated specific IP ranges in order to identify primary
and secondary user groups. Mariner (2002) discusses how to consider web statistics
when planning for a website redesign. Peters (1996) and Hightower et al. discuss how
web logs can help assess the value-added content on a website, giving concrete statistics
on whether the effort to create the content is justified by its use. Librarians can also
analyze web logs to gauge interest in certain areas of the site, thereby shaping the
direction of future bibliographic instruction efforts.

11
Marketing
Li (1999) utilized web logs to measure the effectiveness of a web promotional
campaign for an academic website. The study compared web statistics that were logged
before and after the promotion campaign to determine the effectiveness of marketing
efforts. Bauer (2000) looked at referrer URLs in order to understand how patrons found
her library’s website, whether it be via search engines or links on other sites.
Collection Development
Zawitz (1998) gained insight into user’s interests by examining the most
requested pages on the U.S. Bureau of Justice Statistics website, as well as the search
terms used to find such pages. Nicholas et al. (1999) suggests that libraries go a step
further and feature frequently requested pages in a “spotlight” section of the website,
which can help new users better navigate the site. Mariner (2002) believes that
librarians can use web statistics to evaluate whether good content is buried under too
many links. In such cases, the library’s collection may not need to be revised, only the
structure of the website. Finally, web statistics can capture information about the usage
of electronic journal titles, which can be compared to print journal usage and book
circulation statistics. Such information can help librarians anticipate future collection
development needs, as well as better allocate financial resources and physical space
toward specific formats.

12
METHODOLOGY
As previously stated, NIEHS uses Analog 5.03 to analyze its raw web logs.
Analog was developed by Stephen Turner and is available for free at
http://www.analog.cx/. Analog works on many platforms, is highly configurable, and
reports in 36 languages. It has had limited graphic capabilities in the past, although it
recently introduced a free add-on called Report Magic (http://www.reportmagic.org/) to
enhance Analog data with more charts and graphs. Although Analog provides a great
deal of information in its reports, it does not attempt to estimate the length of user visits.
This means that individual sessions cannot be tracked with Analog. Some commercial
software packages, such as WebTrends, use mathematical algorithms to estimate user
sessions. However, even WebTrends admits that the only way to measure unique visitors
to a website is to require visitors to log in with a username and password (Bauer, 2000).
Any “unique session” data generated by software, therefore, is an approximation at best.
Standard Reports
Even though Analog does not attempt to estimate the length of unique visits, it
still provides a great deal of data. The monthly reports for the NIEHS Library website
include the following subsections:
• General Summary: Total number of successful and unsuccessful requests (requests for pages, graphic files, scripts, etc.), successful requests for pages (only complete HTML pages), redirected requests for a URL, data transferred (total bytes contained in all of the file types requested), distinct files
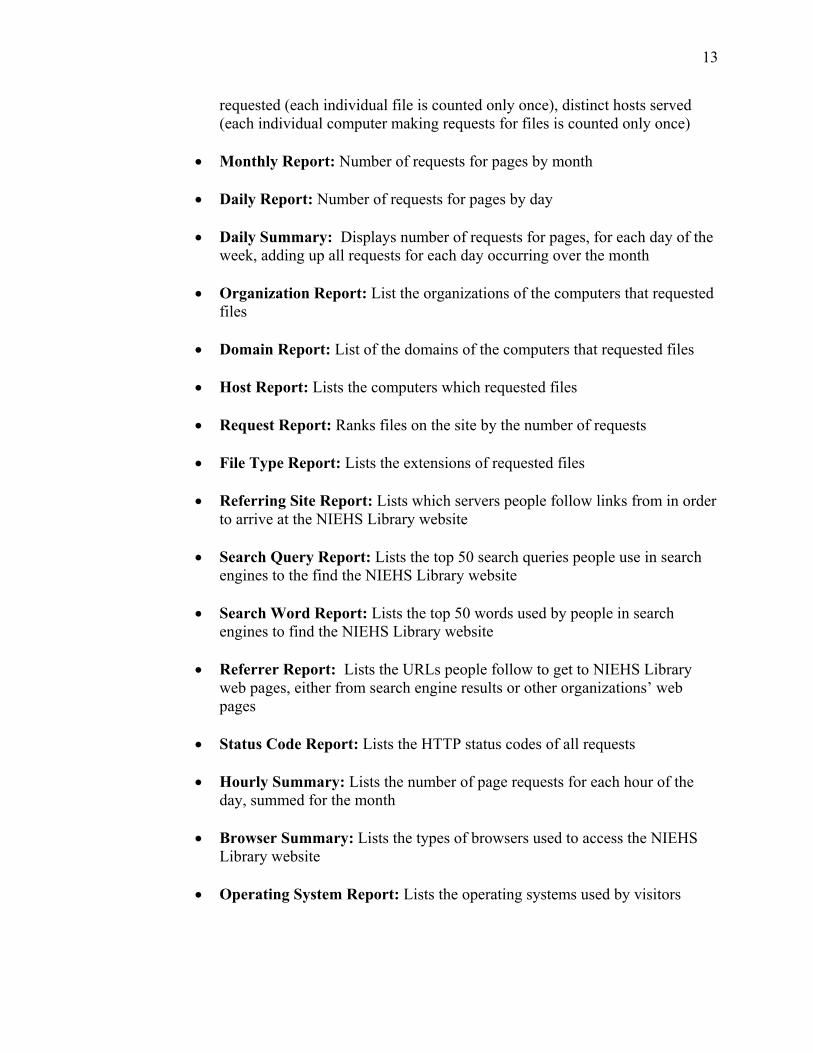
13
requested (each individual file is counted only once), distinct hosts served (each individual computer making requests for files is counted only once)
• Monthly Report: Number of requests for pages by month • Daily Report: Number of requests for pages by day
• Daily Summary: Displays number of requests for pages, for each day of the
week, adding up all requests for each day occurring over the month
• Organization Report: List the organizations of the computers that requested files
• Domain Report: List of the domains of the computers that requested files
• Host Report: Lists the computers which requested files
• Request Report: Ranks files on the site by the number of requests
• File Type Report: Lists the extensions of requested files
• Referring Site Report: Lists which servers people follow links from in order
to arrive at the NIEHS Library website
• Search Query Report: Lists the top 50 search queries people use in search engines to the find the NIEHS Library website
• Search Word Report: Lists the top 50 words used by people in search
engines to find the NIEHS Library website
• Referrer Report: Lists the URLs people follow to get to NIEHS Library web pages, either from search engine results or other organizations’ web pages
• Status Code Report: Lists the HTTP status codes of all requests
• Hourly Summary: Lists the number of page requests for each hour of the
day, summed for the month
• Browser Summary: Lists the types of browsers used to access the NIEHS Library website
• Operating System Report: Lists the operating systems used by visitors
14
This study concentrates on some subsections of the monthly reports more than
others, such as the request and daily summary reports, but the intention is to extrapolate
conclusions from each subsection. Future reports can be streamlined if certain
subsections provide less pertinent information than others. The monthly reports can also
be customized to better identify trends for certain groups of users, which leads to more
useful and accurate conclusions.
Customized Reports
Instead of utilizing the standard web analysis reports generated for the library, ten
customized reports have been created for this project. The reports cover January to
March 2002. Analog can be configured to exclude certain file types, as well as certain
hostnames or IP ranges. The customized reports capitalize on this feature and therefore
provide more targeted results. Since many computers at NIEHS have unique
hostnames/static IPs, the exclusion of certain hostnames/IP ranges is a way to isolate user
groups within the Institute. However, users who access the library’s website from
outside of the Institute may not have static IPs and cannot be isolated as reliably.
Although the ten reports differ in which IP ranges have been excluded, all of them
exclude the following file types in order to provide a better estimation of page views, not
hits: .GIF, .JPG, .JPEG, .PNG, .gif, .jpg, .jpeg, .png, .MID, .WAV, .MOV, .mid, .mov,
.css, .class, /cgi-bin, robots.txt. All custom reports contain the subsections described
previously, but each one targets a particular group of users or a certain URL. The data of
interest from the reports was entered into an Excel spreadsheet in order to calculate trends
over the three-month period. A description of the ten reports follows:
15
1. Default Report – Includes all IP ranges except for those of NIEHS Library staff
and the NIEHS Web Services Group. This report decreases the inflation of statistics generated by updates to the website. The summary statistics in this report serve as a point of reference for most other reports.
2. NIEHS Library Staff - Includes IPs for NIEHS Library staff only. Provides a
glimpse into the searching patterns of NIEHS librarians, as well as document delivery work. This information can be compared to Report #4 to see if librarians have different usage patterns than other departments at NIEHS.
3. NIEHS Library Public Workstations – Includes IPs for the four public
workstations in the library only. By comparing this report to Report #4, shows insight into what users are doing on the website while physically in the library, in comparison to what web information users access from their desktops in their offices or labs.
4. NIEHS Other Staff (Scientists, etc.) – Includes IP ranges for all scientists and
staff at NIEHS, except for library staff and the web services group. This report is one of the most valuable since this group is a primary user group of the NIEHS Library.
5. NIH - Includes IP ranges for the National Institutes of Health (NIH) and all of the
agencies it supervises except NIEHS. Helps determine how much users outside NIEHS, but still within the auspices of NIH, utilize the NIEHS website.
6. External – Includes IPs for all users outside of NIEHS and outside of NIH.
External users are probably most interested in the library’s consumer health resources, and this report is designed to test this theory.
7. New Books & Other News - Tracks http://library.niehs.nih.gov/libserv/new.htm,
the library’s web page that announces new book acquisitions and new articles/manuscripts published by NIEHS researchers. The page is updated each month, after which the library’s Director sends out an email to the NIEHS community to announce the new offerings. This report will gauge whether this marketing effort results in more views of the “New Books” page. Excludes IP ranges for NIEHS Library staff and NIH staff.
8. New Books and Bibliography (January 2002) – Tracks two links on
http://library.niehs.nih.gov/libserv/new.htm(New Books and Other News): http://library.niehs.nih.gov/newsltr/2002/nbks0102.htm (New Books for January 2002) and http://library.niehs.nih.gov/newsltr/2002/bibjan02.htm (New Articles for January 2002). This report will help gauge whether the email marketing effort results in more views of January’s acquisitions. It will also show how long patrons continue to view new acquisitions. Excludes IP ranges for NIEHS Library staff and NIH staff.
16
9. New Books and Bibliography (February 2002) – Tracks two links on
http://library.niehs.nih.gov/libserv/new.htm (New Books and Other News): http://library.niehs.nih.gov/newsltr/2002/nbks0202.htm (New Books for February 2002) and http://library.niehs.nih.gov/newsltr/2002/bibfeb02.htm (New Articles for February 2002). This report will help gauge whether the email marketing effort results in more views of February’s acquisitions. It will also show how long patrons continue to view new acquisitions. Excludes IP ranges for NIEHS Library staff and NIH staff.
10. New Books and Bibliography (March 2002) – Tracks two links on
http://library.niehs.nih.gov/libserv/new.htm (New Books and Other News): http://library.niehs.nih.gov/newsltr/2002/nbks0302.htm (New Books for March 2002) and http://library.niehs.nih.gov/newsltr/2002/bibmar02.htm (New Articles for March 2002). This report will help gauge whether the email marketing effort results in more views of March’s acquisitions. It will also show how long patrons continue to view new acquisitions. Excludes IP ranges for NIEHS Library staff and NIH staff.
ClickCount Database
The reports generated by Analog are an excellent way to track activity on
“internal” links of the library’s website. However, most pages on the library’s site, such
as those with electronic journals, consumer resources, and databases, have links that lead
to “external” sites. Such links cannot be tracked by Analog reports. In order to better
gauge usage for the “external” links, the library started the “ClickCount” project.
The ClickCount script is a PERL script that was applied to specific URLs on the
library’s website. The script is an adaptation of GuzZzt ClickCount V. 1.2.1, developed
by Gustav Evertsson and available for free at http://www.GuzZzt.com. The script counts
the number of times people click on the URL for a certain resource (such as an electronic
journal title or a database product). After the NIEHS Library tested the script in February
2002, the ClickCount project went live in March.
The Systems Librarian applied the script to all e-journals in early March. The
script was gradually applied to all of the links for databases and selected scientific and

17
consumer resources. The timetable for script application is included in Appendix C. The
date that a URL was wrapped with the script is crucial to note because it influences the
breadth of the data. If the script was not added to certain types of resources until April,
then clicks on those resources will seem low when compared to resources that received
the script in March. For this paper, ClickCount data for March, April, and May is
evaluated. Although the Analog reports cover January to March, it is reasonable to
analyze the ClickCount information in the context of the Analog reports. This is because
the library’s web logs are fairly consistent from month to month.
The library created an Access database to which the script automatically dumps
the ClickCount data. The database was designed with the capability to separate clicks
rendered by “internal” and “external” users. Internal users are those employed at NIEHS,
while external users include everyone outside of the Institute. IP ranges for library
employees, but not the library’s public workstations, were excluded in many queries.
Queries were designed to extract the following information from the database:
1. Ranked lists of high-use and low-use electronic journals, determined by the number of clicks on the URL for each journal title. Usage of electronic journals can be compared to past usage studies for print titles in order to make collection development decisions (what is the preferred journal format, what are the most popular journal titles). Such information is vital because of the library’s space concerns for accommodating print material.
2. Ranked list of selected databases being tracked, determined by the number of
clicks on the URL for each resource. This will help gauge which databases are the most popular, as well as those that do not get as much usage. Library staff can use this report to make decisions about which databases should be targeted in bibliographic instruction efforts. This data can also impact subscription decisions.
3. Number of clicks on the three main Medline interfaces offered on the library’s
site: PubMed, OVID, and Silverplatter. PubMed is linked at two different places on the site, so this query also shows the most popular access point for PubMed.
18
4. Number of clicks on value-added content (Web of Science abstracts) on the NIEHS Bibliography pages for January - May 2002. The addition of value-added content requires considerable time and effort by the library staff. Using Web of Science as an indicator, this report will determine whether value-added content is being accessed.
5. Number of clicks on links to the Essential Science Indicators (ESI) database, a
new library resource, which appears in three places on the library’s website (the “New” section on the homepage, the “New Books and Other News” page, and the Database page). This will determine the most prominent position on the website for new products.
6. Ranked list of Scientific Resources, determined by the number of clicks on the
URL for each resource. These resources were only tracked from May 29 – June 13. This information will help understand which types of web resources are most used by scientists, and can help shape future selections for this section.
7. Ranked list of selected Consumer Resources, determined by the number of clicks
on the URL for each resource. This report has a collection development component in deciding which of library’s consumer resources are being used the most, and whether it is NIEHS scientists or the general public who benefit the most from such resources.

19
RESULTS
This section displays the plethora of information generated by the Analog reports
and the ClickCount database queries. The Analog reports cover the time period of
January to March, 2002. The ClickCount data covers the period of March to May, 2002.
The data from both Analog and ClickCount is presented in an integrated fashion
according to topic. There are general topics that provide a comprehensive view of the
web log data. These include: the number of successful page requests; requests by month,
day, and hour; requests by public workstations in the library; requests by operating
system, browser, and status code; requests by domain; requests by referrer; top search
queries; and most-requested pages.
There are also specific topics that provide insight into collection development,
marketing, and management issues within the library. Such topics deal with certain
sections or resources on the library’s website. These include: electronic journals (top
and low-use); electronic databases; requests for Medline via three different interfaces;
requests and referrers for Essential Science Indicators; web starting points; scientific
resources; consumer resources; frequently asked questions; new books and other news;
Web of Science abstracts on "new articles" pages; and bibliography pages.

20
General Summary of Requests
For the period of January – March 2002, there were 121,050 total requests for
pages on the NIEHS Library website. NIEHS staff, excluding library staff, made almost
67% of these requests. Library personnel made 4% of requests, while requests from the
public workstations in the library accounted for 3% of the total number. The general
public (outside of NIEHS and NIH) made about 25% of the requests, while NIH staff
(excluding NIEHS) made around 1% of requests. The average number of successful
requests for pages per day was 1,347.
The total number of failed requests for the 3-month period equals 7,599. Many of
the failed requests for the general public can probably be attributed to the fact that most
e-journals and databases are only accessible to staff at NIEHS. There were 973 distinct
files requested, and 26,540 distinct hosts served. Table 1 shows requests by user group.
Table 1: General Summary of Activity for NIEHS Library Website, Jan. - Mar. 2002
NIEHS
Library Staff
NIEHS Other Staff
NIEHS Library Public Workstations
NIH Staff (excludes NIEHS)
General Public Total:
Successful requests for pages
5,097 (4%)
80,897(67%)
3,343(3%)
1,532(1%)
30,181 (25%)
121,050(100%)
Average successful requests for pages/day
59 (4%)
899(67%)
37(3%)
17(1%)
335 (25%)
1,347(100%)
Failed requests
78 (1%)
3,776(50%)
5(.07%)
227(3%)
3,513 (46%)
7,599(100%)
Distinct files requested
134 (14%)
349(36%)
70(7%)
111(11%)
309 (32%)
973(100%)
Distinct hosts served
10 (.04%)
13,692(52%)
4(.02%)
82(.3%)
12,752 (48%)
26,540(100%)

21
Requests by Time Period The library’s website shows a consistent pattern of use across the months of
January, February, and March 2002. January was slightly busier than the other two
months, but each month was only separated by small margins of requests. NIEHS staff,
once again, accounted for the most requests, but the general public contributed as well.
Table 2 shows a breakdown by month and user group.
Table 2: Requests for Web Pages by Month, Jan. - Mar. 2002 NIEHS
Library Staff
NIEHS Other Staff
NIEHS Library Public Workstations
NIH Staff (excludes NIEHS)
General Public Total:
January
1,521 (4%)
27,631(68%)
1,040(3%)
564(1%)
9,982 (24%)
40,738(100%)
February
1,747 (4%)
27,488(68%)
1,008(3%)
450(1%)
9,604 (24%)
40,297(100%)
March
1,829 (5%)
25,778(64%)
1,295(3%)
518(1%)
10,595 (27%)
40,015(100%)
In addition to a monthly breakdown, it is useful to consider weekly requests for
pages. Wednesday shows the largest number of requests, making it the busiest day of the
week for the library’s website. Each day of the weekend shows about half of the requests
as the busiest day, but this is still a decent amount of usage. It is especially intriguing to
note that the library’s public workstations are used during the weekends, even though the
library is not staffed at those times. Although it is impossible to accurately depict the
number of people who physically use the library solely from public workstation statistics,
such data does indicate that NIEHS scientists have a physical presence in the library
during the weekend. See Table 3 for further insight.
22
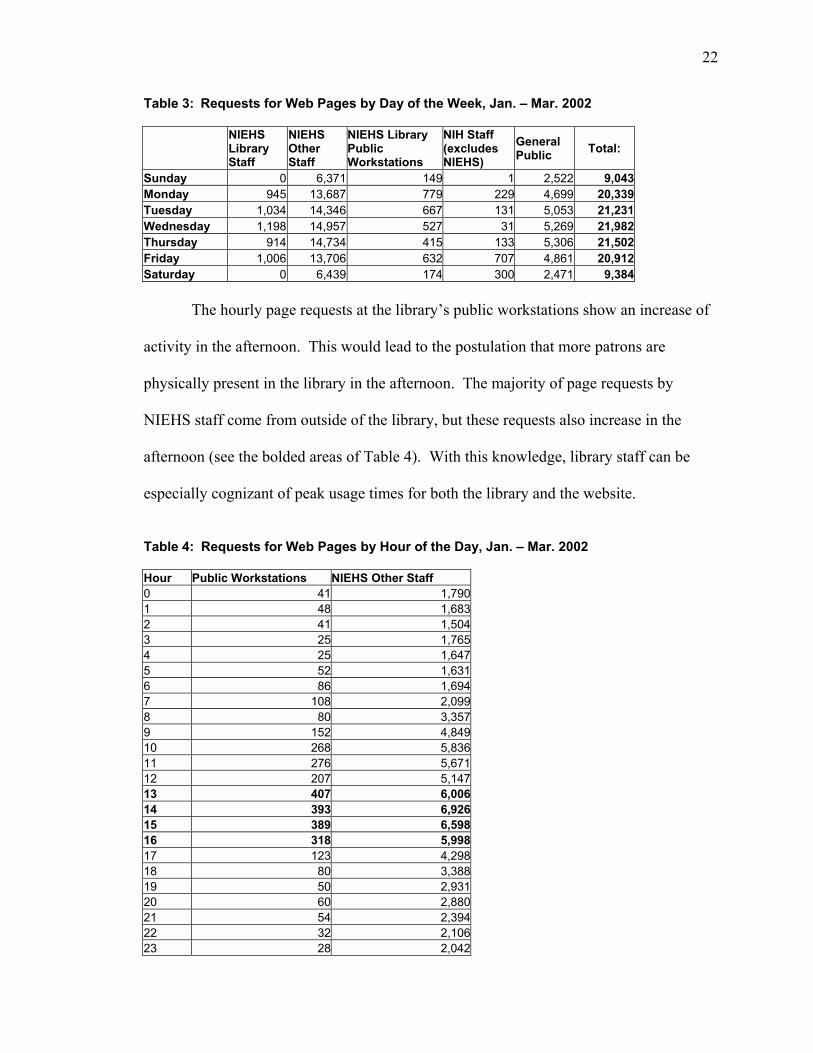
Table 3: Requests for Web Pages by Day of the Week, Jan. – Mar. 2002
NIEHS Library Staff
NIEHS Other Staff
NIEHS Library Public Workstations
NIH Staff (excludes NIEHS)
General Public Total:
Sunday 0 6,371 149 1 2,522 9,043Monday 945 13,687 779 229 4,699 20,339Tuesday 1,034 14,346 667 131 5,053 21,231Wednesday 1,198 14,957 527 31 5,269 21,982Thursday 914 14,734 415 133 5,306 21,502Friday 1,006 13,706 632 707 4,861 20,912Saturday 0 6,439 174 300 2,471 9,384
The hourly page requests at the library’s public workstations show an increase of
activity in the afternoon. This would lead to the postulation that more patrons are
physically present in the library in the afternoon. The majority of page requests by
NIEHS staff come from outside of the library, but these requests also increase in the
afternoon (see the bolded areas of Table 4). With this knowledge, library staff can be
especially cognizant of peak usage times for both the library and the website.
Table 4: Requests for Web Pages by Hour of the Day, Jan. – Mar. 2002
Hour Public Workstations NIEHS Other Staff 0 41 1,7901 48 1,6832 41 1,5043 25 1,7654 25 1,6475 52 1,6316 86 1,6947 108 2,0998 80 3,3579 152 4,84910 268 5,83611 276 5,67112 207 5,14713 407 6,00614 393 6,92615 389 6,59816 318 5,99817 123 4,29818 80 3,38819 50 2,93120 60 2,88021 54 2,39422 32 2,10623 28 2,042

23
When the public workstations were used, no matter what day of the week, patrons
had a clear preference for PCs as opposed to Macs. The “Stand-up” Mac and the “Stand-
up” PC are beside each other on a table close to the library’s entrance. The “Sit-down”
Mac and “Sit-down” PC are stationed on separate tables but next to each other. The sit-
down machines are slightly farther from the library’s entrance. The data indicates that
when the Stand-up PC is already occupied, patrons would rather walk to the Sit-down PC
than use the Stand-up Mac. See Table 5.
Table 5: Requests for Web Pages by Library Public Workstations, Jan. – Mar. 2002 Workstation Requests % Requests Stand-up PC 1,492 45%Sit-down PC 1,117 33%Stand-up Mac 415 12%Sit-down Mac 319 10%Total: 3,343 100%
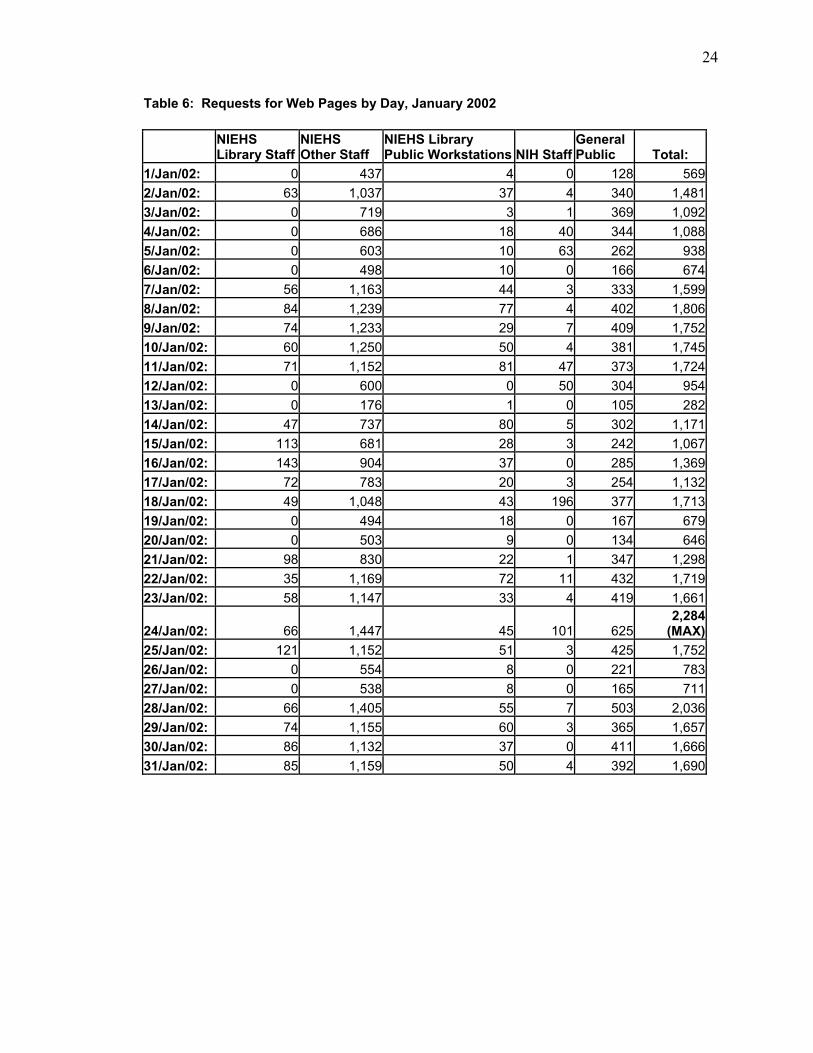
Although there is a pattern of usage by day of the week and hour of the day, there
is not an established pattern of usage by day of the month. In other words, three months
of data have not revealed whether the library’s website receives more requests at the
beginning, middle, or end of the month. In fact, when “requests per day” is the measure
of usage, there is a different pattern for each month. In January, the maximum value of
2,284 occurs at the end of the month. In February, the beginning of the month shows the
maximum value of 2,163. Finally, March’s maximum value of 1,930 occurs in the
middle of the month. Although the daily breakdown does not establish a definitive
pattern for usage within the month, there is relative consistency in the maximum values.
Tables 6, 7, and 8 show a breakdown of requests by day and user group. The maximum
daily value for each month is highlighted in bold typeface.
24
Table 6: Requests for Web Pages by Day, January 2002
NIEHS Library Staff Other Staff
NIEHS NIEHS Library Public Workstations NIH Staff
General Public Total:
1/Jan/02: 0 437 4 0 128 5692/Jan/02: 63 1,037 37 4 340 1,4813/Jan/02: 0 719 3 1 369 1,0924/Jan/02: 0 686 18 40 344 1,0885/Jan/02: 0 603 10 63 262 9386/Jan/02: 0 498 10 0 166 6747/Jan/02: 56 1,163 44 3 333 1,5998/Jan/02: 84 1,239 77 4 402 1,8069/Jan/02: 74 1,233 29 7 409 1,75210/Jan/02: 60 1,250 50 4 381 1,74511/Jan/02: 71 1,152 81 47 373 1,72412/Jan/02: 0 600 0 50 304 95413/Jan/02: 0 176 1 0 105 28214/Jan/02: 47 737 80 5 302 1,17115/Jan/02: 113 681 28 3 242 1,06716/Jan/02: 143 904 37 0 285 1,36917/Jan/02: 72 783 20 3 254 1,13218/Jan/02: 49 1,048 43 196 377 1,71319/Jan/02: 0 494 18 0 167 67920/Jan/02: 0 503 9 0 134 64621/Jan/02: 98 830 22 1 347 1,29822/Jan/02: 35 1,169 72 11 432 1,71923/Jan/02: 58 1,147 33 4 419 1,661
24/Jan/02: 66 1,447 45 101 625 2,284
(MAX)25/Jan/02: 121 1,152 51 3 425 1,75226/Jan/02: 0 554 8 0 221 78327/Jan/02: 0 538 8 0 165 71128/Jan/02: 66 1,405 55 7 503 2,03629/Jan/02: 74 1,155 60 3 365 1,65730/Jan/02: 86 1,132 37 0 411 1,66631/Jan/02: 85 1,159 50 4 392 1,690

25
Table 7: Requests for Web Pages by Day, February 2002
NIEHS Library Staff
NIEHS Other Staff
NIEHS Library Public Workstations NIH Staff
General Public Total:
1/Feb/02: 47 1,105 62 112 347 1,6732/Feb/02: 0 587 19 0 212 8183/Feb/02: 0 567 14 0 198 7794/Feb/02: 122 1,309 70 0 386 1,887
5/Feb/02: 76 1,415 56 2 614 2,163
(MAX)6/Feb/02: 97 1,206 24 3 424 1,7547/Feb/02: 74 1,239 29 1 408 1,7518/Feb/02: 62 1,151 46 56 431 1,7469/Feb/02: 0 501 5 74 163 74310/Feb/02: 0 596 8 0 219 82311/Feb/02: 78 1,189 57 81 428 1,83312/Feb/02: 64 1,146 41 3 364 1,61813/Feb/02: 62 1,258 40 0 335 1,69514/Feb/02: 48 1,281 28 2 431 1,79015/Feb/02: 67 987 40 1 336 1,43116/Feb/02: 0 455 15 0 139 60917/Feb/02: 0 522 13 0 191 72618/Feb/02: 0 813 47 0 349 1,20919/Feb/02: 99 1,128 45 5 367 1,64420/Feb/02: 176 1,134 38 4 419 1,77121/Feb/02: 94 1,017 15 1 332 1,45922/Feb/02: 142 971 49 93 340 1,59523/Feb/02: 0 518 12 4 142 67624/Feb/02: 0 503 12 0 195 71025/Feb/02: 130 1,083 101 2 436 1,75226/Feb/02: 117 1,091 64 0 391 1,66327/Feb/02: 121 1,458 34 3 492 2,10828/Feb/02: 71 1,258 24 3 515 1,871

26
Table 8: Requests for Web Pages by Day, March 2002
NIEHS Library Staff
NIEHS Other Staff
NIEHS Library Public Workstations NIH Staff
General Public Total:
1/Mar/02: 102 940 43 86 292 1,4632/Mar/02: 0 513 11 0 152 6763/Mar/02: 0 556 22 0 203 7814/Mar/02: 110 1,245 42 0 440 1,8375/Mar/02: 124 1,202 65 6 502 1,8996/Mar/02: 93 1,168 41 1 475 1,7787/Mar/02: 118 1,122 24 1 353 1,6188/Mar/02: 88 1,154 27 32 387 1,6889/Mar/02: 0 525 27 70 188 81010/Mar/02: 0 515 19 0 187 72111/Mar/02: 92 1,134 57 129 410 1,82212/Mar/02: 64 1,086 34 1 392 1,57713/Mar/02: 49 1,100 83 5 454 1,691
14/Mar/02: 48 1,396 29 6 451 1,930
(MAX)15/Mar/02: 104 1,015 51 0 306 1,47616/Mar/02: 0 497 33 0 188 71817/Mar/02: 0 621 19 1 248 88918/Mar/02: 70 940 142 1 345 1,49819/Mar/02: 85 1,022 38 90 457 1,69220/Mar/02: 102 758 67 0 443 1,37021/Mar/02: 85 786 28 2 426 1,32722/Mar/02: 60 1,021 42 0 601 1,72423/Mar/02: 0 187 10 0 136 33324/Mar/02: 0 316 8 0 231 55525/Mar/02: 76 1,060 62 0 420 1,61826/Mar/02: 99 908 83 3 397 1,49027/Mar/02: 74 895 27 0 363 1,35928/Mar/02: 93 862 70 4 369 1,39829/Mar/02: 93 692 79 41 302 1,20730/Mar/02: 0 231 6 39 197 47331/Mar/02: 0 311 6 0 280 597

27
Requests by Operating System, Browser, and Status Code
In order to develop and maintain a functional website for patrons, it is important
to understand what operating systems and browsers these patrons use. It is also necessary
to evaluate the number of requests that are successful (status code 200) versus the number
of unsuccessful requests. The primary user group of the NIEHS Library includes its
scientists and other staff. The library’s staff is not included in this group in order to
better portray the library’s primary patrons. Table 9 shows that the majority of requests
(43%) are generated from Windows machines, although it is worthwhile to note that the
operating system for 38% of requests could not be determined.
Table 9: Operating Systems Used to Request Pages by NIEHS Staff (excluding Library Staff), Jan. – Mar. 2002 Operating System Requests % Requests Windows 35,977 43% Macintosh 15,090 18% OS Unknown 32,251 38% Unix 762 .9% Total: 84,080 100%
Table 10 shows the top two browsers used by NIEHS staff, Netscape and Internet
Explorer. It seems that Netscape 4.75 made 21% of requests, more than any other
version of Netscape. Netscape’s most current version, 6.2.3, does not seem to be used at
all. In terms of Internet Explorer, version 5.5 was the most widely used with 32% of
requests. The most current edition of Explorer is version 6.

28
Table 10: Browsers Used to Request Pages by NIEHS Staff (excluding Library Staff), Jan. – Mar. 2002 Browser Requests % Requests Mozilla (i.e., Netscape) Mozilla/4.75 5,627 21%Mozilla/4 (other) 5,021 19%Mozilla/4.77 3,346 13%Mozilla/4.7 2,937 11%Mozilla/4.72 2,016 8%Mozilla/4.61 1,830 7%Mozilla/4.76 1,746 6%Mozilla/4.77C-CCK-MCD 1,582 6%Mozilla/4.78 1,508 6%Mozilla/4.74 868 3%Total: 26,481 100%Internet Explorer MSIE/5.5 8,057 32%MSIE/5.01 6,427 25%MSIE/5.0 4,793 19%MSIE/6 4,505 18%MSIE/4 1,448 6%Total: 25,230 100%
According to Table 11, the majority of requests for pages by NIEHS staff have
Status Code 200, or “OK” (84%). Only 3% have Status Code 404, or “Document Not
Found.” The remainder of the status codes are detailed below.
Table 11: Status Codes for Page Requests by NIEHS Staff (excluding Library Staff), Jan. – Mar. 2002 Status Code Requests % Requests 200 OK 74,263 84%206 Partial content 210 0.2%301 Document moved permanently 11 .01%304 Not modified since last retrieval 9,961 11%400 Bad request 14 .02%403 Access forbidden 1,532 2%404 Document not found 2,228 3%405 Method not allowed 2 .002%Total: 88,221 100%
29
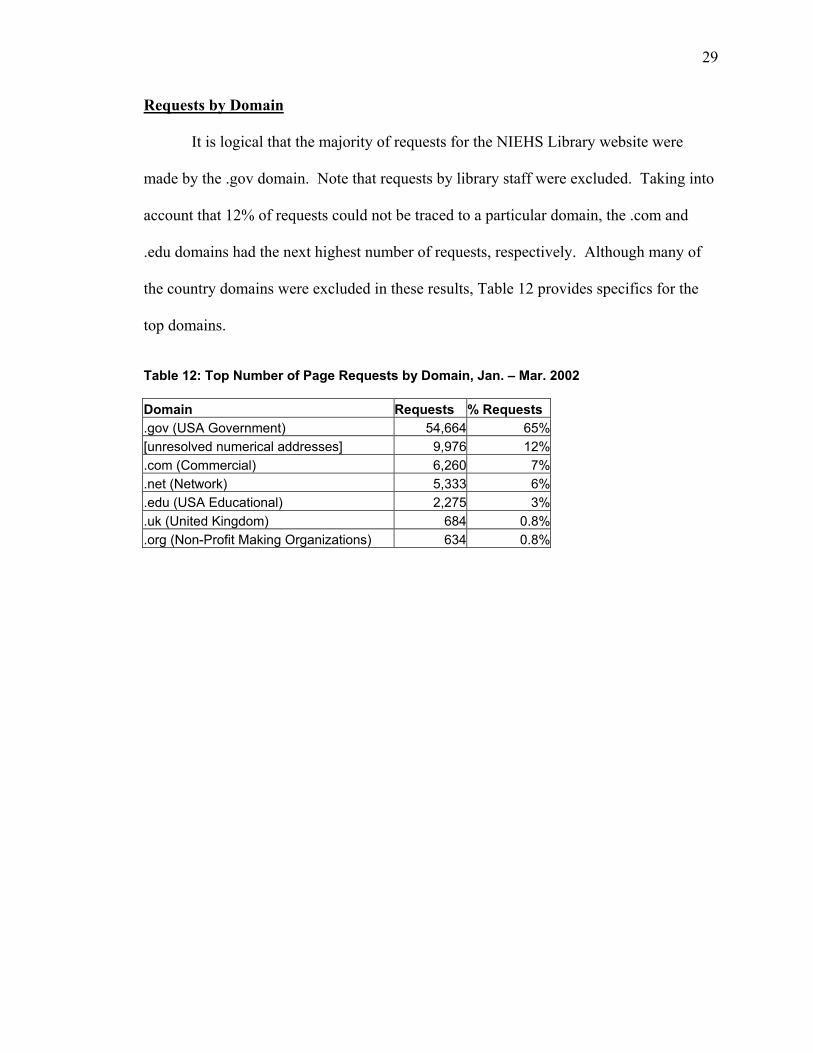
Requests by Domain It is logical that the majority of requests for the NIEHS Library website were
made by the .gov domain. Note that requests by library staff were excluded. Taking into
account that 12% of requests could not be traced to a particular domain, the .com and
.edu domains had the next highest number of requests, respectively. Although many of
the country domains were excluded in these results, Table 12 provides specifics for the
top domains.
Table 12: Top Number of Page Requests by Domain, Jan. – Mar. 2002 Domain Requests % Requests .gov (USA Government) 54,664 65%[unresolved numerical addresses] 9,976 12%.com (Commercial) 6,260 7%.net (Network) 5,333 6%.edu (USA Educational) 2,275 3%.uk (United Kingdom) 684 0.8%.org (Non-Profit Making Organizations) 634 0.8%
30
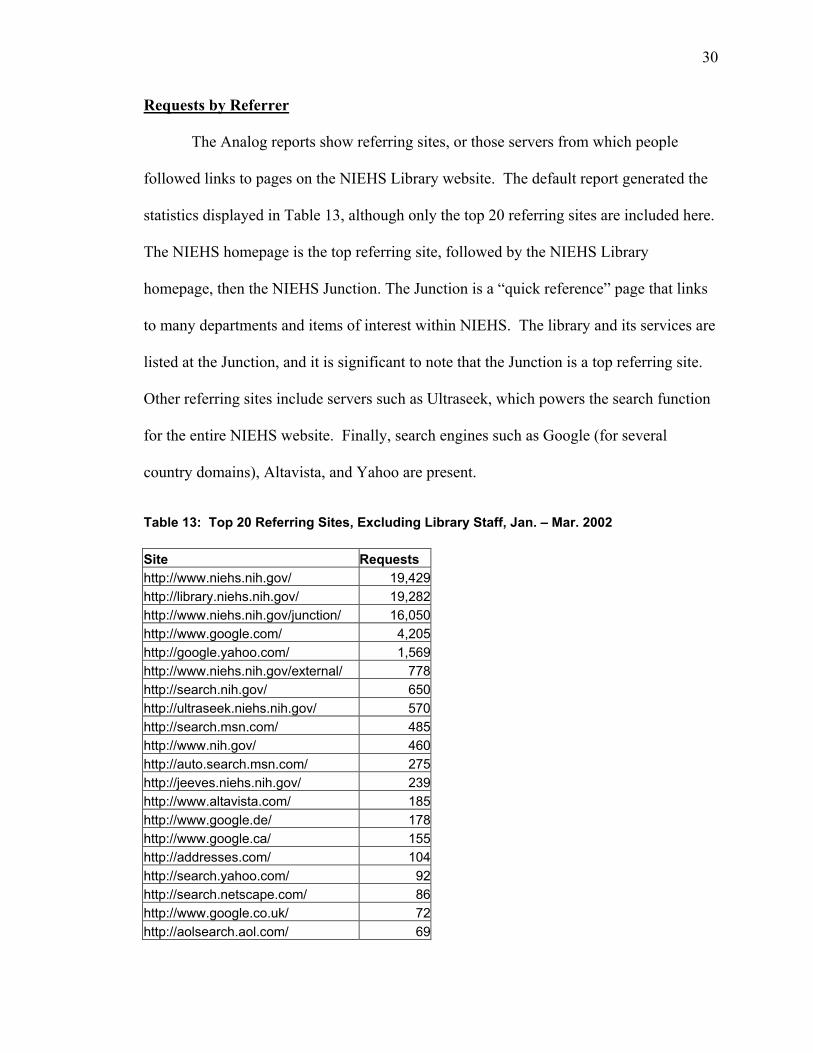
Requests by Referrer
The Analog reports show referring sites, or those servers from which people
followed links to pages on the NIEHS Library website. The default report generated the
statistics displayed in Table 13, although only the top 20 referring sites are included here.
The NIEHS homepage is the top referring site, followed by the NIEHS Library
homepage, then the NIEHS Junction. The Junction is a “quick reference” page that links
to many departments and items of interest within NIEHS. The library and its services are
listed at the Junction, and it is significant to note that the Junction is a top referring site.
Other referring sites include servers such as Ultraseek, which powers the search function
for the entire NIEHS website. Finally, search engines such as Google (for several
country domains), Altavista, and Yahoo are present.
Table 13: Top 20 Referring Sites, Excluding Library Staff, Jan. – Mar. 2002 Site Requests http://www.niehs.nih.gov/ 19,429http://library.niehs.nih.gov/ 19,282http://www.niehs.nih.gov/junction/ 16,050http://www.google.com/ 4,205http://google.yahoo.com/ 1,569http://www.niehs.nih.gov/external/ 778http://search.nih.gov/ 650http://ultraseek.niehs.nih.gov/ 570http://search.msn.com/ 485http://www.nih.gov/ 460http://auto.search.msn.com/ 275http://jeeves.niehs.nih.gov/ 239http://www.altavista.com/ 185http://www.google.de/ 178http://www.google.ca/ 155http://addresses.com/ 104http://search.yahoo.com/ 92http://search.netscape.com/ 86http://www.google.co.uk/ 72http://aolsearch.aol.com/ 69

31
Requests by Search Query Since search engines are part of the list of referring sites, it makes sense to
examine the top search queries that are used to access pages on the NIEHS Library
website. Table 14 shows many of these queries; there are some trends. For example,
various phrases indicate that searchers are looking for information on Chemical Abstracts
Service (CAS) Registry Numbers. It is feasible that a searcher types such a query into
Google and retrieves the NIEHS Library’s list of links on this topic. However, it is
improbable that NIEHS scientists would be using Google to search for information on the
library’s website. It is possible that scientists go to the library website and do not readily
find information on CAS Registry Numbers, leading them to use the site’s search
function. Three sections of the website currently have information about Registry
Numbers (Web Starting Points/Scientific Resources, Reference Resources, and Database
Searching). It may make sense to move the Registry Number links to a more prominent
section of the website, or note that ChemIDplus, one of the “Quick Links” on the
Database page, can be used to find Registry Numbers.
Not only can search queries provide insight into navigational behavior, but also
indicate topics that are of interest to library patrons. Librarians can use search queries as
clues to better develop certain subject areas of the website, in addition to the book and
journal collection. More data would need to be gathered for purposes of collection
development, but the data in Table 14 is a start. Diethylstilbestrol (DES), birth defects,
brain diseases, chemical sensitivity, and lead poisoning are some of the noteworthy
search phrases.

32
Table 14: Top Search Queries, Excluding Library Staff, Jan. – Mar. 2002 Search Query Requests Search Query Requestsdiethylstilbestrol 475 environmental health journals 8 cas numbers 460 chemical sensitivity 7 niehs 168 niehs library 7 cas registry 133 microwaves health 7 www.niehs.gov 110 mishina y 7 disaster photos 62 cas numbers list 7 cas registry number 50 information on birth defects 6 cas registry numbers 48 chemical dictionary 6
brain diseases 45 neurotoxicity of fumonisin b1 blood brain barrier 6
chemical cas numbers 32 dopamine 6 neuroscience 31 lead 6 lead poisoning 24 chemical abstracts service number 6 www.niehs.org 24 author huff 6 journal of environmental health 23 emphysema and cadmium neurotoxicity 6 nutrition 22 chemical abstracts service registry 6
metallothionein 19 national institute of environmental health sciences 6
library 18 asthma resources 6 thioglycolic acid 17 chemical abstracts registry 6 multiple chemical sensitivity 17 antioxidants 6 ultraviolet light 15 electromagnetic microwaves 6 chemical abstracts service registry number 12 nitric oxide 6 database searching 12 alternative medicine 6 acta endocrinologica 12 journal of neuroscience research 5 chemical abstracts registry numbers 12 chemical abstracts service registry numbers 5 opioid 11 microwaves 5 birth defects 11 c.a.s numbers 5 cas numbers structures 11 des birth defects 5 niehs.gov 10 scientific database 5 electromagnetic fields 10 environmental emergencies 5 mcs 10 epa cas numbers 5 nih library 10 nethrapalli 5 patty's toxicology 9 environmental health 5 asthma 9 nih library journals 5 brain diseases and disorders 8 diethylstilbestrol des 5 environmental birth defects 8 poster 5 cas numbers structure 8 chemical abstracts registry number 5 impact factor 8 occupational exposure 5 cas 8 [not listed: 4,688 search terms] 5,209
33
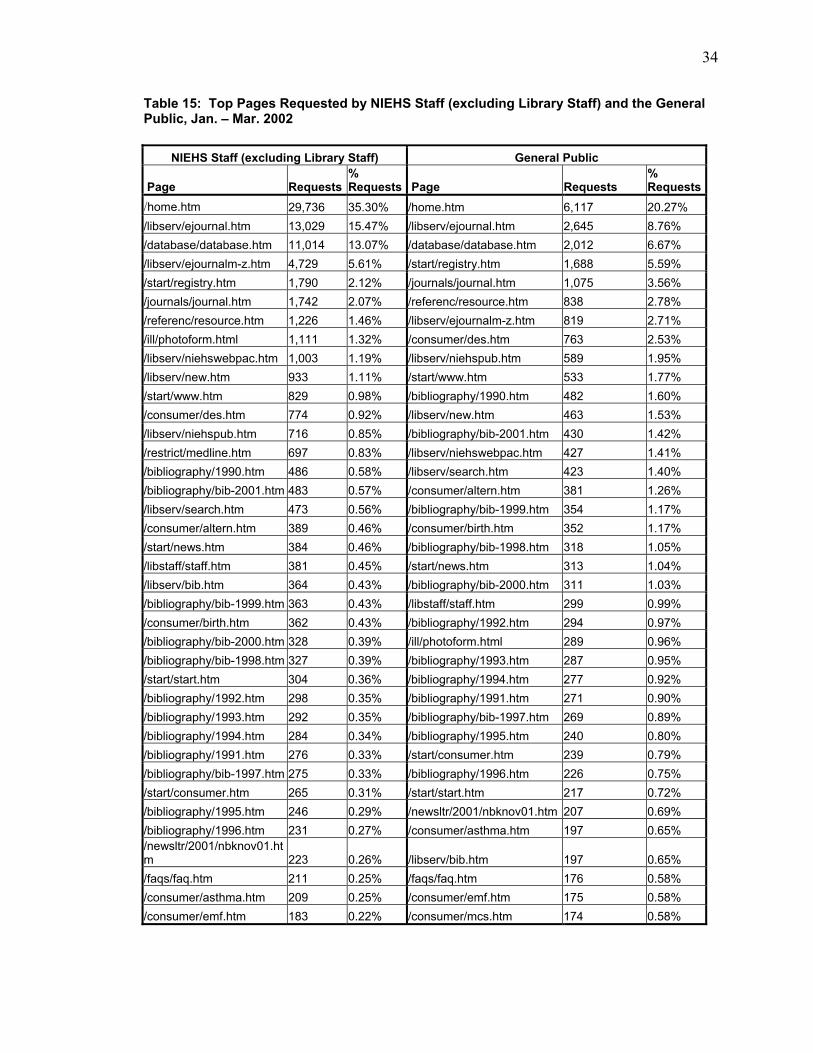
Top Requests for Pages on Library Website
Just as search queries provide information about the needs of library website
users, actual page requests can also uncover user needs. Table 15 shows the top page
requests by NIEHS staff (excluding library staff) and the general public. Here, the
general public is considered to be people who access the library website from outside of
the NIEHS campus. Both groups have the same three files as the top three most-
requested pages: Library Homepage, Electronic Journals, and Databases. It should be
noted that while the public can access the pages that list NIEHS e-journals and databases,
the public cannot use many of these products because vendor licensing agreements
restrict use to NIH staff. Therefore, a member of the public may try to click on a
database or e-journal link but will find that the resource is unavailable. The question
arises as to whether certain online products should be placed in a restricted part of the
library site so that the public will not confront potential frustration when attempting to
access such resources. However, it may be better to leave such resources listed so that
those outside of NIEHS will know what the library has available on its premises.
The “Consumer Resources” section of the website was designed with the general
public in mind, and it appears that the public requests more consumer pages than the
NIEHS staff. However, both groups place a significant amount of requests for the
following pages: CAS Registry Numbers, NIEHS Book Catalog, List of Journals in the
Library, Reference Resources, and Annual Bibliographies of Publications by NIEHS
Authors (from 1990-2001). NIEHS staff also access the online photocopy request form,
which is used to request journal articles and books. Table 15 includes additional page
requests for both groups.
34
Table 15: Top Pages Requested by NIEHS Staff (excluding Library Staff) and the General Public, Jan. – Mar. 2002
NIEHS Staff (excluding Library Staff) General Public
Page Requests% Requests Page Requests
% Requests
/home.htm 29,736 35.30% /home.htm 6,117 20.27% /libserv/ejournal.htm 13,029 15.47% /libserv/ejournal.htm 2,645 8.76% /database/database.htm 11,014 13.07% /database/database.htm 2,012 6.67% /libserv/ejournalm-z.htm 4,729 5.61% /start/registry.htm 1,688 5.59% /start/registry.htm 1,790 2.12% /journals/journal.htm 1,075 3.56% /journals/journal.htm 1,742 2.07% /referenc/resource.htm 838 2.78% /referenc/resource.htm 1,226 1.46% /libserv/ejournalm-z.htm 819 2.71% /ill/photoform.html 1,111 1.32% /consumer/des.htm 763 2.53% /libserv/niehswebpac.htm 1,003 1.19% /libserv/niehspub.htm 589 1.95% /libserv/new.htm 933 1.11% /start/www.htm 533 1.77% /start/www.htm 829 0.98% /bibliography/1990.htm 482 1.60% /consumer/des.htm 774 0.92% /libserv/new.htm 463 1.53% /libserv/niehspub.htm 716 0.85% /bibliography/bib-2001.htm 430 1.42% /restrict/medline.htm 697 0.83% /libserv/niehswebpac.htm 427 1.41% /bibliography/1990.htm 486 0.58% /libserv/search.htm 423 1.40% /bibliography/bib-2001.htm 483 0.57% /consumer/altern.htm 381 1.26% /libserv/search.htm 473 0.56% /bibliography/bib-1999.htm 354 1.17% /consumer/altern.htm 389 0.46% /consumer/birth.htm 352 1.17% /start/news.htm 384 0.46% /bibliography/bib-1998.htm 318 1.05% /libstaff/staff.htm 381 0.45% /start/news.htm 313 1.04% /libserv/bib.htm 364 0.43% /bibliography/bib-2000.htm 311 1.03% /bibliography/bib-1999.htm 363 0.43% /libstaff/staff.htm 299 0.99% /consumer/birth.htm 362 0.43% /bibliography/1992.htm 294 0.97% /bibliography/bib-2000.htm 328 0.39% /ill/photoform.html 289 0.96% /bibliography/bib-1998.htm 327 0.39% /bibliography/1993.htm 287 0.95% /start/start.htm 304 0.36% /bibliography/1994.htm 277 0.92% /bibliography/1992.htm 298 0.35% /bibliography/1991.htm 271 0.90% /bibliography/1993.htm 292 0.35% /bibliography/bib-1997.htm 269 0.89% /bibliography/1994.htm 284 0.34% /bibliography/1995.htm 240 0.80% /bibliography/1991.htm 276 0.33% /start/consumer.htm 239 0.79% /bibliography/bib-1997.htm 275 0.33% /bibliography/1996.htm 226 0.75% /start/consumer.htm 265 0.31% /start/start.htm 217 0.72% /bibliography/1995.htm 246 0.29% /newsltr/2001/nbknov01.htm 207 0.69% /bibliography/1996.htm 231 0.27% /consumer/asthma.htm 197 0.65% /newsltr/2001/nbknov01.htm 223 0.26% /libserv/bib.htm 197 0.65% /faqs/faq.htm 211 0.25% /faqs/faq.htm 176 0.58% /consumer/asthma.htm 209 0.25% /consumer/emf.htm 175 0.58% /consumer/emf.htm 183 0.22% /consumer/mcs.htm 174 0.58%
35
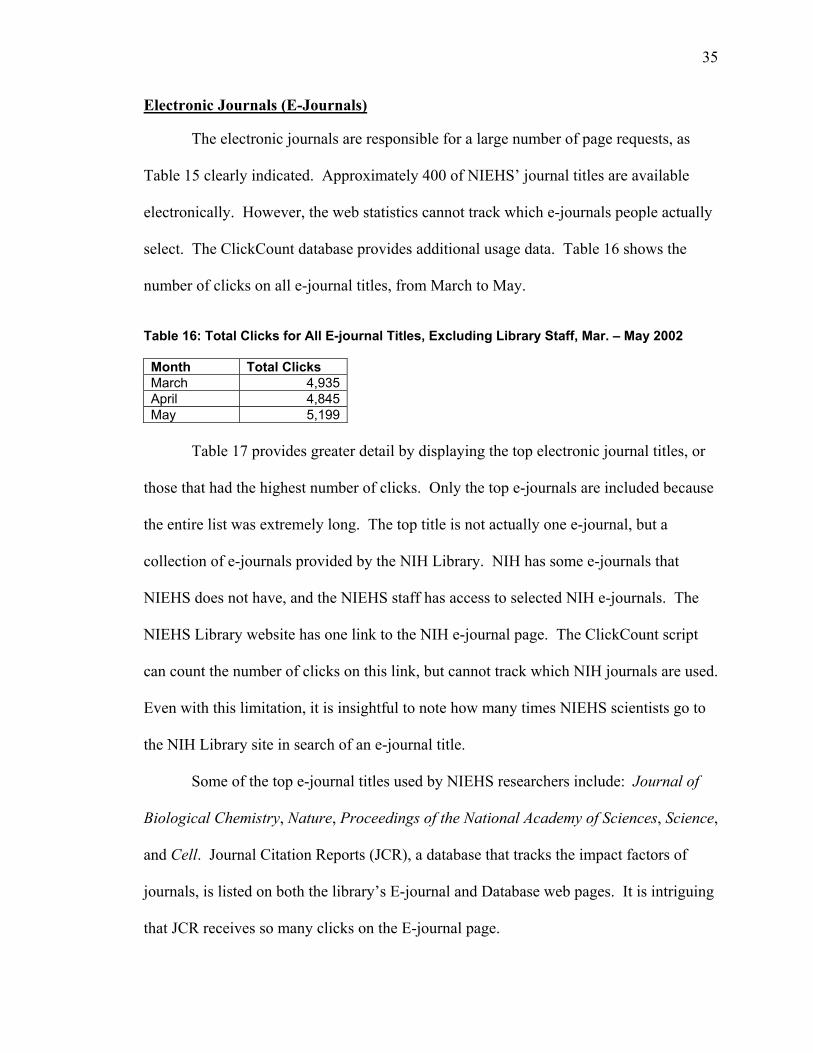
Electronic Journals (E-Journals) The electronic journals are responsible for a large number of page requests, as
Table 15 clearly indicated. Approximately 400 of NIEHS’ journal titles are available
electronically. However, the web statistics cannot track which e-journals people actually
select. The ClickCount database provides additional usage data. Table 16 shows the
number of clicks on all e-journal titles, from March to May.
Table 16: Total Clicks for All E-journal Titles, Excluding Library Staff, Mar. – May 2002 Month Total Clicks March 4,935April 4,845May 5,199
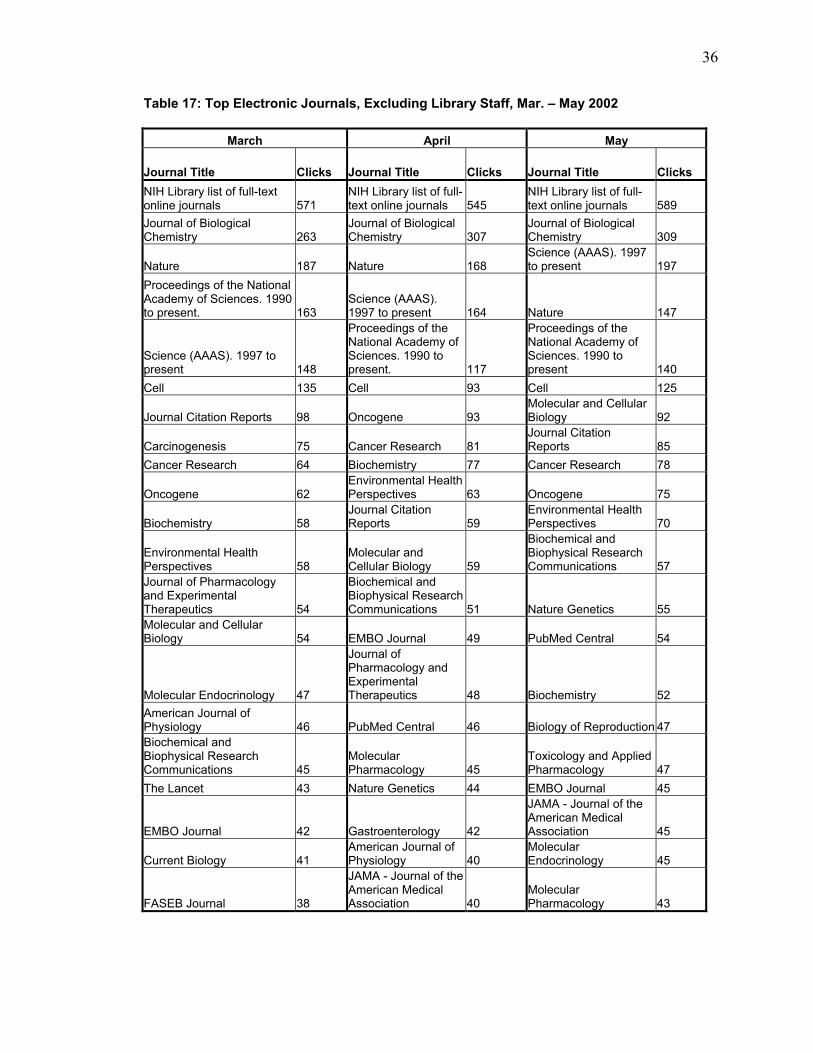
Table 17 provides greater detail by displaying the top electronic journal titles, or
those that had the highest number of clicks. Only the top e-journals are included because
the entire list was extremely long. The top title is not actually one e-journal, but a
collection of e-journals provided by the NIH Library. NIH has some e-journals that
NIEHS does not have, and the NIEHS staff has access to selected NIH e-journals. The
NIEHS Library website has one link to the NIH e-journal page. The ClickCount script
can count the number of clicks on this link, but cannot track which NIH journals are used.
Even with this limitation, it is insightful to note how many times NIEHS scientists go to
the NIH Library site in search of an e-journal title.
Some of the top e-journal titles used by NIEHS researchers include: Journal of
Biological Chemistry, Nature, Proceedings of the National Academy of Sciences, Science,
and Cell. Journal Citation Reports (JCR), a database that tracks the impact factors of
journals, is listed on both the library’s E-journal and Database web pages. It is intriguing
that JCR receives so many clicks on the E-journal page.
36
Table 17: Top Electronic Journals, Excluding Library Staff, Mar. – May 2002
March April May
Journal Title Clicks Journal Title Clicks Journal Title Clicks NIH Library list of full-text online journals 571
NIH Library list of full-text online journals 545
NIH Library list of full-text online journals 589
Journal of Biological Chemistry 263
Journal of Biological Chemistry 307
Journal of Biological Chemistry 309
Nature 187 Nature 168 Science (AAAS). 1997 to present 197
Proceedings of the National Academy of Sciences. 1990 to present. 163
Science (AAAS). 1997 to present 164 Nature 147
Science (AAAS). 1997 to present 148
Proceedings of the National Academy of Sciences. 1990 to present. 117
Proceedings of the National Academy of Sciences. 1990 to present 140
Cell 135 Cell 93 Cell 125
Journal Citation Reports 98 Oncogene 93 Molecular and Cellular Biology 92
Carcinogenesis 75 Cancer Research 81 Journal Citation Reports 85
Cancer Research 64 Biochemistry 77 Cancer Research 78
Oncogene 62 Environmental Health Perspectives 63 Oncogene 75
Biochemistry 58 Journal Citation Reports 59
Environmental Health Perspectives 70
Environmental Health Perspectives 58
Molecular and Cellular Biology 59
Biochemical and Biophysical Research Communications 57
Journal of Pharmacology and Experimental Therapeutics 54
Biochemical and Biophysical Research Communications 51 Nature Genetics 55
Molecular and Cellular Biology 54 EMBO Journal 49 PubMed Central 54
Molecular Endocrinology 47
Journal of Pharmacology and Experimental Therapeutics 48 Biochemistry 52
American Journal of Physiology 46 PubMed Central 46 Biology of Reproduction 47 Biochemical and Biophysical Research Communications 45
Molecular Pharmacology 45
Toxicology and Applied Pharmacology 47
The Lancet 43 Nature Genetics 44 EMBO Journal 45
EMBO Journal 42 Gastroenterology 42
JAMA - Journal of the American Medical Association 45
Current Biology 41 American Journal of Physiology 40
Molecular Endocrinology 45
FASEB Journal 38
JAMA - Journal of the American Medical Association 40
Molecular Pharmacology 43

37
NIEHS librarians can use the list of top e-journals to help make collection
development decisions in the future. However, it is also useful to know which electronic
journals are not receiving as much attention by NIEHS researchers. Generally, such titles
only receive one or two clicks per month. If certain titles have consistently low usage,
they may be candidates for weeding if future financial circumstances call for such a
measure. Also, low usage of a journal’s electronic format may indicate a parallel low
usage of its print format. Because vendors sometimes bundle print and electronic
formats, the library has some journals in both formats. Some conclusions about print
journal usage may be extrapolated from electronic use, but comparing the ClickCount
data to a print usage study would be the safest way to make conclusions. The library has
limited space for its constantly expanding print journal collection, so any journal usage
data is helpful for maintaining a strong collection while considering space concerns.
Table 18 shows a selected list of low-use electronic journals.

38
Table 18: Low-Use Electronic Journals, Excluding Library Staff, Mar. – May 2002
March April May
Journal Title Clicks Journal Title Clicks Journal Title Clicks
Protein Engineering 1
Progress in Neuro-Psychopharmacology and Biological Psychiatry 1 Peptides 1
Public Health Reports 1 Public Health Reports 1 Pharmacology and Therapeutics 1
Radiation Physics and Chemistry 1 Regulatory Peptides 1 Physiology and Behavior 1 Research in Immunology 1 Research in Virology 1 Phytochemistry 1
Respiration Physiology 1 Scandinavian Journal of Immunology 1
Plant Physiology and Biochemistry 1
Scandinavian Journal of Immunology 1
Seminars in Cancer Biology 1 Plant Science 1
Seminars in Cancer Biology 1 Teratology 1 Postgraduate Medicine 1
Seminars in Cell and Developmental Biology 1 Tissue Antigens 1
Proceedings of the Society for Experimental Biology and Medicine 1
Structure with Folding & Design 1 Toxicology in Vitro 1
Progress in Biophysics and Molecular Biology 1
Surgical Oncology 1 Toxicon 1 Progress in Lipid Research 1
Teratogenesis, Carcinogenesis and Mutagenesis 1
Traffic : the International Journal of Intracellular Transport 1 Progress in Neurobiology 1
Toxicology in Vitro 1 Transfusion Science 1 Prostaglandins and Other Lipid Mediators 1
Transplantation Proceedings 1 Trends in Biotechnology 1 Protein Engineering 1
Trends in Biotechnology 1 Trends in Immunology 1 Public Health Reports 1
Trends in Ecology and Evolution 1
Trends in Molecular Medicine 1
Teratogenesis, Carcinogenesis and Mutagenesis 1
Trends in Immunology 1 Trends in Neurosciences 1 Trends in Biotechnology 1
Trends in Molecular Medicine 1 Ultrasonics 1
Trends in Cardiovascular Medicine 1
Ultramicroscopy 1 Veterinary Journals 1 Trends in Immunology 1
Veterinary Journals 1 Women's Health Issues 1 Wiley Interscience 1
Veterinary Microbiology 1 World Wide Web Journal of Biology 1 Women's Health Issues 1

39
Electronic Databases The web statistics show that after the Electronic Journals pages, the Database
page is the next most-requested. The ClickCount script was also applied to database
products to provide more usage detail. The script was only applied to selected resources
in March and April, but was applied to all database products in late May. PubMed, Web
of Science, Biological Abstracts, OVID, Current Protocols, and TOMES are some of the
most utilized resources. Table 19 provides additional insight.
Table 19: Top Databases, Excluding Library Staff, Mar. – May 2002
March April May Database Clicks Database Clicks Database Clicks FirstSearch Search Page 35 PubMed 1,631 PubMed 2,094 Essential Science Indicators (ESI) 22 Web of Science 584 Web of Science 816 Essential Science Indicators 22 Biological Abstracts 85 Current Protocols Online 82
TOMES 20 Essential Science Indicators 77 OVID 67
Guided Tour 1 OVID 65 Biological Abstracts 65 TOMES 59 TOMES 43
Essential Science Indicators (ESI) 57 FirstSearch Search Page 35
FirstSearch Search Page 55
Essential Science Indicators (ESI) 32
Current Protocols Online 47 SilverPlatter MEDLINE 18
PubMed Central 11 Journal Citation Reports 13
Porpoise Alert Service 7 PubMed Central 9
SilverPlatter MEDLINE 6 ChemIDplus 8
MeSH Browser (for Indexers) 5 Porpoise 7
Porpoise 4 Essential Science Indicators 6
PhyNet MEDLINE Access 3
MeSH Browser (for Indexers) 3
Porpoise Alert Service 3 CRISP 2 Eukaryotic Promoter 2 SOLV-DB Solvents 2 TOXNET 2

40
As Table 19 illustrated, PubMed is a highly-used database. PubMed is the free
version of Medline produced by the National Library of Medicine. However, NIEHS
Library offers three main interfaces for accessing Medline. OVID and Silverplatter
produce proprietary versions of Medline. Each interface has its own look and feel, in
addition to syntax differences. Depending on the search need, one interface may offer
more functionality than another. NIEHS offers access to each version of Medline via its
“Medline” web page (/restrict/medline.htm). PubMed has an additional access point as a
“Quick Link” at the top of the Database page (/database/database.htm).
Since Medline is such a vital resource for the biomedical community, it is
important to understand how NIEHS researchers access it. Most researchers access
PubMed via the “Quick Links” on the Database page. Significantly less access it through
the Medline page, and even less use the other Medline interfaces. The “Quick Links”
section appears to be a popular access point, and librarians could probably influence
searchers by placing new or highly-recommended databases in the section. See Table 20.
As an aside, the library frequently offers training sessions for PubMed. It would be
interesting to offer more training sessions on the OVID and Silverplatter interfaces and
see if usage for these formats increases.
Table 20: Accesses for Medline via three different interfaces, Excluding Library Staff, May 2002 Interface Clicks Referrer PubMed 1,928 http://library.niehs.nih.gov/database/database.htm PubMed 166 http://library.niehs.nih.gov/restrict/medline.htm OVID 67 http://library.niehs.nih.gov/restrict/medline.htm SilverPlatter MEDLINE 18 http://library.niehs.nih.gov/restrict/medline.htm
41
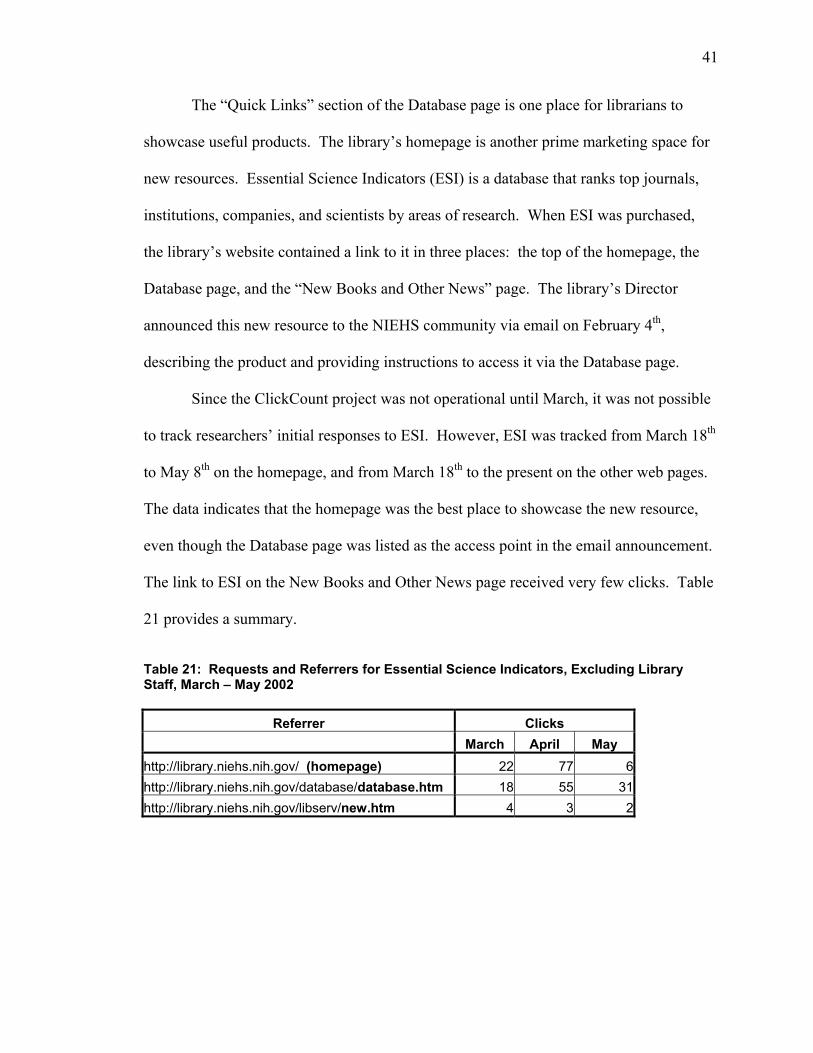
The “Quick Links” section of the Database page is one place for librarians to
showcase useful products. The library’s homepage is another prime marketing space for
new resources. Essential Science Indicators (ESI) is a database that ranks top journals,
institutions, companies, and scientists by areas of research. When ESI was purchased,
the library’s website contained a link to it in three places: the top of the homepage, the
Database page, and the “New Books and Other News” page. The library’s Director
announced this new resource to the NIEHS community via email on February 4th,
describing the product and providing instructions to access it via the Database page.
Since the ClickCount project was not operational until March, it was not possible
to track researchers’ initial responses to ESI. However, ESI was tracked from March 18th
to May 8th on the homepage, and from March 18th to the present on the other web pages.
The data indicates that the homepage was the best place to showcase the new resource,
even though the Database page was listed as the access point in the email announcement.
The link to ESI on the New Books and Other News page received very few clicks. Table
21 provides a summary.
Table 21: Requests and Referrers for Essential Science Indicators, Excluding Library Staff, March – May 2002
Referrer Clicks March April May http://library.niehs.nih.gov/ (homepage) 22 77 6http://library.niehs.nih.gov/database/database.htm 18 55 31http://library.niehs.nih.gov/libserv/new.htm 4 3 2
42
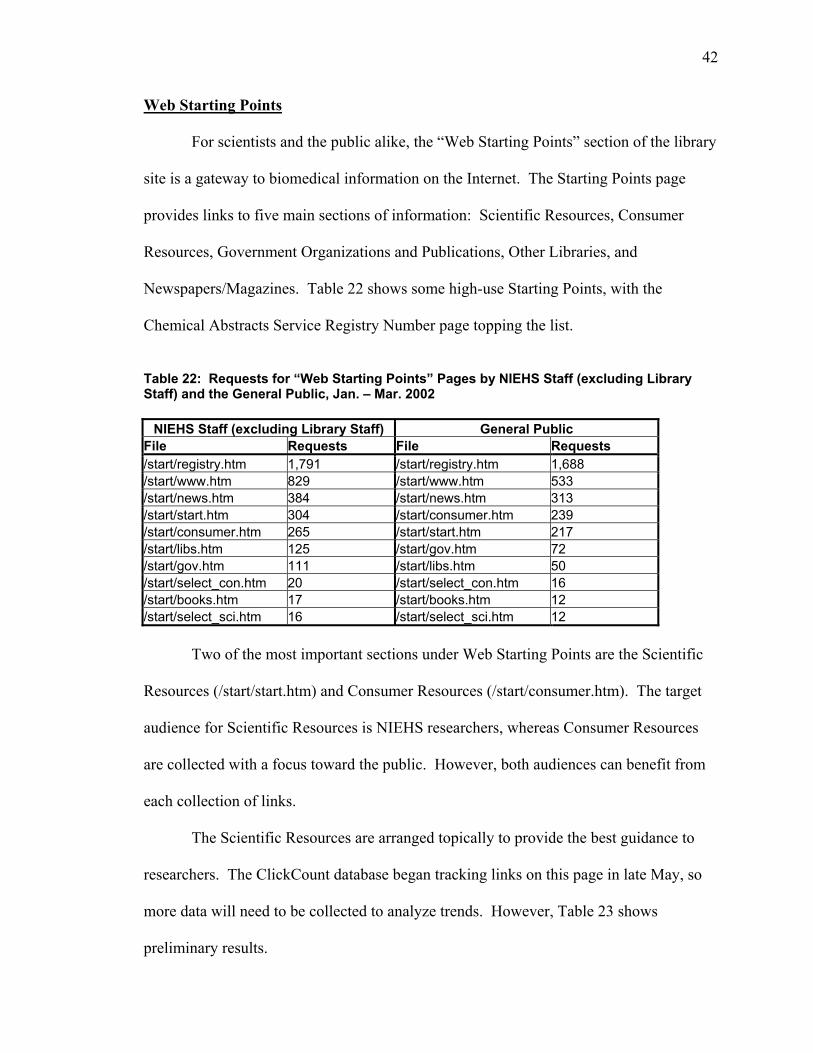
Web Starting Points For scientists and the public alike, the “Web Starting Points” section of the library
site is a gateway to biomedical information on the Internet. The Starting Points page
provides links to five main sections of information: Scientific Resources, Consumer
Resources, Government Organizations and Publications, Other Libraries, and
Newspapers/Magazines. Table 22 shows some high-use Starting Points, with the
Chemical Abstracts Service Registry Number page topping the list.
Table 22: Requests for “Web Starting Points” Pages by NIEHS Staff (excluding Library Staff) and the General Public, Jan. – Mar. 2002
NIEHS Staff (excluding Library Staff) General Public File Requests File Requests /start/registry.htm 1,791 /start/registry.htm 1,688 /start/www.htm 829 /start/www.htm 533 /start/news.htm 384 /start/news.htm 313 /start/start.htm 304 /start/consumer.htm 239 /start/consumer.htm 265 /start/start.htm 217 /start/libs.htm 125 /start/gov.htm 72 /start/gov.htm 111 /start/libs.htm 50 /start/select_con.htm 20 /start/select_con.htm 16 /start/books.htm 17 /start/books.htm 12 /start/select_sci.htm 16 /start/select_sci.htm 12 Two of the most important sections under Web Starting Points are the Scientific
Resources (/start/start.htm) and Consumer Resources (/start/consumer.htm). The target
audience for Scientific Resources is NIEHS researchers, whereas Consumer Resources
are collected with a focus toward the public. However, both audiences can benefit from
each collection of links.
The Scientific Resources are arranged topically to provide the best guidance to
researchers. The ClickCount database began tracking links on this page in late May, so
more data will need to be collected to analyze trends. However, Table 23 shows
preliminary results.

43
Table 23: Clicks on Scientific Resources, Excluding Library Staff, May 29 – June 13, 2002
Resource Name Clicks Alternatives to Animal Testing (Altweb) 4ChemCenter, 3National Environmental Trust 2Mouse Atlas Project 2All the Virology on the WWW 2Epidemiology Virtual Library Page 1Animal Welfare Information Center 1Biomedical Information Resources 1ChemConnect 1Chemical Economics Handbook Reports 1Cold Spring Harbor Laboratory Online 1EcoJustice Network 1EcoNet 1EMF Rapid 1Endocrine Disruptors Research Initiative 1Environmental Research Foundation 1Yahoo= 1Martindale's 1Millipore's HYPERfilter 1National Biological Information Infrastructure 1National Center for Biotechnology Information 1NTP Interagency Center for the Evaluation of Alternative Toxicological Methods 1Physiology Online 1ScienceWise.com 1The WWW Virtual Library 1United Nations Environment Programme 1Worldwatch Institute 1EnviroLink Network 1
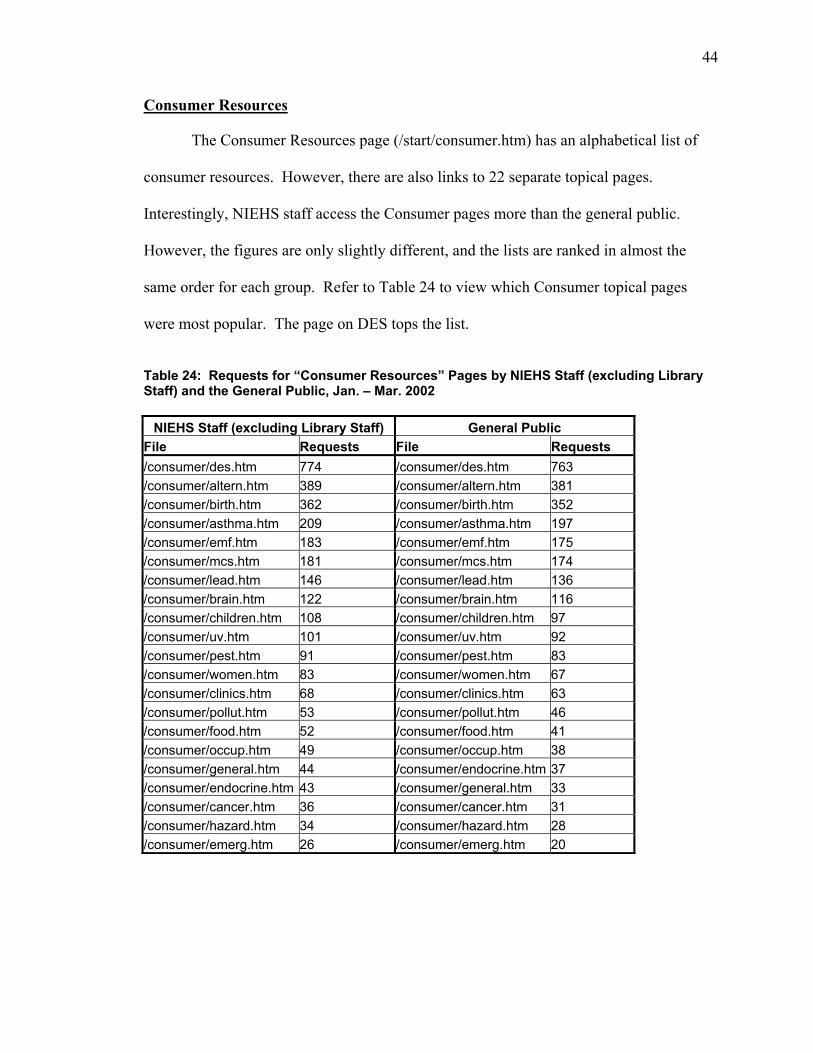
44
Consumer Resources The Consumer Resources page (/start/consumer.htm) has an alphabetical list of
consumer resources. However, there are also links to 22 separate topical pages.
Interestingly, NIEHS staff access the Consumer pages more than the general public.
However, the figures are only slightly different, and the lists are ranked in almost the
same order for each group. Refer to Table 24 to view which Consumer topical pages
were most popular. The page on DES tops the list.
Table 24: Requests for “Consumer Resources” Pages by NIEHS Staff (excluding Library Staff) and the General Public, Jan. – Mar. 2002
NIEHS Staff (excluding Library Staff) General Public File Requests File Requests /consumer/des.htm 774 /consumer/des.htm 763 /consumer/altern.htm 389 /consumer/altern.htm 381 /consumer/birth.htm 362 /consumer/birth.htm 352 /consumer/asthma.htm 209 /consumer/asthma.htm 197 /consumer/emf.htm 183 /consumer/emf.htm 175 /consumer/mcs.htm 181 /consumer/mcs.htm 174 /consumer/lead.htm 146 /consumer/lead.htm 136 /consumer/brain.htm 122 /consumer/brain.htm 116 /consumer/children.htm 108 /consumer/children.htm 97 /consumer/uv.htm 101 /consumer/uv.htm 92 /consumer/pest.htm 91 /consumer/pest.htm 83 /consumer/women.htm 83 /consumer/women.htm 67 /consumer/clinics.htm 68 /consumer/clinics.htm 63 /consumer/pollut.htm 53 /consumer/pollut.htm 46 /consumer/food.htm 52 /consumer/food.htm 41 /consumer/occup.htm 49 /consumer/occup.htm 38 /consumer/general.htm 44 /consumer/endocrine.htm 37 /consumer/endocrine.htm 43 /consumer/general.htm 33 /consumer/cancer.htm 36 /consumer/cancer.htm 31 /consumer/hazard.htm 34 /consumer/hazard.htm 28 /consumer/emerg.htm 26 /consumer/emerg.htm 20
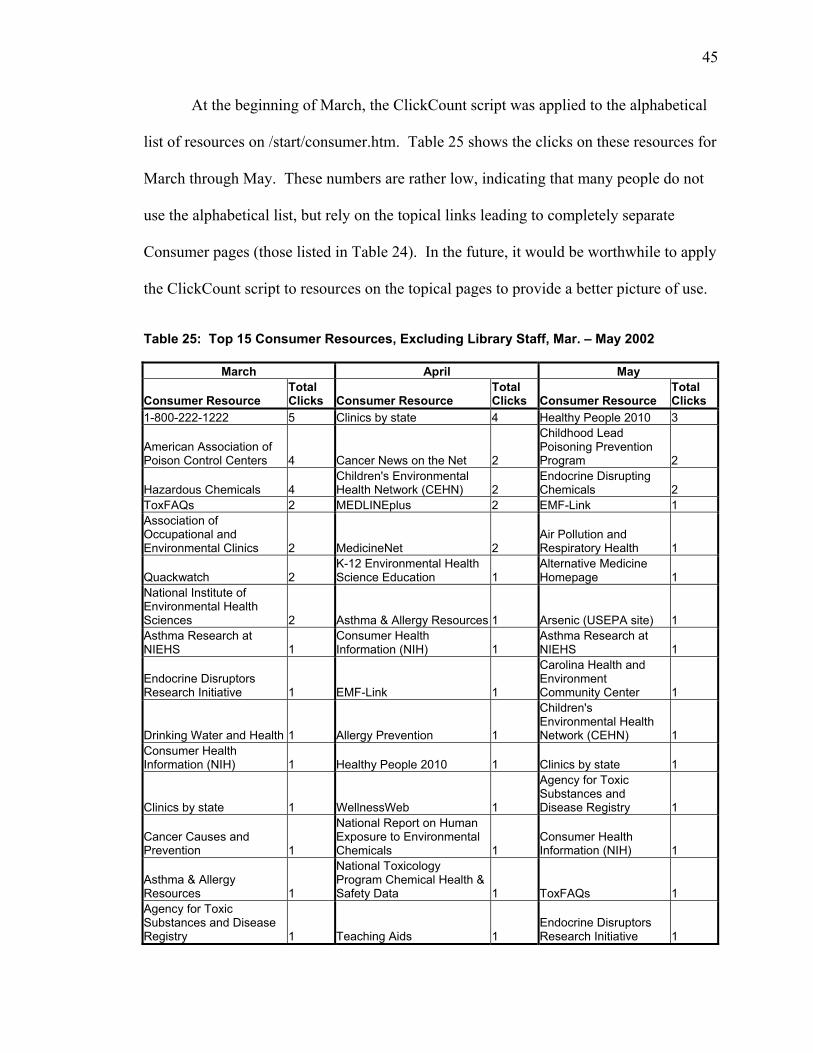
45
At the beginning of March, the ClickCount script was applied to the alphabetical
list of resources on /start/consumer.htm. Table 25 shows the clicks on these resources for
March through May. These numbers are rather low, indicating that many people do not
use the alphabetical list, but rely on the topical links leading to completely separate
Consumer pages (those listed in Table 24). In the future, it would be worthwhile to apply
the ClickCount script to resources on the topical pages to provide a better picture of use.
Table 25: Top 15 Consumer Resources, Excluding Library Staff, Mar. – May 2002
March April May
Consumer Resource Total Clicks Consumer Resource
Total Clicks Consumer Resource
Total Clicks
1-800-222-1222 5 Clinics by state 4 Healthy People 2010 3
American Association of Poison Control Centers 4 Cancer News on the Net 2
Childhood Lead Poisoning Prevention Program 2
Hazardous Chemicals 4 Children's Environmental Health Network (CEHN) 2
Endocrine Disrupting Chemicals 2
ToxFAQs 2 MEDLINEplus 2 EMF-Link 1 Association of Occupational and Environmental Clinics 2 MedicineNet 2
Air Pollution and Respiratory Health 1
Quackwatch 2 K-12 Environmental Health Science Education 1
Alternative Medicine Homepage 1
National Institute of Environmental Health Sciences 2 Asthma & Allergy Resources 1 Arsenic (USEPA site) 1 Asthma Research at NIEHS 1
Consumer Health Information (NIH) 1
Asthma Research at NIEHS 1
Endocrine Disruptors Research Initiative 1 EMF-Link 1
Carolina Health and Environment Community Center 1
Drinking Water and Health 1 Allergy Prevention 1
Children's Environmental Health Network (CEHN) 1
Consumer Health Information (NIH) 1 Healthy People 2010 1 Clinics by state 1
Clinics by state 1 WellnessWeb 1
Agency for Toxic Substances and Disease Registry 1
Cancer Causes and Prevention 1
National Report on Human Exposure to Environmental Chemicals 1
Consumer Health Information (NIH) 1
Asthma & Allergy Resources 1
National Toxicology Program Chemical Health & Safety Data 1 ToxFAQs 1
Agency for Toxic Substances and Disease Registry 1 Teaching Aids 1
Endocrine Disruptors Research Initiative 1
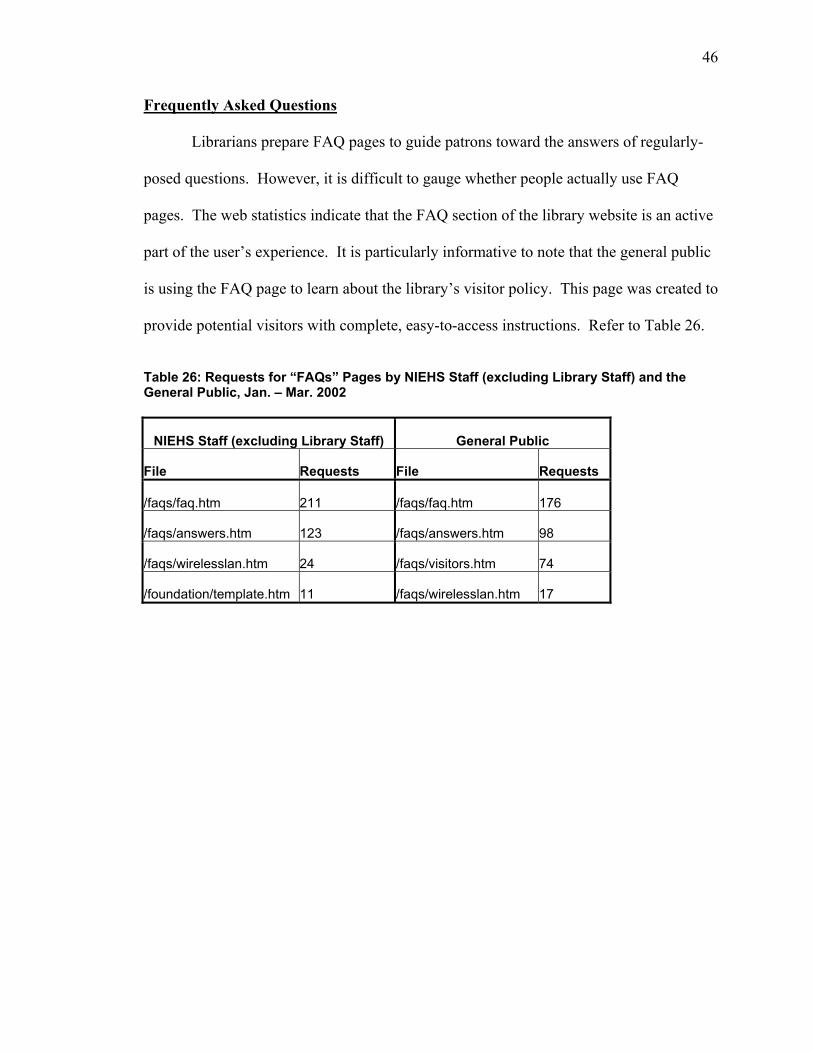
46
Frequently Asked Questions
Librarians prepare FAQ pages to guide patrons toward the answers of regularly-
posed questions. However, it is difficult to gauge whether people actually use FAQ
pages. The web statistics indicate that the FAQ section of the library website is an active
part of the user’s experience. It is particularly informative to note that the general public
is using the FAQ page to learn about the library’s visitor policy. This page was created to
provide potential visitors with complete, easy-to-access instructions. Refer to Table 26.
Table 26: Requests for “FAQs” Pages by NIEHS Staff (excluding Library Staff) and the General Public, Jan. – Mar. 2002
NIEHS Staff (excluding Library Staff) General Public
File Requests File Requests
/faqs/faq.htm 211 /faqs/faq.htm 176
/faqs/answers.htm 123 /faqs/answers.htm 98
/faqs/wirelesslan.htm 24 /faqs/visitors.htm 74
/foundation/template.htm 11 /faqs/wirelesslan.htm 17
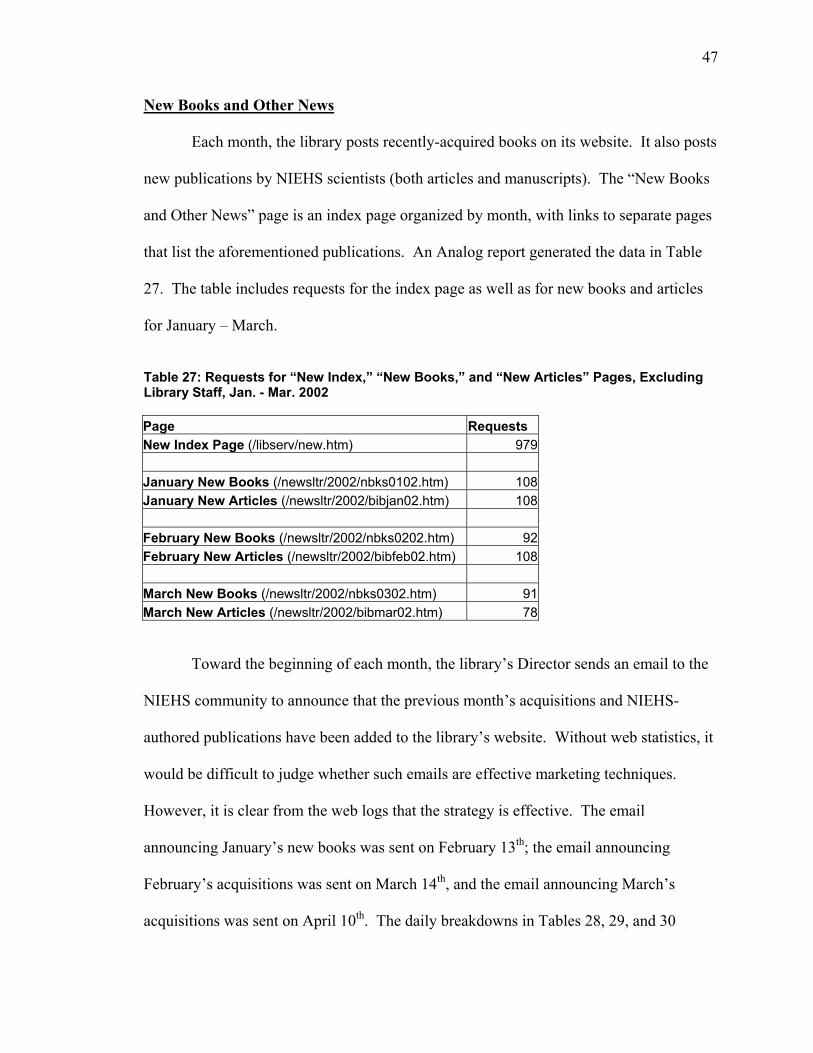
47
New Books and Other News Each month, the library posts recently-acquired books on its website. It also posts
new publications by NIEHS scientists (both articles and manuscripts). The “New Books
and Other News” page is an index page organized by month, with links to separate pages
that list the aforementioned publications. An Analog report generated the data in Table
27. The table includes requests for the index page as well as for new books and articles
for January – March.
Table 27: Requests for “New Index,” “New Books,” and “New Articles” Pages, Excluding Library Staff, Jan. - Mar. 2002 Page Requests New Index Page (/libserv/new.htm) 979 January New Books (/newsltr/2002/nbks0102.htm) 108January New Articles (/newsltr/2002/bibjan02.htm) 108 February New Books (/newsltr/2002/nbks0202.htm) 92February New Articles (/newsltr/2002/bibfeb02.htm) 108 March New Books (/newsltr/2002/nbks0302.htm) 91March New Articles (/newsltr/2002/bibmar02.htm) 78 Toward the beginning of each month, the library’s Director sends an email to the
NIEHS community to announce that the previous month’s acquisitions and NIEHS-
authored publications have been added to the library’s website. Without web statistics, it
would be difficult to judge whether such emails are effective marketing techniques.
However, it is clear from the web logs that the strategy is effective. The email
announcing January’s new books was sent on February 13th; the email announcing
February’s acquisitions was sent on March 14th, and the email announcing March’s
acquisitions was sent on April 10th. The daily breakdowns in Tables 28, 29, and 30
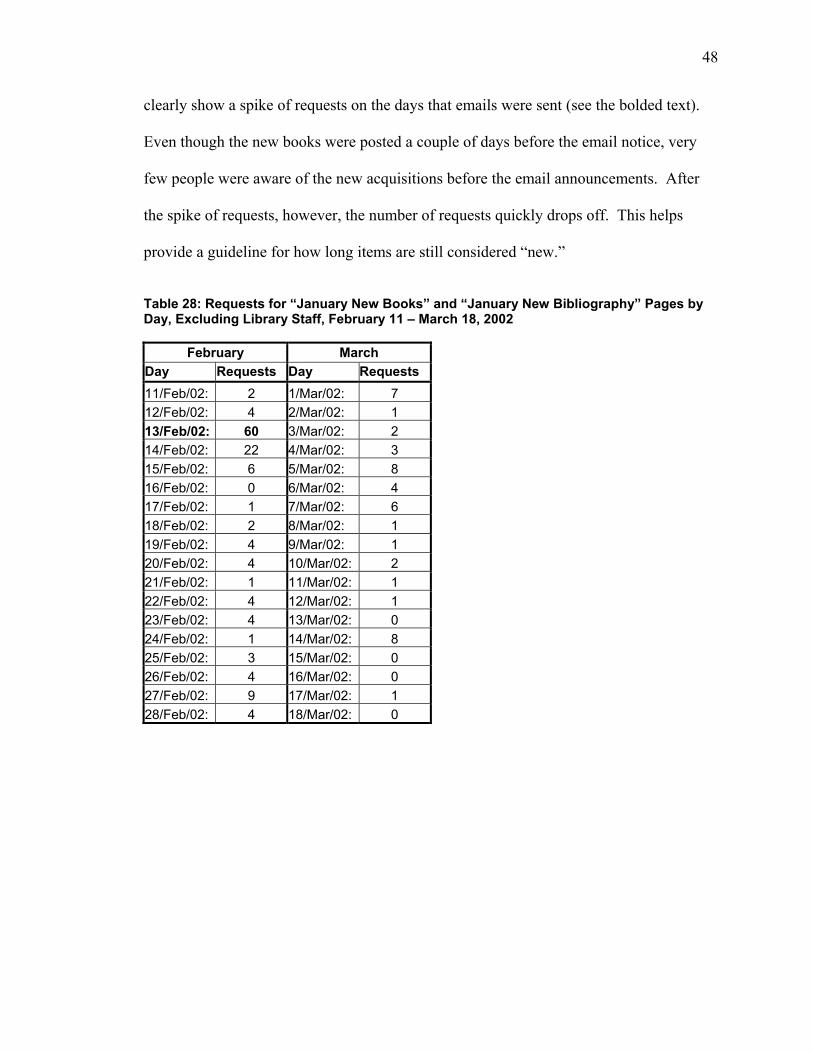
48
clearly show a spike of requests on the days that emails were sent (see the bolded text).
Even though the new books were posted a couple of days before the email notice, very
few people were aware of the new acquisitions before the email announcements. After
the spike of requests, however, the number of requests quickly drops off. This helps
provide a guideline for how long items are still considered “new.”
Table 28: Requests for “January New Books” and “January New Bibliography” Pages by Day, Excluding Library Staff, February 11 – March 18, 2002
February March Day Requests Day Requests 11/Feb/02: 2 1/Mar/02: 7 12/Feb/02: 4 2/Mar/02: 1 13/Feb/02: 60 3/Mar/02: 2 14/Feb/02: 22 4/Mar/02: 3 15/Feb/02: 6 5/Mar/02: 8 16/Feb/02: 0 6/Mar/02: 4 17/Feb/02: 1 7/Mar/02: 6 18/Feb/02: 2 8/Mar/02: 1 19/Feb/02: 4 9/Mar/02: 1 20/Feb/02: 4 10/Mar/02: 2 21/Feb/02: 1 11/Mar/02: 1 22/Feb/02: 4 12/Mar/02: 1 23/Feb/02: 4 13/Mar/02: 0 24/Feb/02: 1 14/Mar/02: 8 25/Feb/02: 3 15/Mar/02: 0 26/Feb/02: 4 16/Mar/02: 0 27/Feb/02: 9 17/Mar/02: 1 28/Feb/02: 4 18/Mar/02: 0
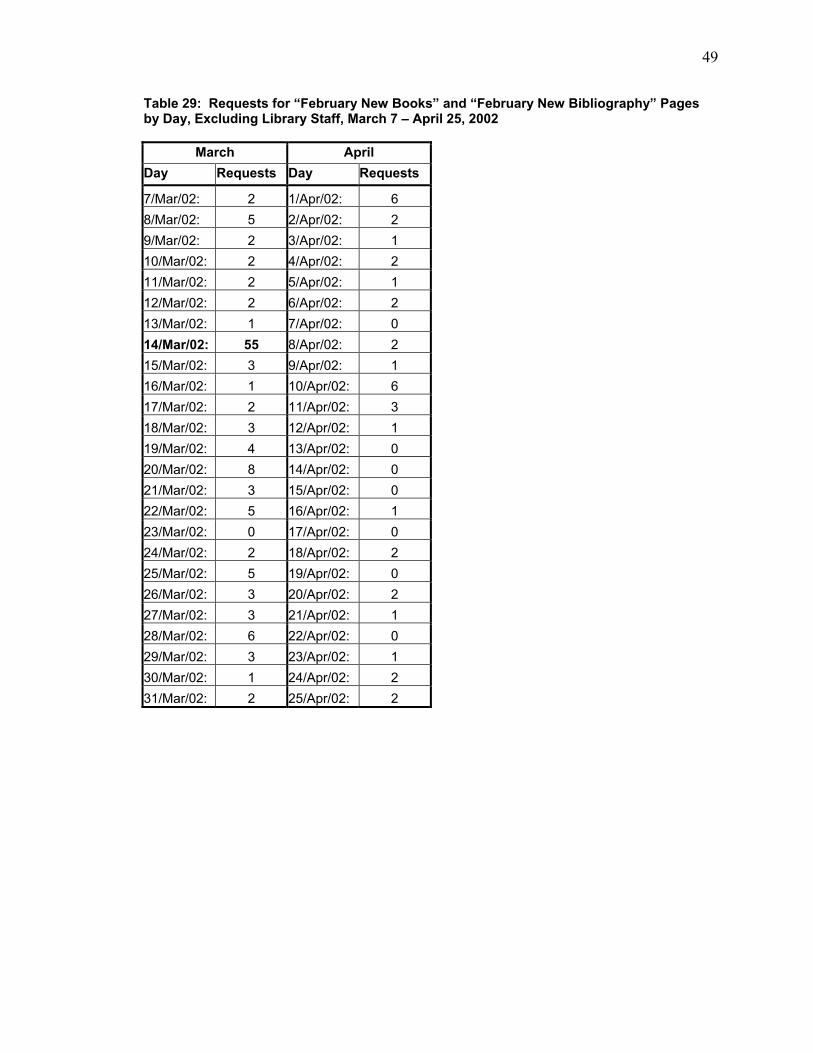
49
Table 29: Requests for “February New Books” and “February New Bibliography” Pages by Day, Excluding Library Staff, March 7 – April 25, 2002
March April Day Requests Day Requests
7/Mar/02: 2 1/Apr/02: 6 8/Mar/02: 5 2/Apr/02: 2 9/Mar/02: 2 3/Apr/02: 1 10/Mar/02: 2 4/Apr/02: 2 11/Mar/02: 2 5/Apr/02: 1 12/Mar/02: 2 6/Apr/02: 2 13/Mar/02: 1 7/Apr/02: 0 14/Mar/02: 55 8/Apr/02: 2 15/Mar/02: 3 9/Apr/02: 1 16/Mar/02: 1 10/Apr/02: 6 17/Mar/02: 2 11/Apr/02: 3 18/Mar/02: 3 12/Apr/02: 1 19/Mar/02: 4 13/Apr/02: 0 20/Mar/02: 8 14/Apr/02: 0 21/Mar/02: 3 15/Apr/02: 0 22/Mar/02: 5 16/Apr/02: 1 23/Mar/02: 0 17/Apr/02: 0 24/Mar/02: 2 18/Apr/02: 2 25/Mar/02: 5 19/Apr/02: 0 26/Mar/02: 3 20/Apr/02: 2 27/Mar/02: 3 21/Apr/02: 1 28/Mar/02: 6 22/Apr/02: 0 29/Mar/02: 3 23/Apr/02: 1 30/Mar/02: 1 24/Apr/02: 2 31/Mar/02: 2 25/Apr/02: 2
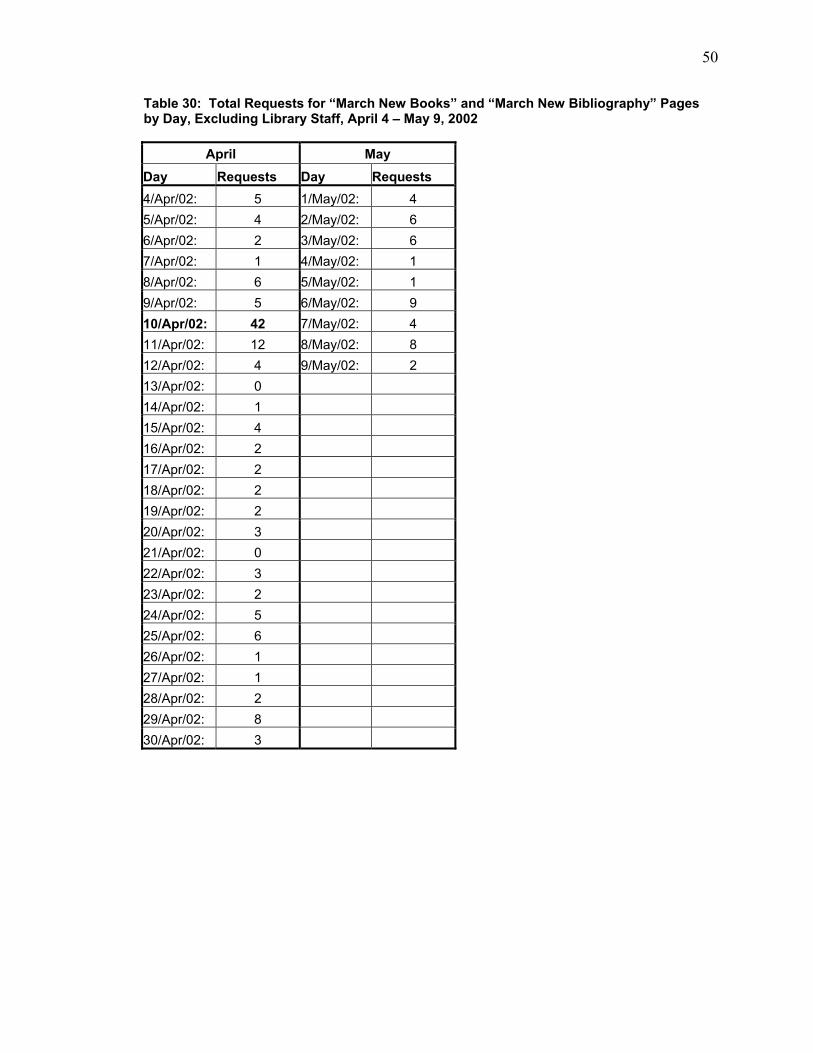
50
Table 30: Total Requests for “March New Books” and “March New Bibliography” Pages by Day, Excluding Library Staff, April 4 – May 9, 2002
April May Day Requests Day Requests 4/Apr/02: 5 1/May/02: 4 5/Apr/02: 4 2/May/02: 6 6/Apr/02: 2 3/May/02: 6 7/Apr/02: 1 4/May/02: 1 8/Apr/02: 6 5/May/02: 1 9/Apr/02: 5 6/May/02: 9 10/Apr/02: 42 7/May/02: 4 11/Apr/02: 12 8/May/02: 8 12/Apr/02: 4 9/May/02: 2 13/Apr/02: 0 14/Apr/02: 1 15/Apr/02: 4 16/Apr/02: 2 17/Apr/02: 2 18/Apr/02: 2 19/Apr/02: 2 20/Apr/02: 3 21/Apr/02: 0 22/Apr/02: 3 23/Apr/02: 2 24/Apr/02: 5 25/Apr/02: 6 26/Apr/02: 1 27/Apr/02: 1 28/Apr/02: 2 29/Apr/02: 8 30/Apr/02: 3
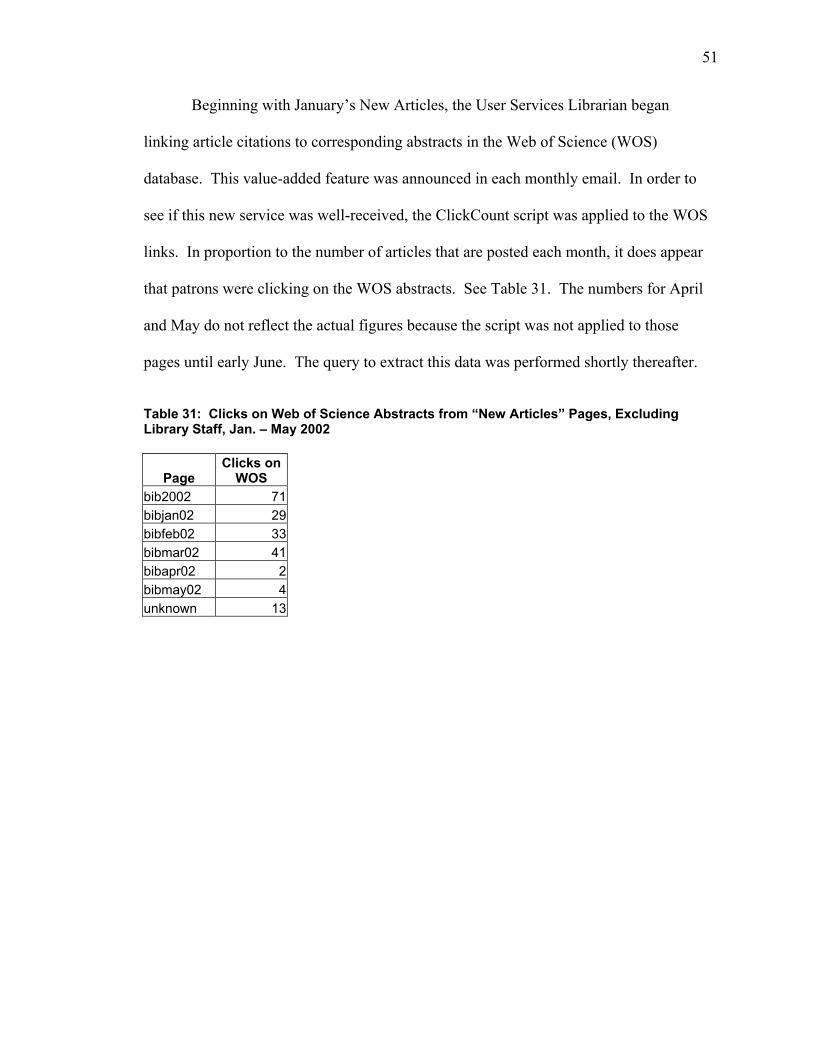
51
Beginning with January’s New Articles, the User Services Librarian began
linking article citations to corresponding abstracts in the Web of Science (WOS)
database. This value-added feature was announced in each monthly email. In order to
see if this new service was well-received, the ClickCount script was applied to the WOS
links. In proportion to the number of articles that are posted each month, it does appear
that patrons were clicking on the WOS abstracts. See Table 31. The numbers for April
and May do not reflect the actual figures because the script was not applied to those
pages until early June. The query to extract this data was performed shortly thereafter.
Table 31: Clicks on Web of Science Abstracts from “New Articles” Pages, Excluding Library Staff, Jan. – May 2002
Page Clicks on
WOS bib2002 71 bibjan02 29 bibfeb02 33 bibmar02 41 bibapr02 2 bibmay02 4 unknown 13
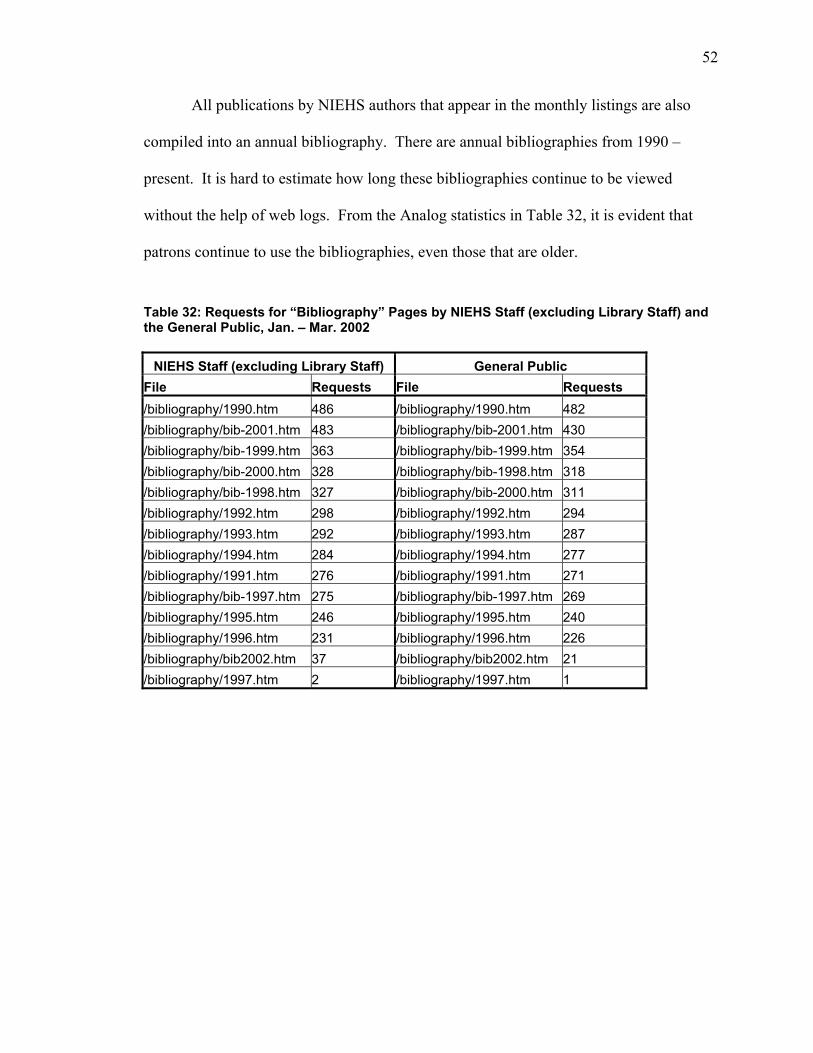
52
All publications by NIEHS authors that appear in the monthly listings are also
compiled into an annual bibliography. There are annual bibliographies from 1990 –
present. It is hard to estimate how long these bibliographies continue to be viewed
without the help of web logs. From the Analog statistics in Table 32, it is evident that
patrons continue to use the bibliographies, even those that are older.
Table 32: Requests for “Bibliography” Pages by NIEHS Staff (excluding Library Staff) and the General Public, Jan. – Mar. 2002
NIEHS Staff (excluding Library Staff) General Public File Requests File Requests /bibliography/1990.htm 486 /bibliography/1990.htm 482 /bibliography/bib-2001.htm 483 /bibliography/bib-2001.htm 430 /bibliography/bib-1999.htm 363 /bibliography/bib-1999.htm 354 /bibliography/bib-2000.htm 328 /bibliography/bib-1998.htm 318 /bibliography/bib-1998.htm 327 /bibliography/bib-2000.htm 311 /bibliography/1992.htm 298 /bibliography/1992.htm 294 /bibliography/1993.htm 292 /bibliography/1993.htm 287 /bibliography/1994.htm 284 /bibliography/1994.htm 277 /bibliography/1991.htm 276 /bibliography/1991.htm 271 /bibliography/bib-1997.htm 275 /bibliography/bib-1997.htm 269 /bibliography/1995.htm 246 /bibliography/1995.htm 240 /bibliography/1996.htm 231 /bibliography/1996.htm 226 /bibliography/bib2002.htm 37 /bibliography/bib2002.htm 21 /bibliography/1997.htm 2 /bibliography/1997.htm 1
53
DISCUSSION This study gives focus to the large amount of data generated by the NIEHS
Library web logs and the ClickCount database. It shows that web statistics can be
customized to better capture usage patterns for different groups. It also shows that other
data-gathering methods, such as the ClickCount script, can be developed to complement
data from web logs. Although the results of this study may be difficult to generalize to
other types of libraries, the methodology of this project has characteristics that should be
useful to a wide range of information professionals.
This paper’s significance is two-fold. First, it seeks to fill a gap in the literature
by providing concrete examples of how website statistics can be utilized to address
management, marketing, and collection development issues in libraries. There needs to
be more information available about how to interpret logs for decision-making, not just
how to analyze logs with software.
Second, this paper’s results have practical implications for decision-making at
NIEHS Library. The library is considering a redesign project for its website sometime in
the future, so the input from this paper will be valuable in such efforts. If the library
completes a redesign project, it will need to have statistics about the “old” website to
serve as a point of comparison. This paper will serve not only as a point of reference, but
also as a guide for analyzing web statistics collected in the future.

54
General Usage Patterns
Web logs provide much of the nuts-and-bolts data that is necessary to understand
a user population. For example, NIEHS Library can look at the total number of
successful requests for web pages for January through March (121,050) and decide if the
number is on target. Information on peak usage times (the afternoon) can help the library
anticipate questions from patrons. Knowledge about users’ browsers and operating
systems will help library staff maintain a website that provides the most functionality to
the greatest number of patrons. Such insight is especially important in the context of the
library’s possible website redesign. The status code information shows that the library
does a good job keeping its site free of broken links, but also allows librarians to decide
whether Linkbot reports should be run more frequently to identify problems sooner.
A domain report provides a snapshot of a website’s user populations, including a
surprising amount of .com and .edu users in addition to government employees. Isolating
certain IP ranges within NIEHS produces a more accurate understanding of usage,
although this technique could be refined in the future to understand departmental usage
within the Institute. Knowing more about departmental usage would help the library
better anticipate service and product needs in the future.
Specific Usage Patterns
What are the most requested pages on the library’s website? Which web pages
refer patrons to heavily-used resources? These questions can be addressed to some extent
with web logs and ClickCount data. The electronic journals and database pages are the
most requested on the website. This comes as no surprise, but having numeric data to
55
confirm hunches in valuable. It helps justify the financial expense that these products
create. Further, knowing the specific titles of heavily-used electronic resources allows
librarians to make smart decisions regarding future collection development. For products
that have different interfaces, such as Medline, the statistics show that placement on the
site may impact usage. It is probable that PubMed receives a high level of usage because
it appears as a Quick Link on the Database page. It would be intriguing to test this theory
by placing another version of Medline in Quick Links, such as Ovid, to see if usage
increases.
Referrer URLs can provide a sense of how users navigate the library’s website.
Although a user session cannot be recreated through referrer links, referrers can be a
valuable tool for analyzing product placement. As previously discussed, Analog reports
helped determine that the Quick Links are a prime spot to place databases. The
ClickCount script helped determine that the library’s homepage is the best position to
place new products. By diligently applying such techniques to new resources, or by
modifying current product placement, web data provides a way to test navigational
structure.
The ability to track daily requests for specific types of web pages, those related
to “New Books and Other News,” allowed the library to test whether email is an effective
marketing tool. Today’s organizations are sometimes inundated with email, so it is
challenging to know whether mass emails are well-received. When used with some
reserve, as the library has done, email carries an impact that will produce a result.
Finally, web data has shown that the human capital invested in the library’s
website is beneficial. For example, the Consumer section of the website started as a trial
56
service, but is now a staple according to the number of requests it receives. The effort of
creating links to WOS abstracts from the monthly bibliographies is clearly valuable. The
library’s vigilance in maintaining a strong selection of electronic journals and databases
is rewarded with consistent use for many titles. The librarians’ initiative to maintain its
FAQ section does pay off because patrons actually consult it. Measuring the value of
human effort can be difficult, but the Analog and ClickCount data provide a context for
such measurement.
Future Directions
Libraries cannot be alone in the quest to utilize web log data with consistency.
Vendors of electronic products must also cooperate with libraries to provide the fullest
picture of usage. For example, if the ClickCount script tracks all of the clicks on a
certain e-journal, how can librarians know what volume/issue the patron retrieves? How
can the librarians understand patterns in regard to subject matter or date coverage? As
Keiser (2002) asserts, “Usage data is a tool vendors have on-hand, but share with their
subscribers only when it serves their own needs – often when negotiations for license
renewals are not going well” (p. 43).
If vendors do not share usage data for their products, they may not have much
incentive to improve a clunky interface or clarify vague error messages. However, it
makes sense for vendors to provide user-friendly products so that patrons will find them
essential (Keiser, 2002). Further, if a library is paying for a certain service with its
budget, it makes sense for librarians to know how that resource is being used. Keiser
points to OneSource, a business database, as an example of a vendor that voluntarily
57
supplies usage data to clients on a monthly basis. OneSource provides the following
information: Reports Generated by Module, Usage by Report Category, Usage
Valuation, Usage by Product, Monthly Usage by Product, Seat Utilization, Report Usage
Intensity, Average Days Used per Month, Usage by Country, Active User Report,
Inactive User Report, and User Details (p. 47, 49). The fact that OneSource informs its
clients with so much data shows that it has confidence in its product. If vendors and
libraries can work together to collect and share usage data, then products can be
improved and customized in a way that will provide better service to the library patron.
These types of partnerships must develop for usage data to deliver the most
comprehensive perspective.

58
CONCLUSION
Libraries are discovering that web logs provide vast amounts of information about
the use of their websites. Web logs can provide information about which user groups
access the website, which resources are viewed the most, and the links users follow to
arrive at the site. In order to process the large amounts of data generated by most
websites, log analysis software must be utilized. Such software produces reports with
summary statistics about website use.
In addition to the benefits of log analysis, there are limitations. Caching and
dynamic IP addressing are two phenomena that could cause web statistics to be less valid
measures of website use. For these reasons and others, web log analysis is not a
substitute for measurement techniques such as usability studies, questionnaires, and
interviews.
NIEHS Library is incorporating web log analysis into higher-level decision-
making processes. In order to accomplish this, customized reports were created by the
Analog software to analyze “internal” URLs on the library’s website. A “ClickCount”
database was designed to count clicks on “external” links to resources such as electronic
journal titles. Both the Analog custom reports and ClickCount reports can help the
library target management, marketing, and collection development issues.
Finally, the NIEHS Library needs a methodology for how to explicate web log
data that it can use on a continual basis. Since log reports require interpretation, there
should be a formula for what data to capture and how to organize it. This paper provides

59
a template so that web log statistics will be a valuable asset to the library’s future
planning.

60
REFERENCES
Bauer, K. (2000, January/February). Who Goes There? Measuring Library Web Site Usage. Online, 25-31.
Bertot, J.C., McClure, C.R., Moen, W.E., & Rubin, J. (1997). Web Usage Statistics:
Measurement Issues and Analytical Techniques. Government Information Quarterly, 14(4), 373-395.
Fieber, J. (2002). Browser Caching and Web Log Analysis. Retrieved May 1, 2002, from
http://ell.slis.indiana.edu/~jfieber/papers/bcwla/bcwla.html Goldberg (2001). Why Web Usage Statistics are (Worse Than) Meaningless. Retrieved
May 1, 2002, from http://www.goldmark/org/netrants/webstats/ Harris, S. (2001, April 18). Agencies Still Violating Cookies Policy. Government
Executive. Retrieved May 1, 2002, from http://www.govexec.com/dailyfed/0401/041801h1.htm
Hightower, C., Sih, J., & Tilghman, A. (1998, January). Recommendations for
Benchmarking Web Site Usage among Academic Libraries. College & Research Libraries. 61-79.
Houser, W.R. (2000, November 6). As it’s written, OMB Policy on Cookies is Half-
Baked [Electronic version]. Government Computer News, 19(32). Retrieved May 1, 2002, from http://www.gcn.com/vol19_no32/opinion/3216-1.html
Keiser, B.E. (2002, May/June). Vendor Best Efforts and Shared Responsibilities: What
Your Vendors Know and Don’t Share Can Be Hazardous to Their Business. Online, 43-49.
Kirsner, S. (1997, July/August). Web of Confusion. American Journalism Review, 19(6),
34-39.

61
Li, X. (1999). Library Web Page Usage: A Statistical Analysis. The Bottom Line:
Managing Library Finances, 12(4), 153-159. Mariner, V. (2002, Winter). Logging Usability. Library Journal NetConnect. 30-31. Nicholas, D., Huntington, P., Lievesley, N., & Withey, R. (1999). Cracking the Code:
Web Log Analysis. Online & CD-ROM Review, 23(5), 263-269. Peters, T. (1996). Using Transaction Log Analysis for Library Management Information.
Library Administration & Management, 10(1), 20-25. Stout, R. (1997). Web Site Stats: Tracking Hits and Analyzing Traffic. Berkeley, CA:
Osborne McGraw-Hill. Zawitz, M.W. (1998, May). Web Statistics - Measuring User Activity: An Analysis of
Bureau of Justice Statistics (BJS) Website Usage Statistics. 1-12. (Bureau of Justice Statistics Publication No. NCJ – 171118). Retrieved May 1, 2002, from http://www.ojp.usdoj.gov/bjs/abstract/wsmua.htm
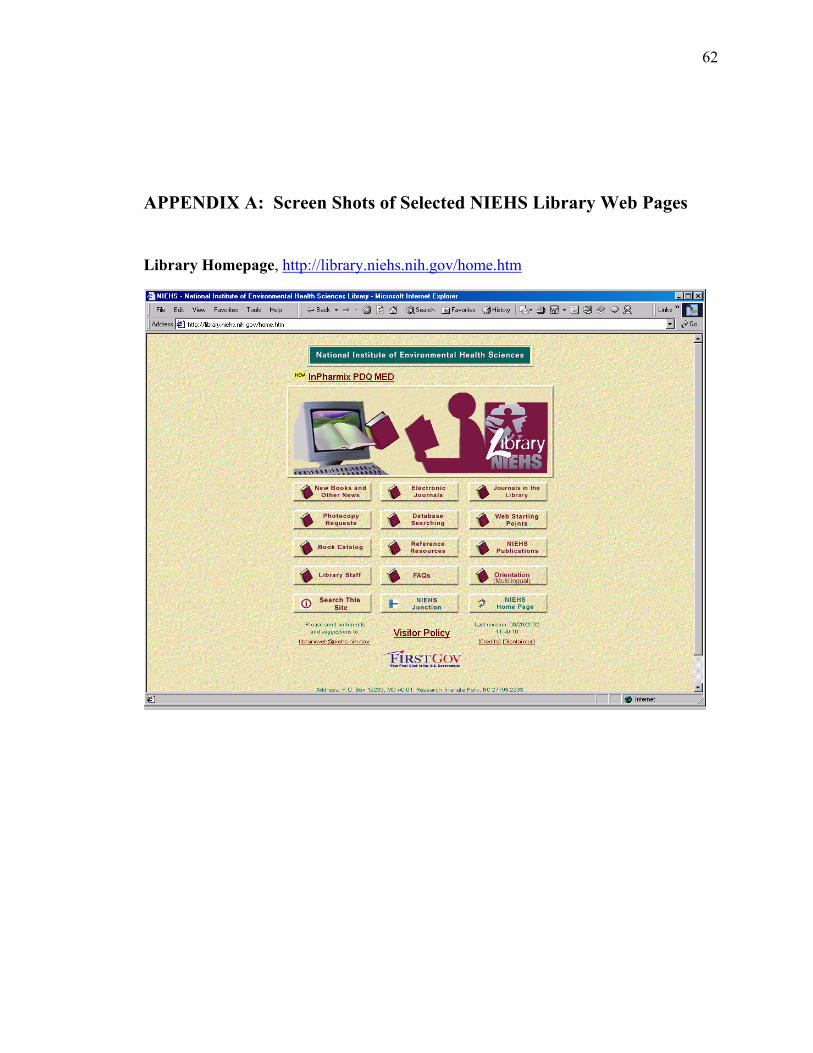
62
APPENDIX A: Screen Shots of Selected NIEHS Library Web Pages Library Homepage, http://library.niehs.nih.gov/home.htm
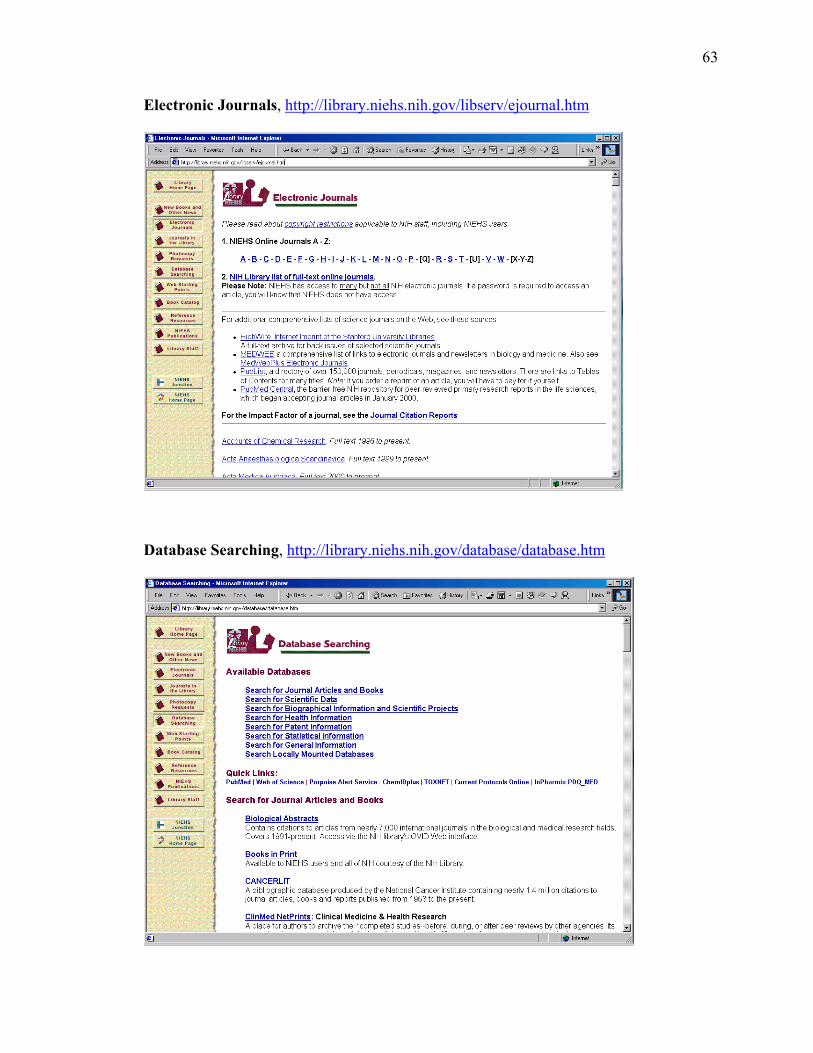
63
Electronic Journals, http://library.niehs.nih.gov/libserv/ejournal.htm
Database Searching, http://library.niehs.nih.gov/database/database.htm

64
Web Starting Points, http://library.niehs.nih.gov/start/www.htm
Scientific Resources, http://library.niehs.nih.gov/start/start.htm
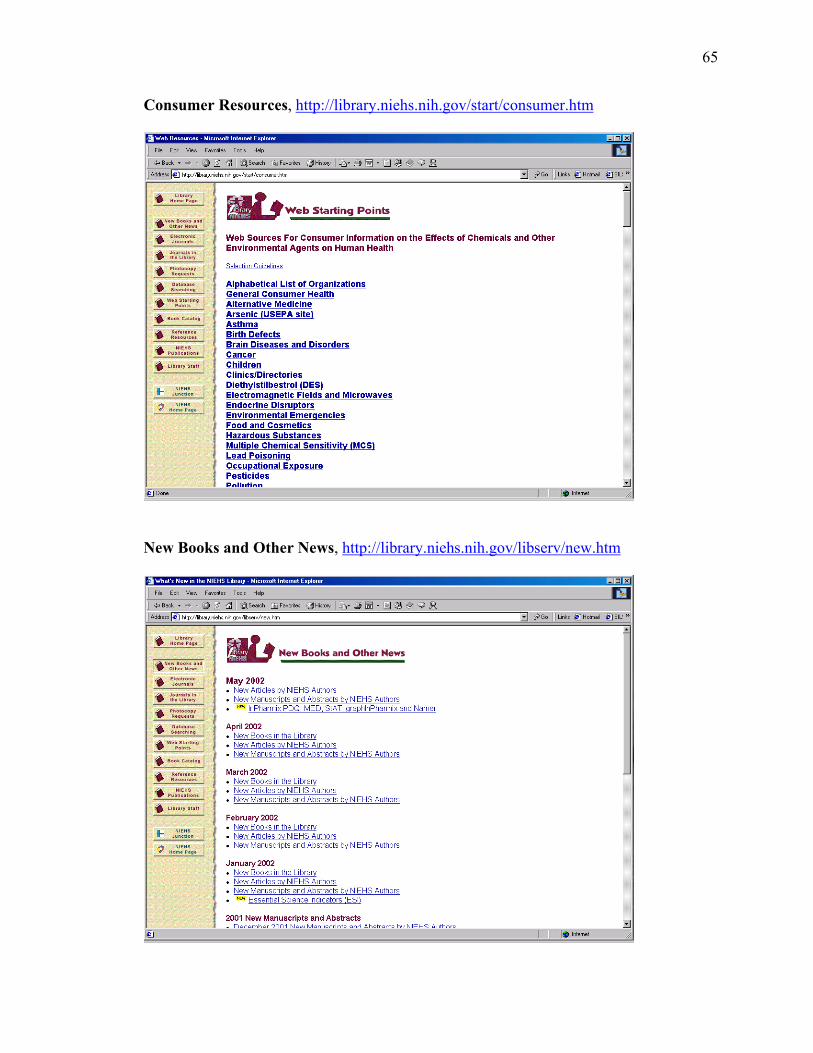
65
Consumer Resources, http://library.niehs.nih.gov/start/consumer.htm
New Books and Other News, http://library.niehs.nih.gov/libserv/new.htm

66
APPENDIX B: Sample Entries from NIEHS Library’s Raw Logs Host - - [Date/time of transaction] “HTTP Request for File” Status Code Size of File “Referrer” “Browser (Operating System)” xxxx.xxx.xxx.xx - - [01/Feb/2002:02:05:49 -0500] "GET /bibliography/bib-2000.htm HTTP/1.0" 200 133587 "http://www.google.com/search?q=instability+of++%22au+rich+elements%22+&hl=en&start=40&sa=N" "Mozilla/4.0 (compatible; MSIE 5.5; Windows 98)" xxxxxxxx.xxxxx.xxx.xxx - - [01/Feb/2002:01:35:56 -0500] "GET /images/libback1.gif HTTP/1.0" 200 20229 "http://library.niehs.nih.gov/" "Mozilla/4.0 (compatible; MSIE 5.5; Windows NT 4.0)" xxxxxxxxxx.xxxxx.xxx.xxx - - [01/Feb/2002:07:44:15 -0500] "GET /database/database.htm HTTP/1.0" 200 29168 "http://www.niehs.nih.gov/junction/" "Mozilla/4.77 (Macintosh; U; PPC)" xxxxxxxxxx.xxxxx.xxx.xxx - - [01/Feb/2002:07:44:15 -0500] "GET /images/border2.gif HTTP/1.0" 200 4902 "http://library.niehs.nih.gov/database/database.htm" "Mozilla/4.77 (Macintosh; U; PPC)" xxxx.xxxxx.xx.xx - - [01/Feb/2002:05:44:19 -0500] "GET /bibliography/1990.htm HTTP/1.0" 200 66852 "http://google.yahoo.com/bin/query?p=AH+64+suppressor+infrared&b=21&hc=0&hs=0&xargs=" "Mozilla/4.0 (compatible; MSIE 5.5; Windows 98)" xxxxxx.xxxxxxxxxx.xx - - [01/Feb/2002:07:25:57 -0500] "GET /images/border2.gif HTTP/1.0" 200 4902 "http://translate.google.com/translate_c?hl=de&sl=en&u=http://library.niehs.nih.gov/start/registry.htm&prev=/search%3Fq%3DChemical%2BAbstracts%2BSystem%26hl%3Dde%26sa%3DG" "Mozilla/4.0 (compatible; MSIE 5.0; Windows 95)" xxxxxxxxxx.xxxxx.xxx.xxx - - [01/Feb/2002:08:03:13 -0500] "GET /libserv/ejournal.htm HTTP/1.0" 200 91632 "http://www.niehs.nih.gov/junction/" "Mozilla/4.75 (Macintosh; U; PPC)" xxxxxxxxxx.xxxxx.xxx.xxx - - [01/Feb/2002:08:03:13 -0500] "GET /images/border2.gif HTTP/1.0" 304 - "http://library.niehs.nih.gov/libserv/ejournal.htm" "Mozilla/4.75 (Macintosh; U; PPC)"
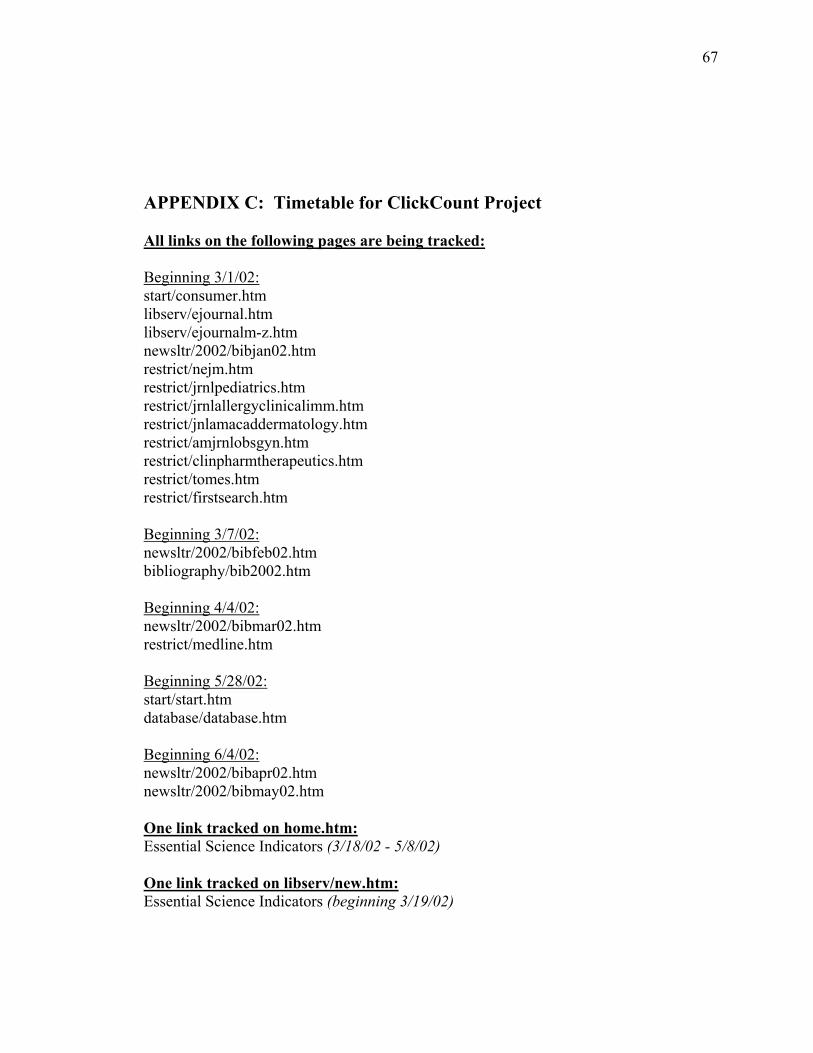
67
APPENDIX C: Timetable for ClickCount Project
All links on the following pages are being tracked: Beginning 3/1/02: start/consumer.htm libserv/ejournal.htm libserv/ejournalm-z.htm newsltr/2002/bibjan02.htm restrict/nejm.htm restrict/jrnlpediatrics.htm restrict/jrnlallergyclinicalimm.htm restrict/jnlamacaddermatology.htm restrict/amjrnlobsgyn.htm restrict/clinpharmtherapeutics.htm restrict/tomes.htm restrict/firstsearch.htm Beginning 3/7/02: newsltr/2002/bibfeb02.htm bibliography/bib2002.htm Beginning 4/4/02: newsltr/2002/bibmar02.htm restrict/medline.htm Beginning 5/28/02: start/start.htm database/database.htm Beginning 6/4/02: newsltr/2002/bibapr02.htm newsltr/2002/bibmay02.htm One link tracked on home.htm: Essential Science Indicators (3/18/02 - 5/8/02) One link tracked on libserv/new.htm: Essential Science Indicators (beginning 3/19/02)

68
Resources tracked on database/database.htm: Beginning 3/19/02: Essential Science Indicators Beginning 4/4/02: PubMed Web of Science Porpoise Current Protocols Online Biological Abstracts Beginning 5/28/02: All resources tracked Resources tracked on referenc/resource.htm (beginning 5/28/02): Kirk-Othmer Online Patty’s Toxicology Current Protocols Online