niit technologies financial results analysis financial … results with aq... · prestigious black...
TRANSCRIPT

Oct 16, 2008 Q2 ’09 Results 1
NIIT Technologies Financial Results Analysis
Financial Year 2008-09Quarter 2

Oct 16, 2008 Q2 ’09 Results 2
Outline
• Highlights– For the Quarter– Acknowledgements– Business Highlights for the quarter
• Financial Statements– Income Statement– Balance Sheet
• Business Analysis– Revenue Cuts– Order Intake– Top clients– People Resources
• Shareholding Pattern
All nos. on a Consolidated Basis

Oct 16, 2008 Q2 ’09 Results 3
Highlights for the Quarter
• Consolidated Revenues at Rs 2587mn– Up 13% YoY, 5% QoQ (7% QoQ excluding hedging)– Revenue loss on account of hedging – Rs. 85Mn
• Operating profits at Rs 458Mn– Up 8% YoY, Flat QoQ (8% QoQ excluding hedging)– Operating Margins at 18% (LQ & LY 19%)– Operating Margins excluding hedging 20%– Capacity utilization 81%
• Net Profits at Rs 367Mn– Up 7% YoY; 4% QoQ– Net Margins at 14% (LQ 14%; LY 15%)
• Fresh order intake of $75mn
• Unveiled IPF3 – New Generation SOA-based Insurance Process Framework

Oct 16, 2008 Q2 ’09 Results 4
Acknowledgements
• Ranked No. 3 among IT Outsourcing Vendors in the prestigious Black Book of Outsourcing 2008 Insurance Industry user survey
• Declared ‘Business Superbrand’ for 2008
• Felicitated with the ‘Distinguished Service Award ' at the 2008 India and the U.S. Symposium

Oct 16, 2008 Q2 ’09 Results 5
Business Highlights for the Quarter
• Focus verticals contribute 83% to revenues
• BFSI grows 6% YoY (Contributes 42%)– Repeat Orders from existing customers– Added a mid sized American Insurer as new client– Enthusiastic response to IPF3
• Transport grows 29% YoY (Contributes 28%)– Signed Strategic engagement with Cathay Pacific for the development of a
Warehouse Operating System for their new cargo terminal at HK airport– In addition to above, added 1 new significant client– Multi-year multi-million contract with British Airways
• Manufacturing & Retail grows 21% YoY (Contributes 13%)– New Managed Services contract with existing client– 1 new client in UK
• Non-linear Business grows 32% YoY (Contributes 25%)

Oct 16, 2008 Q2 ’09 Results 6
Quarterly Income Statement
5.99
14.3%
351
51
62
112
19%
456
2002
453
1549
2458
Q1’09
16531409Cost of Revenues
6.25
14.2%
367
65
81
104
18%
458
2128
475
2587
Q2’09
69Other Income (net of interest)
6141873Total Operating Expenses
7
(80) Bps
7
(81) Bps
8
13
YoY(%)
4
(12) Bps
4
(83) Bps
0
5
QoQ(%)
5.86
15.0%
344
47
103
19%
426
464
2299
Q2’08
Net Margins (%)
OPM (%)
PAT after Minority Interest
Tax
Operating Profit
Depreciation
EPS (Rs. Basic)
SG&A
Revenues
(Rs Mn)
• Other Income includes gain of Rs. 56mn due to forex & MTM of non-effective hedges

Oct 16, 2008 Q2 ’09 Results 7
Balance Sheet
4764
0
521
54
4189
3602
587
Jun 30, 2008
13071822Cash & Equivalents58Minority Interest
196143Deferred tax Assets
Current Liabilities
Other Current Assets
Debtors
Capital WIP
Net Block
4712
0
413
4241
3654
587
Sep 30, 2008
47124764
(3002)
1116
2153
790
2152
Sep 30, 2008
617Reserves & Surplus
Jun 30, 2008
(Rs in mn)
(3010)
984
2013
2195
Deferred tax Liability
Net worth
Loans
Equity
• DSOs at 80 days Vs. 77 days LQ• Cash & cash equivalents Rs 1307mn
• Dividend payout Rs. 381mn• Loan Repayment Rs. 105mn
• Increase in Capital WIP due to Asset Additions & New Infra
Oct 16, 2008 Q2 ’09 Results 8
Americas
32%
APAC10%
EMEA50%
India8%
Americas
32%
APAC10%
EMEA50%
India8%
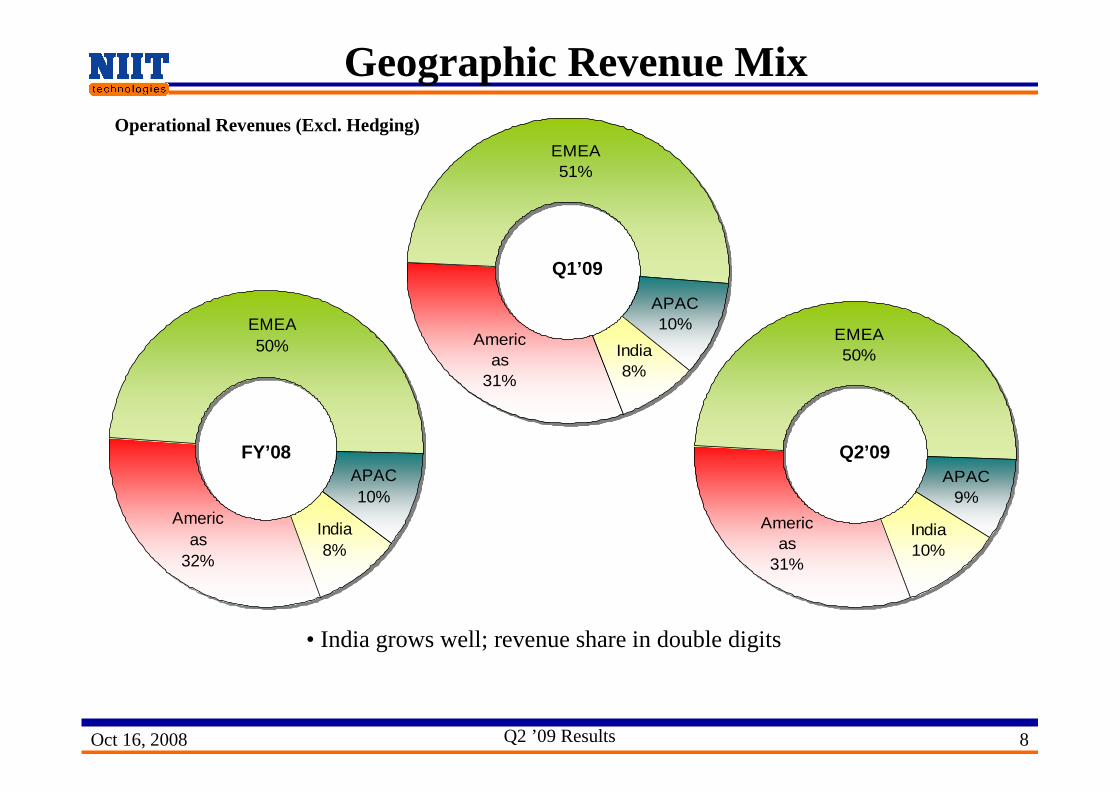
Geographic Revenue Mix
FY’08 Q2’09
• India grows well; revenue share in double digits
Q1’09
Operational Revenues (Excl. Hedging)
Americas
31%
EMEA50%
APAC9%
India10%
Americas
31%
EMEA50%
APAC9%
India10%
Americas
31%
EMEA51%
APAC10%
India8%
Americas
31%
EMEA51%
APAC10%
India8%
Oct 16, 2008 Q2 ’09 Results 9
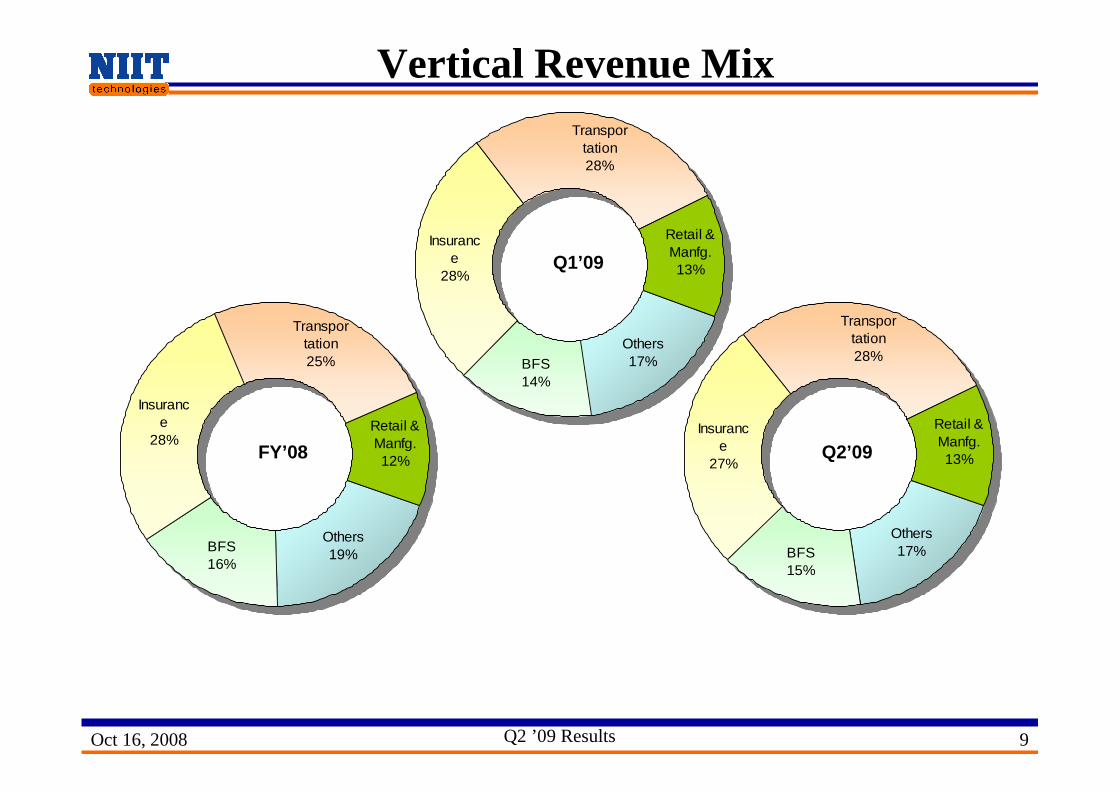
Vertical Revenue Mix
Insurance
28%Retail & Manfg.12%
Transportation25%
BFS16%
Others19%
Insurance
28%Retail & Manfg.12%
Transportation25%
BFS16%
Others19%
FY’08Insuranc
e27%
Retail & Manfg.13%
Transportation28%
BFS15%
Others17%
Insurance
27%
Retail & Manfg.13%
Transportation28%
BFS15%
Others17%
Q2’09
Insurance
28%
Retail & Manfg.13%
Transportation28%
BFS14%
Others17%
Insurance
28%
Retail & Manfg.13%
Transportation28%
BFS14%
Others17%
Q1’09

Oct 16, 2008 Q2 ’09 Results 10
Order Intake
• 5 new significant customers added during the quarter• 2 large airlines• 1 mid-tier American insurer
• $95mn of firm business executable over next 12 months
US $ mn
4049
59
81
43
75
Q1'08
Q2'08
Q3'08
Q4'08
Q1'09
Q2'09

Oct 16, 2008 Q2 ’09 Results 11
Top Client Mix
• 42 Million dollar clients
38% 36% 36% 36% 36% 34% 34%
49% 47% 46% 46% 47% 46% 46%
63% 60% 58% 59% 60% 60% 60%
40% 42% 41% 40% 40%37% 40%
Q1'08 Q2'08 Q3'08 Q4'08 FY'08 Q1'09 Q2'09
Top 10
Top 20
Top 5
(%)
Others
Oct 16, 2008 Q2 ’09 Results 12
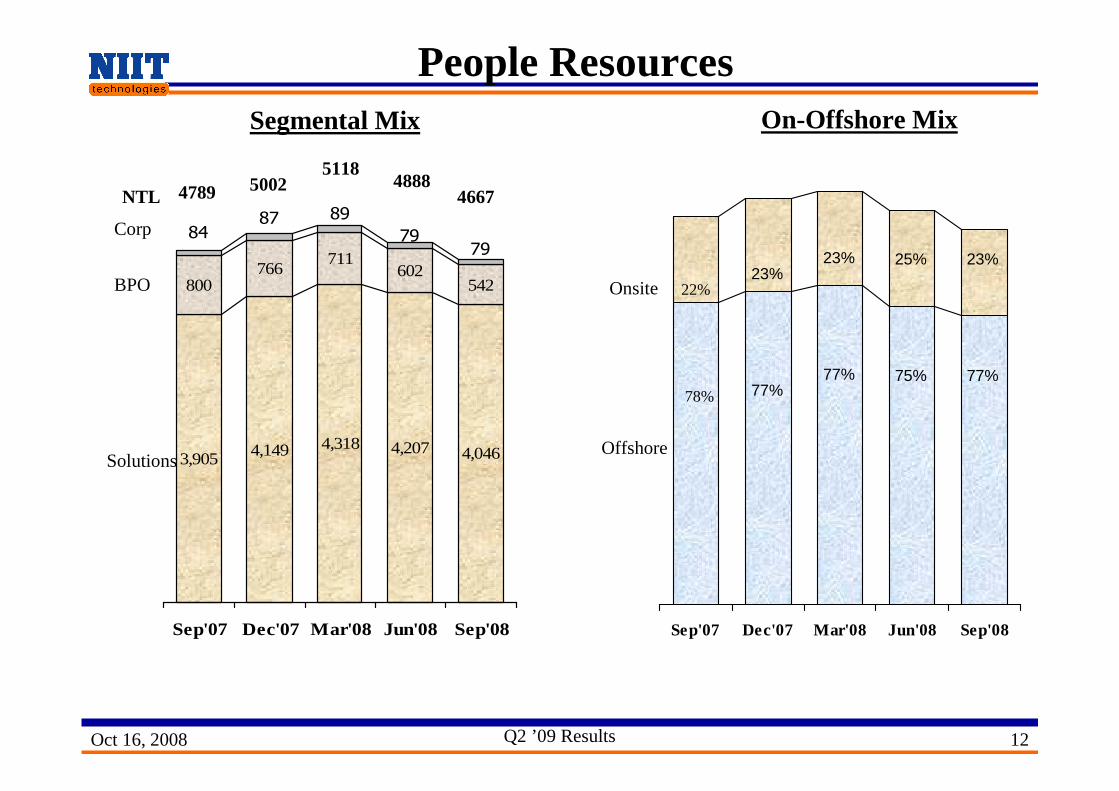
People Resources
3,905 4,149 4,318 4,207 4,046
800766
711602
542
7979
898784
Sep'07 Dec'07 Mar'08 Jun'08 Sep'08 Sep'07 Dec'07 Mar'08 Jun'08 Sep'08
BPO
Solutions
Segmental Mix On-Offshore Mix
Onsite
Offshore
Corp
NTL5002
22%
78% 77%
23%
77%
51184789
23%
4888
75%
25%
4667
77%
23%

Oct 16, 2008 Q2 ’09 Results 13
Shareholding Pattern
37 3441 39
46
4040
40 4040
7 138 12
616 13 11 9 8
Sep'07 Dec'07 Mar'08 Jun'08 Sep'08
FIIs
Banks/MF/FI's
Promoters
Others
•All figures in %

Oct 16, 2008 Q2 ’09 Results 14
Thank You