nih public access - cognitive control and...
TRANSCRIPT

Progressive Deformation of Deep Brain Nuclei and Hippocampal-Amygdala Formation in Schizophrenia
Lei Wang1, Daniel Mamah2, Michael P. Harms2, Meghana Karnik2, Joseph L. Price4, MokhtarH. Gado5, Paul A. Thompson6, Deanna M. Barch3, Michael I. Miller7,8, and John G.Csernansky11Department of Psychiatry and Behavioral Sciences, Northwestern University Feinberg School ofMedicine, Chicago IL2Department of Psychiatry, Washington University School of Medicine, St. Louis MO3Department of Psychology, Washington University School of Medicine, St. Louis MO4Department of Anatomy and Neurobiology, Washington University School of Medicine, St. LouisMO5Department of Radiology, Washington University School of Medicine, St. Louis MO6Department of Division of Biostatistics, Washington University School of Medicine, St. Louis MO7Center for Imaging Science, The Johns Hopkins University, Baltimore MD8Institute for Computational Medicine, The Johns Hopkins University, Baltimore MD
AbstractBackground—Progressive decreases in cortical gray matter volume have been reported inindividuals with schizophrenia. However, studies of progressive change in deep brain nuclei andhippocampal-amygdala formation have not yielded consistent findings.
Methods—Two high-resolution, T1-weighted magnetic resonance images were collected two yearsapart in 56 schizophrenia and 62 control subjects. Large-deformation high-dimensional brainmapping was used to generate surfaces for deep brain nuclei and hippocampal-amygdala formationat baseline and follow-up. Repeated-measures ANOVA was used to test for longitudinal changes involume and shape.
Results—The pattern of progressive changes in the deep brain nuclei and hippocampal-amygdalaformation in subjects with schizophrenia and controls was variable. Of the structures that receivedirect projections from the cortex, the thalamus, caudate nucleus, nucleus accumbens andhippocampus showed changes specific to subjects with schizophrenia, and changes in the amygdalaand putamen were similar in both groups. While different at baseline, no progressive change wasobserved in the globus pallidus, which does not receive direct projections from the cortex.
© 2008 Society of Biological Psychiatry. Published by Elsevier Inc. All rights reserved.Corresponding author: Lei Wang, Department of Psychiatry and Behavioral Sciences, Northwestern University Feinberg School ofMedicine, 446 E. Ontario, Suite 7-200, Chicago, IL 60611, [email protected]'s Disclaimer: This is a PDF file of an unedited manuscript that has been accepted for publication. As a service to our customerswe are providing this early version of the manuscript. The manuscript will undergo copyediting, typesetting, and review of the resultingproof before it is published in its final citable form. Please note that during the production process errors may be discovered which couldaffect the content, and all legal disclaimers that apply to the journal pertain.FINANCIAL DISCLOSURESThe authors reported no biomedical financial interests or potential conflicts of interest.
NIH Public AccessAuthor ManuscriptBiol Psychiatry. Author manuscript; available in PMC 2010 April 15.
Published in final edited form as:Biol Psychiatry. 2008 December 15; 64(12): 1060–1068. doi:10.1016/j.biopsych.2008.08.007.
NIH
-PA
Author M
anuscriptN
IH-P
A A
uthor Manuscript
NIH
-PA
Author M
anuscript

Conclusions—These findings suggest that the disease process of schizophrenia is associated withprogressive effects on brain structure, and that brain structures that receive direct, excitatoryconnections from the cortex may be more likely to show progressive changes, as compared to brainstructures that receive indirect, inhibitory connections from the cortex. These findings are alsosomewhat consistent with the hypothesis that overactivity of excitatory pathways in the brain maycontribute to the neural degeneration that occurs in at least a subgroup of individuals withschizophrenia.
KeywordsAmygdala; Hippocampus; Basal Ganglia; Thalamus; Longitudinal Change; Brain Mapping
INTRODUCTIONPost-mortem studies of individuals with schizophrenia suggest gray matter volume loss acrossa range of brain structures (1–3). Similarly, in vivomagnetic resonance (MR) imaging studiesprovide evidence of widespread gray matter change in individuals with schizophrenia (4–9),including some who are early in their course of illness (10–12).
Recent longitudinal MR studies offer evidence of progressive gray matter loss (12–14) in thecortex. However, the observed pattern of time-dependent changes in deep brain nuclei andhippocampal-amygdala formation has not been consistent (14–16), and this inconsistency maybe due to the fact that the same method of image acquisition and analysis has not been used tosurvey a variety of relevant structures within the same subjects. The presence or absence oftime-dependent changes in these structures may depend on the nature of their connections withthe cerebral cortex. The thalamus and striatum all have direct, excitatory connections with thecortex, while the globus pallidus receives inhibitory signals from the striatum and limbicstructures, and in turn, passes inhibitory signals to the thalamus. Information from differentcortical areas, including the prefrontal, frontal, motor, and sensory areas, is first received bythe striatum via excitatory projections, and then passed on to the thalamus via inhibitoryprojections from the globus pallidus. Finally, the thalamus projects to the cortex, completinga cortico-basal ganglia-thalamo-cortical loop (17). The hippocampus and the amygdala alsohave reciprocal excitatory connections with the medial prefrontal cortex (18,19), and projectto the mediodorsal nucleus of the thalamus.
In this study, we characterized the patterns of change in shape and volume in the deep brainnuclei and hippocampal-amygdala formation in schizophrenia. Based on the potential foroveractive excitatory projections to damage neurons and their processes (i.e, excitotoxicity)(20,21), we hypothesized that structures with direct, excitatory connections with the cortex(thalamus, striatum, hippocampus and amygdala) would show time-dependent changes, whilestructures with indirect, inhibitory connections with the cortex (globus pallidus) would not.Since brain structural changes may be accompanied by changes in the cognitive functionssupported by these structures, we also examined the correlation between these changes.
METHODSParticipants
The subjects in the present study were selected from groups of schizophrenia (n=139, M/F=90/49, age=35.0±13.0 years) and healthy comparison subjects (n=136, M/F=73/63,age=33.3±14.1 years) that were enrolled into an ongoing study of brain structure andschizophrenia. From these subjects, 56 schizophrenia and 62 healthy comparison subjectsreturned for follow-up and were included in the present study. All individuals gave written
Wang et al. Page 2
Biol Psychiatry. Author manuscript; available in PMC 2010 April 15.
NIH
-PA
Author M
anuscriptN
IH-P
A A
uthor Manuscript
NIH
-PA
Author M
anuscript

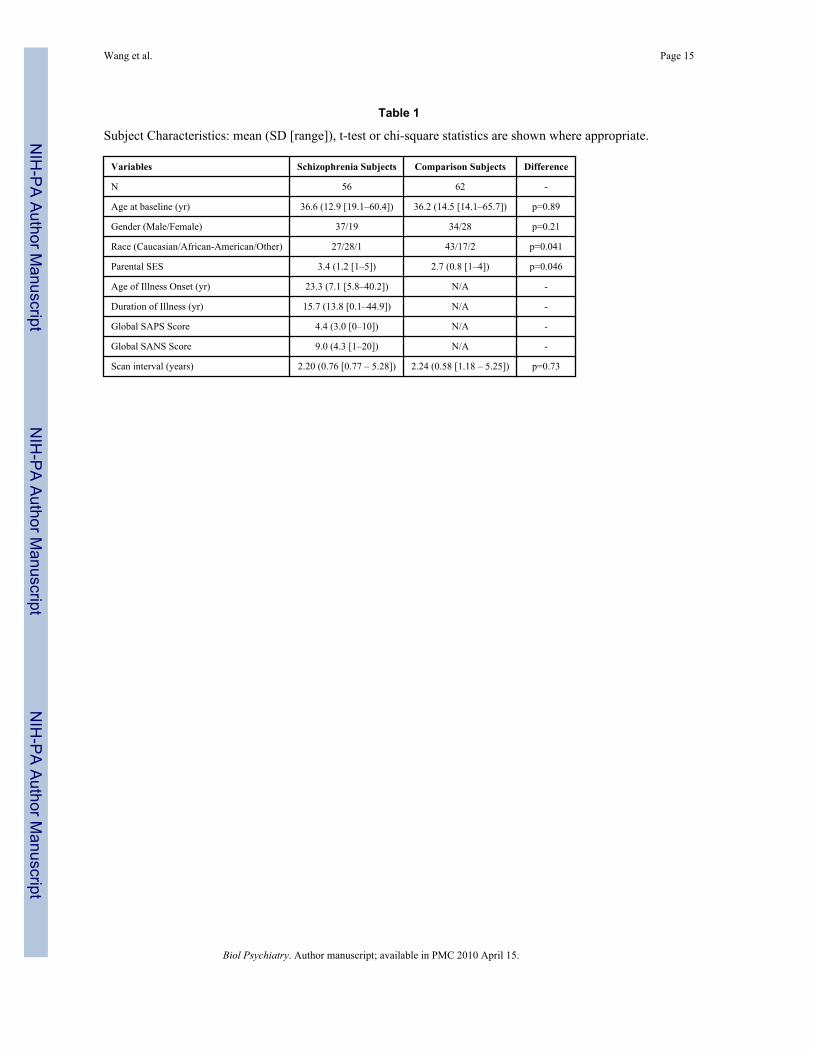
informed consent for participation after the risks and benefits were explained. Subjectcharacteristics are summarized in Table 1.
Individual diagnosis was determined by consensus between a research psychiatrist whoconducted a semi-structured interview and a research assistant who conducted the StructuredClinical Interview for the DSM-IV (SCID-IV) (22), using criteria from the DSM-IV (23). Theresearch assistant had Master’s-level degree in a mental health discipline and considerableclinical experience. No individual had an unstable medical or neurological disorder, or headinjury with loss of consciousness, nor did any meet DSM-IV criteria for substance abuse ordependence for one month prior to participation. The symptoms of the individuals withschizophrenia had remained unchanged for at least two weeks (24) prior to the baseline andfollow-up assessments.
During the two-year study period, 39 subjects with schizophrenia were treated with atypicalantipsychotic drugs alone, 13 with typical antipsychotic drugs alone or a combination of both,7 did not provide treatment information. Treatment with adjunctive medications, includingmood stabilizers and anti-depressants, was common.
The severity of psychopathology in the individuals with schizophrenia was assessed at bothtime points using the Scale for the Assessment of Positive Symptoms (SAPS) (25) and Scalefor the Assessment of Negative Symptoms (SANS) (26). Baseline psychopathology data wasused as reference to compute Z-scores for each psychopathology item. Selected clusters ofpsychopathological item Z-scores were averaged to form composite scores for three clinicaldomains – positive symptoms, negative symptoms, and thought disorganization (27).
The subject assessment also included neuropsychological tests on tasks relevant to cognitionin schizophrenia (28–33). Z-scores were first computed using data from a larger population ofresearch subjects (164 schizophrenia, 161 comparison subjects). The Z-scores were thengrouped to form composite scores for four cognitive domains (27):
Working Memory—Wechsler Adult Intelligence Scale – Third Edition (WAIS-III (34)) digitspan (total forward and backwards), WAIS-III spatial span (total forward and backwards),WAIS-III letter-number sequencing, and the CPT-IP (overall d-prime) (35).
Episodic Memory—Wechsler Memory Scale – Third Edition (WMS-III) logical memoryand WMS-III family pictures.
Executive Function—Verbal fluency (phonological for letter ‘S’ plus categorical foranimals), Trails B (scored time to completion), WAIS-III matrix reasoning, and WisconsinCard Sorting Test perserverative errors.
Crystallized Intelligence—Standard scores from the vocabulary subtest of WAIS-III.
Image CollectionAll MR scans were collected on a Magnetom 1.5-Tesla Siemens scanner with a standard headcoil using a turbo-FLASH sequence (TR=20ms, TE=5.4ms, flip angle=30°, 180 slices,FOV=256mm, matrix=256×256, time=13.5min) that acquired 1mm3 isotropic whole-headimages (36). Signed 16-bit images were compressed to unsigned 8-bit images by linearinterpolation of voxel intensities.
To control for varying brain sizes we computed an atlas scaling factor (ASF) for each individualat baseline (37). The ASF is the reciprocal of the determinant of the alignment matrix toTalairach atlas space and it represents the degree of volume expansion or contraction required
Wang et al. Page 3
Biol Psychiatry. Author manuscript; available in PMC 2010 April 15.
NIH
-PA
Author M
anuscriptN
IH-P
A A
uthor Manuscript
NIH
-PA
Author M
anuscript

for alignment. The ASF approximated brain plus ventricular volume and exhibited groupdifference at baseline (F=4.3,df=1,111,p=0.04), therefore it was used as a covariate in statisticalanalyses.
Surface MappingAt baseline, the surfaces of the deep brain nuclei and hippocampal-amygdala formation weretransferred from a template scan (from a subject otherwise not included in this study) byapplying Large-Deformation High-Dimensional Brain Mapping (HDBM-LD) to each scan(9,38). We have previously established the validity and reliability of HDBM-LD for mappingthe hippocampus (39), thalamus (40), and basal ganglia (41). For the amygdala, we comparedHDBM-LD-generated segmentations to expert manual segmentations in scans of 10 randomlyselected subjects. The average (SD) overlap of voxels was 74.3% (11.3)%, volume ICC was0.82, L1-error was 0.29 (0.06), and mean surface-to-surface distance was 0.33 (0.07) voxels.These error measures were comparable to the accuracy measures we obtained in otherstructures, and for detailed explanations of these measures see Wang et al (41).
To map the surfaces at follow-up, baseline and follow-up scans were first registered using anine-parameter affine transformation (42) to adjust for changes in head position and scanner-drift (43). Next, HDBM-LD was used in neuroanatomical regions immediately surroundingthe structures of interest, at twice the native-scan resolution. In the literature, whole-brainmapping has been used to characterize whole-brain changes over time (44,45), while mappingof subregions has been used for serial mapping of specific structures (46).
Note that during the mapping procedure, the only manual interaction occurred during themapping at baseline: prior to diffeomorphic transformations, anatomic landmarks were placedby expert raters who were blinded to the group status of the scan being landmarked. Detailedlandmarking procedures can be found in our previous publications (9,38,39,41).
Statistical AnalysisThe left and right volumes of each structure at baseline and follow-up were computed as thevolumes enclosed by the transformation-derived surfaces. There were no missing values in thedata. These volumes were entered into a repeated-measures analysis of variance (RM-ANOVA) model, with diagnostic group as the main effect, and hemisphere and time as repeatedfactors. The main group and time effects and group-by-time interaction were examined.Baseline group effect was also examined in a similar RM-ANOVA.
To quantitate surface shape, we first applied principal components analysis (PCA) to thebaseline right-hand-side surfaces for dimensionality reduction. The first 15 principalcomponents (PC) accounted for >80% of total variance in the right-hemisphere surface in allstructures (ranging 82.9%–97.7%). There were no missing values in the data. For eachstructure, the 15 PC scores were entered into a RM-ANOVA with diagnostic group as the maineffect, and hemisphere and time as repeated factors. The 15 PCs were modeled in a generallinear model (GLM) as repeated factors of identity type. The PC-by-group term was thenreported as the main group effect across all PCs. Modeling the PCs in this doubly repeated-measures analysis was equivalent to an RM-MANOVA with a customized transformationmatrix where within each PC the follow-up score was subtracted from the baseline score. Maineffects of group and time, and group-by-time interaction were examined. Baseline group effectwas also examined in a similar RM-ANOVA. Finally, for each subject and structure at eachtime point, a canonical score (8) was computed based on the left-right average PC scores , andwas used to correlate with other measures (below).
Wang et al. Page 4
Biol Psychiatry. Author manuscript; available in PMC 2010 April 15.
NIH
-PA
Author M
anuscriptN
IH-P
A A
uthor Manuscript
NIH
-PA
Author M
anuscript

Correlation with Cognition and PsychopathologyWe calculated the residualized change for all cognition and psychopathology variables byregressing the baseline variables onto the follow-up variables, and then subtracting thepredicted follow-up value from the observed follow-up value. The relationship betweenchanges in measures of cognition, psychopathology and measures of change in brain structurewere then examined by calculating the correlations between the residualized measures (47)using Spearman’s rho. Significance was not adjusted for multiple comparisons because theserelationships were examined on an exploratory basis.
RESULTSParticipants
Comparing with the subjects who returned for follow-up, subjects who did not return wereyounger (30.8±13.5 years, p=0.027) and had a shorter duration of illness (10.5±9.9 years,p=0.013) at baseline, but they did not differ in psychopathology as assessed using the totalscores from SAPS (p=0.23) and SANS (p=0.65).
For the schizophrenia subjects, a repeated-measures general linear model with time as arepeated factor on clinical symptom domain scores showed no time effect for positivesymptoms (F=0.67,df=1,54,p=0.42) or thought disorganization (F=1.8,df=1,54,p=0.18).However there was a time effect for negative symptoms (F=5.2,df=1,54,p=0.027). Over theperiod of study, negative symptoms improved from 0.35 at baseline to 0.11 at follow-up.
As expected, there were significant group effects at baseline for all four cognitive domainscores (p<0.0001, see Table 2). Further, a repeated-measures general linear model with timeas a repeated factor showed no time effect for working memory (F=0.08,df=1,51,p=0.77),episodic memory (F=0.14,df=1,51,p=0.70) or crystallized IQ (F=0.14,df=1,51,p=0.70).However, there was a significant time effect for executive function (F=5.0,df=1,51,p=0.029);i.e., the domain scores changed from !0.56 at baseline to !0.40 at follow-up, reflecting mildimprovement.
ThalamusFor volume, baseline group effect trended toward significance, with schizophrenia subjectshaving smaller left and right volumes (see Table 3 and Table 4). Longitudinal analysis showeda trend toward significant main group effect, a significant time effect and a trend towardsignificant group-by-time interaction, with the schizophrenia subjects showing a more rapidtwo-year reduction as compared to the comparison subjects (see Table 3 and Table 4). Thehemisphere effect was significant in both the baseline (R>L,F=18.2,df=1,116,p<.0001) andlongitudinal models (F=21.6,df=1,115,p<.0001). Further analysis showed no hemisphere-by-group interaction at baseline (F=0,df=1,115,p=0.95), or hemisphere-by-group-by-timeinteraction (F=0.11,df=1,115,p=0.74).
For surface shape, baseline group effect was significant. Longitudinal analysis showedsignificant group effect, time effect, and group-by-time interaction. The hemisphere effect wassignificant in both the baseline (F=12.8,df=15,102,p<.0001) and longitudinal models(F=12.5,df=15,101,p<.0001). Further analysis showed no hemisphere-by-group interaction atbaseline (F=1.2,df=15,102,p=0.30), or hemisphere-by-group-by-time interaction(F=1.3,df=15,101,p=0.21).
HippocampusFor volume, baseline group effect was not significant. Longitudinal analysis showed asignificant time effect without a significant group effect and group-by-time interaction. The
Wang et al. Page 5
Biol Psychiatry. Author manuscript; available in PMC 2010 April 15.
NIH
-PA
Author M
anuscriptN
IH-P
A A
uthor Manuscript
NIH
-PA
Author M
anuscript

hemisphere effect was significant in both the baseline (R>L,F=519,df=1,114,p<.0001) andlongitudinal models (F=476,df=1,113,p<.0001). Further analysis showed no hemisphere-by-group interaction at baseline (F=0.24,df=1,114),p=0.62), or hemisphere-by-group-by-timeinteraction (F=0.51,df=1,113,p=0.47).
For surface shape, baseline group effect not significant. Longitudinal analysis showedsignificant time effect and group-by-time interaction without significant group effect. Thehemisphere effect was significant in both the baseline (F=417,df=15,100,p<.0001) andlongitudinal models (F=411,df=15,99,p<.0001). Further analysis showed no hemisphere-by-group interaction at baseline (F=1.0,df=15,100,p=0.42), or hemisphere-by-group-by-timeinteraction (F=0.46,df=15,99,p=0.95).
AmygdalaFor volume, baseline group effect was significance, with schizophrenia subjects having smallervolumes on both the left and right sides. Longitudinal analysis showed a significant groupeffect and time effect with no group-by-time interaction. The hemisphere effect was significantin both the baseline (R>L,F=33,df=1,114,p<.0001) and longitudinal models F=32, df=1,113,p<.0001). Further analysis showed significant hemisphere-by-group interaction at baseline(reduced asymmetry for schizophrenia, F=7.1,df=1,114,p=0.009), but no hemisphere-by-group-by-time interaction (F=1.12,df=1,113,p=0.29).
For surface shape, baseline group effect was significant (. Longitudinal analysis showedsignificant group effect and time effect with no group-by-time interaction. The hemisphereeffect was significant in both the baseline (F=295,df=15,100,p<.0001) and longitudinal models(F=285, df=15,99, p<.0001). Further analysis showed trend toward significant hemisphere-by-group interaction at baseline (F=1.7,df=15,100,p=0.067), but no hemisphere-by-group-by-time interaction (F=0.79,df=15,99,p=0.68).
Caudate NucleusFor volume, baseline group effect was not significant. Longitudinal analysis showed a trendtoward significance main group effect, no significant time effect and a significant group-by-time interaction, with the schizophrenia subjects showing a more rapid two-year reduction ascompared to the comparison subjects. The hemisphere effect was significant in both thebaseline (R<L,F=9.2,df=1,116,p=0.003) and longitudinal models (F=11, df=1,115, p=0.0015).Further analysis showed no hemisphere-by-group interaction at baseline(F=1.5,df=1,116,p=0.21), nor hemisphere-bygroup-by-time interaction(F=0.2,df=1,115,p=0.66).
For surface shape, baseline group effect was significant. Longitudinal analysis showedsignificant group effect, time effect, and group-by-time interaction. The hemisphere effect wassignificant in both the baseline (F=14,df=15,102,p<.0001) and longitudinal models(F=14,df=15,101,p<.0001). Further analysis showed no hemisphere-by-group interaction atbaseline (F=1.2,df=15,102,p=0.29), nor hemisphere-by-group-by-time interaction(F=0.62,df=15,101,p=0.85).
PutamenFor volume, baseline group effect was not significant. Longitudinal analysis showed nosignificant group effect, time effect or group-by-time interaction. The hemisphere effect wassignificant in both the baseline (R<L,F=21,df=1,116,p<.0001) and longitudinal models(F=22,df=1,115,p<.0001). Further analysis showed no hemisphere-by-group interaction atbaseline (F=0.01, df=1,116, p=0.92), nor hemisphere-by-group-by-time interaction (F=0.52,df=1,115, p=0.47).
Wang et al. Page 6
Biol Psychiatry. Author manuscript; available in PMC 2010 April 15.
NIH
-PA
Author M
anuscriptN
IH-P
A A
uthor Manuscript
NIH
-PA
Author M
anuscript

For surface shape, baseline group effect was. Longitudinal analysis showed significant groupeffect and time effect, without group-by-time interaction. The hemisphere effect wassignificant in both the baseline (F=6.0,df=15,102,p<.0001) and longitudinal models(F=6.0,df=15,101,p<.0001). Further analysis showed no hemisphere-by-group interaction atbaseline (F=1.5,df=15,102,p=0.11), nor hemisphere-by-group-by-time interaction(F=0.84,df=15,101,p=0.63).
Nucleus AccumbensFor volume, baseline group effect was not significant. Longitudinal analysis showed nosignificant group effect, time effect or group-by-time interaction. The hemisphere effect wasnot significant in either the baseline (F=0.02,df=1,116,p=0.89) or longitudinal model(F=0.02,df=1,115,p=0.89).
For surface shape, baseline group effect trended toward significance. Longitudinal analysisshowed significant time effect and group-by-time interaction without significant group effect.The hemisphere effect was significant in both the baseline (F=12,df=15,102,p<.0001) andlongitudinal models (F=12,df=15,101,p<.0001). Further analysis showed a significanthemisphere-by-group interaction at baseline (F=1.9,df=15,102,p=0.033), but no hemisphere-by-group-by-time interaction (F=0.81,df=15,101,p=0.67).
Globus PallidusFor volume, baseline group effect was not significant. Longitudinal analysis showed nosignificant main group effect, time effect or group-by-time interaction. The hemisphere effectwas not significant in either the baseline or longitudinal models. Further analysis showed nohemisphere-by-group interaction at baseline, nor hemisphere-by-group-by-time interaction.
For surface shape, baseline group effect was significant. Longitudinal analysis showedsignificant group effect with a significant time effect or group-by-time interaction. Thehemisphere effect was significant in both the baseline (F=8.1,df=15,102,p<.0001) andlongitudinal models (F=9.1,df=15,101,p<.0001). Further analysis showed no hemisphere-by-group interaction at baseline (F=0.78,df=15,102,p=0.70), nor hemisphere-by-group-by-timeinteraction (F=0.36,df=15,101,p=0.99).
CovariateStatistical comparisons using baseline ASF as a covariate are reported in Table 5. Group andtime effects for the thalamus volume, time effect for the thalamus surface shape became non-significant. Time effect for the hippocampus volume and surface shape became non-significant.Time effect for the amygdala volume and surface shape became non-significant. Time effectfor the caudate nucleus surface shape became non-significant. Time effect for the putamensurface shape became non-significant. Baseline group effect and time effect for the nucleusaccumbens surface shape became non-significant. Group effect for the globus pallidus surfaceshape became non-significant, however the time effect for its shape became significant. Allother effects remained unchanged.
Correlation with Changes in Psychopathology and Cognition in Schizophrenia SubjectsThere was a correlation between the residualized change in positive symptoms and theresidualized change in thalamus shape (canonical score; r=0.32,p=0.019). As the shape of thethalamic surface became progressively more abnormal (i.e., more disparate from the surfaceshape of the healthy comparison subjects), positive symptoms became more severe. A similarinverse correlation at the trend level was found between the residualized change in positivesymptoms and thalamic volume (r=!0.25,p=0.066). As the thalamic volume became
Wang et al. Page 7
Biol Psychiatry. Author manuscript; available in PMC 2010 April 15.
NIH
-PA
Author M
anuscriptN
IH-P
A A
uthor Manuscript
NIH
-PA
Author M
anuscript

progressively smaller, positive symptoms became more severe. These correlations remainedsignificant after partialling out baseline ASF (canonical score: r=0.34,p=0.017; volume: r=!0.28,p=0.051). No other correlations between changes in psychopathology and brain structurewere significant.
There was a correlation between the residualized change in episodic memory and theresidualized change in caudate nucleus shape (r=0.39,p=0.0039). Worsened episodic memoryperformance was associated with progressively more abnormal shape of the caudate nucleussurface (i.e., more disparate from the surface shape of the healthy comparison subjects). Thiscorrelation remained significant after partialling out baseline ASF (r=0.38,p=0.0084). Therewas a correlation between the residualized change in crystallized IQ and the residualizedchange in nucleus accumbens shape (r=!0.45, p=0.0008) and globus pallidus shape (r=!0.30,p=0.030). Lowered crystallized IQ was associated with progressively more abnormal shape ofthe nucleus accumbens and globus pallidus surfaces (i.e., more disparate from the surface shapeof the healthy comparison subjects). These correlations remained significant after partiallingout baseline ASF (Na: r=!0.49, p=0.0004; Pl: r=!0.26, p=0.078). There were no othercorrelations between changes in cognition and brain structure.
Effect of Antipsychotic Treatment during the Study PeriodSince some evidence suggest that antipsychotic medications may affect cortical gray matter(48,49), we assessed the impact of the type of antipsychotic drug treatment on changes in brainstructure in the schizophrenia subjects by examining the effects of time and time-by-drugtreatment type (atypical vs. typical antipsychotics) interaction on measures of structure volumeand shape. We found that the thalamic shape showed a significant time-by-treatment typeinteraction (F=2.01,df=15,36,p=0.043). In individuals with schizophrenia treated with atypicalantipsychotics during the 2-year follow-up period, the inward deviation of the thalamic surfacein the superior and lateral regions was deeper relative to subjects treated with typicalantipsychotics during that same time period (not shown). There were no other time effects ortime-by-treatment interactions for other brain structures.
DISCUSSIONIn this study, we found that progressive change in the deep brain nuclei and hippocampal-amygdala formation in subjects with schizophrenia was of modest magnitude and extent: Aspredicted, the structure of the thalamus, caudate, hippocampus and nucleus accumbens showeddisease-specific progressive (shape) changes, while the globus pallidus did not. However,putamen and amygdala showed progressive changes that were similar in the groups ofschizophrenia and comparison subjects. When adjusted for ASF, only thalamus, caudate andhippocampus showed group differences in the rate of shape change.
In several structures, we found that changes in brain structural shape showed more substantialgroup differences while volume changes were small and not wide spread. That abnormality ofshape change could be revealed without significant volume reductions was consistent with ourprevious studies of brain structure in schizophrenia (7,50,51). This pattern of findings suggeststhat schizophrenia is associated with progressive changes in particular subregions , rather thanthe entire extent of a given structure. However, because the observed progressive change isnot a widespread phenomenon in subjects with schizophrenia, but rather of modest magnitudeand limited to only a few structures, interpretation of finding should be made with caution.Figure 1 depicts the differential pattern of progressive change in the thalamus and caudatesurfaces for the schizophrenia and comparison subjects. The thalamic surface regionsapproximating the ventrolateral nucleus and the central part of the caudate nucleus are markedin red and white circles, respectively. Regions where the most clear group differences occurredincluded the ventrolateral (as well as ventroanterior) nuclei of the thalamus, which receive their
Wang et al. Page 8
Biol Psychiatry. Author manuscript; available in PMC 2010 April 15.
NIH
-PA
Author M
anuscriptN
IH-P
A A
uthor Manuscript
NIH
-PA
Author M
anuscript

inputs from the dorsolateral striatum via the direct and indirect pathways through the globuspallidus, and interact with motor and premotor areas of the brain (52–56). Even before theadvent of antipsychotic medications, individuals with schizophrenia have been observed todevelop abnormal involuntary movements (e.g., tardive dyskinesia). Moreover, theventrolateral and ventroanterior nuclei of the thalamus also interact with the association,sensory and the dorsolateral prefrontal cortices (57–59). Notably, other groups have reportedprogressive dysfunction in these regions of the cerebral cortex in subjects with schizophrenia(5,13,60–64).
The above pattern of findings provide limited support for our overall hypothesis that brainstructures that receive direct, excitatory connections from the cortex are more likely to showprogressive changes, as compared to brain structures that receive indirect, inhibitoryconnections from the cortex. It is also somewhat consistent with the hypothesis that overactivityof excitatory pathways in the brain may contribute to the neural degeneration that occurs in atleast a subgroup of patients with schizophrenia (20,21), although our results indicate that allsuch brain regions are not equally affected. Detailed post-mortem studies of these structures,as well as clinical trials of neuroprotective drugs that target the process of excitotoxicity, maybe helpful in further testing of this hypothesis.
It should be noted that the relationship between neurotoxicity and gray matter volumetricreductions is unclear, since possibilities other than neuronal loss, including neuropil, watercontent and synaptic pruning, may also account for reductions in gray matter volume asdetected by imaging studies. Also, many factors could have contributed to the divergent patternof time-dependent changes as well as the unaccounted variance observed in this study, andthey include intrinsic features of these structures (i.e. plasticity), medication related changes,genetic factors and sensitivity to stress. For example, caudate nucleus may be more sensitiveto D2 blockade than hippocampus (65), and hippocampus may be more vulnerable to stressthan the other structures (66,67).
There were several important limitations to this study. First, the sample was one ofconvenience. The subjects with schizophrenia had a wide variation in duration of illness, andwere not followed under “controlled” conditions. Those who returned for follow-up may havebeen more severely affected compared with those who did not return, resulting in the selectiveretention of schizophrenia subjects with a more progressive component to their illness.However, due to the limited sample size, we would not able to test the hypothesis thatneuroanatomical progression may be a feature of a particular subgroup of schizophreniasubjects. Thus, it is possible that larger progressive changes, or progressive changes in a largernumber of deep brain nuclei and hippocampal-amygdala formation, might occur as an earlyfeature of the disease process. Second, a significant shape difference could be consistent witheither a highly localized volume loss or a change in the conformation of the structure. Atpresent, our methods cannot distinguish between these two possibilities. The changes reportedby this study could also be caused by factors other than the underlying disease (schizophrenia),such as antipsychotic medication use and the often marginalized and un-healthy life style ofthe patient group. Also, the treatment conditions during the time interval were variable betweensubjects. Thus, similar or different patterns of changes in neuroanatomical structures might beobserved in untreated patients or in patients treated with different types of drugs. The presenceof a significant time-by-treatment interaction effect on the thalamus shape (but not volume)suggests that progressive changes in particular subregions of the thalamus may also beassociated with the type of antipsychotic drug treatment received by the schizophrenia subject.We did not have data on which subject had a history of substance abuse or dependence priorto the month preceding study enrollment; hence we cannot address the question of a possiblerelationship between substance use in schizophrenia and our measures of brain pathology andprogression. Another limitation is that the MR images were collected on a relatively low-field
Wang et al. Page 9
Biol Psychiatry. Author manuscript; available in PMC 2010 April 15.
NIH
-PA
Author M
anuscriptN
IH-P
A A
uthor Manuscript
NIH
-PA
Author M
anuscript

(1.5-Tesla) scanner. As with any longitudinal study, the methods used for data collection areoften not “cutting edge” by the time the data from all time points have been collected. Higher-field (e.g., 3-Tesla) scanners may produce better contrast-to-noise ratio which may better revealchanges and differences in the changes.
To our knowledge, this study would be the first to apply the same methods for assessingprogressive changes in structure across a wide variety of deep brain nuclei and hippocampal-amygdala formation in subjects with schizophrenia, and thus, our results may be particularlyvaluable for addressing the question of whether progressive changes are characteristic of aparticular subset of these structures.
Supplementary MaterialRefer to Web version on PubMed Central for supplementary material.
AcknowledgmentsFunding for this study was provided by NIMH grants R01-MH056584, the Conte Center for the Neuroscience ofMental Disorders at Washington University School of Medicine (P20-MH071616), and P41-RR15241.
References1. Benes FM. Emerging principles of altered neural circuitry in schizophrenia. Brain Res Brain Res Rev
2000;31:251–269. [PubMed: 10719152]2. Byne W, Buchsbaum MS, Mattiace LA, Hazlett EA, Kemether E, Elhakem SL, et al. Postmortem
assessment of thalamic nuclear volumes in subjects with schizophrenia. Am J Psychiatry 2002;159:59–65. [PubMed: 11772691]
3. Altshuler LL, Casanova MF, Goldberg TE, Kleinman JE. The hippocampus and parahippocampus inschizophrenia, suicide, and control brains. Arch Gen Psychiatry 1990;47:1029–1034. [PubMed:2241505]
4. Andreasen N, Nasrallah HA, Dunn V, Olson SC, Grove WM, Ehrhardt JC, et al. Structuralabnormalities in the frontal system in schizophrenia. A magnetic resonance imaging study. Arch GenPsychiatry 1986;43:136–144. [PubMed: 3947208]
5. Zipursky RB, Lim KO, Sullivan EV, Brown BW, Pfefferbaum A. Widespread cerebral gray mattervolume deficits in schizophrenia. Arch Gen Psychiatry 1992;49:195–205. [PubMed: 1567274]
6. Ananth H, Popescu I, Critchley HD, Good CD, Frackowiak RS, Dolan RJ. Cortical and subcorticalgray matter abnormalities in schizophrenia determined through structural magnetic resonance imagingwith optimized volumetric voxel-based morphometry. Am J Psychiatry 2002;159:1497–1505.[PubMed: 12202269]
7. Csernansky JG, Wang L, Jones D, Rastogi-Cruz D, Posener JA, Heydebrand G, et al. Hippocampaldeformities in schizophrenia characterized by high dimensional brain mapping. Am J Psychiatry2002;159:2000–2006. [PubMed: 12450948]
8. Harms MP, Wang L, Mamah D, Barch DM, Thompson PA, Csernansky JG. Thalamic shapeabnormalities in individuals with schizophrenia and their nonpsychotic siblings. J Neurosci2007;27:13835–13842. [PubMed: 18077695]
9. Mamah D, Wang L, Barch D, de Erausquin GA, Gado M, Csernansky JG. Structural analysis of thebasal ganglia in schizophrenia. Schizophr Res 2007;89:59–71. [PubMed: 17071057]
10. Ettinger U, Chitnis XA, Kumari V, Fannon DG, Sumich AL, O'Ceallaigh S, et al. Magnetic resonanceimaging of the thalamus in first-episode psychosis. Am J Psychiatry 2001;158:116–118. [PubMed:11136642]
11. Nakamura M, Salisbury DF, Hirayasu Y, Bouix S, Pohl KM, Yoshida T, et al. Neocortical gray attervolume in first-episode schizophrenia and first-episode affective psychosis: a cross-sectional andlongitudinal MRI study. Biol Psychiatry 2007;62:773–783. [PubMed: 17586477]
Wang et al. Page 10
Biol Psychiatry. Author manuscript; available in PMC 2010 April 15.
NIH
-PA
Author M
anuscriptN
IH-P
A A
uthor Manuscript
NIH
-PA
Author M
anuscript

12. Ho BC, Andreasen NC, Nopoulos P, Arndt S, Magnotta V, Flaum M. Progressive structural brainabnormalities and their relationship to clinical outcome: a longitudinal magnetic resonance imagingstudy early in schizophrenia. Arch Gen Psychiatry 2003;60:585–594. [PubMed: 12796222]
13. Vidal CN, Rapoport JL, Hayashi KM, Geaga JA, Sui Y, McLemore LE, et al. Dynamically spreadingfrontal and cingulate deficits mapped in adolescents with schizophrenia. Arch Gen Psychiatry2006;63:25–34. [PubMed: 16389194]
14. van Haren NE, Hulshoff Pol HE, Schnack HG, Cahn W, Mandl RC, Collins DL, et al. Focal graymatter changes in schizophrenia across the course of the illness: a 5-year follow-up study.Neuropsychopharmacology 2007;32:2057–2066. [PubMed: 17327887]
15. Lieberman J, Chakos M, Wu H, Alvir J, Hoffman E, Robinson D, et al. Longitudinal study of brainmorphology in first episode schizophrenia. Biol Psychiatry 2001;49:487–499. [PubMed: 11257234]
16. Sim K, Cullen T, Ongur D, Heckers S. Testing models of thalamic dysfunction in schizophrenia usingneuroimaging. J Neural Transm 2006;113:907–928. [PubMed: 16252070]
17. Kandel, ER.; Schwartz, JH.; Jessell, TM. Principles of Neural Science. third ed.. Norwald,Connecticut: Appleton & Lange; 1991.
18. Carmichael ST, Price JL. Limbic connections of the orbital and medial prefrontal cortex in macaquemonkeys. J Comp Neurol 1995;363:615–641. [PubMed: 8847421]
19. Barbas H, Blatt GJ. Topographically specific hippocampal projections target functionally distinctprefrontal areas in the rhesus monkey. Hippocampus 1995;5:511–533. [PubMed: 8646279]
20. Olney JW, Newcomer JW, Farber NB. NMDA receptor hypofunction model of schizophrenia. JPsychiatr Res 1999;33:523–533. [PubMed: 10628529]
21. Humphrey WM, Dong H, Csernansky CA, Csernansky JG. Immediate and delayed hippocampalneuronal loss induced by kainic acid during early postnatal development in the rat. Brain Res DevBrain Res 2002;137:1–12.
22. First, M.; Spitzer, R.; Gibbon, M.; Williams, J. Structured Clinical Interview for DSM-IV Axis IDisorders - Patient Edition (SCID-I/P, Version 2.0). New York, NY: Biometrics ResearchDepartment, New York State Psychiatric Institute; 1995.
23. American Psychiatric Association. Diagnostic and statistical manual of mental disorders : DSM-IV.4th ed.. Washington, DC: American Psychiatric Association; 1994.
24. Rastogi-Cruz, D.; Csernansky, J. Clinical rating scales. In: Guze, S., editor. Adult Psychiatry. St.Louis: Mosby, Inc; 1997.
25. Andreasen, NC. The Scale for Assessment of Positive Symptoms (SAPS). Iowa City, Iowa: TheUniversity of Iowa; 1984.
26. Andreasen, NC. The Scale for Assessment of Negative Symptoms (SANS). Iowa City, Iowa: TheUniversity of Iowa; 1983.
27. Delawalla Z, Barch DM, Fisher Eastep JL, Thomason ES, Hanewinkel MJ, Thompson PA, et al.Factors mediating cognitive deficits and psychopathology among siblings of individuals withschizophrenia. Schizophr Bull 2006;32:525–537. [PubMed: 16714471]
28. Sugiura M, Shah NJ, Zilles K, Fink GR. Cortical representations of personally familiar objects andplaces: functional organization of the human posterior cingulate cortex. J Cogn Neurosci2005;17:183–198. [PubMed: 15811232]
29. Botvinick MM, Braver TS, Barch DM, Carter CS, Cohen JD. Conflict monitoring and cognitivecontrol. Psychol Rev 2001;108:624–652. [PubMed: 11488380]
30. Carlson S, Martinkauppi S, Rama P, Salli E, Korvenoja A, Aronen HJ. Distribution of corticalactivation during visuospatial n-back tasks as revealed by functional magnetic resonance imaging.Cereb Cortex 1998;8:743–752. [PubMed: 9863701]
31. Hirono N, Mori E, Ishii K, Ikejiri Y, Imamura T, Shimomura T, et al. Hypofunction in the posteriorcingulate gyrus correlates with disorientation for time and place in Alzheimer's disease. J NeurolNeurosurg Psychiatry 1998;64:552–554. [PubMed: 9576555]
32. Botvinick MM, Braver TS, Barch DM, Carter CS, Cohen JC. Conflict monitoring and cognitivecontrol. Psychological Review 2001;108:624–652. [PubMed: 11488380]
33. Brown JW, Braver TS. Learned predictions of error likelihood in the anterior cingulate cortex. Science2005;307:1118–1121. [PubMed: 15718473]
Wang et al. Page 11
Biol Psychiatry. Author manuscript; available in PMC 2010 April 15.
NIH
-PA
Author M
anuscriptN
IH-P
A A
uthor Manuscript
NIH
-PA
Author M
anuscript
34. Wechsler, D. Wechsler Adult Intelligence Scale. Third ed. San Antonio: The PsychologicalCorporation; 1997.
35. Cornblatt BA, Risch NJ, Faris G, Friedman D, Erlenmeyer-Kimling L. The Continuous PerformanceTest, identical pairs version (CPT-IP): I. New findings about sustained attention in normal families.Psychiatry Research 1988;26:223–238. [PubMed: 3237915]
36. Venkatesan R, Haacke E. Role of high resolution in magnetic resonance (MR) imaging: Applicationsfor MR angiography, intracranial T1-weighted imaging, and image interpolation. Int J Imaging SystTechnol 1997;8:529–543.
37. Buckner RL, Head D, Parker J, Fotenos AF, Marcus D, Morris JC, et al. A unified approach formorphometric and functional data analysis in young, old, and demented adults using automated atlas-based head size normalization: reliability and validation against manual measurement of totalintracranial volume. Neuroimage 2004;23:724–738. [PubMed: 15488422]
38. Csernansky JG, Wang L, Joshi SC, Ratnanather JT, Miller MI. Computational anatomy andneuropsychiatric disease: probabilistic assessment of variation and statistical inference of groupdifference, hemispheric asymmetry, and time-dependent change. Neuroimage 2004;23:S56–S68.[PubMed: 15501101]
39. Haller JW, Banerjee A, Christensen GE, Gado M, Joshi S, Miller MI, et al. Three-dimensionalhippocampal MR morphometry with high-dimensional transformation of a neuroanatomic atlas.Radiology 1997;202:504–510. [PubMed: 9015081]
40. Csernansky JG, Schindler MK, Splinter NR, Wang L, Gado M, Selemon LD, et al. Abnormalities ofthalamic volume and shape in schizophrenia. Am J Psychiatry 2004;161:896–902. [PubMed:15121656]
41. Wang L, Lee DY, Bailey E, Hartlein JM, Gado MH, Miller MI, et al. Validity of large-deformationhigh dimensional brain mapping of the basal ganglia in adults with Tourette syndrome. PsychiatryRes 2007;154:181–190. [PubMed: 17289354]
42. Freeborough PA, Woods RP, Fox NC. Accurate registration of serial 3D MR brain images and itsapplication to visualizing change in neurodegenerative disorders. J Comput Assist Tomogr1996;20:1012–1022. [PubMed: 8933812]
43. Buckner RL, Snyder AZ, Shannon BJ, LaRossa G, Sachs R, Fotenos AF, et al. Molecular, structural,and functional characterization of Alzheimer's disease: evidence for a relationship between defaultactivity, amyloid, and memory. J Neurosci 2005;25:7709–7717. [PubMed: 16120771]
44. Freeborough PA, Fox NC. Modeling brain deformations in Alzheimer disease by fluid registrationof serial 3D MR images. J Comput Assist Tomogr 1998;22:838–843. [PubMed: 9754126]
45. Fox NC, Crum WR, Scahill RI, Stevens JM, Janssen JC, Rossor MN. Imaging of onset and progressionof Alzheimer's disease with voxel- compression mapping of serial magnetic resonance images. Lancet2001;358:201–205. [PubMed: 11476837]
46. Chan D, Fox NC, Jenkins R, Scahill RI, Crum WR, Rossor MN. Rates of global and regional cerebralatrophy in AD and frontotemporal dementia. Neurology 2001;57:1756–1763. [PubMed: 11723259]
47. Llabre MM, Spitzer SB, Saab PG, Ironson GH, Schneiderman N. The reliability and specificity ofdelta versus residualized change as measures of cardiovascular reactivity to behavioral challenges.Psychophysiology 1991;28:701–711. [PubMed: 1816598]
48. Lieberman JA, Tollefson GD, Charles C, Zipursky R, Sharma T, Kahn RS, et al. Antipsychotic drugeffects on brain morphology in first-episode psychosis. Arch Gen Psychiatry 2005;62:361–370.[PubMed: 15809403]
49. Moore GJ, Bebchuk JM, Wilds IB, Chen G, Manji HK. Lithium-induced increase in human braingrey matter. Lancet 2000;356:1241–1242. [PubMed: 11072948]
50. Csernansky JG, Joshic S, Wang L, Haller JW, Gado M, Miller JP, et al. Hippocampal morphometryin schizophrenia by high dimensional brain mapping. Proc Natl Acad Sci U S A 1998;95:11406–11411. [PubMed: 9736749]
51. Wang L, Joshi SC, Miller MI, Csernansky JG. Quantifying Hippocampal Asymmetry inSchizophrenia. Schizophrenia Research 2001;49:170.
52. Mink JW, Thach WT. Basal ganglia motor control. III. Pallidal ablation: normal reaction time, musclecocontraction, and slow movement. J Neurophysiol 1991;65:330–351. [PubMed: 2016644]
Wang et al. Page 12
Biol Psychiatry. Author manuscript; available in PMC 2010 April 15.
NIH
-PA
Author M
anuscriptN
IH-P
A A
uthor Manuscript
NIH
-PA
Author M
anuscript
53. Mink JW, Thach WT. Basal ganglia motor control. II. Late pallidal timing relative to movement onsetand inconsistent pallidal coding of movement parameters. J Neurophysiol 1991;65:301–329.[PubMed: 2016643]
54. Mink JW, Thach WT. Basal ganglia motor control. I. Nonexclusive relation of pallidal discharge tofive movement modes. J Neurophysiol 1991;65:273–300. [PubMed: 2016642]
55. Mink JW, Thach WT. Preferential relation of pallidal neurons to ballistic movements. Brain Res1987;417:393–398. [PubMed: 3651822]
56. McFarland NR, Haber SN. Organization of thalamostriatal terminals from the ventral motor nucleiin the macaque. J Comp Neurol 2001;429:321–336. [PubMed: 11116223]
57. Haber SN, Kim KS, Mailly P, Calzavara R. Reward-related cortical inputs define a large striatalregion in primates that interface with associative cortical connections, providing a substrate forincentive-based learning. J Neurosci 2006;26:8368–8376. [PubMed: 16899732]
58. Calzavara R, Mailly P, Haber SN. Relationship between the corticostriatal terminals from areas 9 and46, and those from area 8A, dorsal and rostral premotor cortex and area 24c: an anatomical substratefor cognition to action. Eur J Neurosci 2007;26:2005–2024. [PubMed: 17892479]
59. McFarland NR, Haber SN. Convergent inputs from thalamic motor nuclei and frontal cortical areasto the dorsal striatum in the primate. J Neurosci 2000;20:3798–3813. [PubMed: 10804220]
60. Berman KF, Illowsky BP, Weinberger DR. Physiological dysfunction of dorsolateral prefrontal cortexin schizophrenia. IV. Further evidence for regional and behavioral specificity. Arch Gen Psychiatry1988;45:616–622. [PubMed: 3382321]
61. Pantelis C, Harvey CA, Plant G, Fossey E, Maruff P, Stuart GW, et al. Relationship of behaviouraland symptomatic syndromes in schizophrenia to spatial working memory and attentional set-shiftingability. Psychol Med 2004;34:693–703. [PubMed: 15099423]
62. Ohrmann P, Siegmund A, Suslow T, Spitzberg K, Kersting A, Arolt V, et al. Evidence forglutamatergic neuronal dysfunction in the prefrontal cortex in chronic but not in first-episode patientswith schizophrenia: a proton magnetic resonance spectroscopy study. Schizophr Res 2005;73:153–157. [PubMed: 15653258]
63. Selemon LD, Kleinman JE, Herman MM, Goldman-Rakic PS. Smaller frontal gray matter volumein postmortem schizophrenic brains. American Journal of Psychiatry 2002;159:1983–1991.[PubMed: 12450946]
64. Mendrek A, Kiehl KA, Smith AM, Irwin D, Forster BB, Liddle PF. Dysfunction of a distributedneural circuitry in schizophrenia patients during a working-memory performance. Psychol Med2005;35:187–196. [PubMed: 15841676]
65. Kohler C, Karlsson-Boethius G. In vivo labelling of rat brain dopamine D-2 receptors. Stereoselectiveblockade by the D-2 antagonist raclopride and its enantiomer of 3H-spiperone, 3H-N,N-propylnorapomorphine and 3H-raclopride binding in the rat brain. J Neural Transm 1988;73:87–100.[PubMed: 2974879]
66. Patel PD, Lopez JF, Lyons DM, Burke S, Wallace M, Schatzberg AF. Glucocorticoid andmineralocorticoid receptor mRNA expression in squirrel monkey brain. J Psychiatr Res2000;34:383–392. [PubMed: 11165305]
67. Pryce CR, Feldon J, Fuchs E, Knuesel I, Oertle T, Sengstag C, et al. Postnatal ontogeny of hippocampalexpression of the mineralocorticoid and glucocorticoid receptors in the common marmoset monkey.Eur J Neurosci 2005;21:1521–1535. [PubMed: 15845080]
68. Mai, JK.; Assheuer, J.; Paxinos, G. Atlas of the Human Brain. San Diego: Academic Press; 1997.
Wang et al. Page 13
Biol Psychiatry. Author manuscript; available in PMC 2010 April 15.
NIH
-PA
Author M
anuscriptN
IH-P
A A
uthor Manuscript
NIH
-PA
Author M
anuscript

Figure 1. Caudate and Thalamus Surface Deformations in Individuals with Schizophrenia andComparison SubjectsLeft column: Longitudinal change for the schizophrenia group, lateral views of the left andright caudate and thalamus surfaces. Middle column: Longitudinal change for the comparisongroup, lateral views of the left and right caudate and thalamus surfaces. Flame scale reflect t-values, and cooler colors (t<0) indicate inward deformation in time of the surface. Circlesindicate the location on the surfaces where the longitudinal changes were different betweenthe two subject groups. The red circles mark the thalamic surfaces approximating thedorsolateral nucleus. The white circles mark the central part of the caudate nucleus surface.Right column: Schematic of the major thalamic nuclei as projected onto the template thalamicsurface, based on Mai, Assheuer, and Paxinos (68).
Wang et al. Page 14
Biol Psychiatry. Author manuscript; available in PMC 2010 April 15.
NIH
-PA
Author M
anuscriptN
IH-P
A A
uthor Manuscript
NIH
-PA
Author M
anuscript
NIH
-PA
Author M
anuscriptN
IH-P
A A
uthor Manuscript
NIH
-PA
Author M
anuscript
Wang et al. Page 15
Table 1
Subject Characteristics: mean (SD [range]), t-test or chi-square statistics are shown where appropriate.
Variables Schizophrenia Subjects Comparison Subjects Difference
N 56 62 -
Age at baseline (yr) 36.6 (12.9 [19.1–60.4]) 36.2 (14.5 [14.1–65.7]) p=0.89
Gender (Male/Female) 37/19 34/28 p=0.21
Race (Caucasian/African-American/Other) 27/28/1 43/17/2 p=0.041
Parental SES 3.4 (1.2 [1–5]) 2.7 (0.8 [1–4]) p=0.046
Age of Illness Onset (yr) 23.3 (7.1 [5.8–40.2]) N/A -
Duration of Illness (yr) 15.7 (13.8 [0.1–44.9]) N/A -
Global SAPS Score 4.4 (3.0 [0–10]) N/A -
Global SANS Score 9.0 (4.3 [1–20]) N/A -
Scan interval (years) 2.20 (0.76 [0.77 – 5.28]) 2.24 (0.58 [1.18 – 5.25]) p=0.73
Biol Psychiatry. Author manuscript; available in PMC 2010 April 15.

NIH
-PA
Author M
anuscriptN
IH-P
A A
uthor Manuscript
NIH
-PA
Author M
anuscript
Wang et al. Page 16
Tabl
e 2
Mea
ns (S
D) z
-sco
res o
f psy
chop
atho
logy
and
cog
nitiv
e m
easu
res a
t bas
elin
e an
d fo
llow
-up
The p
erce
ntag
e cha
nge w
as ca
lcul
ated
as 1
00*(
follo
wup
–bas
elin
e)/a
bs(b
asel
ine)
. The
effe
cts o
f gro
up (a
t bas
elin
e), t
ime a
nd g
roup
-by-
time i
nter
actio
n w
ere
com
pute
d vi
a a
repe
ated
-mea
sure
s mix
ed m
odel
.
Mea
n (s
td)
Schi
zoph
reni
aC
ompa
riso
n
Bas
elin
eFo
llow
-up
Cha
nge
Bas
elin
eFo
llow
-up
Cha
nge
Posi
tive
Sym
ptom
s0.
27 (0
.91)
0.39
(1.0
7)46
.0%
-
Neg
ativ
e Sy
mpt
oms
0.35
(0.7
1)0.
11 (0
.72)
!69.
4%a
-
Dis
orga
nize
d Th
ough
t0.
24 (0
.70)
0.42
(0.8
4)74
.7%
-
Glo
bal S
APS
4.43
(3.0
2)5.
24 (4
.19)
18.2
%-
Glo
bal S
AN
S8.
96 (4
.30)
7.67
(4.6
4)!1
4.5%
-
Wor
king
Mem
ory
!0.4
7 (0
.73)
b!0
.49
(0.6
5)!4
.7%
c0.
41 (0
.71)
0.58
(0.6
9)39
.7%
a
Epis
odic
Mem
ory
!0.6
6 (0
.67)
b!0
.71
(0.6
8)!7
.7%
0.59
(0.6
8)0.
52 (0
.71)
!12.
1%
Exec
utiv
e Fu
nctio
n!0
.55
(0.6
7)b
!0.3
8 (0
.78)
30.5
%a
0.48
(0.5
2)0.
63 (0
.57)
32.9
%a
Cry
stal
lized
IQ!0
.51
(0.9
6)b
!0.5
5 (0
.91)
!6.6
%0.
45 (0
.81)
0.52
(0.7
9)15
.2%
a Tim
e ef
fect
p<0
.05.
b Bas
elin
e gr
oup
diff
eren
ce p
<0.0
001.
c Gro
up–b
y–tim
e in
tera
ctio
n p<
0.05
.
Biol Psychiatry. Author manuscript; available in PMC 2010 April 15.

NIH
-PA
Author M
anuscriptN
IH-P
A A
uthor Manuscript
NIH
-PA
Author M
anuscript
Wang et al. Page 17
Tabl
e 3
Mea
n (S
D) o
f vol
umes
at b
asel
ine a
nd fo
llow
-up:
thal
amus
, hip
poca
mpu
s, am
ygda
la, n
ucle
us a
ccum
bens
, cau
date
nuc
leus
, glo
bus p
allid
us a
ndpu
tam
en
Als
o lis
ted
are
perc
ent c
hang
es o
f eac
h st
ruct
ural
vol
ume
acro
ss ti
me
for e
ach
grou
p. R
esul
ts o
f sta
tistic
al c
ompa
rison
of v
olum
e di
ffer
ence
s and
vol
ume
chan
ges c
an b
e fo
und
in T
able
4 a
nd T
able
5.
Stru
ctur
al V
olum
e m
ean
(std
) mm
3Sc
hizo
phre
nia
Com
pari
son
Bas
elin
eFo
llow
-up
Cha
nge
Bas
elin
eFo
llow
-up
Cha
nge
Thal
amus
L72
41 (8
51)
7122
(891
)!1
.64%
7573
(687
)75
36 (7
29)
!0.4
9%
R73
80 (9
34)
7296
(991
)!1
.14%
7722
(704
)77
02 (7
37)
!0.2
5%
Hip
poca
mpu
sL
2312
(306
)22
71 (3
06)
!1.7
5%24
02 (3
50)
2388
(347
)!0
.58%
R27
35 (4
24)
2698
(414
)!1
.35%
2808
(400
)28
09 (4
27)
0.06
%
Am
ygda
laL
1512
(248
)14
66 (2
43)
!3.0
4%15
19 (1
94)
1489
(197
)!2
.00%
R15
79 (2
66)
1531
(260
)!3
.01%
1700
(254
)16
67 (2
51)
!1.9
2%
Cau
date
Nuc
leus
L33
54 (3
91)
3301
(429
)!1
.58%
3418
(414
)34
37 (3
85)
0.54
%
R32
89 (3
81)
3229
(424
)!1
.82%
3391
(424
)33
94 (4
11)
0.09
%
Nuc
leus
Acc
umbe
nsL
402
(69)
396
(75)
!1.4
9%41
4 (5
5)41
7 (6
0)0.
80%
R 4
10 (6
5) 4
05 (7
1)!1
.12%
407
(56)
410
(62)
0.68
%
Puta
men
L50
39 (7
06)
5058
(707
) 0
.38%
5026
(672
)50
64 (6
82)
0.76
%
R49
21 (7
50)
4911
(765
)!0
.20%
4914
(645
)49
37 (6
76)
0.48
%
Glo
bus P
allid
usL
1669
(227
)16
63 (2
49)
!0.3
3%16
71 (1
84)
1655
(200
)!0
.96%
R16
72 (2
37)
1672
(251
)!0
.04%
1679
(204
)16
71 (2
13)
-0.4
5%
Biol Psychiatry. Author manuscript; available in PMC 2010 April 15.

NIH
-PA
Author M
anuscriptN
IH-P
A A
uthor Manuscript
NIH
-PA
Author M
anuscript
Wang et al. Page 18
Tabl
e 4
Stat
istic
al c
ompa
riso
ns o
f eac
h of
the
follo
win
g st
ruct
ures
: tha
lam
us, h
ippo
cam
pus,
amyg
dala
, nuc
leus
acc
umbe
ns, c
auda
te n
ucle
us, g
lobu
spa
llidu
s and
put
amen
, with
no
cova
riat
es
Sign
ifica
nt (p
<0.0
5) e
ffec
ts a
re sh
own
in b
old.
F (d
f1,d
f2) p
Mea
sure
Bas
elin
eL
ongi
tudi
nal
grou
p ef
fect
grou
p ef
fect
time
effe
ctgr
oup–
by–t
ime
inte
ract
ion
Thal
amus
Vol
ume
2.79
(2,1
15) 0
.066
2.2
(4,1
12) 0
.074
14.5
5 (1
,115
) 0.0
002
3.86
(1, 1
15) 0
.052
Shap
e2.
54 (1
5,10
2) 0
.003
12.
97 (1
5,10
1) 0
.000
65.
27 (1
5,10
1) <
0.00
011.
91 (1
5,10
1) 0
.031
Hip
poca
mpu
sV
olum
e1.
35 (2
,113
) 0.2
61.
15 (4
,110
) 0.3
48.
04 (1
,113
) 0.0
054
1.25
(1,1
13) 0
.27
Shap
e0.
95 (1
5,10
0) 0
.52
0.93
(15,
99) 0
.53
4.71
(15,
99) <
.000
12.
22 (1
5,99
) 0.0
10
Am
ygda
laV
olum
e4.
15 (2
,113
) 0.0
182.
67 (4
,110
) 0.0
3632
.2 (1
,113
) <0.
0001
0.18
(1,1
13) 0
.68
Shap
e2.
54 (1
5,10
0) 0
.003
12.
49 (1
5,99
) 0.0
037
3.77
(15,
99) <
0.00
010.
47 (1
5,99
) 0.9
5
Cau
date
Nuc
leus
Vol
ume
1.39
(2,1
15) 0
.25
2.1
(4,1
12) 0
.086
2.14
(1,1
15) 0
.15
5.23
(1,1
15) 0
.024
Shap
e2
(15,
102)
0.0
222.
04 (1
5,10
1) 0
.019
2.8
(15,
101)
0.0
011
1.78
(15,
101)
0.0
47
Puta
men
Vol
ume
0.01
(2,1
15) 0
.99
0.36
(4,1
12) 0
.83
1.21
(1,1
15) 0
.27
1.1
(1,1
15) 0
.30
Shap
e2.
14 (1
5,10
2) 0
.013
2.16
(15,
101)
0.0
134.
09 (1
5,10
1) <
0.00
011.
09 (1
5,10
1) 0
.38
Nuc
leus
Acc
umbe
nsV
olum
e1.
67 (2
,115
) 0.1
91.
55 (4
,112
) 0.1
90.
1 (1
,115
) 0.7
62.
74 (1
,115
) 0.1
0
Shap
e1.
68 (1
5,10
2) 0
.066
1.48
(15,
101)
0.1
32.
53 (1
5,10
1) 0
.003
22.
23 (1
5,10
1) 0
.009
6
Glo
bus P
allid
usV
olum
e0.
02 (2
,115
) 0.9
80.
23 (4
,112
) 0.9
22.
3 (1
,115
) 0.1
30.
79 (1
,115
) 0.3
7
Shap
e1.
82 (1
5,10
2) 0
.042
1.85
(15,
101)
0.0
371.
5 (1
5,10
1) 0
.12
0.71
(15,
101)
0.7
7
Biol Psychiatry. Author manuscript; available in PMC 2010 April 15.

NIH
-PA
Author M
anuscriptN
IH-P
A A
uthor Manuscript
NIH
-PA
Author M
anuscript
Wang et al. Page 19
Tabl
e 5
Stat
istic
al c
ompa
riso
ns o
f eac
h of
the
follo
win
g st
ruct
ures
: tha
lam
us, h
ippo
cam
pus,
amyg
dala
, nuc
leus
acc
umbe
ns, c
auda
te n
ucle
us, g
lobu
spa
llidu
s and
put
amen
, with
atla
s sca
ling
fact
or a
t bas
elin
e as
a c
ovar
iate
Sign
ifica
nt (p
<0.0
5) e
ffec
ts a
re in
bol
d.
F (d
f1, d
f2) p
Mea
sure
Bas
elin
eL
ongi
tudi
nal
grou
p ef
fect
grou
p ef
fect
time
effe
ctgr
oup–
by–t
ime
inte
ract
ion
Thal
amus
Vol
ume
1.5
(2,1
09) 0
.23
1.22
(4,1
06) 0
.31
0.05
(1,1
09) 0
.83
2.7
(1,1
09) 0
.10
Shap
e2.
58 (1
5,96
) 0.0
027
3.07
(15,
95) 0
.000
50.
89 (1
5,95
) 0.5
82.
03 (1
5,95
) 0.0
21
Hip
poca
mpu
sV
olum
e0.
41 (2
,107
) 0.6
70.
46 (4
,104
) 0.7
60.
46 (4
,104
) 0.7
60.
96 (1
,107
) 0.3
3
Shap
e0.
66 (1
5,94
) 0.8
20.
63 (1
5,93
) 0.8
51.
06 (1
5,93
) 0.4
12.
2 (1
5,93
) 0.0
11
Am
ygda
laV
olum
e3.
79 (2
,107
) 0.0
262.
75 (4
,104
) 0.0
320
(1,1
07) 0
.96
0.06
(1,1
07) 0
.81
Shap
e2.
26 (1
5,94
) 0.0
092.
24 (1
5,93
) 0.0
099
1.18
(15,
93) 0
.30
0.51
(15,
93) 0
.93
Cau
date
Nuc
leus
Vol
ume
0.56
(2,1
09) 0
.57
1.47
(4,1
06) 0
.22
2.2
(1,1
09) 0
.14
5.48
(1,1
09) 0
.021
Shap
e1.
65 (1
5,96
) 0.0
741.
67 (1
5,95
) 0.0
700.
51 (1
5,95
) 0.9
31.
79 (1
5,95
) 0.0
46
Puta
men
Vol
ume
0.82
(2,1
09) 0
.44
0.78
(4,1
06) 0
.54
0.35
(1,1
09) 0
.56
0.84
(1,1
09) 0
.36
Shap
e1.
72 (1
5,96
) 0.0
601.
72 (1
5,95
) 0.0
601.
1 (1
5,95
) 0.3
61.
05 (1
5,95
) 0.4
2
Nuc
leus
Acc
umbe
nsV
olum
e0.
78 (2
,109
) 0.4
61.
16 (4
,106
) 0.3
30.
85 (1
,109
) 0.3
63.
08 (1
,109
) 0.0
82
Shap
e1.
26 (1
5,96
) 0.2
41.
07 (1
5,95
) 0.4
01.
26 (1
5,95
) 0.2
41.
73 (1
5,95
) 0.0
59
Glo
bus P
allid
usV
olum
e0.
63 (2
,109
) 0.5
40.
61 (4
,106
) 0.6
51.
49 (1
,109
) 0.2
31.
44 (1
,109
) 0.2
3
Shap
e1.
41 (1
5,96
) 0.1
61.
38 (1
5,95
) 0.1
71.
94 (1
5,95
) 0.0
280.
56 (1
5,95
) 0.9
0
Biol Psychiatry. Author manuscript; available in PMC 2010 April 15.