nih public access a , and kinam park usa sustained drug ... · microparticles and to examine...
TRANSCRIPT

Microparticles Produced by the Hydrogel Template Method forSustained Drug Delivery
Ying Lua, Michael Sturekb, and Kinam Parka,c,*
aDepartment of Industrial and Physical Pharmacy, Purdue University, West Lafayette, IN 47906,USAbDepartment of Cellular & Integrative Physiology, Indiana University School of Medicine,Indianapolis, IN 46202, U.S.AcDepartment of Biomedical Engineering, Purdue University, West Lafayette, IN 47906, USA
AbstractPolymeric microparticles have been used widely for sustained drug delivery. Current methods ofmicroparticle production can be improved by making homogeneous particles in size and shape,increasing the drug loading, and controlling the initial burst release. In the current study, thehydrogel template method was used to produce homogeneous poly(lactide-co-glycolide) (PLGA)microparticles and to examine formulation and process-related parameters. Poly(vinyl alcohol)(PVA) was used to make hydrogel templates. The parameters examined include PVA molecularweight, type of PLGA (as characterized by lactide content, inherent viscosity), polymerconcentration, drug concentration and composition of solvent system. Three model compoundsstudied were risperidone, methylprednisolone acetate and paclitaxel. The ability of the hydrogeltemplate method to produce microparticles with good conformity to template was dependent onmolecular weight of PVA and viscosity of the PLGA solution. Drug loading and encapsulationefficiency were found to be influenced by PLGA lactide content, polymer concentration andcomposition of the solvent system. The drug loading and encapsulation efficiency were 28.7% and82% for risperidone, 31.5% and 90% for methylprednisolone acetate, and 32.2 % and 92 % forpaclitaxel, respectively. For all three drugs, release was sustained for weeks, and the in vitrorelease profile of risperidone was comparable to that of microparticles prepared using theconventional emulsion method. The hydrogel template method provides a new approach ofmanipulating microparticles.
KeywordsPLGA Microparticle; PVA template method; controlled release; risperidone; methylprednisoloneacetate; paclitaxel
1. IntroductionPolymeric microparticle drug delivery systems have been widely explored for controlleddelivery of active pharmaceutical ingredients. Microparticles provide several advantages asdrug delivery vehicles, such as protection of encapsulated drug from unfavorableenvironmental conditions and ability to control drug release profile for a specified period oftime (1). In particular, the potential to control drug release profile over an extended period of
Address correspondence: Kinam Park, Purdue University, Departments of Pharmaceutics and Biomedical Engineering, WestLafayette, IN 47907, [email protected].
NIH Public AccessAuthor ManuscriptInt J Pharm. Author manuscript; available in PMC 2015 January 30.
Published in final edited form as:Int J Pharm. 2014 January 30; 461(0): 258–269. doi:10.1016/j.ijpharm.2013.11.058.
NIH
-PA Author Manuscript
NIH
-PA Author Manuscript
NIH
-PA Author Manuscript

time is one of the most desirable attributes (2). Suitable drug candidates that may benefitgreatly from such controlled drug delivery systems based on polymeric microparticlesinclude those that have a broad therapeutic window, require a low daily dose and are usedfor the long-term treatment of disease.
Poly(lactide-co-glycolide) (PLGA) is probably the most extensively used polymer inmicroparticle drug delivery systems (1). This copolymer of lactide and glycolide degrade bysimple hydrolysis when exposed to an aqueous environment such as inside the human body.PLGA has been used in a host of drug products approved by Food and Drug Administration(FDA), such as Zoladex Depot® (goserelin), Lurpon Depot® (leuprolide), SandostatinLAR® Depot (octreotide acetate), Nutropin Depot® (somatotropin), Trelstar® (triptorelin),Somatulin® Depot (lanreotide), Risperidal® Consta® (risperidone), Vivitrol® (naltrxone)and Bydureon® (exenatide). PLGAs are available at various molecular weights (or intrinsicviscosities) and lactide/glycolide ratios with either ester end-caps or free carboxylic acidend-caps. The properties of PLGA have been shown to influence important microparticlecharacteristics, such as the amount of drug loading, loading efficiency and drug release bothin vitro and in vivo (3–5). Previous studies have demonstrated that the rate of hydrolysis, andtherefore, drug release is heavily dependent on the PLGA molecular weight and monomercomposition. Consequently, it is possible to design PLGA-based microparticle drug deliverysystems with tailored polymer degradation characteristics and release patterns by varying thePLGA composition.
In addition to polymer composition and properties, there are other formulation- and process-related parameters that may affect microparticle performance. Formulation-related factorsinclude type of organic solvent used, concentration of polymer used, and drug-polymerinteractions (3, 6, 7). Various studies have shown that these formulation-related factorsaffect drug encapsulation efficiency and drug distribution within polymeric matrix, which inturn influences the initial burst release. The initial burst release is one of the majorchallenges in developing drug-encapsulated microparticle systems. The release of a largebolus of drugs before microparticles reach a steady state release is both therapeuticallyundesirable and economically ineffective. Therefore, the ability to control and limit theinitial burst release is highly sought-after and extensively studied. In addition, there areprocess-related parameters that can affect the performance of microparticles produced usingthese methods. Currently, spray drying and emulsion-based methods are well-establishedand most commonly used to prepare drug-loaded PLGA microparticles. Process-relatedparameters in these methods that influence drug-loaded microparticle characteristics includethe ratio of dispersed phase to continuous phase and the rate of solvent removal/extraction.The factors outlined above and their effects on microparticle performance, however, havebeen mostly studied in the emulsion-based methods only.
Although emulsion-based and spray-drying methods are widely used, their applicability isrestricted by a number of limitations. Techniques such as spray drying may be unsuitable forsubstances sensitive to heating and mechanical shear of atomization, which narrows the fieldof applicability for this technique (8). Low product yield due to deposition of materials onthe interior surface of drying chamber is yet another common concern for spray drying. Forboth spray drying and emulsion-based methods particle formation is random and results inmicroparticles with broad size distribution (9). Microparticle size is an important factor thataffects the choice of administration route (10–12), drug encapsulation within themicroparticle and therefore drug release profile from the delivery vehicle (13–15). Anothercommon problem with spray drying and emulsion-based methods is low drug loading, oftenwith an average of less than 10% (16–18). Certainly there is room for improvement inmicroencapsulation techniques.
Lu et al. Page 2
Int J Pharm. Author manuscript; available in PMC 2015 January 30.
NIH
-PA Author Manuscript
NIH
-PA Author Manuscript
NIH
-PA Author Manuscript
To address limitations associated with conventional methods of microparticle preparation,we have developed a microfabrication technique for preparation of microparticles. Theapproach utilizes the unique properties of physical gels that can undergo sol-gel phasetransitions or water-soluble polymers that do not dissolve in organic solvents. The approachis collectively called the hydrogel template method (19). The hydrogel template approachallows a more precise control of microparticle size and shape, which translates into narrowsize distribution and increased microparticle homogeneity. In addition, the method providesflexibility in producing microparticles of various desirable size ranges. Anotherimprovement over existing methods is the possibility of incorporating a higher amount ofdrug into the polymeric matrix, since the particle formation process is no longer random,thereby allowing more control over drug encapsulation. The hydrogel template approachdoes not require the application of excessive heat, mechanical force or any harsh treatmentconditions. It is a simple and fast process.
Early method development of the hydrogel template technology and initial study on theeffect of the particle size on drug release were discussed in previous publications (19, 20).The main objective of the present study is to evaluate the hydrogel template method forproducing drug-loaded polymeric microparticles, with the goal of gaining a betterunderstanding of this method that will ultimately aid in method optimization. Three drugswith different physicochemical properties were used as model compounds in this study. Thedata obtained were compared and contrasted to microparticles prepared using theconventional emulsion-based technique.
2. Materials and methods2.1 Materials
Risperidone (RIS) and methylprednisolone acetate (MPA) were purchase from Sigma-Aldrich (St. Louis, MO), paclitaxel (PTX) was supplied by Samyang Genex Corporation(Republic of Korea). Poly(D,L-lactide-co-glycolide) (PLGA) 5050, 6535, 7525 and 8515(corresponding to lactide:glycolide ratio of 50:50, 65:35, 75:25 and 85:15, respectively)were purchased from Lactel (Pelham, AL). Poly(vinyl alcohol) (PVA, 87~89%, 96%,98~99% and >99% hydrolyzed) of various typical molecular weight was purchased fromSigma-Aldrich (St. Louis, MO). Benzyl alcohol (BA, analytical reagent grade), ethyl acetate(EA, analytical reagent grade) and methylene chloride (DCM, analytical grade) werepurchased from VWR (Batavia, IL). All other chemicals or solvents were of reagent oranalytical grade and used as received without further purification.
2.2 Preparation of hydrogel templatesThe basic approach to producing gelatin-based templates containing an array of cylindricalposts with pre-determined diameters and heights was described before (19, 20). A similarmethod was adopted to produce templates in this particular study with some modifications.A silicon wafer master template was constructed by spin-coating with SU8 2010 photoresist(Microchem, Cambridge, MA) at 3500 rpm for 30 s and baking, followed by ultravioletexposure radiation through a mask containing an array of circular patterns 10 μm indiameter and subsequent developing and drying procedures according to manufacturer’sinstructions. The master template thus fabricated contained cylindrical wells 10 μm indiameter and 10 μm in height. Next, the master template was coated with Sylgard 184elastomer (Dow Corning, Elizabethtown, KY) consisting of approximately 50 g of pre-polymer and 5 g curing agent in a flat-bottomed ceramic dish and cured at 70 °C for 2 hours.The polydimethylsiloxane (PDMS) template was removed carefully from the silicon wafermaster template and flushed with ethanol, followed by drying with a nitrogen stream. Thisintermediate PDMS template was used repeatedly in subsequent experiments to produce
Lu et al. Page 3
Int J Pharm. Author manuscript; available in PMC 2015 January 30.
NIH
-PA Author Manuscript
NIH
-PA Author Manuscript
NIH
-PA Author Manuscript
templates for making drug-loaded PLGA microparticles. PVA was dissolved at aconcentration of 4% (w/v) in a mixture of deionized water and ethanol (40:60 v/v) withconstant stirring and heating. The resulting solution was used to evenly coat the surface ofPDMS intermediate template. After solvent evaporation and template solidification, thePVA template was gently peeled off the PDMS template and stored in a cool, dry place untilready to use.
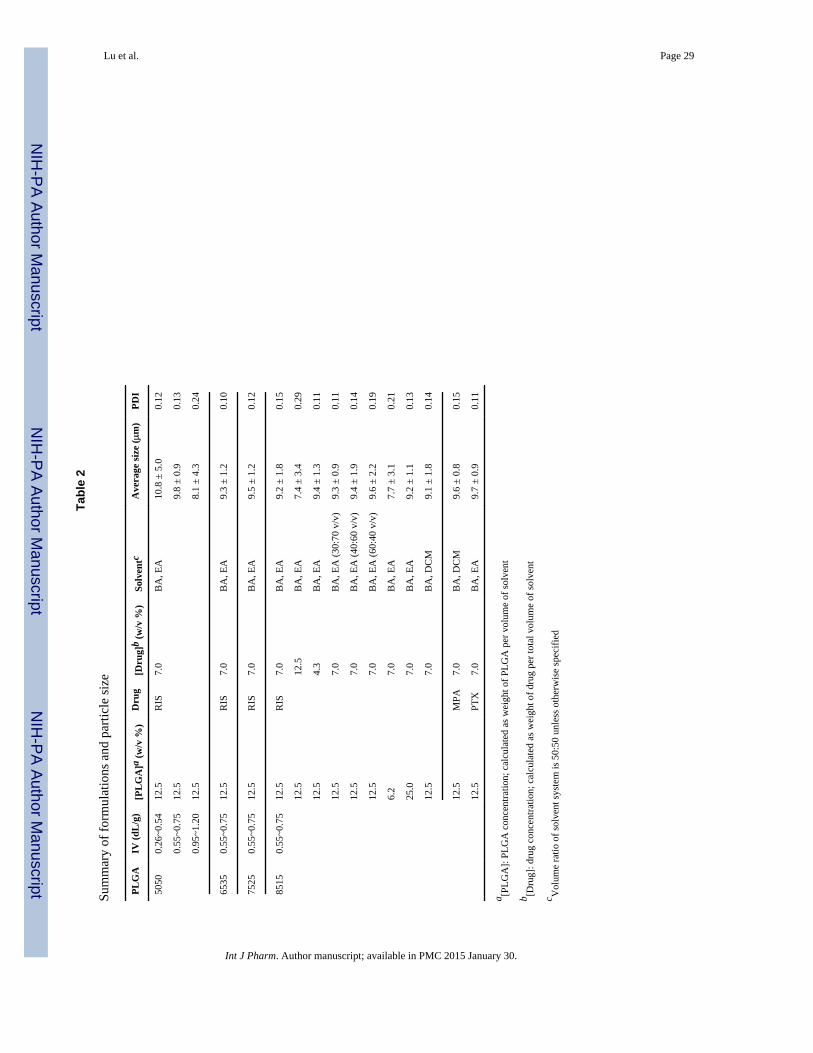
2.3 Preparation of polymer-drug solutionsRIS, MPA and PTX were chosen as model poorly water-soluble compounds in this study.The properties of these compounds are presented in Table 1. The compounds were dissolvedwith the selected type of PLGA polymer in a mixture of BA and EA or DCM. The types ofPLGA evaluated varied by lactide-to-glycolide ratio (L:G) and intrinsic viscosity (IV). Otherparameters that varied were the concentration of PLGA in solution, drug concentration andratio of BA to EA. A summary of the composition of drug solutions used in this study isprovided in Table 2.
2.4 Preparation of drug-loaded microparticlesApproximately 60 μl of polymer-drug solution was deposited along one edge of each PVAtemplate and spread evenly over its surface at room temperature. Excess solution wascarefully scraped away. This process was repeated several times with time in between toallow template to dry. A batch of 20 filled PVA templates were dissolved in a beakercontaining 250 ml deionized water and gently stirred by magnetic stir bar at roomtemperature. The suspension was transferred into conical tubes (45 ml) and centrifuged for 5minutes (Eppendorf Centrifuge 5804, Eppendorf, Hauppauge, NY) at 5,000 rpm. The pelletwas re-suspended and washed at least 3 times, each time followed by centrifuging and re-suspension. The pellet obtained upon final centrifugation was freeze-dried and stored at 4 °Cuntil further use.
2.5 Preparation of physical mixturesPhysical mixtures of drug and PLGA were prepared by weighing out each component andgently mixing for at least ten minutes using mortar and pestle. Prior to mixing with drug,PLGA was grounded into powder form using a ball mill. The amount of drug in the drug-PLGA mixture was approximately 28%, 31% and 32% respectively for RIS, MPA and PTX.These values were equal to the experimentally determined drug loading of microparticles.
2.6 Preparation of emulsionsA measured amount of RIS was dissolved in 5 ml of solvent consisting of 2.5 ml BA and 2.5ml of EA along with 8515 PLGA. The concentration of polymer and drug (w/v) was 25 %and 7.0 % respectively. The solution (organic phase) was emulsified with 250 ml of 0.5 %(w/v) PVA solution in water (aqueous phase) at 5,000 rpm for 10 minutes. The resultingemulsion was stirred at room temperature by magnetic stirrer for 3 hours to allow droplets toharden by solvent extraction and evaporation. Thus-obtained microparticles were separatedby filtration and repeated washings followed by centrifugation at 5,000 rpm for 5 minutes tocollect. The collected microparticles were freeze-dried and stored at 4 °C until further use.
2.7 Characterization of microparticles2.7.1 Particle size analysis—The mean size (volume average particle diameter) and sizedistribution of drug-loaded PLGA microparticles were determined by a dynamic lightscattering analyzer (Microtrac S3500, Microtrac Inc., Largo, FL) equipped with appropriateanalysis software (Microtrac Flex Version 10.3.3). Size measurements were performed intriplicate following suspension of microparticles in redistilled water at 25 °C. To prepare the
Lu et al. Page 4
Int J Pharm. Author manuscript; available in PMC 2015 January 30.
NIH
-PA Author Manuscript
NIH
-PA Author Manuscript
NIH
-PA Author Manuscript

samples for analysis, approximately 2 mg of freeze-dried microparticles were suspended in 5ml of deionized water and vortexed for 5 minutes followed by sonication for 30 seconds.
2.7.2 Shape and morphology—The shape and surface morphology of microparticleswere characterized by fluorescence microscopy and scanning electron microscopy (SEM)respectively. For fluorescence microscopy, a small amount of freeze-dried microparticleswere re-suspended in deionized water and deposited onto the surface of a clean glass slideusing a pipette. The sample was air-dried prior to viewing on the fluorescence microscope(Olympus BX51, Olympus, Center Valley, PA). For surface morphology, FEI Nova™
NanoSEM (FEI, Hillsboro, OR) was used. Samples for characterization were prepared bycarefully depositing a small amount of freeze-dried microparticle powder onto the surface ofaluminum stubs and coating with platinum under vacuum conditions.
2.7.3 Physical stability—Solid form of drug, polymer, physical mixtures, microparticlesfrom emulsion and hydrogel template method were characterized with a powder X-raydiffraction (PXRD) apparatus (Siemens Bruker D5000, Bruker AXS, Madison, WI) usingCuK radiation at 30 mA and 45 kV (scanning rate 0.4°/min), and diffraction angles (2θ) of3–40°. Samples for PXRD were prepared by crushing a desired amount of drug, polymers,physical mixture or microparticles with mortar and pestle before adding to the sampleholder. Excess powder sample was scraped away and the surface of the powder sample wasleveled with a glass slide. The procedure was repeated for samples that were stored for 1 – 2months at 4 °C for physical stability assessment.
2.7.4 Drug loading—An accurately measured amount (5 mg) of freeze-dried drug-loadedmicroparticles was dissolved in 1 ml of DCM and diluted with 9 ml of methanol. Thesolution was vortexed to ensure thorough mixing. Following centrifugation for 5 minutes at5,000 rpm, the supernatant containing dissolved drug was collected. The pellet containingprecipitated PLGA was washed with methanol several times and the washings werecombined with supernatant. This solution was rotary evaporated then re-dissolved by 10 mlmobile phase for analysis by HPLC. The HPLC system (Agilent 1100 series, Agilent, SantaClara, CA) was equipped with autosampler, in-line degasser and UV absorbance detector.The separation method for each drug is outlined below. Drug content was calculated usingthe external standard method. Drug loading and encapsulation efficiency were calculated bythe following equations:
(1)
(2)
2.7.4.1 Risperidone: Separation was achieved using a X-Terra C-18 (250 mm × 4.6 mm)analytical column from Waters (Milford, MA) at a flow rate of 1 ml/min, a detectionwavelength of 278 nm and injection volume of 65 μl. The mobile phase consists ofmethanol: ammonium acetate (90:10 (v/v), pH adjusted to 7 with glacial acetic acid).Samples and mobile phase were filtered through a 0.22 μm syringe filter and a 0.48 μmmembrane filter respectively prior to use.
2.7.4.2 Methylprednisolone acetate: Separation was achieved using a C-12 Sinergy MAXRP (150 mm × 2.0 mm) analytical column (Chemtek Analytica, Italy) protected by a C-12RP guard column at a flow rate of 0.2 ml/min, a detection wavelength of 278 nm and
Lu et al. Page 5
Int J Pharm. Author manuscript; available in PMC 2015 January 30.
NIH
-PA Author Manuscript
NIH
-PA Author Manuscript
NIH
-PA Author Manuscript
injection volume of 5 μl. The mobile phase consists of 50% water containing 0.01% formicacid (A) and 50% acetonitrile (B). The A:B ratio was maintained for 6 minutes, then theconcentration of B was linearly increased to 100% B in 7 minutes, followed by another 15minutes of isocratic elution (washing). The composition of the eluent was then restored tothe original condition of A:B = 50:50 (v/v) and re-equilibrated for 10 minutes before thefollowing injection. The column compartment was maintained at 30 °C.
2.7.4.3 Paclitaxel: Separation was achieved using a Phenomenex C-18 (250 mm × 4.6 mm)analytical column (Torrance, CA) at a flow rate of 1 ml/min, a detection wavelength of 228nm and injection volume of 20 μl. The mobile phase consists of water, acetonitrile andmethanol (40:30:30 v/v). Samples and mobile phase were filtered through a 0.22 μm syringefilter and a 0.48 μm membrane filter respectively prior to use.
2.7.5 Thermal analysis—Differential scanning calorimetry (DSC) was carried out usinga DSC Q10 calorimeter (Mettler Toledo, Greifensee, Switzerland). Approximately 2 mg ofsample was weighed into aluminum pans and hermetically sealed. As a reference, an emptyaluminum pan was used. Samples were cooled down to −10 °C and then heated up to 180 °Cat a rate of 10 °C/min. For Tg determination, the data were analyzed using STAR software(Mettler Toledo, Greifensee, Switzerland) and the midpoint of the corresponding glasstransition was evaluated. Tg was determined in triplicate for every sample.
2.8 In vitro release characterizationFor RIS- and MPA-loaded microparticles, approximately 10 mg of microparticles wasaccurately weighed into glass vials and re-suspended in 2 ml of PBS/Tween-20 (0.05%) (pH7.4). The suspension was transferred carefully into a membrane cassette (Slide-A-Lyzer G2,Thermo Scientific, Rockford, IL) with molecular weight cut off of 3,500. The cassettes wereincubated with 500 ml of PBS/Tween-20 (pH 7.4) at 37 °C in an orbital shaker set at 100rpm throughout the duration of the release experiment. At predetermined intervals, 5 mlsamples were withdrawn from the release media and replaced with 5 ml of fresh buffer tomaintain sink conditions. The samples were collected in individual glass vials and stored at4 °C till further analysis. Concentrations of RIS or MPA in the samples were determined byHPLC analysis using the method outlined previously. For each formulation, the experimentwas performed in triplicate.
For PTX-loaded microparticles, due to extremely low aqueous solubility of the drug andconcentration detection limits of the HPLC method, the total volume of buffer used inrelease studies was reduced. Approximately 2.5 mg of microparticles was accuratelyweighed into glass vials and re-suspended in 1 ml of PBS/Tween 20 (pH 7.4). Thesuspension was transferred carefully into a small-volume membrane cassette. The cassettewas incubated with 10 ml of PBS/Tween 20 at 37 °C in an orbital shaker set at 100 rpmthroughout the duration of the release experiment. At predetermined intervals, 5 ml sampleswere withdrawn from the release media and replaced with 5 ml of fresh buffer. The sampleswere collected in individual glass vials and stored at 4 °C till further analysis. Concentrationof PTX in the samples was determined by HPLC analysis using the method outlinedpreviously. The experiment was performed in triplicate.
2.9 Solubility determinationThe saturation solubility of RIS, MPA and PTX were determined in BA, EA and DCM asfollows: an excess amount of each drug was transferred into glass vials containing 2 ml of aspecific solvent. The glass vials were equipped with screw-on caps to prevent solventevaporation. The vials containing the drug in the solvent were left on an orbital shaker atroom temperature under agitation. After 1 day, the solvent was removed and filtered through
Lu et al. Page 6
Int J Pharm. Author manuscript; available in PMC 2015 January 30.
NIH
-PA Author Manuscript
NIH
-PA Author Manuscript
NIH
-PA Author Manuscript
0.22 μm syringe filter. The concentration of the drug in solution was determined by HPLCaccording to the method outlined in section 2.7.4.
2.10 Statistical analysisParticle size measurements, drug loading and in vitro release experiments were performed intriplicate. The results are expressed as mean ± standard deviation. Statistical differencesamong groups were evaluated by unpaired t-test (between two groups) or one-way ANOVA(between multiple groups) with Tukey’s multiple comparison test. When p<0.05, statisticalsignificance was considered to be achieved.
3. Results and Discussion3.1 Development of the hydrogel template method
The ability to precisely control and manipulate microparticle geometry is highly valuable asthe shape and size of drug carriers have been shown to have an impact on biologicalprocesses such as vasculature, circulation time, targeting efficiency, cellular uptake andsubsequent intracellular transport for therapeutic delivery (21). While the hydrogel templateapproach produces microparticles of pre-defined size and shape, it requires furtherdevelopment for practical applications, such as scale-up production of microparticles. In theoriginal method, gelatin was used as a hydrogel template material, because at a certainconcentration it possesses a mechanical strength sufficiently high to withstand physicalmanipulation during template preparation and template filling. At the same time gelatin hasa gel-to-sol transition temperature mild enough not to adversely affect a broad range ofloaded drug. However, these gelatin templates cannot be stored for prolonged periods oftime without losing shape of the delicate patterns and encountering contamination issues,which increases the difficulty associated with streamlining this process for scale-upproduction. To overcome this issue, PVA was used in place of gelatin as a template material.This water-soluble polymer has been used extensively as a stabilizer in nano- and micro-particle preparations, has excellent film-forming properties due to its high tensile strengthand flexibility, and is resistant to commonly used organic solvents for filling templates (22,23). In addition, PVA templates are advantageous compared with gelatin templates, sincethe former can be stored for an extended period of time in a dry place without losing shapeof the patterns or encountering contamination issues. A large number of PVA templates canbe fabricated and stored until ready to be filled by polymer-drug solutions.
In the current study, different types of PVA, as defined by the percent hydrolyzed andmolecular weights, were explored for use as a template material for the hydrogel templatemethod. The type of PVA used in the final process was chosen based the duration oftemplate preparation time and stability of produced microparticles, as determined byretention of designed particle shape. During this process, the PVA molecules with 87~89%hydrolyzed, 96% hydrolyzed, 98~99% hydrolyzed and 99+% hydrolyzed were chosen forevaluations because they represent the range of commercially available categories of PVA.A mixture of water and ethanol was used to dissolve the PVA in preparation of templatesolution because a solution based on water alone was found to shrink on the surface ofmaster PDMS template, which affected quality of templates produced. From preliminaryevaluations, 87~89% hydrolyzed PVA with average molecular weight of 146,000~186,000Da (viscosity = 40~50 cP) was found to be the most suitable type of PVA with a preparationtime of 12 hours and good microparticle stability. Based on our previously defined selectioncriteria, 98~99% and 99+% hydrolyzed PVA with average molecular weight of146,000~186,000 Da were not selected due to long solubilization time (>3 days at 80 °C).This is possibly due to high viscosity of the two polymers (55~65 cP), which is known toincrease difficulty with powder dispersal. This in turn leads to formation of lumps that
Lu et al. Page 7
Int J Pharm. Author manuscript; available in PMC 2015 January 30.
NIH
-PA Author Manuscript
NIH
-PA Author Manuscript
NIH
-PA Author Manuscript
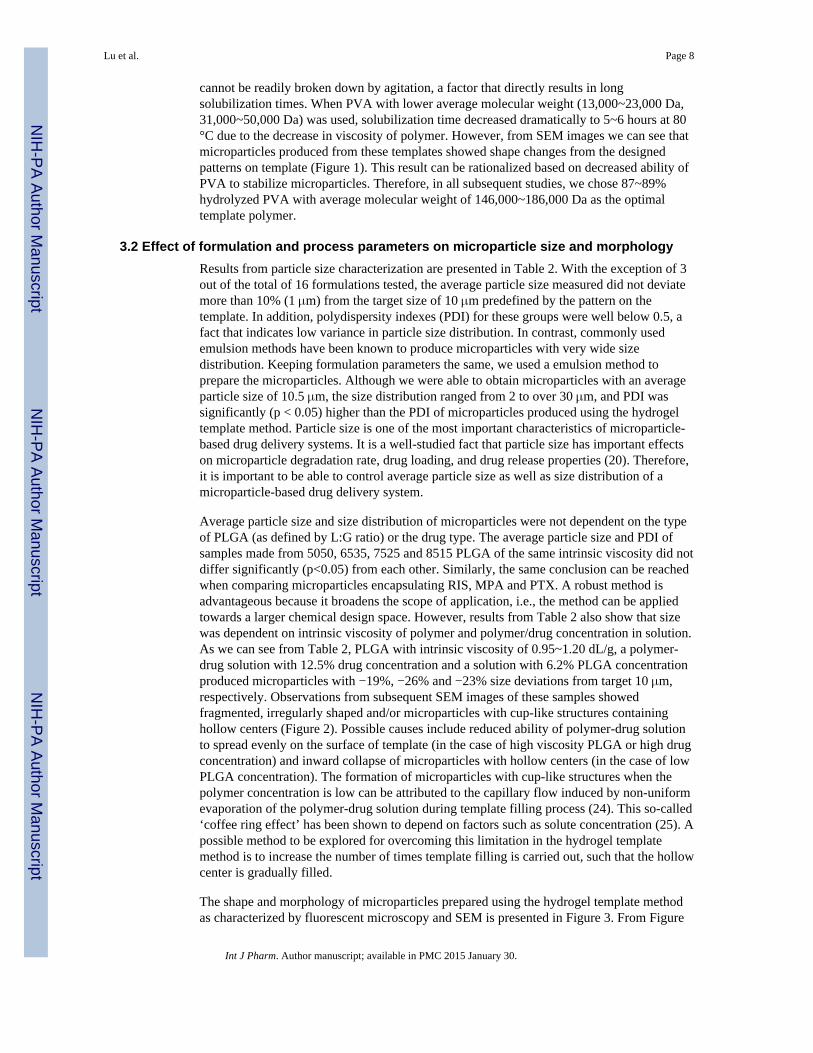
cannot be readily broken down by agitation, a factor that directly results in longsolubilization times. When PVA with lower average molecular weight (13,000~23,000 Da,31,000~50,000 Da) was used, solubilization time decreased dramatically to 5~6 hours at 80°C due to the decrease in viscosity of polymer. However, from SEM images we can see thatmicroparticles produced from these templates showed shape changes from the designedpatterns on template (Figure 1). This result can be rationalized based on decreased ability ofPVA to stabilize microparticles. Therefore, in all subsequent studies, we chose 87~89%hydrolyzed PVA with average molecular weight of 146,000~186,000 Da as the optimaltemplate polymer.
3.2 Effect of formulation and process parameters on microparticle size and morphologyResults from particle size characterization are presented in Table 2. With the exception of 3out of the total of 16 formulations tested, the average particle size measured did not deviatemore than 10% (1 μm) from the target size of 10 μm predefined by the pattern on thetemplate. In addition, polydispersity indexes (PDI) for these groups were well below 0.5, afact that indicates low variance in particle size distribution. In contrast, commonly usedemulsion methods have been known to produce microparticles with very wide sizedistribution. Keeping formulation parameters the same, we used a emulsion method toprepare the microparticles. Although we were able to obtain microparticles with an averageparticle size of 10.5 μm, the size distribution ranged from 2 to over 30 μm, and PDI wassignificantly (p < 0.05) higher than the PDI of microparticles produced using the hydrogeltemplate method. Particle size is one of the most important characteristics of microparticle-based drug delivery systems. It is a well-studied fact that particle size has important effectson microparticle degradation rate, drug loading, and drug release properties (20). Therefore,it is important to be able to control average particle size as well as size distribution of amicroparticle-based drug delivery system.
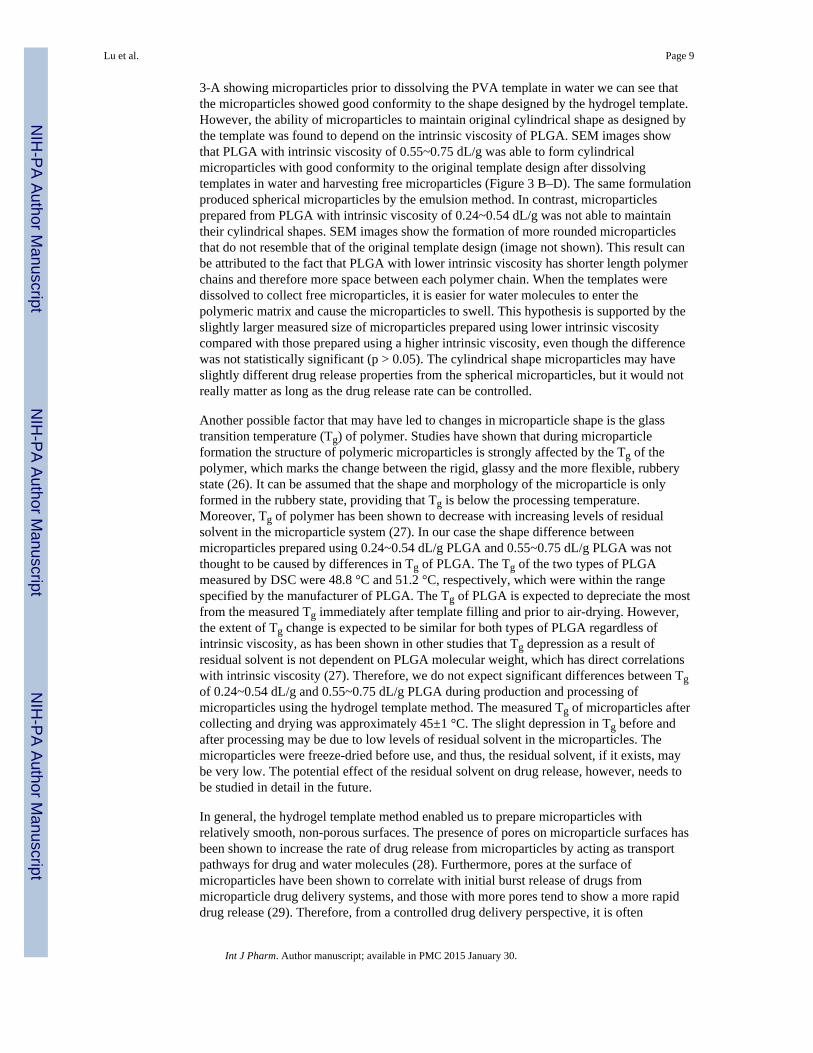
Average particle size and size distribution of microparticles were not dependent on the typeof PLGA (as defined by L:G ratio) or the drug type. The average particle size and PDI ofsamples made from 5050, 6535, 7525 and 8515 PLGA of the same intrinsic viscosity did notdiffer significantly (p<0.05) from each other. Similarly, the same conclusion can be reachedwhen comparing microparticles encapsulating RIS, MPA and PTX. A robust method isadvantageous because it broadens the scope of application, i.e., the method can be appliedtowards a larger chemical design space. However, results from Table 2 also show that sizewas dependent on intrinsic viscosity of polymer and polymer/drug concentration in solution.As we can see from Table 2, PLGA with intrinsic viscosity of 0.95~1.20 dL/g, a polymer-drug solution with 12.5% drug concentration and a solution with 6.2% PLGA concentrationproduced microparticles with −19%, −26% and −23% size deviations from target 10 μm,respectively. Observations from subsequent SEM images of these samples showedfragmented, irregularly shaped and/or microparticles with cup-like structures containinghollow centers (Figure 2). Possible causes include reduced ability of polymer-drug solutionto spread evenly on the surface of template (in the case of high viscosity PLGA or high drugconcentration) and inward collapse of microparticles with hollow centers (in the case of lowPLGA concentration). The formation of microparticles with cup-like structures when thepolymer concentration is low can be attributed to the capillary flow induced by non-uniformevaporation of the polymer-drug solution during template filling process (24). This so-called‘coffee ring effect’ has been shown to depend on factors such as solute concentration (25). Apossible method to be explored for overcoming this limitation in the hydrogel templatemethod is to increase the number of times template filling is carried out, such that the hollowcenter is gradually filled.
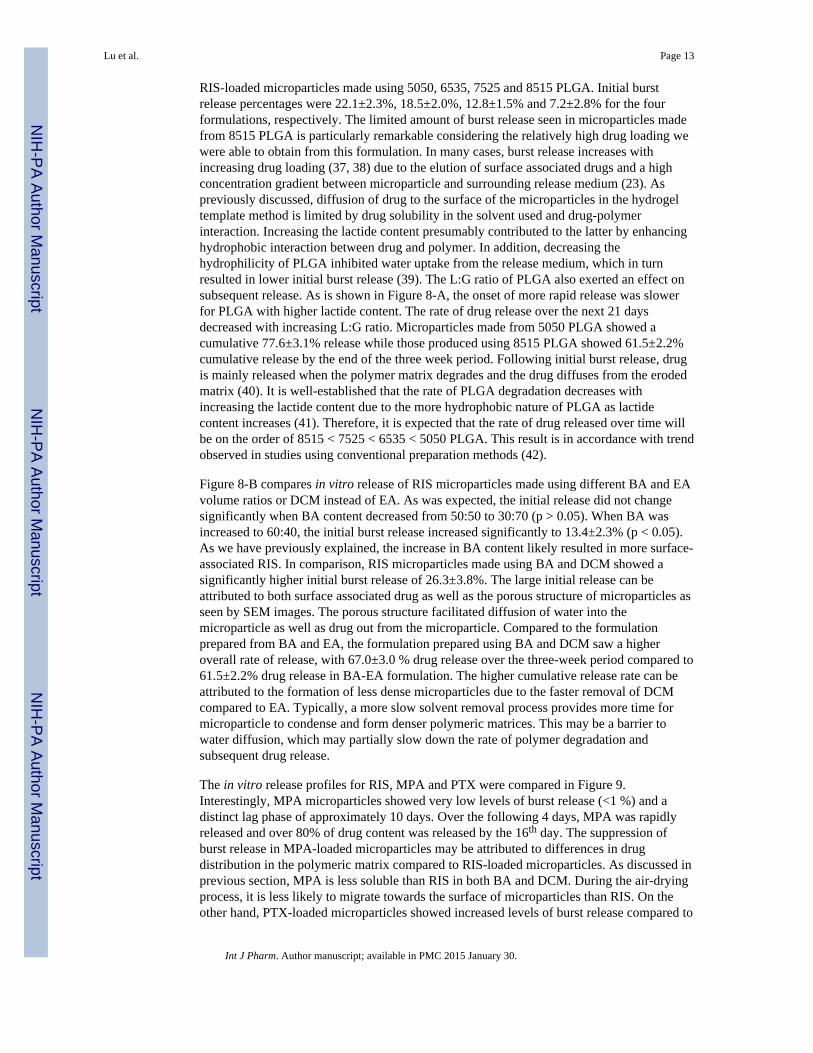
The shape and morphology of microparticles prepared using the hydrogel template methodas characterized by fluorescent microscopy and SEM is presented in Figure 3. From Figure
Lu et al. Page 8
Int J Pharm. Author manuscript; available in PMC 2015 January 30.
NIH
-PA Author Manuscript
NIH
-PA Author Manuscript
NIH
-PA Author Manuscript
3-A showing microparticles prior to dissolving the PVA template in water we can see thatthe microparticles showed good conformity to the shape designed by the hydrogel template.However, the ability of microparticles to maintain original cylindrical shape as designed bythe template was found to depend on the intrinsic viscosity of PLGA. SEM images showthat PLGA with intrinsic viscosity of 0.55~0.75 dL/g was able to form cylindricalmicroparticles with good conformity to the original template design after dissolvingtemplates in water and harvesting free microparticles (Figure 3 B–D). The same formulationproduced spherical microparticles by the emulsion method. In contrast, microparticlesprepared from PLGA with intrinsic viscosity of 0.24~0.54 dL/g was not able to maintaintheir cylindrical shapes. SEM images show the formation of more rounded microparticlesthat do not resemble that of the original template design (image not shown). This result canbe attributed to the fact that PLGA with lower intrinsic viscosity has shorter length polymerchains and therefore more space between each polymer chain. When the templates weredissolved to collect free microparticles, it is easier for water molecules to enter thepolymeric matrix and cause the microparticles to swell. This hypothesis is supported by theslightly larger measured size of microparticles prepared using lower intrinsic viscositycompared with those prepared using a higher intrinsic viscosity, even though the differencewas not statistically significant (p > 0.05). The cylindrical shape microparticles may haveslightly different drug release properties from the spherical microparticles, but it would notreally matter as long as the drug release rate can be controlled.
Another possible factor that may have led to changes in microparticle shape is the glasstransition temperature (Tg) of polymer. Studies have shown that during microparticleformation the structure of polymeric microparticles is strongly affected by the Tg of thepolymer, which marks the change between the rigid, glassy and the more flexible, rubberystate (26). It can be assumed that the shape and morphology of the microparticle is onlyformed in the rubbery state, providing that Tg is below the processing temperature.Moreover, Tg of polymer has been shown to decrease with increasing levels of residualsolvent in the microparticle system (27). In our case the shape difference betweenmicroparticles prepared using 0.24~0.54 dL/g PLGA and 0.55~0.75 dL/g PLGA was notthought to be caused by differences in Tg of PLGA. The Tg of the two types of PLGAmeasured by DSC were 48.8 °C and 51.2 °C, respectively, which were within the rangespecified by the manufacturer of PLGA. The Tg of PLGA is expected to depreciate the mostfrom the measured Tg immediately after template filling and prior to air-drying. However,the extent of Tg change is expected to be similar for both types of PLGA regardless ofintrinsic viscosity, as has been shown in other studies that Tg depression as a result ofresidual solvent is not dependent on PLGA molecular weight, which has direct correlationswith intrinsic viscosity (27). Therefore, we do not expect significant differences between Tgof 0.24~0.54 dL/g and 0.55~0.75 dL/g PLGA during production and processing ofmicroparticles using the hydrogel template method. The measured Tg of microparticles aftercollecting and drying was approximately 45±1 °C. The slight depression in Tg before andafter processing may be due to low levels of residual solvent in the microparticles. Themicroparticles were freeze-dried before use, and thus, the residual solvent, if it exists, maybe very low. The potential effect of the residual solvent on drug release, however, needs tobe studied in detail in the future.
In general, the hydrogel template method enabled us to prepare microparticles withrelatively smooth, non-porous surfaces. The presence of pores on microparticle surfaces hasbeen shown to increase the rate of drug release from microparticles by acting as transportpathways for drug and water molecules (28). Furthermore, pores at the surface ofmicroparticles have been shown to correlate with initial burst release of drugs frommicroparticle drug delivery systems, and those with more pores tend to show a more rapiddrug release (29). Therefore, from a controlled drug delivery perspective, it is often
Lu et al. Page 9
Int J Pharm. Author manuscript; available in PMC 2015 January 30.
NIH
-PA Author Manuscript
NIH
-PA Author Manuscript
NIH
-PA Author Manuscript

desirable to control pore size if not eliminate the presence of pores entirely. The surfacecharacteristic of microparticles is strongly dependent on the solvent removal process, i.e.,solvent evaporation and extraction kinetics (3). In the hydrogel template method, solventremoval occurs primarily through solvent evaporation during the template filling and dryingstage, with limited supplementary solvent extraction when the template is exposed to waterand microparticles become briefly suspended in the aqueous phase. The ability of thehydrogel template method to prepare microparticles with relatively smooth, non-poroussurfaces is most likely due to slow solvent evaporation in the preparation process as well asminimized contact with water during the particle formation process. To control the rate ofsolvent evaporation, we used a binary co-solvent system consisting of BA (boiling point:205 °C) and EA (boiling point: 77.1 °C). These solvents were selected based on the criteriathat the solvents should be able to dissolve both the polymer and the drug at theconcentrations used while having no detrimental effect on the integrity of template material.Slow solidification allows microparticles to remain soft for a longer period, which leads toparticle compaction within the template. To further investigate, DCM (boiling point: 39.6°C) instead of EA was used in combination with BA to prepare the polymer-drug solution.This binary co-solvent system is expected to have a lower boiling point than the BA and EAsystem, which promotes more rapid solvent evaporation. SEM study of the microparticlesprepared using this new solvent system showed large pores forming on the surface ofmicroparticles (Figure 4), which is consistent with the prediction based on faster solventevaporation caused by boiling point depression of the new solvent system.
3.3 Effect of formulation and process parameters on drug loading and encapsulationefficiency
Using the hydrogel template method, we successfully encapsulated model drugs, RIS, MPAand PTX, into a PLGA matrix. X-ray diffractograms of drug-loaded microparticles preparedby the hydrogel template method in comparison with drug alone, polymer alone or physicalmixtures are shown in Figure 5. The X-ray diffractogram suggests that the process ofencapsulating the drug in microparticles using the hydrogel template method resulted in theloss of crystallinity of the drug. The emulsion method also produced microparticles thatencapsulated drug in amorphous form. For RIS, dominant peaks at 2θ angles between 13°and 15° and between 18° and 22° were observed for pure drug. The polymer PLGA ispredominantly amorphous as indicated by the slight shift above baseline and lack of anydominant peaks. The peaks characteristic of RIS at 2xetas; angles of 14° and 21.5° were stillobservable for the physical mixture of RIS and PLGA at a concentration of 10% (w/w) RISin the physical mixture. However, the peaks were lost in the X-ray diffractogram ofmicroparticles prepared by the hydrogel template method, indicating amorphization of RIS.The same general trend can be observed for model drugs MPA and PTX (Figure 5-B and 4-C), indicating that all three model drugs were encapsulated in the amorphous form withinthe PLGA matrix. Conversion of the drug from crystalline into an amorphous form is alsocommonly observed in other microparticle preparation methods such as spray-drying andemulsion-based methods. Potential advantages are enhanced dissolution and saturationsolubility of the drug, properties that are particularly important for delivery of poorly watersoluble drugs such as the model drugs studied here. However, stability is a major concernsince amorphous active pharmaceutical ingredients may undergo recrystallization duringfurther processing and/or storage (30). The physical state of the encapsulated drug afterstorage at 4 °C for over 2 months was characterized by XRD experiments and comparingcollected diffractograms with X-ray diffractograms obtained immediately after collectingand drying the microparticles. The results show overlap of the diffractogram patterns, whichsuggests that devitrification did not take place (Figure 5-A).
Lu et al. Page 10
Int J Pharm. Author manuscript; available in PMC 2015 January 30.
NIH
-PA Author Manuscript
NIH
-PA Author Manuscript
NIH
-PA Author Manuscript

A comparison of drug loading of RIS is presented in Figure 6 As was expected, the drugloading was found to depend on drug, polymer and solvent interactions. Figure 6-A showsthat RIS drug loading increased when lactide content of PLGA increased. Drug loadingswere 7.09±2.6% and 26.2±5.4%, respectively, for 5050 PLGA and 8515 PLGA,corresponding to the encapsulation efficiencies of 20.3% and 74.6%, respectively.Increasing the lactide content of PLGA most likely enhanced hydrophobic interactionsbetween polymer and RIS, thus, resulting in higher drug loading and encapsulationefficiency. This is predicted by the interaction parameter, which can be calculated based onthe following equation:
Where χ is the interaction parameter, δd and δp are solubility parameters for drug andpolymer, respectively, and Vd is the molar volume of drug. With the δd value of 17.5 forRIS, 21.7 for 8515 PLGA and 22.3 for 5050 PLGA (31), the calculated χ values forRIS-8515 PLGA and RIS-5050PLGA are approximately 2.27 and 2.97, respectively. Thelower value of RIS-8515 PLGA indicates better polymer-drug compatibility. IncreasingPLGA concentration in the polymer-drug solution resulted in higher drug loading as well asencapsulation efficiency (Figure 6-B). At a polymer concentration of 25.0% in the polymer-drug solution, the drug loading achieved was 28.4±2.7%. This trend has also beendemonstrated for emulsion-based methods (32) and can be attributed to increased viscosityof the solution such that drug diffusion through the polymer matrix is limited (33).Furthermore it has been shown that a low polymer concentration may result in polymermicroparticles with drug crystals penetrating the polymer shell, which leads to drug lossduring washing and further processing (34). Increasing the concentration of drug inpolymer-drug solution did not result in higher drug loading or encapsulation efficiencybeyond a RIS concentration of 7.0%. As we can see in Figure 6-C, from a drugconcentration of 4.3% to 7.0% a corresponding increase in drug loading from 19.3±3.5% to26.2±2.1% was seen, but further increasing the drug concentration to 12.5% did not lead to asignificant change in drug loading. There were no significant differences betweenencapsulation efficiency at 4.3% and 7.0% drug concentration (77.2% and 74.6%,respectively), but encapsulation efficiency at 12.5% drug concentration was significantlylower at 49.8%. This observation again emphasizes the importance of polymer-drugcompatibility in amount of drug loading and encapsulation efficiency.
Drug loading and encapsulation efficiency were also found to be affected by the solventratio (Figure 6-D). In the current study we found that increasing volume ratio of EAincreased drug loading and encapsulation efficiency, though the increase was not significantbeyond BA:EA volume ratio of 50:50. The higher drug loading and encapsulation efficiencyseen when BA:EA volume ratio decreased is likely due to less surface associated drug.When solubility experiments were carried out, we found that the solubility of RIS is muchlower in EA than in BA. Typically, migration of the drug during drying and storage stepscan lead to heterogeneous distribution of drug molecules within the polymeric matrix (35). Itis reasonable to assume that as BA is removed from the microparticles, it carries with it acertain amount of drug which may easily be lost to the aqueous environment or duringwashing steps. Lowering the BA:EA ratio decreases the amount of RIS able to diffuse alongwith BA to the external surface of microparticles, thereby increasing the drug loading andencapsulation efficiency. In addition, EA evaporates faster than BA at room temperature dueto a much lower boiling point. The rate of solvent removal affects microparticlesolidification; that is, fast solidification (fast solvent removal) may impede drug diffusion to
Lu et al. Page 11
Int J Pharm. Author manuscript; available in PMC 2015 January 30.
NIH
-PA Author Manuscript
NIH
-PA Author Manuscript
NIH
-PA Author Manuscript

the surface by fast formation of a dense polymer matrix. This may reduce drug diffusion tothe surface and increase drug loading and encapsulation efficiency.
It is interesting to note that faster solvent removal does not automatically equate higher drugloading and encapsulation efficiency. For RIS, using EA-BA solvent system resulted inhigher drug loading and encapsulation efficiency than DCM-BA solvent system (Figure 7).Due to the lower boiling point of DCM compared to EA, it is expected to be removed at amore rapid rate compared to EA. In this case, solvent removal was so rapid that it facilitatedthe formation of numerous surface pores, which was confirmed by SEM imaging. Thepresence of surface pores may have increased drug loss to the aqueous environment duringwashing.
Drug loading and encapsulation efficiencies are also dependent on the properties of theencapsulated drug. Using 8515 PLGA at 25.0% w/v, we achieved 31.5±3.9% and32.2±4.1% drug loading for MPA and PTX respectively, corresponding to encapsulationefficiencies of 90.0% and 92.0% PTX, respectively. These values were significantly(p<0.05) higher than that of RIS (Figure 7). One possible explanation is that MPA and PTXhave higher compatibility with the polymer 8515 PLGA, which led to enhanced interactionbetween polymer and drug. Using the Hildebrand-modified approach, the interactionparameter χ can be calculated based on the following equation:
where δd and δp are partial solubility parameters due to dispersion, polarity and hydrogelbonding forces for drug and polymer respectively. The values for partial solubilityparameters were obtained from literature (31). Based on the above equation, the interactionparameters between 8515 PLGA and RIS, MPA and PTX are 2.74, 0.309 and 0.811,respectively. Clearly MPA and PTX have higher compatibility with 8515 PLGA comparedto RIS. Another possible cause for the difference in drug loading and encapsulationefficiency can be attributed to the difference in solubilities of the drugs in the solvents. Drugwith higher solubility in a particular organic solvent (e.g., RIS in BA versus MPA in BA)may diffuse towards the surface of the microparticles in greater amount than one with alower solubility in the said solvent. A third factor that may contribute towards the drugloading trends we see here is the aqueous solubility of the drug. While PTX has a highersolubility in BA compared to RIS, the loss of surface associated PTX from microparticlesmay have been hindered by the extremely low aqueous solubility of the drug compared toRIS. The amount of drug loading is therefore determined by a combination of factors thatinvolve drug-polymer compatibility, drug-solvent interaction and drug properties.
3.4 Effect of formulation and process parameters on in vitro releaseThe in vitro release profiles of RIS formulations are presented in Figure 8. Previously, weshowed that the following formulation parameters produced fragmented microparticles ormicroparticles irregular in shape: low IV PLGA (IV = 0.26~0.54 dL/g), high IV PLGA (IV= 0.95~1.2 dL/g), low PLGA concentration in organic solution (6.2% w/v) and increaseddrug content (12.5% w/v). Because size and shape of the microparticles greatly affect drugrelease (36), these formulations were eliminated from direct comparison in in vitro studieswith microparticles that were able to maintain original template size and shape.
Among the formulation and process-related parameters studied, initial burst release andsubsequent release of RIS from microparticles produced by the hydrogel template methodwere found to be influenced by L:G ratio of PLGA. Figure 8-A compares release profiles of
Lu et al. Page 12
Int J Pharm. Author manuscript; available in PMC 2015 January 30.
NIH
-PA Author Manuscript
NIH
-PA Author Manuscript
NIH
-PA Author Manuscript
RIS-loaded microparticles made using 5050, 6535, 7525 and 8515 PLGA. Initial burstrelease percentages were 22.1±2.3%, 18.5±2.0%, 12.8±1.5% and 7.2±2.8% for the fourformulations, respectively. The limited amount of burst release seen in microparticles madefrom 8515 PLGA is particularly remarkable considering the relatively high drug loading wewere able to obtain from this formulation. In many cases, burst release increases withincreasing drug loading (37, 38) due to the elution of surface associated drugs and a highconcentration gradient between microparticle and surrounding release medium (23). Aspreviously discussed, diffusion of drug to the surface of the microparticles in the hydrogeltemplate method is limited by drug solubility in the solvent used and drug-polymerinteraction. Increasing the lactide content presumably contributed to the latter by enhancinghydrophobic interaction between drug and polymer. In addition, decreasing thehydrophilicity of PLGA inhibited water uptake from the release medium, which in turnresulted in lower initial burst release (39). The L:G ratio of PLGA also exerted an effect onsubsequent release. As is shown in Figure 8-A, the onset of more rapid release was slowerfor PLGA with higher lactide content. The rate of drug release over the next 21 daysdecreased with increasing L:G ratio. Microparticles made from 5050 PLGA showed acumulative 77.6±3.1% release while those produced using 8515 PLGA showed 61.5±2.2%cumulative release by the end of the three week period. Following initial burst release, drugis mainly released when the polymer matrix degrades and the drug diffuses from the erodedmatrix (40). It is well-established that the rate of PLGA degradation decreases withincreasing the lactide content due to the more hydrophobic nature of PLGA as lactidecontent increases (41). Therefore, it is expected that the rate of drug released over time willbe on the order of 8515 < 7525 < 6535 < 5050 PLGA. This result is in accordance with trendobserved in studies using conventional preparation methods (42).
Figure 8-B compares in vitro release of RIS microparticles made using different BA and EAvolume ratios or DCM instead of EA. As was expected, the initial release did not changesignificantly when BA content decreased from 50:50 to 30:70 (p > 0.05). When BA wasincreased to 60:40, the initial burst release increased significantly to 13.4±2.3% (p < 0.05).As we have previously explained, the increase in BA content likely resulted in more surface-associated RIS. In comparison, RIS microparticles made using BA and DCM showed asignificantly higher initial burst release of 26.3±3.8%. The large initial release can beattributed to both surface associated drug as well as the porous structure of microparticles asseen by SEM images. The porous structure facilitated diffusion of water into themicroparticle as well as drug out from the microparticle. Compared to the formulationprepared from BA and EA, the formulation prepared using BA and DCM saw a higheroverall rate of release, with 67.0±3.0 % drug release over the three-week period compared to61.5±2.2% drug release in BA-EA formulation. The higher cumulative release rate can beattributed to the formation of less dense microparticles due to the faster removal of DCMcompared to EA. Typically, a more slow solvent removal process provides more time formicroparticle to condense and form denser polymeric matrices. This may be a barrier towater diffusion, which may partially slow down the rate of polymer degradation andsubsequent drug release.
The in vitro release profiles for RIS, MPA and PTX were compared in Figure 9.Interestingly, MPA microparticles showed very low levels of burst release (<1 %) and adistinct lag phase of approximately 10 days. Over the following 4 days, MPA was rapidlyreleased and over 80% of drug content was released by the 16th day. The suppression ofburst release in MPA-loaded microparticles may be attributed to differences in drugdistribution in the polymeric matrix compared to RIS-loaded microparticles. As discussed inprevious section, MPA is less soluble than RIS in both BA and DCM. During the air-dryingprocess, it is less likely to migrate towards the surface of microparticles than RIS. On theother hand, PTX-loaded microparticles showed increased levels of burst release compared to
Lu et al. Page 13
Int J Pharm. Author manuscript; available in PMC 2015 January 30.
NIH
-PA Author Manuscript
NIH
-PA Author Manuscript
NIH
-PA Author Manuscript
RIS microparticles with almost no lag phase before steady release. This is in accordancewith our previous observation that higher solubility of drug in organic solvent leads tohigher initial burst release due to the migration of drug molecules to surface ofmicroparticles. It is noted that the MPA was released at an accelerated rate after Day 10 ofthe secondary release phase. This may be due to multiple reasons, and one possibleexplanation is the drug release through the microchannels formed by the diffusing water. Atthis stage, the drug release depends on the interactions among the drug, PLGA, and water.Like MPA-loaded microparticles, more than 80 % of total drug loaded was released by day16.
3.5 Comparison of the hydrogel template method and emulsion methodAs previously discussed, the emulsion-based method is one of the most commonly usedways to prepare drug-loaded polymeric microparticles. However, three major limitations ofthe emulsion method are wide particle size distribution, use of heat (during solventextraction and evaporation process) and relatively low drug loading. From the particle sizedata we obtained in this study, we found that microparticles produced using the emulsionmethod showed a polydispersity of 0.39 which is significantly higher than the polydispersityvalue of 0.15 for the microparticles prepared using the hydrogel template method. Themicroparticles were mostly spherical in shape with smooth surfaces and few pores. Incommercial preparation of microparticles using emulsion-based methods, a secondaryprocessing step is almost always required to further reduce particle size distribution. Thisincreases time and cost of production, and is less desirable than a single process that allowsus to achieve the desirable target size range.
Similar to the hydrogel template method, drug encapsulated within microparticles made bythe emulsion method were amorphous in form as characterized by XRD. Drug loading andencapsulation efficiency were 28.3±0.7% and 80.8% respectively, values that werecomparable to drug loading and encapsulation efficiency of the hydrogel templatemicroparticles prepared using the same formulation (8515 PLGA, 12.5% w/v PLGA, 7.0%w/v drug, BA:EA=50:50 v/v). In vitro release profiles of RIS-loaded microparticles preparedusing the two different methods are presented in Figure 10. Microparticles prepared from thehydrogel template and emulsion method showed initial burst release of 7.2±1.1% and10.1±3.0%, respectively. The burst release from hydrogel template method was slightlylower compared to microparticle prepared from the emulsion method. Both types ofmicroparticles displayed a period of slow release until day 10, followed by more rapidrelease. The cumulative release over a period of three weeks was also comparable, reaching61±2.8% for the hydrogel template and 63.2±8.0% for emulsion. These results demonstratethat microparticles prepared using the hydrogel template method were at least comparable inin vitro performance to microparticles prepared from the conventional emulsion method.The major advantages associated with using the hydrogel template over emulsion seem to beparticle size homogeneity, which is reflected in the smaller variations in subsequent in vitrorelease profiles. Furthermore, the hydrogel template method allows additional manipulationof PLGA composition and use of different types of polymers.
4. ConclusionDrug-loaded PLGA microparticles prepared using the hydrogel template method werecharacterized and evaluated using three poorly-water soluble, model drugs: RIS, MPA andPTX. The microparticles were characterized based on size, shape, morphology, drugloading, encapsulation efficiency as well as in vitro release. Among the formulation andprocess-related parameters studied, it was found that the ability of produced microparticlesto retain the designed shape was dependent on molecular weight of template material as wellas viscosity of filling solution. When these two parameters were optimized, the
Lu et al. Page 14
Int J Pharm. Author manuscript; available in PMC 2015 January 30.
NIH
-PA Author Manuscript
NIH
-PA Author Manuscript
NIH
-PA Author Manuscript

microparticles formed showed good conformity to the original template design for a widerange of formulation conditions, which demonstrates the robustness as well as the broadapplicability of the hydrogel template method. In addition, the microparticles producedshowed small size distribution, which provided an advantage compared to the conventionalemulsion-based method. Drug loading and encapsulation efficiency of microparticlesprepared using the hydrogel template method were found to increase with lactide content ofPLGA, concentration of PLGA in solution and decreasing BA content. The trends observedwere expected and can be explained using well-established microencapsulation principles.Using this method, we were able to suppress initial burst release of two model compounds tobelow 10 % and extend the release for at least 21 days. The low initial burst release isparticularly remarkable considering the relatively high drug loading we were able to achievefor these microparticles. The hydrogel template method has been demonstrated to producemicroparticles that perform at least comparably in vitro to microparticles from the emulsion-based method. Efforts are underway to characterize and understand how these microparticleswill perform in vivo. Applications of homogeneous micdroparticles are likely to extend tocoating of drug to various biomedical devices, such as drug-eluting vascular stents andangioplasty balloons (43)
AcknowledgmentsThis work was supported by the Showalter Research Trust Fund and National Institute of Health throughCA129287, HL062552, and GM095879.
References1. Tran VT, Benoit JP, Venier-Julienne MC. Why and how to prepare biodegradable, monodispersed,
polymeric microparticles in the field of pharmacy? International Journal of Pharmaceutics. 2011;407:1–11. [PubMed: 21256947]
2. Wei Y, Wang YX, Kang AJ, Wang W, Ho SV, Gao JF, Ma GH, Su ZG. A Novel Sustained-ReleaseFormulation of Recombinant Human Growth Hormone and Its Pharmacokinetic, Pharmacodynamicand Safety Profiles. Molecular pharmaceutics. 2012; 9:2039–2048. [PubMed: 22663348]
3. Yeoand Y, Park KN. Control of encapsulation efficiency and initial burst in polymeric microparticlesystems. Archives of Pharmacal Research. 2004; 27:1–12. [PubMed: 14969330]
4. Su ZX, Shi YN, Teng LS, Li X, Wang LX, Meng QF, Teng LR, Li YX. Biodegradable poly(D, L-lactide-co-glycolide) (PLGA) microspheres for sustained release of risperidone: Zero-order releaseformulation. Pharmaceutical Development and Technology. 2011; 16:377–384. [PubMed:20370594]
5. Amann LC, Gandal MJ, Lin R, Liang YL, Siegel SJ. In Vitro-In Vivo Correlations of ScalablePLGA-Risperidone Implants for the Treatment of Schizophrenia. Pharmaceutical Research. 2010;27:1730–1737. [PubMed: 20422263]
6. Doan TVP, Couet W, Olivier JC. Formulation and in vitro characterization of inhalable rifampicin-loaded PLGA microspheres for sustained lung delivery. International Journal of Pharmaceutics.2011; 414:112–117. [PubMed: 21596123]
7. Cho SW, Song SH, Choi YW. Effects of solvent selection and fabrication method on thecharacteristics of biodegradable poly(lactide-co-glycolide) microspheres containing ovalbumin.Archives of Pharmacal Research. 2000; 23:385–390. [PubMed: 10976588]
8. Maaand YF, Prestrelski SJ. Biopharmaceutical Powders Particle Formation and FormulationConsiderations. Current Pharmaceutical Biotechnology. 2000; 1:283–302. [PubMed: 11469385]
9. Tran VT, Benoit JP, Venier-Julienne MC. Why and how to prepare biodegradable, monodispersed,polymeric microparticles in the field of pharmacy? International Journal of Pharmaceutics. 2011;407:1–11. [PubMed: 21256947]
10. Gaumet M, Gurny R, Delie F. Localization and quantification of biodegradable particles in anintestinal cell model: The influence of particle size. European Journal of Pharmaceutical Sciences.2009; 36:465–473. [PubMed: 19124077]
Lu et al. Page 15
Int J Pharm. Author manuscript; available in PMC 2015 January 30.
NIH
-PA Author Manuscript
NIH
-PA Author Manuscript
NIH
-PA Author Manuscript

11. Mohamedand F, van der Walle CF. Engineering biodegradable polyester particles with specificdrug targeting and drug release properties. Journal of Pharmaceutical Sciences. 2008; 97:71–87.[PubMed: 17722085]
12. Thomas C, Gupta V, Ahsan F. Particle Size Influences the Immune Response Produced byHepatitis B Vaccine Formulated in Inhalable Particles. Pharmaceutical Research. 27:905–919.[PubMed: 20232117]
13. Berkland C, Kipper MJ, Narasimhan B, Kim KK, Pack DW. Microsphere size, precipitationkinetics and drug distribution control drug release from biodegradable polyanhydridemicrospheres. Journal of Controlled Release. 2004; 94:129–141. [PubMed: 14684277]
14. Siepmann J, Faisant N, Akiki J, Richard J, Benoit JP. Effect of the size of biodegradablemicroparticles on drug release: experiment and theory. Journal of Controlled Release. 2004;96:123–134. [PubMed: 15063035]
15. Berkland C, Kim K, Pack DW. PLG microsphere size controls drug release rate through severalcompeting factors. Pharmaceutical Research. 2003; 20:1055–1062. [PubMed: 12880292]
16. Gaspar MM, Blanco D, Cruz MEM, Alonso MJ. Formulation of L-asparaginase-loadedpoly(lactide-co-glycolide) nanoparticles: influence of polymer properties on enzyme loading,activity and in vitro release. Journal of Controlled Release. 1998; 52:53–62. [PubMed: 9685935]
17. Kauffman KJ, Kanthamneni N, Meenach SA, Pierson BC, Bachelder EM, Ainslie KM.Optimization of rapamycin-loaded acetalated dextran microparticles for immunosuppression.International Journal of Pharmaceutics. 2012; 422:356–363. [PubMed: 22037446]
18. Le Ray AM, Chiffoleau S, Iooss P, Grimandi G, Gouyette A, Daculsi G, Merle C. Vancomycinencapsulation in biodegradable poly(epsilon-caprolactone) microparticles for bone implantation.Influence of the formulation process on size, drug loading, in vitro release and cytocompatibility.Biomaterials. 2003; 24:443–449. [PubMed: 12423599]
19. Acharya G, Shin C, Park K. The hydrogel template method for fabrication of homogeneous nano/microparticles. Journal of Controlled Release. 2010; 141:314– 319. [PubMed: 19822178]
20. Acharya G, Shin CS, Vedantham K, McDermott M, Rish T, Hansen K, Fu YR, Park K. A study ofdrug release from homogeneous PLGA microstructures. Journal of Controlled Release. 2010;146:201–206. [PubMed: 20381555]
21. Decuzzi P, Godin B, Tanaka T, Lee SY, Chiappini C, Liu X, Ferrari M. Size and shape effects inthe biodistribution of intravascularly injected particles. J Control Release. 2010; 141:320–327.[PubMed: 19874859]
22. Huang M, Cai DD, Liu YH, Sun J, Wang JJ, Qin CX, Dai LX, Kazuo Y. Investigation of a-PVA/s-PVA hydrogels prepared by freezing-thawing method. Fibers and Polymers. 2012; 13:955–962.
23. Yang YY, Chung TS, Ng NP. Morphology, drug distribution, and in vitro release profiles ofbiodegradable polymeric microspheres containing protein fabricated by double-emulsion solventextraction/evaporation method. Biomaterials. 2001; 22:231–241. [PubMed: 11197498]
24. Gorr HM, Zueger JM, Barnard JA. Characteristic Size for Onset of Coffee-Ring Effect inEvaporating Lysozyme-Water Solution Droplets. Journal of Physical Chemistry B. 2012;116:12213–12220.
25. Okuzono T, Kobayashi M, Doi M. Final shape of a drying thin film. Physical Review E. 2009; 80
26. da Silva AA, de Matos JR, Formariz TP, Rossanezi G, Scarpa MV, do Egito EST, de Oliveira AG.Thermal behavior and stability of biodegradable spray-dried microparticles containingtriamcinolone. International Journal of Pharmaceutics. 2009; 368:45–55. [PubMed: 18992313]
27. Vay K, Friess W, Scheler S. A detailed view of microparticle formation by in-process monitoringof the glass transition temperature. European Journal of Pharmaceutics and Biopharmaceutics.2012; 81:399–408. [PubMed: 22426132]
28. Li J, Jiang GQ, Ding FX. Effects of polymer degradation on drug release from PLGA-mPEGmicroparticles: A dynamic study of microparticle morphological and physicochemical properties.Journal of Applied Polymer Science. 2008; 108:2458–2466.
29. Lee J, Oh YJ, Lee SK, Lee KY. Facile control of porous structures of polymer microspheres usingan osmotic agent for pulmonary delivery. Journal of Controlled Release. 2010; 146:61–67.[PubMed: 20553775]
Lu et al. Page 16
Int J Pharm. Author manuscript; available in PMC 2015 January 30.
NIH
-PA Author Manuscript
NIH
-PA Author Manuscript
NIH
-PA Author Manuscript
30. Sinclair W, Leane M, Clarke G, Dennis A, Tobyn M, Timmins P. Physical Stability andRecrystallization Kinetics of Amorphous Ibipinabant Drug Product by Fourier Transform RamanSpectroscopy. Journal of Pharmaceutical Sciences. 2011; 100:4687–4699. [PubMed: 21681752]
31. Schenderlein S, Luck M, Muller BW. Partial solubility parameters of poly(D,L-lactide-co-glycolide). International Journal of Pharmaceutics. 2004; 286:19–26. [PubMed: 15500999]
32. Ozalp Y, Ozdemir N, Kocagoz S, Hasirci V. Controlled release of vancomycin from biodegradablemicrocapsules. Journal of Microencapsulation. 2001; 18:89–110. [PubMed: 11201344]
33. Bodmeier R, McGinity JW. SOLVENT SELECTION IN THE PREPARATION OF POLY(DL-LACTIDE) MICROSPHERES PREPARED BY THE SOLVENT EVAPORATION METHOD.International Journal of Pharmaceutics. 1988; 43:179–186.
34. Wischke C, Schwendeman SP. Principles of encapsulating hydrophobic drugs in PLA/PLGAmicroparticles. International Journal of Pharmaceutics. 2008; 364:298– 327. [PubMed: 18621492]
35. Huangand X, Brazel CS. On the importance and mechanisms of burst release in matrix-controlleddrug delivery systems. Journal of Controlled Release. 2001; 73:121–136. [PubMed: 11516493]
36. Lee BK, Yun YH, Choi JS, Choi YC, Kim JD, Cho YW. Fabrication of drug-loaded polymermicroparticles with arbitrary geometries using a piezoelectric inkjet printing system. InternationalJournal of Pharmaceutics. 2012; 427:305–310. [PubMed: 22366486]
37. Sah H. Microencapsulation techniques using ethyl acetate as a dispersed solvent: Effects of itsextraction rate on the characteristics of PLGA microspheres. Journal of Controlled Release. 1997;47:233–245.
38. Hora MS, Rana RK, Nunberg JH, Tice TR, Gilley RM, Hudson ME. Release of human serum-albumin from poly(lactide-co-glycolide) microspheres. Pharm Res. 1990; 7:1190–1194. [PubMed:2293220]
39. Ohagan DT, Jeffery H, Davis SS. The preparation and characterization of poly(lactide-co-glycolide) microparticles .3. microparticle/polymer degradation rates and the in-vitro release of amodel protein. Int J Pharm. 1994; 103:37–45.
40. Matsumoto A, Matsukawa Y, Suzuki T, Yoshino H. Drug release characteristics of multi-reservoirtype microspheres with poly(DL-lactide-co-glycolide) and poly(DL-lactide). Journal of ControlledRelease. 2005; 106:172–180. [PubMed: 15936109]
41. Hong KH, Woo SH, Kang TJ. In vitro degradation and drug-release behavior of electrospun,fibrous webs of poly(lactic-co-glycolic acid). Journal of Applied Polymer Science. 2012; 124:209–214.
42. Engineer C, Parikh J, Raval A. Effect of copolymer ratio on hydrolytic degradation of poly(lactide-co-glycolide) from drug eluting coronary stents. Chemical Engineering Research & Design. 2011;89:328–334.
43. Kang E, Vedantham LK, Dadarat XM, Kwon IK, Sturek M, Park K. A drug-eluting stent fordelivery of signal pathway-specific 1,3-dipropyl-8-cyclopentyl xanthine (DPCPX). Mol Pharm.2009; 6:1110–1117. [PubMed: 19432454]
Lu et al. Page 17
Int J Pharm. Author manuscript; available in PMC 2015 January 30.
NIH
-PA Author Manuscript
NIH
-PA Author Manuscript
NIH
-PA Author Manuscript

Figure 1.Scanning electron microscope images of microparticles prepared using 87~89% hydrolyzedPVA templates of various average molecular weights: (A) 13,000~23,000 Da; (B)31,000~50,000 Da; and (C) 146,000~186,000 Da.
Lu et al. Page 18
Int J Pharm. Author manuscript; available in PMC 2015 January 30.
NIH
-PA Author Manuscript
NIH
-PA Author Manuscript
NIH
-PA Author Manuscript

Figure 2.Scanning electron microscope images of RIS-containing microparticles prepared using12.5% PLGA with intrinsic viscosity of 0.95~1.20 dL/g (A), PLGA-RIS (12.5%–12.5%)solution (B), and PLGA-RIS (6.2%–7.0%) solution (C).
Lu et al. Page 19
Int J Pharm. Author manuscript; available in PMC 2015 January 30.
NIH
-PA Author Manuscript
NIH
-PA Author Manuscript
NIH
-PA Author Manuscript

Figure 3.Fluorescent (A and B) and scanning electron microscope (C and D) images of microparticlesprior to (A) dissolving PVA templates and after collecting and drying (B–D).
Lu et al. Page 20
Int J Pharm. Author manuscript; available in PMC 2015 January 30.
NIH
-PA Author Manuscript
NIH
-PA Author Manuscript
NIH
-PA Author Manuscript

Figure 4.SEM image showing large pores formed on the surface of microparticles prepared by usinga co-solvent containing DCM.
Lu et al. Page 21
Int J Pharm. Author manuscript; available in PMC 2015 January 30.
NIH
-PA Author Manuscript
NIH
-PA Author Manuscript
NIH
-PA Author Manuscript

Figure 5.X-ray diffractograms comparing pure drug and encapsulated form of RIS (A), MPA (B), andPTX (C).
Lu et al. Page 22
Int J Pharm. Author manuscript; available in PMC 2015 January 30.
NIH
-PA Author Manuscript
NIH
-PA Author Manuscript
NIH
-PA Author Manuscript
Figure 6.Comparison of drug loading trends for RIS formulations A) effect of PLGA type based onL:G ratio; B) effect of PLGA concentration; C) effect of drug concentration; D) effect ofsolvent ratio. *: p<0.05; **: p<0.001
Lu et al. Page 23
Int J Pharm. Author manuscript; available in PMC 2015 January 30.
NIH
-PA Author Manuscript
NIH
-PA Author Manuscript
NIH
-PA Author Manuscript
Figure 7.Comparison of drug loading and encapsulation efficiency of model compounds. MPAmicroparticles were prepared from BA and DCM solvent mix (v/v=50:50) due to lowsolubility in EA
Lu et al. Page 24
Int J Pharm. Author manuscript; available in PMC 2015 January 30.
NIH
-PA Author Manuscript
NIH
-PA Author Manuscript
NIH
-PA Author Manuscript
Figure 8.Comparison of RIS drug release from formulation in phosphate buffer (pH 7.4, 37 °C) A)comparison by PLGA type (L:G); B) comparison by different solvent combinations
Lu et al. Page 25
Int J Pharm. Author manuscript; available in PMC 2015 January 30.
NIH
-PA Author Manuscript
NIH
-PA Author Manuscript
NIH
-PA Author Manuscript
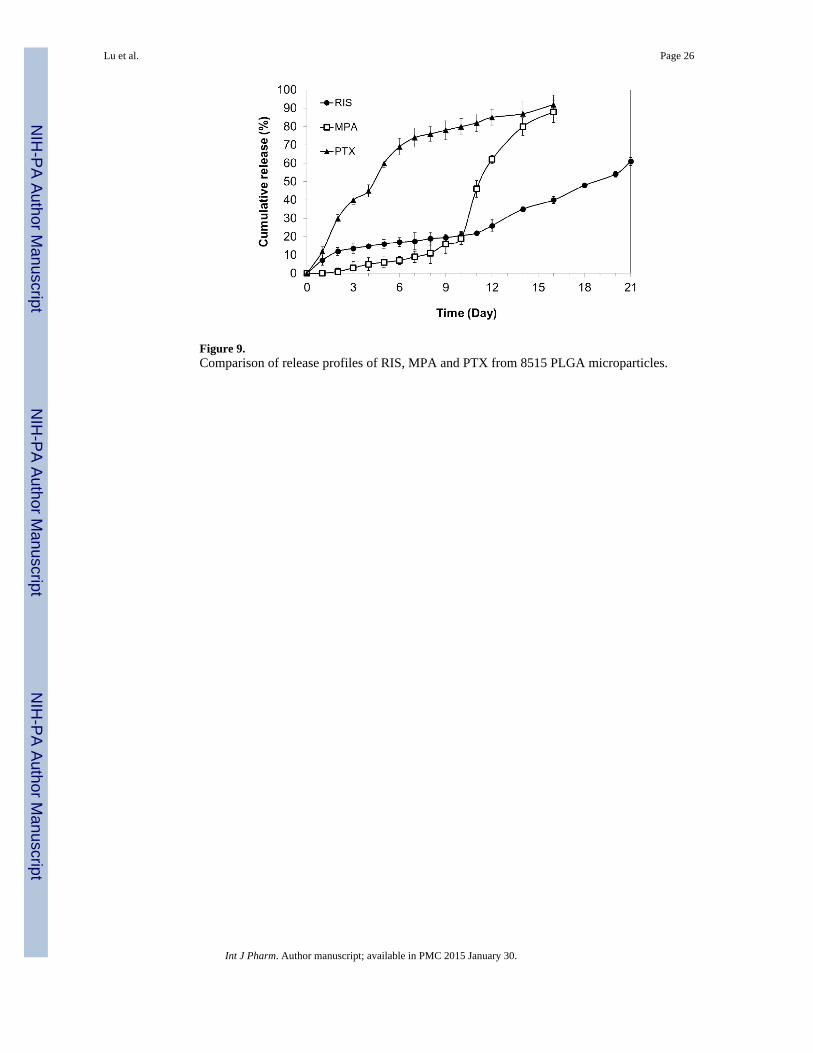
Figure 9.Comparison of release profiles of RIS, MPA and PTX from 8515 PLGA microparticles.
Lu et al. Page 26
Int J Pharm. Author manuscript; available in PMC 2015 January 30.
NIH
-PA Author Manuscript
NIH
-PA Author Manuscript
NIH
-PA Author Manuscript

Figure 10.Comparison of release profiles of RIS-loaded microparticles prepared using hydrogeltemplate and emulsion methods
Lu et al. Page 27
Int J Pharm. Author manuscript; available in PMC 2015 January 30.
NIH
-PA Author Manuscript
NIH
-PA Author Manuscript
NIH
-PA Author Manuscript

NIH
-PA Author Manuscript
NIH
-PA Author Manuscript
NIH
-PA Author Manuscript
Lu et al. Page 28
Table 1
Physicochemical properties of model drugs risperidone, methylprednisolone acetate and paclitaxel
Compound
RIS MPA PTX
Molecular Structure
Molecular Weight (g/mol) 410.5 416.5 853.9
Aqueous Solubility (μg/ml)* 211 120 0.3
LogP* 2.5 1.5 3.0
pKa* 8.24, 3.11 12.58 10.36
*Value obtained from DrugBank, based on experimental properties
Int J Pharm. Author manuscript; available in PMC 2015 January 30.
NIH
-PA Author Manuscript
NIH
-PA Author Manuscript
NIH
-PA Author Manuscript
Lu et al. Page 29
Tabl
e 2
Sum
mar
y of
for
mul
atio
ns a
nd p
artic
le s
ize
PL
GA
IV (
dL/g
)[P
LG
A]a
(w
/v %
)D
rug
[Dru
g]b
(w/v
%)
Solv
entc
Ave
rage
siz
e (μ
m)
PD
I
5050
0.26
~0.5
412
.5R
IS7.
0B
A, E
A10
.8 ±
5.0
0.12
0.55
~0.7
512
.59.
8 ±
0.9
0.13
0.95
~1.2
012
.58.
1 ±
4.3
0.24
6535
0.55
~0.7
512
.5R
IS7.
0B
A, E
A9.
3 ±
1.2
0.10
7525
0.55
~0.7
512
.5R
IS7.
0B
A, E
A9.
5 ±
1.2
0.12
8515
0.55
~0.7
512
.5R
IS7.
0B
A, E
A9.
2 ±
1.8
0.15
12.5
12.5
BA
, EA
7.4
± 3
.40.
29
12.5
4.3
BA
, EA
9.4
± 1
.30.
11
12.5
7.0
BA
, EA
(30
:70
v/v)
9.3
± 0
.90.
11
12.5
7.0
BA
, EA
(40
:60
v/v)
9.4
± 1
.90.
14
12.5
7.0
BA
, EA
(60
:40
v/v)
9.6
± 2
.20.
19
6.2
7.0
BA
, EA
7.7
± 3
.10.
21
25.0
7.0
BA
, EA
9.2
± 1
.10.
13
12.5
7.0
BA
, DC
M9.
1 ±
1.8
0.14
12.5
MPA
7.0
BA
, DC
M9.
6 ±
0.8
0.15
12.5
PTX
7.0
BA
, EA
9.7
± 0
.90.
11
a [PL
GA
]: P
LG
A c
once
ntra
tion;
cal
cula
ted
as w
eigh
t of
PLG
A p
er v
olum
e of
sol
vent
b [Dru
g]: d
rug
conc
entr
atio
n; c
alcu
late
d as
wei
ght o
f dr
ug p
er to
tal v
olum
e of
sol
vent
c Vol
ume
ratio
of
solv
ent s
yste
m is
50:
50 u
nles
s ot
herw
ise
spec
ifie
d
Int J Pharm. Author manuscript; available in PMC 2015 January 30.