night-caught and day-caught larvae of the california sardine
TRANSCRIPT
Night-Caught and Day-Caught Larvae of the California Sardine
Abstract. Some 70,000 larvae of the California sardine, collected from about 10,000 plankton hauls over the years 1950 to 1957, have been sorted by lengths and enumerated. The numbers of the day-caught larvae are very closely a numerical measure of the apparent mortality as indicated by the night-caught larvae. Over a consider- able interval of size, the night-caught larvae appear to be representative of the entire larval population, but the day-caught larvae may represent a frac- tion that is a measure of the natural mortality of the population.
The larvae of the California sardine (Sardinops caerulea) and other pelagic larvae have been routinely collected in some 1500 plankton samples annually taken throughout the California Cur- rent system. This sampling has been a part of the California Cooperative Fisheries Investigations Program since 1950.
The date, time, and location of the plankton hauls, the nature of the nets employed, the method of hauling, and the techniques of separation and count- ing have been described (1). Briefly, however, silk or nylon plankton nets (1 meter in diameter) are hauled obliquely from 150 meters to the sur- face over a 20-minute period at a speed of about 5.5 km/hr. The total fish
100,000[
,000
10
I ZSA I- . I 1- 1 1 -i-
I- - - I- 1 I-
000 =+__t_ __ __I_I_ __I I_I_- - -1--- '_ 1 liN _^ 'I 1
H-^-1 --1 - 1T\I -
I - i --I -- I I 1 1- __ -5I --
LENGTH 1 1m) LENGTH tmml
SARDINE LARVAE Z 1950-1957
I
larvae are separated into species and those of certain groups are measured and enumerated.
The sardine larvae are reported in 1-mm increments of length. The meas- urements and enumeration employed in the analysis in this study were deter- nmined and reported by the La Jolla Laboratory of the Bureau of Commer- cial Fisheries (1).
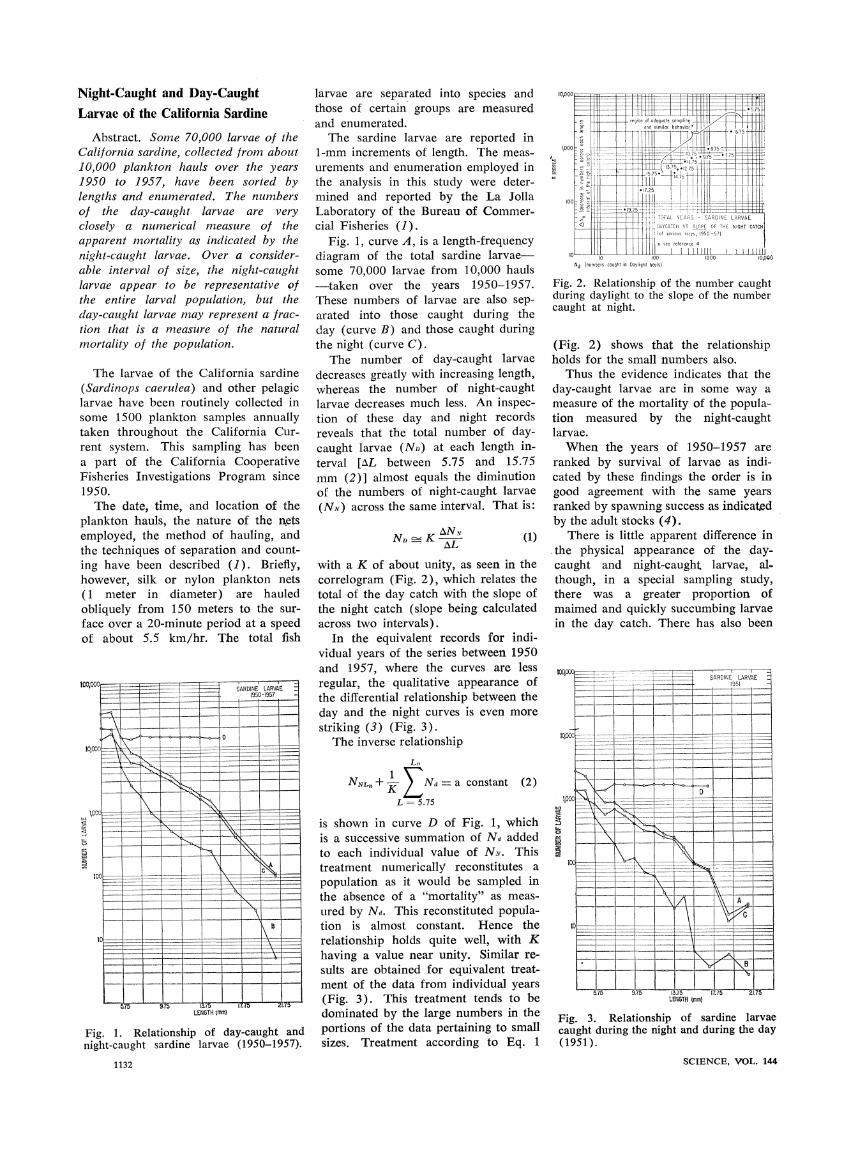
Fig. 1, curve A, is a length-frequency diagram of the total sardine larvae- some 70,000 larvae from 10,000 hauls --taken over the years 1950-1957. These numbers of larvae are also sep- arated into those caught during the day (curve B) and those caught during the night (curve C).
The number of day-caught larvae decreases greatly with increasing length, whereas the number of night-caught larvae decreases much less. An inspec- tion of these day and night records reveals that the total number of day- caught larvae (ND) at each length in-
terval [AL between 5.75 and 15.75 mm (2)] almost equals the diminution of the numbers of night-caught larvae
(NN) across the same interval. That is:
N A- KAN (1)
NDK AL
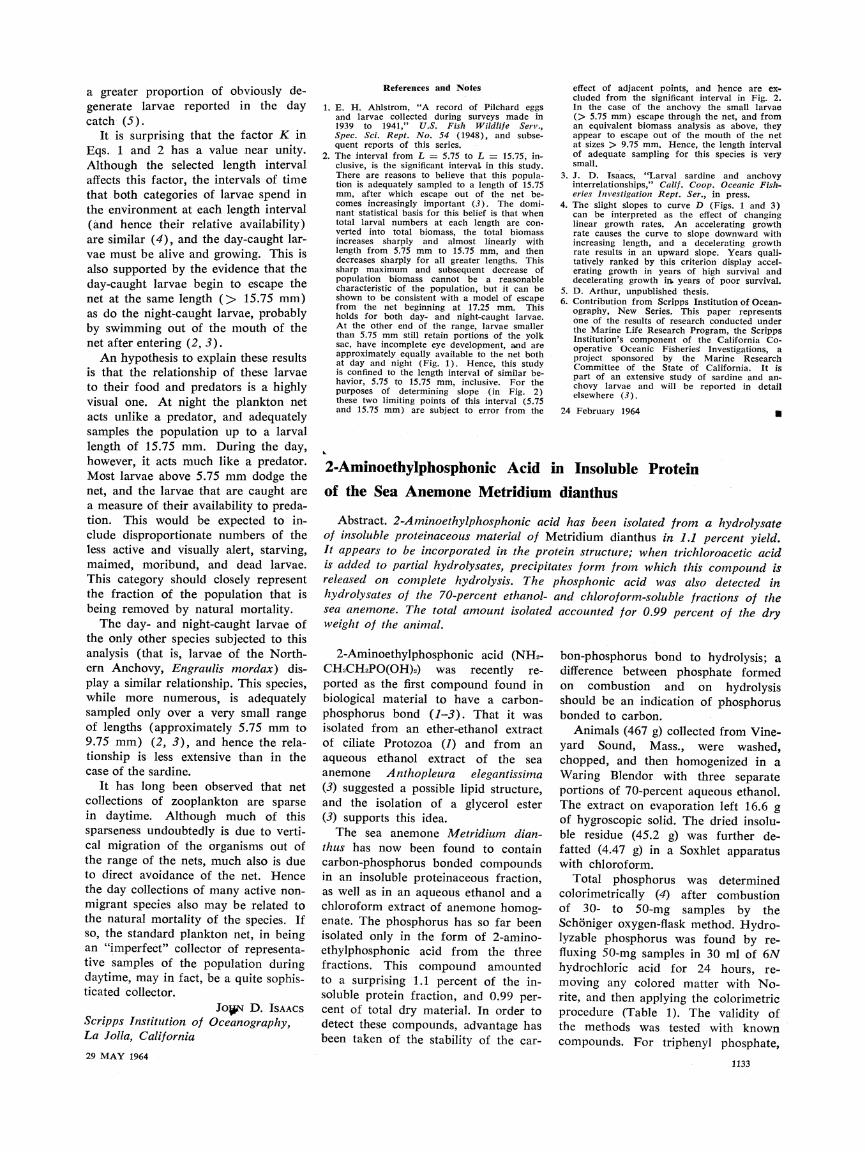
with a K of about unity, as seen in the correlogram (Fig. 2), which relates the total of the day catch with the slope of the night catch (slope being calculated across two intervals).
In the equivalent records for indi- vidual years of the series between 1950 and 1957, where the curves are less regular, the qualitative appearance of the differential relationship between the day and the night curves is even more striking (3) (Fig. 3).
The inverse relationship
Ln
NNL, + Nad =- a constant (2)
L = 5.75
is shown in curve D of Fig. 1, which is a successive summation of Nd added to each individual value of NN. This treatment numerically reconstitutes a population as it would be sampled in the absence of a "mortality" as meas- ured by NR,. This reconstituted popula- tion is almost constant. Hence the relationship holds quite well, with K having a value near unity. Similar re- sults are obtained for equivalent treat- ment of the data from individual years (Fig. 3). This treatment tends to be dominated by the large numbers in the portions of the data pertaining to small sizes. Treatment according to Eq. 1
ILIuu,ur i - I I I I
1,ooc
reo o f_ rofdequte sompling ha / =
O.and similar behravior * ,, l l
'75 -
0755.77
E~~~~~~~~~~17 .17.25
.1925 1 5- -
'- -- |
| - 1- J TtAL YEAVS - SARDINE LARVAE
<T | i | Lt I 0
DAYCATCi VS SLOPE OF THE NIGHT CATCH
X 1 | ! I;'l(of vorious sizes, 1950-57)
_ _lil i lll* seereference 4 l
10 100
Nd (numbers cought in Doylighl hauls)
Fig. 2. Relationship of the number caught during daylight to the slope of the number caught at night.
(Fig. 2) shows that the relationship holds for the small numbers also.
Thus the evidence indicates that the day-caught larvae are in some way a measure of the mortality of the popula- tion measured by the night-caught larvae.
When the years of 1950-1957 are ranked by survival of larvae as indi- cated by these findings the order is in good agreement with the same years ranked by spawning success as indicated by the adult stocks (4).
There is little apparent difference in the physical a.ppearance of the day- caught and night-caught larvae, al- though, in a special sampling study, there was a greater proportion of maimed and quickly succumbing larvae in the day catch. There has also been
.--l 7--- - t
- = _
___ _. - t - SARDINE LARVAE 1951
5,1 IO b 1O.75 lt.t~ Z,i, 4 LENGTH (mm}
Fig. 3. Relationship of sardine larvae caught during the night and during the day (1951).
SCIENCE, VOL. 144
Fig. 1. Relationship of day-caught and night-caught sardine larvae (1950-1957).
1132
1o, oooL I I _ _- i I I
t~~ ~~"~ _ t__ - f--- _ ---*-- _
_______ V B _
~oo ?0|D
loCo-- _-4 i- --t
aI? N_N-t--t - t 1 -
fq
!
I,q
IX IJ
10(
10,o
C) it
O
1,
a greater proportion of obviously de- generate larvae reported in the day catch (5).
It is surprising that the factor K in Eqs. 1 and 2 has a value near unity. Although the selected length interval affects this factor, the intervals of time that both categories of larvae spend in the environment at each length interval (and hence their relative availability) are similar (4), and the day-caught lar- vae must be alive and growing. This is also supported by the evidence that the day-caught larvae begin to escape the net at the same length (> 15.75 mm) as do the night-caught larvae, probably by swimming out of the mouth of the net after entering (2, 3).
An hypothesis to explain these results is that the relationship of these larvae to their food and predators is a highly visual one. At night the plankton net acts unlike a predator, and adequately samples the population up to a larval length of 15.75 mm. During the day, however, it acts much like a predator. Most larvae above 5.75 mm dodge the net, and the larvae that are caught are a measure of their availability to preda- tion. This would be expected to in- clude disproportionate numbers of the less active and visually alert, starving, maimed, moribund, and dead larvae. This category should closely represent the fraction of the population that is being removed by natural mortality.
The day- and night-caught larvae of the only other species subjected to this analysis (that is, larvae of the North- ern Anchovy, Engraulis mordax) dis- play a similar relationship. This species, while more numerous, is adequately sampled only over a very small range of lengths (approximately 5.75 mm to 9.75 mm) (2, 3), and hence the rela- tionship is less extensive than in the case of the sardine.
It has long been observed that net collections of zooplankton are sparse in daytime. Although much of this sparseness undoubtedly is due to verti- cal migration of the organisms out of the range of the nets, much also is due to direct avoidance of the net. Hence the day collections of many active non- migrant species also may be related to the natural mortality of the species. If so, the standard plankton net, in being an "imperfect" collector of representa- tive samples of the population during
a greater proportion of obviously de- generate larvae reported in the day catch (5).
It is surprising that the factor K in Eqs. 1 and 2 has a value near unity. Although the selected length interval affects this factor, the intervals of time that both categories of larvae spend in the environment at each length interval (and hence their relative availability) are similar (4), and the day-caught lar- vae must be alive and growing. This is also supported by the evidence that the day-caught larvae begin to escape the net at the same length (> 15.75 mm) as do the night-caught larvae, probably by swimming out of the mouth of the net after entering (2, 3).
An hypothesis to explain these results is that the relationship of these larvae to their food and predators is a highly visual one. At night the plankton net acts unlike a predator, and adequately samples the population up to a larval length of 15.75 mm. During the day, however, it acts much like a predator. Most larvae above 5.75 mm dodge the net, and the larvae that are caught are a measure of their availability to preda- tion. This would be expected to in- clude disproportionate numbers of the less active and visually alert, starving, maimed, moribund, and dead larvae. This category should closely represent the fraction of the population that is being removed by natural mortality.
The day- and night-caught larvae of the only other species subjected to this analysis (that is, larvae of the North- ern Anchovy, Engraulis mordax) dis- play a similar relationship. This species, while more numerous, is adequately sampled only over a very small range of lengths (approximately 5.75 mm to 9.75 mm) (2, 3), and hence the rela- tionship is less extensive than in the case of the sardine.
It has long been observed that net collections of zooplankton are sparse in daytime. Although much of this sparseness undoubtedly is due to verti- cal migration of the organisms out of the range of the nets, much also is due to direct avoidance of the net. Hence the day collections of many active non- migrant species also may be related to the natural mortality of the species. If so, the standard plankton net, in being an "imperfect" collector of representa- tive samples of the population during daytime, may in fact, be a quite sophis- ticated collector.
JoN D. ISAACS Scripps Institution of Oceanography, La Jolla, California
29 MAY 1964
daytime, may in fact, be a quite sophis- ticated collector.
JoN D. ISAACS Scripps Institution of Oceanography, La Jolla, California
29 MAY 1964
References and Notes
1. E. H. Ahlstrom, "A record of Pilchard eggs and larvae collected during surveys made in 1939 to 1941," U.S. Fish Wildlife Serv., Spec. Sci. Rept. No. 54 (1948), and subse- quent reports of this series.
2. The interval from L = 5.75 to L = 15.75, in- clusive, is the significant interval in this study. There are reasons to believe that this popula- tion is adequately sampled to a length of 15.75 mm, after which escape out of the net be- comes increasingly important (3). The domi- nant statistical basis for this belief is that when total larval numbers at each length are con- verted into total biomass, the total biomass increases sharply and almost linearly with length from 5.75 mm to 15.75 mm, and then decreases sharply for all greater lengths. This sharp maximum and subsequent decrease of population biomass cannot be a reasonable characteristic of the population, but it can be shown to be consistent with a model of escape from the net beginning at 17.25 mm. This holds for both day- and night-caught larvae. At the other end of the range, larvae smaller than 5.75 mm still retain portions of the yolk sac, have incomplete eye development, and are approximately equally available to the net both at day and night (Fig. 1). Hence, this study is confined to the length interval of similar be- havior, 5.75 to 15.75 mm, inclusive. For the purposes of determining slope (in Fig. 2) these two limiting points of this interval (5.75 and 15.75 mm) are subject to error from the
released on complete hydrolysis. The hydrolysates of the 70-percent ethanol- sea anemone. The total amount isolated weight of the animal.
2-Aminoethylphosphonic acid (NH2- CH2CH2PO(OH)2) was recently re- ported as the first compound found in biological material to have a carbon- phosphorus bond (1-3). That it was isolated from an ether-ethanol extract of ciliate Protozoa (1) and from an aqueous ethanol extract of the sea anemone Anthopleura elegantissima (3) suggested a possible lipid structure, and the isolation of a glycerol ester (3) supports this idea.
The sea anemone Metridium dian- thus has now been found to contain carbon-phosphorus bonded compounds in an insoluble proteinaceous fraction, as well as in an aqueous ethanol and a chloroform extract of anemone homog- enate. The phosphorus has so far been isolated only in the form of 2-amino- ethylphosphonic acid from the three fractions. This compound amounted to a surprising 1.1 percent of the in- soluble protein fraction, and 0.99 per- cent of total dry material. In order to detect these compounds, advantage has been taken of the stability of the car-
effect of adjacent points, and hence are ex- cluded from the significant interval in Fig. 2. In the case of the anchovy the small larvae (> 5.75 mm) escape through the net, and from an equivalent biomass analysis as above, they appear to escape out of the mouth of the net at sizes > 9.75 mm. Hence, the length interval of adequate sampling for this species is very small.
3. J. D. Isaacs, "Larval sardine and anchovy interrelationships," Calif. Coop. Oceanic Fish- eries Investigation Rept. Ser., in press.
4. The slight slopes to curve D (Figs. 1 and 3) can be interpreted as the effect of changing linear growth rates. An accelerating growth rate causes the curve to slope downward with increasing length, and a decelerating growth rate results in an upward slope. Years quali- tatively ranked by this criterion display accel- erating growth in years of high survival and decelerating growth in. years of poor survival.
5. D. Arthur, unpublished thesis. 6. Contribution from Scripps Institution of Ocean-
ography, New Series. This paper represents one of the results of research conducted under the Marine Life Research Program, the Scripps Institution's component of the California Co- operative Oceanic Fisheries Investigations, a project sponsored by the Marine Research Committee of the State of California. It is part of an extensive study of sardine and an- chovy larvae and will be reported in detail elsewhere (3).
24 February 1964 U
phosphonic acid was also detected in and chloroform-soluble fractions of the
I accounted for 0.99 percent of the dry
bon-phosphorus bond to hydrolysis; a difference between phosphate formed on combustion and on hydrolysis should be an indication of phosphorus bonded to carbon.
Animals (467 g) collected from Vine- yard Sound, Mass., were washed, chopped, and then homogenized in a Waring Blendor with three separate portions of 70-percent aqueous ethanol. The extract on evaporation left 16.6 g of hygroscopic solid. The dried insolu- ble residue (45.2 g) was further de- fatted (4.47 g) in a Soxhlet apparatus with chloroform.
Total phosphorus was determined colorimetrically (4) after combustion of 30- to 50-mg samples by the Schoniger oxygen-flask method. Hydro- lyzable phosphorus was found by re- fluxing 50-mg samples in 30 ml of 6N hydrochloric acid for 24 hours, re- moving any colored matter with No- rite, and then applying the colorimetric procedure (Table 1). The validity of the methods was tested with known compounds. For triphenyl phosphate,
1133
2-Aminoethylphosphonic Acid in Insoluble Protein
of the Sea Anemone Metridium dianthus
Abstract. 2-Aminoethylphosphonic acid has been isolated from a hydrolysate of insoluble proteinaceous material of Metridium dianthus in 1.1 percent yield. It appears to be incorporated in the protein structure; when trichloroacetic acid is added to partial hydrolysates, precipitates form from which this compound is