nigeria before gmb govt
TRANSCRIPT

NIGERIA,
PRIOR TO GMB
GOVERNMENT:
INTERNATIONAL
RANKINGS
J U S T I C E , P E A C E , A N D U N I T Y

This is a compilation of different ratings by
international organizations on Nigeria in respect to
how Nigeria ranks/scores in Corruption, Governance,
Health, Economy, Democracy, Leadership, etc. in
relation with other countries of the world.
A new Government will be taking over the mantle of
leadership of the Nigerian State, this compilation is to
provide an empirical measurement of how the new
government performs as would be evidenced in
subsequent ratings of selected international
organizations in subsequent release of their reports.
PROVIDING UNBIASED & INDEPENDENT EMPIRICAL
EVIDENCE OF GOOD GOVERNANCE FOR EFFECTIVE
CITIZENS’ APPRAISAL OF GOVERNMENT’S
PERFORMANCE.

SELECTED INTERNATIONAL RATINGS

WORLD ECONOMIC FORUMThe World Economic Forum publishes the Global Competitive Index (GCI)
report that measures the set of institutions, policies, and factors that set the
sustainable current and medium-term levels of economic prosperity
12 PILLARS OF GCI 2006 2007 2008 2009 2010 2011 2012 2013 2014
INSTITUTIONS 3.3 3.3 3.4 3.3 3.2 3 3.3 3.1 3INFRASTRUCTURE 2.4 2.2 2.2 2.3 2 2 2.3 2.3 2.1MACROECONOMIC ENVIRONMENT 4.8 5.6 5.7 5.4 4.3 4 5.2 5.2 4.6
HEALTH & PRIMARY EDUCATION 3.6 3.6 3.6 3 3 3.3 3.2 3 3HIGHER EDUCATION & TRAINING 2.9 3.0 3.1 3 3 3.2 3.3 3 2.9
GOODS MARKET EFFICIENCY 4.1 4.2 4.4 4.2 4 4.2 4.2 4.1 4.2LABOR MARKET EFFICIENCY 4.1 4.2 4.4 4.4 4.3 4.4 4.5 4.5 4.5
FINANCIAL MARKET DEVELOPMENT 4.2 4.5 4.5 4.4 4 3.9 4.1 4 4.1
TECHNOLOGICAL READINESS 2.5 2.6 2.9 2.9 3 3 3.1 3.1 3MARKET SIZE 4.2 4.0 4.4 4.5 4.6 4 4.6 4.7 4.7
BUSINESS SOPHISTICATION 3.9 4.0 4.2 4 3.8 4 4 3.9 3.8INNOVATION 3.2 3.2 3.2 3.1 2.9 3 3.1 3 2.8
WEF measures countries competitiveness using the 12 Pillars above. Each
Country is Ranked based on her performance against other countries,
however a better measure of a country’s performance is its Score which is
from 1 to 7, 1 being poor while 7 is best.
NIGERIA IS CURRENTLY RANKED 127 OF 144 COUNTRIES, WITH
A SCORE OF 3.4 WHICH IS LESS THAN THE AVERAGE SCORE.
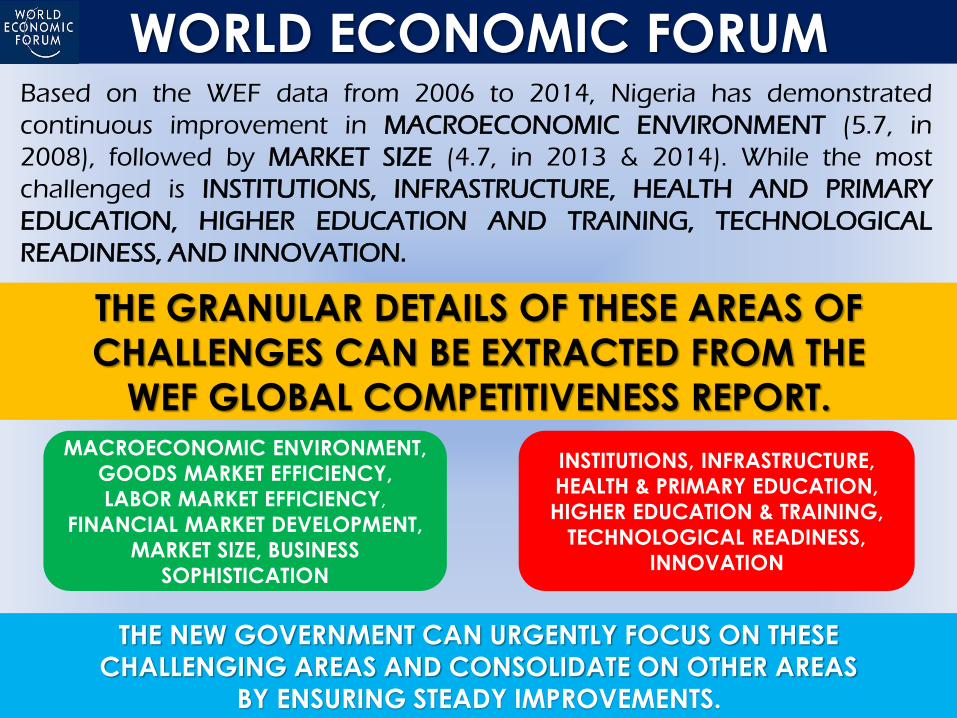
WORLD ECONOMIC FORUMBased on the WEF data from 2006 to 2014, Nigeria has demonstrated
continuous improvement in MACROECONOMIC ENVIRONMENT (5.7, in
2008), followed by MARKET SIZE (4.7, in 2013 & 2014). While the most
challenged is INSTITUTIONS, INFRASTRUCTURE, HEALTH AND PRIMARY
EDUCATION, HIGHER EDUCATION AND TRAINING, TECHNOLOGICAL
READINESS, AND INNOVATION.
THE GRANULAR DETAILS OF THESE AREAS OF
CHALLENGES CAN BE EXTRACTED FROM THE
WEF GLOBAL COMPETITIVENESS REPORT.
MACROECONOMIC ENVIRONMENT,
GOODS MARKET EFFICIENCY,
LABOR MARKET EFFICIENCY,
FINANCIAL MARKET DEVELOPMENT,
MARKET SIZE, BUSINESS
SOPHISTICATION
INSTITUTIONS, INFRASTRUCTURE,
HEALTH & PRIMARY EDUCATION,
HIGHER EDUCATION & TRAINING,
TECHNOLOGICAL READINESS,
INNOVATION
THE NEW GOVERNMENT CAN URGENTLY FOCUS ON THESE
CHALLENGING AREAS AND CONSOLIDATE ON OTHER AREAS
BY ENSURING STEADY IMPROVEMENTS.

INDEX OF ECONOMIC FREEDOMThe Index of Economic Freedom is an annual index and ranking created by
The Heritage Foundation and The Wall Street Journal in 1995 to measure the
degree of economic freedom in the world's nations. (Wikipedia)
INDEX OF ECONOMIC FREEDOM 2011 2013 2014 2015
PROPERTY RIGHTS 30 30.0 30 30.0
FREEDOM FROM CORRUPTION 25 24.0 22.7 25.0
FISCAL FREEDOM 84.4 82.6 85.0 85.2
GOVERNMENT SPENDING 73 74.6 74.5 76.1
BUSINESS FREEDOM 51.6 55.7 48.0 48.3
LABOR FREEDOM 84.5 67.2 66.4 77.7
MONETARY FREEDOM 73.5 73.3 73.1 70.4
TRADE FREEDOM 65 63.9 63.8 63.8
INVESTMENT FREEDOM 40 40.0 40 40.0
FINANCIAL FREEDOM 40 40.0 40 40.0
56.7 55.1 54.3 55.6
NIGERIA IS CURRENTLY RANKED 120 OF 178 COUNTRIES, WITH
A SCORE OF 56.7 WHICH IS AN AVERAGE SCORE.

INDEX OF ECONOMIC FREEDOM
Rule of law (property rights, freedom from corruption);
Government size (fiscal freedom, government spending);
Regulatory efficiency (business freedom, labor freedom, monetary freedom); and
Market openness (trade freedom, investment freedom, financial freedom).
Based on the available data from 2011 to 2015, Nigeria has maintained some
measure of steady balance in FISCAL FREEDOM, GOVERNMENT SPENDING,
LABOR FREEDOM, MONETARY FREEDOM, AND TRADE FREEDOM.
However, there seems to be a lull in the following areas PROPERTY RIGHT,
FREEDOM FROM CORRUPTION, INVESTMENT FREEDOM, AND FINANCIAL
FREEDOM.
THE GRANULAR DETAILS OF THESE AREAS OF
CHALLENGES CAN BE EXTRACTED FROM THE INDEX OF
ECONOMIC FREEDOM REPORT.
FISCAL FREEDOM,
GOVERNMENT SPENDING,
LABOR FREEDOM, MONETARY FREEDOM, TRADE FREEDOM
PROPERTY RIGHTS, FREEDOM
FROM CORRUPTION, BUSINESS
FREEDOM, INVESTMENT
FREEDOM, FINANCIAL
FREEDOM

HUMAN DEVELOPMENT INDEXThe Human Development Index (HDI) is a composite statistic of
life expectancy, education, and income indices used to rank
countries into four tiers of human development.. (Wikipedia)
HUMAN DEVELOPMENT INDEX 2011 2012 2013 2014
LIFE EXPECTANCY AT BIRTH 51.9 52.3 52.5 52.5
MEAN YEARS OF SCHOOLING (YEAR) 5 5.2 5.2
EXPECTED YEARS OF SCHOOLING (YEAR) 8.9 9 9
GROSS NATIONAL INCOME (GNI) PER CAPITA 2,069 2,102 5,353 5,353
0.459 0.500 0.504 0.504
NIGERIA IS CURRENTLY RANKED 152 OF 187 COUNTRIES, WITH
A SCORE OF 0.504 WHICH IS AN AVERAGE SCORE.

RULE OF LAW INDEXThe World Justice Project publishes The Rule of Law Index which provides
the foundation for communities of opportunity and equity – communities
that offer sustainable economic development, accountable government, and
respect for fundamental rights. (Wikipedia)
RULE OF LAW 2010 2011 2013 2014
CONSTRAINTS ON GOVT. POWERS 0.39 0.50 0.45 0.47
ABSENCE OF CORRUPTION 0.46 0.41 0.25 0.26
OPEN GOVERNMENT 0.30 0.34 0.35 0.40
FUNDAMENTAL RIGHTS 0.42 0.49 0.45 0.42
ORDER AND SECURITY 0.36 0.54 0.47 0.36
REGULATORY ENFORCEMENT 0.51 0.46 0.42 0.40
CIVIL JUSTICE 0.59 0.57 0.53 0.50
CRIMINAL JUSTICE 0.42 0.41 0.28 0.31
Clearly, the best Nigeria has been able to achieve OPPORTUNITY and
EQUITY is in CIVIL JUSTICE and ORDER AND SECURITY. Majority of the
other measures are below the average score of 0.50.
FORTUNATELY, THE VICE–PRESIDENT-ELECT OF THE INCOMING GOVERNMENT
IS A LEGAL EXPERT AND MUCH IS EXPECTED IN THAT REGARD.
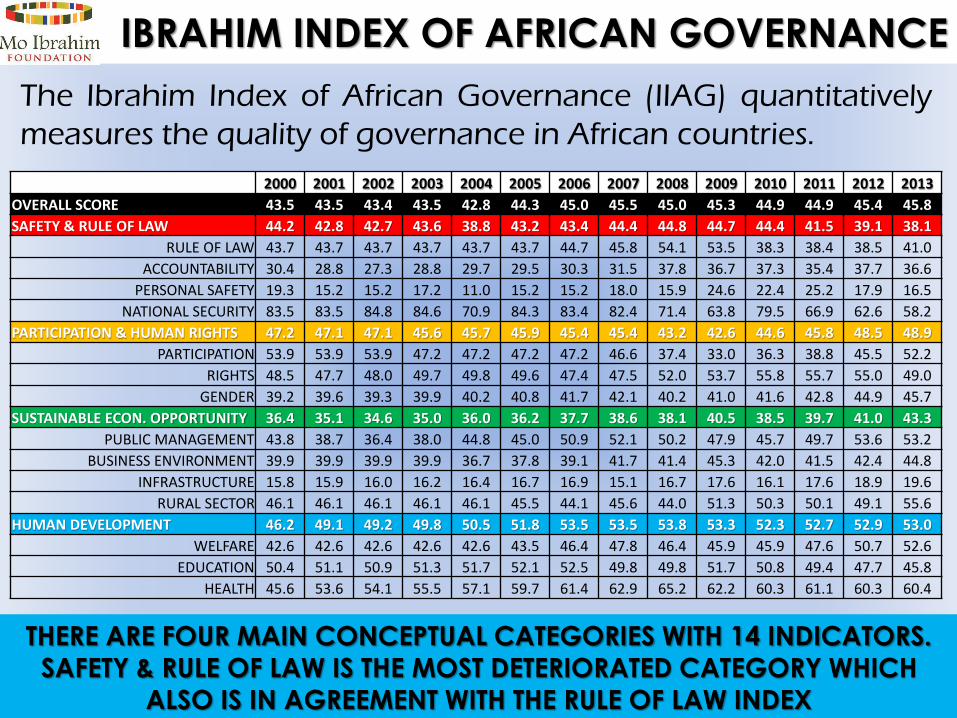
IBRAHIM INDEX OF AFRICAN GOVERNANCE
The Ibrahim Index of African Governance (IIAG) quantitatively
measures the quality of governance in African countries.
2000 2001 2002 2003 2004 2005 2006 2007 2008 2009 2010 2011 2012 2013
OVERALL SCORE 43.5 43.5 43.4 43.5 42.8 44.3 45.0 45.5 45.0 45.3 44.9 44.9 45.4 45.8
SAFETY & RULE OF LAW 44.2 42.8 42.7 43.6 38.8 43.2 43.4 44.4 44.8 44.7 44.4 41.5 39.1 38.1
RULE OF LAW 43.7 43.7 43.7 43.7 43.7 43.7 44.7 45.8 54.1 53.5 38.3 38.4 38.5 41.0
ACCOUNTABILITY 30.4 28.8 27.3 28.8 29.7 29.5 30.3 31.5 37.8 36.7 37.3 35.4 37.7 36.6
PERSONAL SAFETY 19.3 15.2 15.2 17.2 11.0 15.2 15.2 18.0 15.9 24.6 22.4 25.2 17.9 16.5
NATIONAL SECURITY 83.5 83.5 84.8 84.6 70.9 84.3 83.4 82.4 71.4 63.8 79.5 66.9 62.6 58.2
PARTICIPATION & HUMAN RIGHTS 47.2 47.1 47.1 45.6 45.7 45.9 45.4 45.4 43.2 42.6 44.6 45.8 48.5 48.9
PARTICIPATION 53.9 53.9 53.9 47.2 47.2 47.2 47.2 46.6 37.4 33.0 36.3 38.8 45.5 52.2
RIGHTS 48.5 47.7 48.0 49.7 49.8 49.6 47.4 47.5 52.0 53.7 55.8 55.7 55.0 49.0
GENDER 39.2 39.6 39.3 39.9 40.2 40.8 41.7 42.1 40.2 41.0 41.6 42.8 44.9 45.7
SUSTAINABLE ECON. OPPORTUNITY 36.4 35.1 34.6 35.0 36.0 36.2 37.7 38.6 38.1 40.5 38.5 39.7 41.0 43.3
PUBLIC MANAGEMENT 43.8 38.7 36.4 38.0 44.8 45.0 50.9 52.1 50.2 47.9 45.7 49.7 53.6 53.2
BUSINESS ENVIRONMENT 39.9 39.9 39.9 39.9 36.7 37.8 39.1 41.7 41.4 45.3 42.0 41.5 42.4 44.8
INFRASTRUCTURE 15.8 15.9 16.0 16.2 16.4 16.7 16.9 15.1 16.7 17.6 16.1 17.6 18.9 19.6
RURAL SECTOR 46.1 46.1 46.1 46.1 46.1 45.5 44.1 45.6 44.0 51.3 50.3 50.1 49.1 55.6
HUMAN DEVELOPMENT 46.2 49.1 49.2 49.8 50.5 51.8 53.5 53.5 53.8 53.3 52.3 52.7 52.9 53.0
WELFARE 42.6 42.6 42.6 42.6 42.6 43.5 46.4 47.8 46.4 45.9 45.9 47.6 50.7 52.6
EDUCATION 50.4 51.1 50.9 51.3 51.7 52.1 52.5 49.8 49.8 51.7 50.8 49.4 47.7 45.8
HEALTH 45.6 53.6 54.1 55.5 57.1 59.7 61.4 62.9 65.2 62.2 60.3 61.1 60.3 60.4
THERE ARE FOUR MAIN CONCEPTUAL CATEGORIES WITH 14 INDICATORS.
SAFETY & RULE OF LAW IS THE MOST DETERIORATED CATEGORY WHICH ALSO IS IN AGREEMENT WITH THE RULE OF LAW INDEX

IBRAHIM INDEX OF AFRICAN GOVERNANCE2000 2001 2002 2003 2004 2005 2006 2007 2008 2009 2010 2011 2012 2013
RULE OF LAW 43.7 43.7 43.7 43.7 43.7 43.7 44.7 45.8 54.1 53.5 38.3 38.4 38.5 41.0
ACCOUNTABILITY 30.4 28.8 27.3 28.8 29.7 29.5 30.3 31.5 37.8 36.7 37.3 35.4 37.7 36.6
PERSONAL SAFETY 19.3 15.2 15.2 17.2 11.0 15.2 15.2 18.0 15.9 24.6 22.4 25.2 17.9 16.5
NATIONAL SECURITY 83.5 83.5 84.8 84.6 70.9 84.3 83.4 82.4 71.4 63.8 79.5 66.9 62.6 58.2
RIGHTS 48.5 47.7 48.0 49.7 49.8 49.6 47.4 47.5 52.0 53.7 55.8 55.7 55.0 49.0
BUSINESS ENVIRONMENT 39.9 39.9 39.9 39.9 36.7 37.8 39.1 41.7 41.4 45.3 42.0 41.5 42.4 44.8
INFRASTRUCTURE 15.8 15.9 16.0 16.2 16.4 16.7 16.9 15.1 16.7 17.6 16.1 17.6 18.9 19.6
EDUCATION 50.4 51.1 50.9 51.3 51.7 52.1 52.5 49.8 49.8 51.7 50.8 49.4 47.7 45.8
HEALTH 45.6 53.6 54.1 55.5 57.1 59.7 61.4 62.9 65.2 62.2 60.3 61.1 60.3 60.4
The most affected indicators are INFRASTRUCTURE AND PERSONAL
SECURITY. In addition; the between 2008 and 2013, the RULE OF
LAW indicator has dropped 13points from 54 to 41. This is followed
by PERSONAL SECURITY, NATIONAL SECURITY, EDUCATION, AND
RIGHTS.
PARTICIPATION, GENDER,
PUBLIC MANAGEMENT,
INFRASTRUCTURE, RURAL
SECTOR, WELFARE
RULE OF LAW, ACCOUNTABILITY,
PERSONAL SAFETY, NATIONAL
SECURITY, RIGHTS, BUSINESS
ENVIRONMENT, INFRASTRUCTURE,
EDUCATION, HEALTH

SOCIAL PROGRESS INDEXThe Social Progress Index (SPI) measures the extent to which countries
provide for the social and environmental needs of their citizens. The SPI
measures the well-being of a society by observing social and environmental
outcomes directly rather than the economic factors. (Wikipedia)
SOCIAL PROGRESS INDEX 2013 2014BASIC HUMAN NEEDS 27.96 36.57FOUNDATIONS OF WELLBEING 37.04 58.08OPPORTUNITY 35.19 33.29
33.39 42.65
IN 2013, NIGERIA WAS RANKED 49 OF 50 COUNTRIES WITH 33.39
POINTS. IN 2014, NIGERIA IS 123 OF 132 COUNTRIES WITH 42.65 POINTS
IS NIGERIA A LAND OF REDUCING
OPPORTUNITY?

CORRUPTION PERCEPTIONS INDEXTransparency International (TI) started the Corruption
Perceptions Index (CPI) as a composite indicator used to
measure perceptions of corruption in the public sector in
different countries around the world.
ALL TIME BEST CORRUPTION PERCEPTIONS INDEX WAS
IN 2008. THIS INDEX IS REALLY GOING TO BE A
PERFORMANCE METRIC FOR THIS NEW GOVERNMENT
YEAR 1999 2000 2001 2002 2003 2004 2005 2006 2007 2008 2009 2010 2011 *2012 2013 2014
RANK/TOTAL
98/99
90/90
90/91
101/102
132/133
144/146
152/159
142/163
147/179
121/180
130/180
134/178
143/182
139/176
144/177
136/174
PERCENTILE 99% 100% 99% 99% 99% 99% 96% 87% 82% 67% 72% 75% 79% 79% 81% 78%
While Nigeria was in Bottom 5% most corrupt Nations in 1998, we
have gradually moved to a better part of Bottom 22% as at 2014.
This basically mean Nigeria had 95% chance of appearing on the
list of most corrupt Nations in 1998 but now have 78% in 2014.
This gives a differential of about 17% - IMPROVEMENT.

These selected international indexes basically covers areas Citizens
would expect their governments to come up to par with other
countries as well as deliver good governance. The metrics can also
serve as a guide to how governments should operate, determine
areas needing urgent attention, and ultimately provide an objective
measure of the their performance..
Hopefully, everyone can refer to this presentation to see how well
Nigeria progresses under the leadership of General Muhammadu
Buhari of the All Progressives Congress.
REMEMBER, GOVERNMENTS
BECOME ACCOUNTABLE &
EFFECTIVE IF CITIZENS HOLD THEM
ACCOUNTABLE & RESPONSIBLE!
Analysis by: Wale Micaiah
m: 08078001800
w: www.statisense.com
w: www.walemicaiah.com
Freely share, freely use and freely
acknowledge the source – © Wale Micaiah
All data used for analysis are from
the respective international
agencies whose reports have
been used for this presentation..