niederhoffer & kenner - practical speculation
DESCRIPTION
how to speculateTRANSCRIPT

PracticalSpeculation
VICTOR NIEDERHOFFERLAUREL KENNER
John Wiley & Sons, Inc.
nied_a01fm.qxd 1/24/03 10:40 AM Page i

nied_a01fm.qxd 1/24/03 10:40 AM Page i

More Praise for Practical Speculation
“Practical Speculation distills an unusual breadth of hard-won (and costly) ex-
perience and insight into an immensely readable and instructive book. Bulls
and Bears are drawn and quartered alike by the authors’ exquisitely honed
quantitative scalpel.”
Stephen M. Stigler
Professor of Statistics
University of Chicago
“In my judgment, Victor Niederhoffer is the single most insightful speculator
in the world. This new book displays Victor’s unique gift for recognizing the
subtle confluence of seemingly disparate events. Although this book is par-
tially a guide on investment strategy, it is principally a remarkable explanation
of market function.”
Herbert London
John M. Olin Professor of Humanities, New York University
President, Hudson Institute
“Whatever Victor Niederhoffer writes is worth reading—not once but at least
twice. His analysis of markets is as brilliant as it is unorthodox. Readers will
discover a host of nuggets in Practical Speculation that will stretch their minds
and tease their imaginations.”
Lawrence S. Ritter
John M. Schiff Professor of Finance Emeritus
New York University
“Victor Niederhoffer outdoes himself beginning with the first paragraph of
the introduction. Victor and Laurel uniquely see the interrelationships and de-
pendencies among the complex factors that are daily life and are able to inter-
pret observations in terms of how people will react to the sequences of events.
Practical Speculation is an extraordinary insight into the thinking of probably
the most original thinker of our time.”
Kenneth W. Rendell
Founder, Kenneth W. Rendell, Inc.
“Vic and Laurel are breathtakingly insightful. They paint on a global invest-
ment canvas stretching across space and time. This is their dazzling journey
through the art, science, sport, and literature of investing. Don’t risk a penny
on stocks until you have read Practical Speculation.”
Professor Elroy Dimson, London Business School
Co-author, Triumph of the Optimists
nied_a01fm.qxd 1/24/03 10:40 AM Page 1

nied_a01fm.qxd 1/24/03 10:40 AM Page 2

PracticalSpeculation
VICTOR NIEDERHOFFERLAUREL KENNER
John Wiley & Sons, Inc.
nied_a01fm.qxd 1/24/03 10:40 AM Page i

Copyright © 2003 by Victor Niederhoffer and Laurel Kenner. All rights reserved.
Published by John Wiley & Sons, Inc., Hoboken, New Jersey.
Published simultaneously in Canada.
No part of this publication may be reproduced, stored in a retrieval system, or transmitted in any
form or by any means, electronic, mechanical, photocopying, recording, scanning, or otherwise,
except as permitted under Section 107 or 108 of the 1976 United States Copyright Act, without
either the prior written permission of the Publisher, or authorization through payment of the
appropriate per-copy fee to the Copyright Clearance Center, Inc., 222 Rosewood Drive, Danvers,
the Publisher for permission should be addressed to the Permissions Department, John Wiley &
Sons, Inc., 111 River Street, Hoboken, NJ 07030, 201-748-6011, fax 201-748-6008, e-mail:
Limit of Liability/Disclaimer of Warranty: While the publisher and author have used their best
efforts in preparing this book, they make no representations or warranties with respect to the
accuracy or completeness of the contents of this book and specifically disclaim any implied
warranties of merchantability or fitness for a particular purpose. No warranty may be created or
extended by sales representatives or written sales materials. The advice and strategies contained
herein may not be suitable for your situation. You should consult with a professional where
appropriate. Neither the publisher nor author shall be liable for any loss of profit or any other
commercial damages, including but not limited to special, incidental, consequential, or other
damages.
For general information on our other products and services, or technical support, please contact
our Customer Care Department within the United States at 800-762-2974, outside the United
States at 317-572-3993 or fax 317-572-4002.
Wiley also publishes its books in a variety of electronic formats. Some content that appears in
print may not be available in electronic books. For more information about Wiley products, visit
our web site at www.wiley.com.
Library of Congress Cataloging-in-Publication Data:
Niederhoffer, Victor, 1943–
Practical speculation / Victor Niederhoffer, Laurel Kenner.
p. cm.
Includes index.
ISBN 0-471-44306-9 (alk. paper)
1. Speculation. 2. Stocks. 3. Investment analysis. I. Kenner, Laurel. II. Title.
HG6041.N52 2003
332.63′2—dc21
2002190747
Printed in the United States of America.
10 9 8 7 6 5 4 3 2 1
nied_a01fm.qxd 1/24/03 10:40 AM Page ii
MA 01923, 978-750-8400, fax 978-750-4470, or on the web at www.copyright.com. Requests to

A fragment of a wartime speech moved through my mind:
‘We shall fight them in the fields, and in the streets, we shall
fight in the hills; we shall never surrender.’ True then for one
people, it was true always for the whole human race.
—Invasion of the Body Snatchers
nied_a01fm.qxd 1/24/03 10:40 AM Page iii

iv
From My New York by Kathy Jakobsen. Copyright © 1993, 2003 by Kathy
Jakobsen. By permission of Little, Brown and Company, (Inc.).
nied_a01fm.qxd 1/24/03 10:40 AM Page iv

v
A C K N O W L E D G M E N T S
This book was written from the firing line. Most of the ideas were sub-
jected not only to the pitiless judgment of the market itself but also to the
critiques, often withering, by readers of our columns for CNBC Money,
worldlyinvestor.com, and thestreet.com.
The list of those who helped us accomplish our writing task amid the
daily fray is long. Almost everything in this book benefited from the insights
of our editor at CNBC Money, Jon Markman. Pamela van Giessen, our editor
at John Wiley & Sons, inspired this book and shepherded it through many
iterations.
Our thinking was sharpened and augmented by the daily discussions on
our Speculators’ List, a group of extraordinary individuals who read and re-
sponded to our columns and then accepted our invitation to join a philosoph-
ical e-mail forum in the spirit of Ben Franklin’s junto. We are deeply grateful
to James Goldcamp, who put the list together for us. From an original mem-
bership of fewer than 10 people, the Speculators’ List now encompasses more
than 150 experts on diverse subjects, united by a common interest in markets,
statistical analysis, and mutually beneficial discussion. Dr. Brett Steenbarger,
whose contributions appear throughout this book, was among the early read-
ers who became dear friends. Our thinking and our lives have been enriched
by Gitanshu Buch, Henry Carstens, Duncan Coker, Nigel Davis, “Mr. E,” Bill
Egan, Glenn Escovedo, Ed Gross, Bill Haynes, David Hillman, James Lackey,
John Lamberg, Paul Lewis, Alix Martin, Mark McNabb, Shui Mitsuda, Bipin
Pathak, Tom Ryan, Ken Sadofsky, Dick Sears, Russell Sears, Saurabh Singal,
Don Staricka, Gary Tate, Jack Tierney, and Steve Wisdom, to name only a few.
There are many other eagles too numerous to mention.
nied_a01fm.qxd 1/24/03 10:40 AM Page v

vi Acknowledgments
Market Warriors (Artist: Susan Slyman, 2000).
nied_a01fm.qxd 1/24/03 10:40 AM Page vi

Acknowledgments vii
The traders in Vic’s office contributed research and analysis in addition to
their daily duties. Shi Zhang and David Ciocca produced many of the studies
and scatter diagrams. Patrick Boyle researched the chapters on physics and
Benjamin Graham. Rob Wincapaw located books, letters, and articles with
unfailing patience. Gitanshu Buch kept track of a multitude of projects while
simultaneously running the trading operation.
Bill Egan, John Lamberg, Gaylen Larson, and Adam Robinson reviewed
drafts and made many helpful suggestions.
Rip MacKenzie contributed much of the material for the hubris chapter.
James Cramer at TheStreet.com and Jeremy Pink at worldlyinvestor.com
encouraged our early writing endeavors.
We are grateful to Steve Stigler and Jim Lorie of the University of Chicago,
and to Lee Henkel, Vic’s long-time mentors, and friends. Also to Dan Gross-
man, Vic’s partner of 30 years, for valued insights and steadfast friendship.
Laurel thanks her music teachers, Aube Tzerko, Bruce Sutherland, and
Robert Winter, for teaching an approach to music she has found valuable in
all areas of life.
We thank our families for sharing the pain and the pleasure.
VICTOR NIEDERHOFFER
LAUREL KENNER
nied_a01fm.qxd 1/24/03 10:40 AM Page vii

nied_a01fm.qxd 1/24/03 10:40 AM Page viii

ix
C O N T E N T S
Introduction 1
Part One: Mumbo Jumbo and Moonshine 21
1 The Meme 23
2 Earnings Propaganda 43
3 The Hydra Heads of Technical Analysis 71
4 The Cult of the Bear 115
5 “We Are Number One” Usually Means “Not Much Longer” 133
6 Benjamin Graham: Mythical Market Hero 165
7 News Flash: Computer Writes StockMarket Story! 173
Part Two: Practical Speculation 181
8 How to Avoid Spurious Correlations 187
9 The Future of Returns 205
10 The Periodic Table of Investing 217
11 When They Swing for the Fences,We Run for the Exits 235
12 Boom or Bust? 247
13 Market Thermodynamics 263
nied_a01fm.qxd 1/24/03 10:40 AM Page ix

x Contents
14 Practical Market Lessons from theTennis Court 281
15 The Fine Art of Bargaining for an Edge 291
16 An Amiable Idiot in the Biotechnology Revolution 301
17 Earnings Impostors 313
18 Finale 341
Afterword 367
Notes 369
Index 377
nied_a01fm.qxd 1/24/03 10:40 AM Page x

1
I N T R O D U C T I O NThe Hope Snatchers
Look! You fools! You’re in danger! Can’t you see? They’re
after you! They’re after all of us! Our wives . . . our children
. . . they’re here already! You’re next!
—Dr. Miles Bennell, Invasion of the Body Snatchers (1956 film version)
The nightmare is always the same. I am lying in bed, staring at headlines
flashing across a huge monitor installed on my ceiling:
Stocks Fall on Earnings Pessimism
Stocks May Fall for Fifth Consecutive Week on Fears Economy Is Sputtering
Money Market Yields Fall to 1 Percent as Stock Market Woes Deepen
Stocks Fail to Top Y2K High for 450th Consecutive Day
Study Shows More Than 60 percent of All Issues Below 52-Week High
Markets Plummet as January Barometer Signals Decline for Rest of Year
Oracle of Omaha Says Investor Expectations Are “Too High”
Market Plunges on Fears Before Fed Meeting
Break of Revered Gann Pivot Triggers Massive Selling
Dividend Yields Now 25 Percent Below 1996 “Irrational Exuberance” Speech
nied_a02cintro.qxd 1/24/03 10:38 AM Page 1

2 Practical Speculation
In my dream, I am long IBM, or priceline.com, or, worst of all, Krung
Thai Bank, the state-owned bank in Thailand that fell from $200 to pennies
while I held it in 1997. The rest of the dream is always the same. My stock
plunges. Massive margin calls are being issued. Related stocks jump off cliffs
in sympathy. Delta hedgers are selling more stocks short to rebalance their
positions. The naked options I am short are going through the roof. Millions
of investors are blindly following the headlines. Listless as zombies, they are
liquidating their stocks at any price and piling into money-market funds with
an after-tax yield of −1 percent.
“Stop, you fools!” I scream. “There’s no danger! Can’t you see? The head-
lines are inducing you to lean the wrong way! Unless you get your balance,
you’ll lose everything—your wealth, your home!”
The perfect allegory for this state of affairs is found in Invasion of the BodySnatchers, a 1954 sci-fi classic book by Jack Finney.1 Aliens secretly invade the
fictional small town of Santa Mira, California, one by one taking over the bod-
ies of unsuspecting residents as they sleep. In the morning, the victims look
just the same as they did before, but they no longer have the human emotions
of joy, fear, ambition, sorrow, excitement, and hope.
The hero, Dr. Miles Bennell, arriving home after an absence in the midst
of the alien takeover, at first dismisses the victims’ strange demeanor. How-
ever, he soon realizes that something terrible is happening. Using forensic
medicine and nitty-gritty detective work, he and his plucky love interest,
Becky Driscoll, figure out that the aliens are parasitic seedpods that replicate
themselves in greenhouses so they can take over yet more human victims.
Their only aim is to survive by parasitism; they cannot make love or have chil-
dren, and their gray existence ends after five years.
After a harrowing escape from the town, Miles and Becky set fire to the
vanguard of an army of advancing pod people. The rest of the pods conclude
that Earth is an inhospitable place, and drift back into space to find new victims.
Often interpreted as a warning against blind obedience to authority, Inva-sion’s depiction of the victims serves as an extraordinarily apt description of
average investors’ vacant, resigned demeanor after the fallacies and propa-
ganda embedded in headlines like the ones in my recurring nightmare have
once more led them in the wrong direction.
The overriding problem is that these headlines induce hysteria and
then paralysis. They can blind investors to the 1,500,000 percent-a-century re-
turn that an investment in the stocks of the United States and most European
nations yielded in the twentieth century. On average, the backdrop then
seemed every bit as bleak as it does now. As science and enterprise help us
nied_a02cintro.qxd 1/24/03 10:38 AM Page 2

Introduction • The Hope Snatchers 3
live increasingly healthier, more prosperous lives, a century is a highly rele-
vant time frame to contemplate for the children of this book’s readers.
Let’s take another look at the first three headlines:
Stocks Fall on Earnings Pessimism
Stocks May Fall for Fifth Consecutive Week on Fears Economy Is Sputtering
Money Market Yields Fall to 1 Percent as Stock Market Woes Deepen
These headlines share a common defect: They label conditions that are bullishas bearish. We explain in detail later in this book:
Stocks Fail to Top Y2K High for 450th Consecutive Day
Study Shows More Than 60 percent of All Issues Below 52-Week High
Markets Plummet as January Barometer Signals Decline for Rest of Year
The phenomena reported in these three headlines are true of any time series
with a large random component—such as stock returns. These observations
are meaningless to the investor.
Oracle of Omaha Says Investor Expectations Are “Too High”
Market Plunges on Fears Before Fed Meeting
Break of Revered Gann Pivot Triggers Massive Selling
Dividend Yields Now 25 Percent Below 1996 “Irrational Exuberance” Speech
These headlines tell stories about misremembered facts that sustain falla-
cious beliefs harmful to those who trust such pronouncements.
Headlines that induce fearfulness are often based on myths, not reason.
Propaganda techniques, not the verifiable propositions of science, convey
these ideas. Just as the high priests of prescientific societies used
myths to maintain the social order and extract offerings from the
masses, today’s market professionals use bold, simple myths to ex-
tract contributions from credulous investors. This phenomenon ex-
plains why the public contributes so much to the commissions, spreads,
research expenditures, communications costs, skyscraper rents, sales outlays,
marketing expenses, and phantasmagoric bonuses for traders and executives
that make up the massive infrastructure of Wall Street.
The headlines listed here are by no means isolated examples that
we have culled to make our case. They are typical of the backdrop of
myth, misinformation, and propaganda bombarding investors daily
nied_a02cintro.qxd 1/24/03 10:38 AM Page 3

4 Practical Speculation
through every media channel. Uncritical acceptance of the fallacies embodied
in such headlines—whether wildly bullish or terrifyingly bearish—leads in-
vestors straight to the slaughter.
Although propaganda is ubiquitous in the market and in other
aspects of our lives, a simple antidote can protect us from manipulation:
the scientific method. If theories about the market are
framed in a testable fashion, they can be verified by counting.
Not only will embracing the scientific method preclude de-
bates about the meaning of words such as “irrational” and
“exuberant,” but also it will relate market theories to the real world. A side
benefit will be that those theories that are verified can actually lead to practi-
cal profits (which is, after all, why you are reading this book).
Don’t get us wrong. It is not that skepticism toward bullish propaganda
is inappropriate. We take a backseat to no one in loathing the bullish flum-
mery invariably fed to investors after the market has displayed a sharp rise.
Many companies store earnings in a silo and release them at opportune
times to lure investors into buying stocks, enabling executives to cash in
their options. We are strident critics of the conflicts of interest that can cause
brokerage house analysts never to recommend selling shares in a company
that is a client of the investment banking side of the firm. We abhor the
hubris that leads executives like Enron’s Jeffrey Skilling to curse analysts
who question the bona fides of the corporate balance sheet, and the egoma-
nia that encourages other executives to authorize golf courses as a necessary
management perquisite.
That said, if you are going to err on one side or the other, it pays to
err on the side of optimism. After all, until 2000–2002 the last time the U.S.
stock market went down three years in a row was 1939–1941. The situation
is much the same in other countries. It is hard to overcome a 1,500,000
percent-a-century upward drift in common stocks worldwide, even with
clever market timing.
Erroneous, untested suppositions dominate the market today. Despite
the advances that have come about in the four decades since efficient mar-
kets theory was developed, finance is still largely in the Dark Ages. The pub-
lic is barraged with commentary from journalists who offer nothing
but superstitions, descriptions, backward-looking observations, and
interviews with fund managers struggling to keep up with the mar-
ket averages.
Most of these reports purport to find a relation between the day’s market
performance and reports of a certain company’s earnings feats or woes, at-
tributing an “up” day to earnings optimism in a few stocks, or a “down” day to
nied_a02cintro.qxd 1/24/03 10:38 AM Page 4

Introduction • The Hope Snatchers 5
earnings pessimism in some other stocks. But the market landscape is so
enormous and varied that on any given day some companies inevitably will re-
port conditions are better (or worse) than an arbitrary standard. If investors
place any credence in such reports, they become victims of market vagaries.
They search for anecdotal evidence that is always available to justify something
in retrospect, but that offers nothing whatsoever of predictive value. Worse,
unscientific investors lose the ability to differentiate the helpful from the un-
helpful, or to build a foundation for making informed, rational decisions in the
future. Since none of the commentators ever presumes, for example, to deter-
mine the precise magnitude of the relation—if any—between earnings and
market performance, investors are led to accept nebulous untestable asser-
tions about the market without applying the normal skepticism that they have
learned is essential in other areas of their lives.
Faced with market moves that seem to bear no relation to what they be-
lieve to be true, investors quickly become disenchanted and disgusted when
the market declines, and hyperactive and wildly exuberant when the market
rises. In either case, they are being primed to overtrade and to make more
than their fair share of contributions to the market infrastructure. The end re-
sult is an army of disgruntled investors, ironically ever more ready to be bat-
ted around by the next pronouncement from a market guru, each ready to
leave the market at the drop of a hat for money-market funds with negative
real returns at precisely the juncture when conditions for equities are best. Ul-
timately, the market is the richer, and customers and investors are left with-
out any yachts—or pensions.
Worse yet, the market’s victims become like the pod people of Santa
Mira, cynical about all new ideas, bereft of optimism and hope. They are ready
to fall into step with those who do not believe in technology, do not believe in
growth, and, after many disclosures of corporate fraud, do not believe in the
enterprise system itself. Dr. Bennell could very well have been talking about
investors when he said:
I’ve seen how people have allowed their humanity to drain away. Only it happens
slowly instead of all at once. They didn’t seem to mind . . . All of us—a little bit—
we harden our hearts, grow callous.
But life, like the markets, offers the greatest rewards to those willing
to assume risk. Assuming risk brings uncertainty, anxiety, and occasional
loss, but it also brings out the best in us. In becoming a speculator in life,
each person embarks on a heroic quest, becoming more than he or she al-
ready is. Heroism is a potent antidote to the cynicism and alienation so
many of us accept.
nied_a02cintro.qxd 1/24/03 10:38 AM Page 5

6 Practical Speculation
If you’re familiar with my story and you’ve read this far, you may be ask-
ing: “Where does Victor Niederhoffer come off writing another book about
speculation and investing? Didn’t his hedge fund go defunct in 1997?”
Until 1997, my record was the best in the investment world. Barclay’s, the
hedge fund industry scorekeeper, named me the top hedge fund manager in
1996. I collected “best-performing hedge fund manager” awards and toured
the world giving lectures in elegant settings about markets and music, accom-
panied by concert pianist Robert Schrade. I employed a large staff of traders
and analysts from top schools, many of whom had been with me for a decade
or more. I was a partner with George Soros in numerous investment ven-
tures, and we were inseparable throughout the business and recreational day.
My book, The Education of a Speculator, had just been published and was a
bestseller.2 My funds under management and personal wealth were growing
exponentially, yet at a measured pace.
Then the roof caved in. I lost everything. In popular Wall Street parlance,
I “blew up.”
The story has been extensively chronicled. On December 13, 1998, an arti-
cle in the New York Times, “Trappings of Faded Richness: Sold!” by Geraldine
Fabrikant, captured my decline with the inimitable schadenfreude of the Times:
A five-foot horn of plenty made of silver and podollan ox horn, once the property
of King Charles XV of Sweden, is Victor Niederhoffer’s favorite in his collection
of silver trophy pieces. But Mr. Niederhoffer can no longer afford his horn of
plenty. The money manager lost all his capital in October 1997, when the Global
Systems funds he managed for himself, his family, and investors were hurt first
by his leveraged and unhedged speculations in the Thai stock market, and then by
his bet that the United States market would not decline dramatically. The two ca-
tastrophes wiped out the funds. And so Mr. Niederhoffer is struggling to pay his
debts, support the four of his six children who are still at home, maintain the fam-
ily’s lifestyle, and tiptoe back into the only business he knows: trading.
A comeback—both financially and psychologically—from the devastation of
his funds’ collapse has been far harder than even Mr. Niederhoffer had imagined.
“It is hard to be resilient when you’re 55,” he said during an interview in the li-
brary of his home. “When you have bad fortune, your suppliers and customers are
afraid. I’m on a very short leash.”
After 20 years of success, many investors had become friends. But many of
his friendships unraveled. “My phone stopped ringing a lot,” he said. He feels it’s
important that he suffered with his investors. “I’m saddened and chastened,” he
said. “My wisdom is quite suspect.” He compares his downfall with the bailout of
Long-Term Capital Management, the much bigger hedge fund recently rescued
by Wall Street. “I could have used Long-Term’s breathing time,” Mr. Niederhoffer
said. Instead, he is selling his silver.3
nied_a02cintro.qxd 1/24/03 10:38 AM Page 6

Introduction • The Hope Snatchers 7
In an instant, I plunged from the top of my profession to the depths. My
employees quit en masse. My customers, many of whom had been my best
friends for years, deserted me.
To boost my returns and stay number one, I had invested in the stock
market in Thailand, a country I knew too little about. In the United States, it
is a good bet that a 90 percent decline in bank stocks precedes a rebound. In
Southeast Asia, that is apparently not the case. My biggest holding—the
largest bank in Thailand—lost a whopping 99 percent. My losses abroad de-
pleted my reserves. The rest of the tale is still too sad and raw to retell. Suffice
it to say that the decline in Asian stocks spilled over into an unprecedented
one-day, 550-point decline in the Dow Jones Industrial Average. This was
enough to trigger a stock exchange rule that closed the market before 2 P.M.
that day. Confronted with a demand to come up with many millions to meet
margins the next day, I was forced to close my fund.
In addition to losing my investment business, I had to sell my holdings in
my other financial activities. I took out a large mortgage on my house, with
rates starting at 15 percent a year. The final indignity was selling my extensive
collection of antique silver. A representative quote from my introductory note
in an auction house brochure captures the flavor:
From a reading of business history, I had learned that many Wall Street specula-
tors at various times in their tumultuous sagas had placed their silver up for sale
in time of malaise. . . . One of my most enjoyable purchases in this regard was a
trophy presented to Jay Gould for winning a professional tennis championship.
Little did I figure on those occasions of Schadenfreude that I would one day be
joining such immortals.
I was devastated in every way. My sister, Diane, is a psychiatrist. She
noted that patients with severe (a euphemism for suicidal) depression nor-
mally have 10 symptoms of clinical depression, ranging from weight loss
to loss of sexual abilities. I had all 10 of them. At a meeting with out-
side lawyers, I mentioned this as a joke and perhaps an appeal for pity. My
own lawyer took me aside afterward and admonished me never to do that
again: “The only reaction the other side will have is anger that you didn’t pull
the trigger.”
Friends and family did their best to see me through. I received 55 copies
of Tuesdays with Morrie.4 The senders all emphasized to me that Morrie was
able to deal with his impending death with dignity, and they advised me to
take a similar stance.
I also received 10 copies of the Rudyard Kipling poem “If,” which re-
mains an inspiration. Some of the senders underlined the following words:
nied_a02cintro.qxd 1/24/03 10:38 AM Page 7

8 Practical Speculation
If you can make one heap of all your winnings
And risk it all on one turn of pitch-and-toss,
And lose, and start again at your beginnings
And never breathe a word about your loss;
. . .
If you can fill the unforgiving minute
With sixty seconds’ worth of distance run,
Yours is the Earth and everything that’s in it,
And—which is more—you’ll be a Man, my son!
Suffused with Tuesdays with Morrie, thoughts of my own deathlike experi-
ence, and other melancholy contemplations and nightmares, I paid frequent
visits to the grave of my father, Arthur. He was a scholar and a cop of infinite
strength and support whose good spirit has uplifted his family at times of trou-
ble and all other times since his untimely death in 1981 at the age of 62. I later
asked my uncle, Howie Eisenberg, who served as a model for my loss by
snatching defeat from victory in the finals of 43 separate national handball
championships (he also won 18 of them) what he thought Artie might have
said about my fall. Together, we came up with the following:
So what of it? It’s not the end of the world. You and your family are in good
health; you’re still able to live the life that you wish. That’s what’s important. All of
your strategy, practice, and experience led to taking that shot at that point. You
went for the overhead to get further ahead in the match and missed. It was still
the right shot for you then. It was the same strategy that got you the substantial
lead that you had.
Suppose, which I don’t believe for a moment, you don’t come back. It’s not
so terrible. You can still teach, and I’ll help you with the bills. Here. I’ve taken a
mortgage from the co-op.
The consequences of missing the shot were a revelation for you. You now re-
alize that while you had every reason to believe your advantage would be in-
creased, you exposed yourself and those who were playing with you to possibly
losing the whole match. You now have a different perspective. You can see that al-
though the potential to maximize your advantage may seem to be the correct
course of action, it should be tempered by a strategy that limits, if not precludes,
the possibility of not only losing the match but all of your racquets. You don’t
want to be in the position of not having the wherewithal to continue playing the
way you want, or causing those who bet on you to lose their pants. The crucial
thing is that you are still in the game, once again racking up points.
Whatever you do, be more careful in the future. Be good to your family and
friends. You have a beautiful life and everything in the world to look forward to.
Take it easy.
nied_a02cintro.qxd 1/24/03 10:38 AM Page 8

Introduction • The Hope Snatchers 9
I did not have the luxury of wallowing in my misery for too long. I had six
kids, six private-school tuitions, a former and current wife, extensive recur-
ring household expenses from the previous good days, and the usual legal ex-
penses for events of this nature. We pick a basket of berries, the basket falls,
and we fill the basket again. I had to fill the basket once more. But I did not
have any capital of consequence to meet these expenses. More important,
none of the usual suspects for my kind of trading had any interest in estab-
lishing a normal working relationship with me.
I was well experienced in losing from my career in sports. But this come-
back was much more difficult. Not only had I lost my standing in the tourna-
ments, I had lost my equipment, my coaches, my entourage, and my fans. I
could not even get into the qualifying tournaments, because the officials there
were afraid of adverse consequences.
Under the circumstances, an alternate pursuit seemed appropriate. That
alternative was to combine with Laurel Kenner in writing a column that
would communicate the remedial lessons I had learned from my fall and per-
haps prevent others from succumbing. I figured that by trying to teach others,
I might learn something myself.
When I met Laurel in 1999, she was the chief editor for North American
stock markets at Bloomberg, one of the two biggest financial news wire ser-
vices. Ironically, she was one of the very people responsible for perpetuating
the misinformation and disinformation about the market described in this
book. Life being short and time constantly ticking away, she decided to write a
column herself. Readership soon topped that of other columnists. The kind of
pieces she wrote, filled with lessons for investors from baseball, Moby Dick,and Beethoven symphonies, did not endear her to her traditionally minded
bosses; and she was being eased out the door. Finally, she quit without any
source of income in sight. It might have been a tragedy except for the fact that
she now had the freedom to collaborate with me in writing columns she con-
sidered worthwhile.
We both were sick of seeing investors leaning on the wrong foot so often.
The mumbo jumbo constantly fed to investors was painful to us, and we both
had a reason and the knowledge to do something about it.
To Overwhelming Applause
“Get out of here!” was a typical reaction when we started writing. Reader after
reader wrote in to say that this was the most ridiculous thing in the world: a
guy who had lost everything writing columns to tell other people what to do.
nied_a02cintro.qxd 1/24/03 10:38 AM Page 9

10 Practical Speculation
One of the first letters we received suggested that instead of writing a column,
I should be working as a dishwasher to pay my investors back.
Here are representative responses that came in early 2002, after we
warned investors against blindly following those who believe “the trend is
your friend”:
Let me conclude by encouraging you to continue writing your column on MSN
Money and sharing your thoughts with us. A good way to trade profitably seems
to be to take the opposite side of your trades.
This is probably one of the worst articles I have ever read. Keep sending the same
message to the sheep, leading them to the slaughterhouse. Vic used to be one of
the best money managers in the world . . . guess that’s why he is peddling stock
advice on MSNBC. Give me a break.
It’s very clear why you blew out your account.
I find it interesting that a man who lost $125 million in one day and skipped out
on the bill has a job giving out advice to investors.
My thinking is that you guys are some comedy act. Show me your actual trade
figures over the past five years. I hear you went belly up. I don’t think many trend
traders did.
All I can say is, how many times has Niederhoffer gone belly up and had to beg
his friends to pony up some cash for him to start trading again? (from the Turtle-
Trader Web site).
Last time I checked, Niederhoffer was not the lead investor in the Boston Red Sox
ownership group. John Henry is.
Your articles are uncivilized, but I will forgive you if you change your life.
Some readers simply send us viruses:
Subject: Fwd: Possible Virus Found in E-Mail
A message from: [email protected] may contain a virus. This message will
be quarantined under the name vm.02285185015.10682 in the quarantine area
on host mh2dmz4.bloomberg.net.
We usually reply to the nonviral letters, and find that a soft answer turns
away wrath. One reader, James Taylor, asked in an October 4, 2002, e-mail:
Why/how are you an authority on investing? After all, you blew up your fund.
I replied:
I am not an authority. I am trying to learn. I guess they figure that people trying to
learn might have an audience. Perhaps it was my education and my need of a job?
nied_a02cintro.qxd 1/24/03 10:38 AM Page 10

Introduction • The Hope Snatchers 11
The reader quickly wrote back:
Sorry about my prior e-mail. It was rude and not fair. I was just venting because I
see so many “analysts” and so-called experts on CNBC daily, who don’t have sense
to come in out of the rain.
Your insight and experience can only be a great addition to the column. I do
have your book, The Education of a Speculator, and thought it was a good read.
Trading is a difficult business and can test us, especially if we are aggressive.
One of the reprehensible traits of market commentators is to pretend that
they are lonely voices in the wilderness, bereft of support and praise. The
truth is, we are hardly bereft in that respect. Hundreds of thousands of people
read our columns on CNBC Money each month. For every barb, we receive
many hundreds of letters of thanks. No matter what we say, some critics will
inevitably say, “Forget about anything these two advise, because Vic couldn’t
make a dollar if his life depended on it.” We encourage such beliefs; they let
us go about our affairs in peace. We sometimes reply to such correspondence
by saying:
Yes, you’re right. Vic has been reduced to writing a column to cover the ex-
penses of his large extended family, starting with the tuitions of his six daugh-
ters. He couldn’t get a job as an assistant squash coach because the hardball
game he used to play is extinct, so he took a job as a night watchman. The col-
umn is a good second job because he can write during the day. With any luck
and continued hard work, he will be able to climb up the first stair of the invest-
ment ladder once again so that eventually he will not need to supplement his in-
come by writing.
We do not always feel patient. A Texas economics student, responding to
a column on dividends, wrote us that the 100 years of data on dividends we
used wasn’t enough, and that he intended to do some real econometric work
that wasn’t so simplistic. Vic, as usual, had a mild reply: “Hopefully, you will
find a data series of relevance for more than 100 years and be able to teach
us.” When the reader responded by calling Victor a name too obscene to put
in print and wished us both great financial misery, Laurel became indignant
and wanted to go beat him over the head with her three-inch heels.
Although we may be hurt by such correspondence, we understand that
people have lost a great deal of money and are angry with everyone—from
CNBC to analysts to pundits and columnists.
In fact, neither of us has to write for a living. The income derived from
writing columns and books does not go far to defray our living expenses, or
to pay for the databases we need to debunk the fallacies that enthrall the in-
vesting public. But for the sake of the open-minded who are interested in
nied_a02cintro.qxd 1/24/03 10:38 AM Page 11

12 Practical Speculation
participating with us in mutual education, we are offering a serious re-
sponse to the critics.
Since Laurel and I began writing together in 2000, we have heard count-
less heartbreaking tales from readers in shock from seeing their wealth and
retirement accounts cut in half or worse. People wrote to us for advice on how
to rebuild, on how to live with themselves. They specifically wanted to know
how I handled my own bout with disaster.
The answer we give these distressed readers is not to avoid risk. Risk is
part of all heroic endeavors, whether in trading, business, philanthropy, con-
struction, exploration, art, music, sports, sailing, or romance. Not only is risk
necessary for gain; it is the inescapable lot of human beings. As Paul Heyne
wrote in The Economic Way of Thinking, “Everyone who makes a decision in
the absence of complete information about the future consequences of all
available opportunities is a speculator. So everyone is a speculator.”5
When my fund closed in 1997, the returns to that point had been such
that most of the investors who had been with me for any length of time ended
up with net profits. Since 1997, I have climbed back up the stairs. Along the
way, I have made and lost millions, with the former providentially much
greater than the latter.
Avoiding risk can lead to the cynicism often produced by failure. One
philosopher clearly saw the dangers:
Cynicism may be a by-product of anomie in the social structure; at the same time
it may also prepare the way for personal anomie. . . . Anxious over a personal fail-
ure, the individual . . . often disguises his feelings with a cynical attitude, and
thus negates the prize he did not attain. Frequently he includes in his cynicism all
persons who still seek that prize or have succeeded in winning it, and, occasion-
ally, deprecates the entire social system within which the failure occurred. As the
cynic becomes increasingly pessimistic and misanthropic, he finds it easier to re-
duce his commitment to the social system and its values.6
The author was my father. He was a cop, and he was writing about law
enforcement officers. But his words apply equally well to the forlorn state that
investors often fall into, especially after years of market losses.
Anyone who ventures out into the thick propaganda of Wall Street risks
ruin. A rudder is necessary. To discover what people should understand if
they want to improve their financial situations by trading in the market, we
read hundreds of books on trading, investment, statistics, risk, and behavioral
finance. Alas, almost everything disseminated about buying stocks is promo-
tional, and most of the advice is completely untested. Indeed, these authors
are careful not to frame their assertions in terms that can be tested.
nied_a02cintro.qxd 1/24/03 10:38 AM Page 12

Introduction • The Hope Snatchers 13
Irrational faith in untested propositions is a throwback to feudal times,
when people lived in utter squalor and poverty and had no possibility of im-
proving themselves, no opportunity to retire early and do creative things, no
chance to find cures for disease and extend their lives. Academic
studies might seem to promise a better approach, but they often suf-
fer from Monday-morning-quarterbacking biases and are almost al-
ways outdated by the time they are published.
Just like the victims in Invasion of the Body Snatchers, the victims of in-
vestment fallacies seem perfectly normal and rational. Yet their collective be-
havior can lead to evil and terrifying consequences. Professional market
parasites who make their living off investors can only thrive when people give
in and become unthinking pods. Only in an environment that is without skep-
ticism and the scientific method can investors’ losses mount wildly.
It all makes want us want to say, along with Dr. Bennell, “Help! Halt!
Stop. Stop and listen to me! Don’t you see? They want us to be like the pod
people so that we’ll pay our dues to the market system!”
In this book, Laurel and I play the roles of Becky Driscoll and Dr. Bennell,
to help readers escape becoming pod creatures and succumbing to the market
fallacies replicated daily, if not hourly, by those who would take away their wal-
lets. Laurel draws on a vast knowledge of deceptive alien techniques gained
from her work as U.S. stock market editor at Bloomberg News, a financial
news wire service. Unlike Dr. Bennell, who cured patients and prevented alien
invasions, I am merely a doctor of statistics. The main help such a doctor can
provide is assistance in understanding the regularities and uncertainties of
numbers. Like Dr. Bennell, however, I am in the habit of clipping odd articles
from newspapers for items that might add up into grand insights somewhere
down the line. For the past quarter-century, I have searched my favorite news-
paper, the National Enquirer, for tales about the heroics of common people,
their survival skills, and their unquenchable common sense and good nature,
to fit myself for an optimistic approach to investments that roots out the pods
before they can grow in the bearish greenhouses. We hope that readers will
find this approach profitable.
Practical Speculation extends the themes that Laurel and I have been de-
veloping in our columns over the past three years. Together, we have fought
off mysticism, hubris, and market propaganda in some 500 hard-hitting
columns for four different Web sites. (It is true we were fired from most of
these jobs, starting with a seven-week run of Laurel’s column at Bloomberg
and a two-month stand at thestreet.com, where we debuted our first joint col-
umn, “The Speculators’ Corner.” We put in a year and a month—quite a long
spell for us—writing a daily column at worldlyinvestor.com, where we were
nied_a02cintro.qxd 1/24/03 10:38 AM Page 13

14 Practical Speculation
eased out by new editors who wanted us to educate financial planners instead
of concentrating on our clarion calls to the public to beware of ballyhoo. The
odds are better than even money that by the time this book is published, we
will have been fired by our current employer, CNBC Money.
We are not unmindful that we have burned many sacred cows in this
book. None of them, or others in the barnyard and factories where they come
from, are likely to react over kindly to the conflagration or what they are more
likely to call a mere smokescreen.
One thing we should make clear, however, is that there is a wealth of
original material appearing in this book that has never seen the light of
day. It required much percolation, for example, for us to disclose here for
the first time the results of a content analysis of 10 years of weekly financial
writing. Same for our analysis and reformulation of the use of scatter
charts, the discussions of conservation of energy, and the Value Line peri-
odic table of elements. Furthermore, all the thoughts are fresh thoughts
representing our best thinking several years into the new millennium. They
have evolved from our experiences on the battlefield of actual trades as well
as scholarly and practical criticism from a network of dispersed experts with
knowledge and insights that could only have been assembled in modern In-
ternet times.
Through it all, our readers’ comments have augmented our work in im-
measurable ways, leading to new areas of inquiry and new friendships. Above
all, we have enjoyed the profit and pleasure of finding and testing ideas drawn
from patterns observed in the real world, rather than passing along the re-
ceived wisdom of gurus. Laurel and I hope that the lessons we have learned
over the past three years from counting, deflating propaganda, avoiding un-
warranted negative thinking, and developing a proper investing foundation
will help readers of Practical Speculation prosper.
The Framework for This Book
The first part of this book—Mumbo Jumbo and Moonshine—dissects the com-
mon errors, myths, fallacies, and propaganda that induce investors to lean the
wrong way and make a maximum contribution to the market’s infrastructure.
Chapter 1: The Meme
Everyone knew that the mere mention from a Federal Reserve chairman
of fears about stock prices would lead to an explosive and completely
unpredictable reaction in the market. Alan Greenspan’s December 5, 1996,
nied_a02cintro.qxd 1/24/03 10:38 AM Page 14

Introduction • The Hope Snatchers 15
“irrational exuberance” speech set off such a dire chain of events that we have
devoted our Chapter 1 (with apologies to Guy de Maupassant’s classic horror
tale, “The Horla”) to detailing all its consequences, including the reaction
against technology, optimism, and growth.
Chapter 2: Earnings Propaganda
As Kuhn noted in The Structure of Scientific Revolution,7 science often finds itself
in a state in which a growing number of facts conflict with prevailing theory.
Such was the state of Newtonian mechanics in the late nineteenth century as
experimental evidence concerning the spontaneous decay of particles from the
nucleus of atoms began to accumulate. Such is the state of today’s prevailing
wisdom that stock market prices are determined by earnings or price/earnings
ratios. We subject the most widely accepted beliefs about the earnings-market
relation to counting, and offer ways to spot earnings propaganda in media cov-
erage, analyst reports, and company pronouncements to help readers reject
the market’s numerous invitations to trade the wrong way.
Chapter 3: The Hydra Heads of Technical Analysis
Violent declines in the market promote fear and dread. Being able to predict
up moves in the market would guarantee immeasurable wealth and power. It
is not surprising, then, that there is a mythology of momentum, replete with
stories of great heroes and heroines who have conquered the mighty forces, to
ease investors’ anxieties, to fuel their hopes—and to keep them making wrong
moves with no chance for improvement. We apply some science to the cult of
technical analysis and its central mystery: “The trend is your friend.” As we
demonstrate, the trend is regrettably not your friend.
Chapter 4: The Cult of the Bear
How can a writer be wrong for practically his entire working life and still be the
most influential figure in financial journalism? We interviewed Alan Abelson
to find out why, after searching in vain for a hint of optimism in the hundreds
of weekly columns he wrote for Barron’s during the great 1990s bull market.
Chapter 5: “We Are Number One” Usually Means“Not Much Longer”
To the ancient Greeks, the most grievous sin was hubris, the arrogance of
power. Vic’s father, Artie Niederhoffer, who inspired and is memorialized in
nied_a02cintro.qxd 1/24/03 10:38 AM Page 15

16 Practical Speculation
Vic’s first book, The Education of a Speculator, wrote with great insight on how
this flaw impaired the judicial system. We attempt to carry forward his analy-
sis by studying the effects of hubris in the marketplace.
Chapter 6: Benjamin Graham: Mythical Market Hero
The ancients had their gods and demigods, and we moderns have ours. In the
Golden Age of Greece, as scientific thinking took hold for the first time, some
thinkers began to question the reverence and sacrifices demanded by the
gods. It is always a good idea to ask questions. A figure high in today’s pan-
theon—Benjamin Graham—is the subject of this chapter.
Chapter 7: News Flash: Computer Writes Stock Market Story!
The brilliant mathematician Alan Turing once proposed that a computer
might be said to be intelligent if it could fool a human into mistaking it for an-
other human. The converse must also be true: If we can program a computer
to replicate a human’s speech, we can say the human is not acting intelligently.
Most contemporary financial news reports could be done by computers work-
ing from a limited database of erroneous ideas and quotes from mediocre
money managers. We explain why, and present our patented program for
stock market reporting.
Looking at Part Two—Practical Speculation
Part Two offers a foundation for making rational decisions about the market.
Survival comes first, and we start with a strategy that will keep readers from
being wiped out before they can enjoy the fruits of their efforts. It is based on
the thinking of one of the greatest geniuses ever in a pursuit that has de-
manded the best strategic thinking of sharp minds for more than a thousand
years: chess.
Chapter 8: How to Avoid Spurious Correlations
The main tool for succeeding in the investment battle is so simple that a child
can comprehend it: the scatter plot. By plotting the joint values of two things,
the investor can determine whether and how much the things are related. The
technique provides a way to understand almost all information about the
stock market. We explain it step by step and show how to use it to analyze the
effect of interest-rate moves on the market.
nied_a02cintro.qxd 1/24/03 10:38 AM Page 16

Introduction • The Hope Snatchers 17
Chapter 9: The Future of Returns
In the twentieth century, stock markets in all major industrialized countries
recorded returns on the order of 1,500,000 percent. That is the remarkable
conclusion of three London Business School researchers who assembled a
magnificent 102-year worldwide database on stock prices and wrote what we
consider the best investment book available today, Triumph of the Optimists.8
We describe some systems we have developed from their database to improve
on a long-term buy-and-hold strategy.
Chapter 10: The Periodic Table of Investing
We tell the story of Value Line’s beginnings from the perspectives of Sam Eisen-
stadt, the firm’s research chairman and Henry Hill, the Florida investor who
made millions by religiously following Value Line’s systems. The tale includes
Value Line’s conclusive demonstration of growth’s superiority over value.
Chapter 11: When They Swing for the Fences,We Run for the Exits
A remarkable predictive relation exists between baseball and long-term trends
in the market, and it all begins with Babe Ruth.
Chapter 12: Boom or Bust?
Real estate, fixed and immovable, might seem to be an ideal alternative to a
roller-coaster stock market. Yet real estate investment trusts (REITs)—the main
way in which small investors can invest in large-scale income properties—have
failed to measure up to stocks as long-term investments. We demonstrate that
great profits may come from studying the patterns linking real estate and busi-
ness cycles.
Chapter 13: Market Thermodynamics
The fundamental laws of conservation and entropy are amazingly helpful in
making predictions in a world of seemingly constant change. We demonstrate
with experiments and a day in the life of Vic’s youngest daughter, Kira.
Chapter 14: Practical Market Lessons from the Tennis Court
Vic has won numerous championship titles in racket sports of all kinds, and
in 2001 was among the first players to be named to the newly founded Squash
nied_a02cintro.qxd 1/24/03 10:38 AM Page 17

18 Practical Speculation
Hall of Fame. He shares strategies that have proved useful both on the court
and in the market, before, during, and after the game.
Chapter 15: The Fine Art of Bargaining for an Edge
Everyone has a right to state the price he or she is willing to pay. Investors
should not hesitate to use bargaining methods to gain an edge in the
market.
Chapter 16: An Amiable Idiot in the Biotechnology Revolution
The main criticism of Vic’s first book was that it had a lot of principles, but
nothing to help people make money. When we began writing columns, we
found ourselves on the firing line every day to come up with specific recom-
mendations. Readership of our column went up by a factor of 10 when we
began mentioning individual stock purchases and sales. Happily, although our
dedication to readers goes beyond the dollar and the clock, our stock-picking
efforts on their behalf have not been without benefit to us. We put drug stocks
on trial for money-making efficacy.
Chapter 17: Earnings Imposters
Constantly evolving techniques of “earnings management” have made net in-
come—once known as “the bottom line”—a chimera. We show how to mine
information in balance sheets and cash flow statements to arrive at a truer pic-
ture of a company’s financial health. Stock buybacks, dividends, inventory, ac-
counts receivable, and tax payments all are helpful in differentiating between
reality and artful distortions.
Chapter 18: Finale
We hear four questions more than any others. We explain whether we use any
technical indicators in our trading, what book we recommend for speculators,
and why we say such awful things about Alan Greenspan. We also divulge the
secret weapon that keeps us on our toes and eager to learn: a group of in-
vestors and sages we met through our columns. We communicate with them
daily by e-mail to discuss market philosophy and strategy. We include a few of
the tens of thousands of extraordinary posts these eagles have generously
shared over the years.
nied_a02cintro.qxd 1/24/03 10:38 AM Page 18

Introduction • The Hope Snatchers 19
Explanation of Icons
In this book, we return again and again to five broad themes, in highly varied
forms. To help readers recognize them more easily, we highlight these
themes with icons:
Propaganda: In politics, the systematic dissemination of false beliefs is called
propaganda. Schoolchildren nowadays are taught how to recognize the seven
main techniques of propaganda—name-calling, glittering generali-
ties, transfer, testimonial, plain folks, card-stacking, and bandwagon.
Regrettably, nobody tells investors how to recognize these techniques
in the financial field. That is going to change right now. Propaganda
methods crop up over and over again as we discuss the widespread acceptance
of false information. When we encounter these techniques, we highlight them
with the old Soviet Union’s favorite villain: the capitalist Mr. Moneybags.
Untested propositions: Much of what passes for market analysis
today is done in a manner related more to Dark Ages mysticism than
scientific reasoning. When we discuss untested propositions and
leaps of faith, we include our mumbo-jumbo icon, a wizard’s hat.
Count, count, count: The antidote to propaganda and untested propositions is
a skeptical frame of mind that asks for proof when a market-related idea is put
forward. The kind of mind that queries: “Should I swallow this, or not?” As
Steve Stigler writes in his magisterial Statistics on the Table:9
If a serious question has been raised, whether it be in science or society, then it is
not enough merely to assert an answer. Evidence must be provided, and that evi-
dence should be accompanied by an assessment of its own reliability. The evidence
need not be quantitative, although it will often find its clearest expression in quanti-
tative form or through attempts to interpret it in quantitative form. If the question is
important and one position has been advanced with well-considered supporting evi-
dence, then it is incumbent on a critic to put “statistics on the table.” Clearly this test
requires more than simple number collection. It involves a careful analysis of the
forces that would affect any data, methods for measuring and expressing the uncer-
tainty of the conclusions, and conventions for settling issues such as how much un-
certainty is too much, or when an assertion should be rejected and when not.
We find it appropriate to put statistics on the table often as
we try to provide an approach and a framework that will get in-
vestors off on the right foot. We use a pencil and envelope icon
as a reminder of the importance of counting.
nied_a02cintro.qxd 1/24/03 10:38 AM Page 19

20 Practical Speculation
Spurious correlations: A great part of this book is devoted to examining
random relations that are assumed to be predictive. When we uncover a
spurious correlation, we highlight it with a pair of storks, a refer-
ence to a complex but fictitious relation between population
growth, bad wurst, double vision, misinterpretations of Kant’s
work (unkantverstehenlassenhummels), and a jump in stork sight-
ings in Oldenburg, Germany.
Ever-changing cycles: Our job as market commentators, which has involved
writing more than one million words over almost four years, has been to dis-
cover useful knowledge, test it, and make it general and practical. The ironic
thing about knowledge is that it is constantly changing, in line
with the shifting kaleidoscope of market price moves. Our
racehorse icon highlights the law of ever-changing cycles that
Robert L. Bacon first put forward in Secrets of Professional Turf Betting: “The
principle of ever-changing trends works to force quick and drastic changes of
results sequences when the public happens to get wise to a winning idea.”10
nied_a02cintro.qxd 1/24/03 10:38 AM Page 20

21
Part OneMumbo Jumboand Moonshine
nied_c01.qxd 1/24/03 10:37 AM Page 21

nied_c01.qxd 1/24/03 10:37 AM Page 22

23
1 T H E M E M E
A curious piece of news comes to us from Rio de
Janeiro. Madness, an epidemic of madness, which may be
compared to that contagious madness which attacked the
people of Europe in the Middle Ages, is at this moment raging
in the Province of Sao Paulo. The frightened inhabitants are
leaving their houses, deserting their villages, abandoning their
land, saying that they are pursued, possessed, governed like
human cattle by invisible, though tangible, beings, a species
of vampire, which feed on their life while they are asleep.
—Guy de Maupassant, “The Horla”1
July 18, 1996: What a beautiful century! As the beginning of the third
millennium nears, America is looking forward to continued peace and
growing prosperity. Communism has been discredited, and the Cold War is
over. World trade is opening up. We’re starting to spend money on goods and
ideas, rather than multibillion-dollar schemes of mutually assured destruc-
tion. The federal budget has a surplus for the first time in decades. Interest
rates are at half the level of 15 years ago. Productivity and earnings are rising,
nied_c01.qxd 1/24/03 10:37 AM Page 23
24 Practical Speculation
and unemployment and inflation are negligible, something thought impossible
just a few years ago. The computer is transforming work and home life. Revolu-
tions in biotechnology and high-speed communications are under way. Parents
can reasonably expect their newborns to live to age 100 and beyond. Almost 50
million people are using the Internet. Many investors are becoming rich from
investing in technology, and entrepreneurs are finding it easy to raise money for
new ventures. Millions of people are more comfortable financially than they
have ever been before. The standard of living is better than ever. People are opti-
mistic about improving their lot in life. The future seems promising indeed.
I turn on CNBC to hear the financial news. One of my technology stocks
is up 15 points! I call my broker to sell half my shares. Now I can pay my kids’
tuition bills. Federal Reserve Chairman Alan Greenspan comes on the air. He
says that remarkable technological breakthroughs in microchips and software
are boosting productivity. He doesn’t see any reason that the economy’s
growth should not continue for the foreseeable future. The Dow is up 120. I
salute his image on the TV screen, I hardly know why, except his words give
me great pleasure.
The TV anchor then begins an interview with one of the bearish money
managers who has been short the market since 1987. The manager launches
into a familiar speech: “Market valuations are ridiculously high . . . dividend
yields aren’t what they were in the 1950s and early 1960s . . . the Dow has al-
ready risen almost 9 percent so far this year, enough for an average year, after
rising 33 percent in 1995.” Indeed, with dividends reinvested, it has returned
1,200 percent since the end of 1979. But he sounds a little desperate, as well
he might, given that so many who had bet against the market beginning in
1987 have gone belly up. He makes no mention of the decline in interest
rates, or the doubling of earnings retention rates, or the fact that buybacks are
now running equivalent to dividend payouts. Nor did he provide evidence that
stocks must go down after going up at more than the average rate. If only he
would take out a pencil and envelope, he could see that after a rise, the chances
of another rise the next year are 53 percent versus 52 percent after a decline and
that the average move after a rise is slightly greater than after a decline.
December 6, 1996: I turn on the 6 A.M. business news when I wake up. Cata-
strophe has struck. Last night, after the U.S. markets closed, Greenspan sug-
gested that investors are “irrationally exuberant.” Markets are diving in Asia
and Europe.
A sudden shiver of agony runs through me. The chairman is like the fa-
ther of the market. If the market were to heed his words, if it were to start
worrying that he might punish it by requiring more margin, it might fall be-
neath his big heels.
nied_c01.qxd 1/24/03 10:37 AM Page 24

Chapter 1 • The Meme 25
His words, taken alone, do not seem too foreboding. He was not even ad-
dressing Congress. It was just an after-dinner speech at the American Enter-
prise Institute on the history of monetary policy. I pull up the quote on the
Internet:
Where do we draw the line on what prices matter? Certainly prices of goods and
services now being produced—our basic measure of inflation—matter. But what
about future prices or more importantly, prices of claims on future goods and ser-
vices, like equities, real estate or other earning assets? Is stability of these prices
essential to the stability of the economy?
Clearly, sustained low inflation implies less uncertainty about the future, and
lower risk premiums imply higher prices of stocks and other earning assets. We
can see that in the inverse relationship exhibited by price/earnings ratios and the
rate of inflation on the past. But how do we know when irrational exuberance has un-
duly escalated asset values, when they become subject to unexpected and prolonged con-
tractions as they have in Japan over the past decade? And how do we factor that
assessment into monetary policy? [Emphasis added.]
. . . Evaluating shifts in balance sheets generally, and in asset prices particu-
larly, must be an integral part of the development of monetary policy.2
“But how do we know . . . ?” It sounds like such an innocent question. By
the time the market closed, everything seemed pretty much back to normal.
The Dow ended 55 points lower at 6382, a drop of less than 1 percent, after
falling as much as 144. But why did our self-confidence change so quickly into
timidity? How strange it is that a simple feeling of discomfort—perhaps the
irritation of a nervous center, a small disturbance in the imperfect and deli-
cate functions of our mental machinery—can turn the most lighthearted of
men into a melancholy one, and make a coward of the bravest.
I walk down to the river near my house to watch the tugboats and barges
go by. After walking a short distance in the sun, I suddenly, inexplicably, feel
anxious and wretched. I return home immediately to check the stock prices
on my monitor. Why am I worried? Is it a phrase that, passing through my
memory, has upset my nerves and given me a fit of low spirits? Is it the frown
of CNBC’s Money Honey as she passes along word of an analyst’s downgrade,
or is it her new short hairstyle? Everything that surrounds us, everything that
we hear without listening, every idea that we meet without clearly distin-
guishing it, has a rapid, surprising, and inexplicable effect on us and on our
organs, and through them on our ideas and on our being.
February 25, 1997: President Bill Clinton has been letting big campaign con-
tributors stay in the Lincoln bedroom! The White House released a list of more
than 800 people who stayed overnight in the room where President Lincoln
nied_c01.qxd 1/24/03 10:37 AM Page 25

26 Practical Speculation
signed the proclamation freeing America’s slaves. The guests—including Hol-
lywood moguls and stars—came through with at least $5.4 million in contri-
butions to the Democratic National Committee in 1995 and 1996 alone,
according to a computerized study commissioned by CNN. Producer Steven
Spielberg donated $336,023, and MCA Chairman Lew Wasserman gave
$225,000. The tawdriness is troubling.
March 3, 1997: A crisis is unfolding far away. It seems that cheap Chinese
labor is taking away Thailand’s share of the electronics export market. The
country’s fabulous growth has slowed so much that the banks are neck-deep
in bad loans to real estate speculators, and a devaluation of the currency—the
baht—is probable. The stock exchange temporarily halted trading in bank
stocks today. An incomprehensible feeling of disquietude seizes me, as if this
news concealed some terrible menace. I walk up and down my hallway, op-
pressed by a feeling of confusion and irresistible fear.
July 8, 1997: NASA uses the Internet to broadcast images taken by the
Pathfinder spacecraft on Mars. An Internet traffic record is set: 46 million
hits in one day. These stunning displays of twentieth-century science make
my spirit soar.
August 21, 1997: Southeast Asian markets are collapsing before our eyes. Thai-
land admitted today it had borrowed $23 billion in an unsuccessful attempt to
avoid devaluing its currency. Thailand owes a total of $89 billion to foreigners,
$40 billion of which comes due within the next year. Indonesia, Malaysia, and
the Philippines are in trouble, too. Stocks are toppling, interest rates are soar-
ing, and outside money is fleeing. Malaysian leader Mahathir Mohamed says
it’s all because Jews are trying to keep Muslims poor.
I have just come from consulting my medical man, for I can no longer
sleep. He said my pulse is high and my nerves are highly strung, but that oth-
erwise I exhibited to him no alarming symptoms. He prescribed a regimen of
vigorous exercise.
That night, I manage two or three hours of sleep. A nightmare lays hold
of me. I feel that I am in bed and asleep . . . and I feel also that somebody is
coming close to me, looking at me, touching me, getting onto my bed, kneel-
ing on my chest, taking my neck between his hands and squeezing it with all
his might to strangle me. I struggle, bound by that terrible powerlessness that
paralyzes us in our dreams. Then suddenly, I wake up, shaken and bathed in
perspiration.
October 15, 1997: I have made a complete recovery. The Microsoft shares I pur-
chased the day after the “irrational exuberance” speech are up 73 percent.
nied_c01.qxd 1/24/03 10:37 AM Page 26

Chapter 1 • The Meme 27
October 20, 1997: I turn on the news and learn that the Justice Department is
accusing Microsoft of violating a court antitrust order. How strange. Mi-
crosoft has done more than any company to bring the computer revolution to
consumers. Is success now suspect?
About 10 o’clock that evening I go up to my room. As soon as I have en-
tered, I lock and bolt the door. I am frightened—of what?
October 27, 1997: A rolling panic that began in Hong Kong last week has en-
gulfed every stock market in the world. In the United States, exchanges halted
trading today after the Dow plunged 550 points. The value investor David Dre-
man said, “Investors finally realize the market is overpriced.”3
October 28, 1997: I look up from my desk in the New York City offices of
Bloomberg News. Ken Kohn, the New York bureau chief, sitting opposite me,
is cackling. “Victor Niederhoffer went under!” he says.
April 30, 1998: The shadow has passed. Jeremy Siegel, the Wharton finance
professor, just introduced an expanded edition of his Stocks for the Long Run,showing that stocks have averaged an annual return of 7 percent after infla-
tion for the past two centuries, twice the return on bonds.4 The Dow has risen
28 percent since that terrible Monday last October, and my Microsoft shares
are up 40 percent. I feel cured.
August 31, 1998: In one month, the world has fallen into chaos. More than 250
people were killed when terrorists simultaneously bombed our embassies in
Kenya and Tanzania. The Saudi terrorist Osama bin Laden said strikes against
the United States would continue “from everywhere.” The next day, President
Clinton ordered a retaliatory strike against bin Laden in Afghanistan and a
nerve gas factory in Sudan—but the strike missed bin Laden, and Sudan in-
sists the factory did not make nerve gas at all, just drugs. People are calling our
counterattacks a terrible instance of life imitating art. Just three days earlier,
Clinton admitted on television that he had had an “inappropriate relationship”
with Monica Lewinsky, a White House intern. A grand jury is investigating
whether he lied about it under oath. A new Hollywood hit, Wag the Dog, re-
leased just before the attacks, features a U.S. president who declares war to di-
vert attention from a brewing sex scandal.
On top of everything else, Russia devalued its currency last week and de-
faulted on its debt. In an attempt to clear my mind with fresh air, I went for a
walk in Central Park. I turned into a shady path in a little-visited area. A sud-
den shiver of agony ran through me, and I hastened my steps, frightened with-
out reason. Suddenly it seemed as if I were being followed, that somebody was
walking at my heels, close, quite close to me, near enough to touch me. I
nied_c01.qxd 1/24/03 10:37 AM Page 27

28 Practical Speculation
turned round suddenly, but I was alone. I returned home to find the Dow av-
erage had closed down 512 points. In four days, it has lost 12 percent. All the
major indexes are down for the year.
September 28, 1998: Some very big hedge funds have lost billions in August
and September. One fund, Long-Term Capital Management, had to be bailed
out for $3.6 billion by 14 banks after losing all but $400 million of what had
been $4.8 billion in net assets. Fear was rampant that the financial system
might collapse under the strain if Long-Term failed to meet its obligations.
Quantum, Omega, and Tiger suffered stiff losses. The public is scared and is
dumping bank stocks. Goldman Sachs, the king of Wall Street, had to cancel
its scheduled initial public offering today. Congress is howling to regulate
hedge funds. I feel the frightening presence of my nightmares lurking out-
side my window almost every evening now. It seems to be laughing wickedly.
I went to a dinner at New York University tonight to hear a speech by
Arthur Levitt, chairman of the Securities and Exchange Commission (SEC).
Levitt said managers are putting out hocus-pocus financial statements with the
complicity of their auditors to pump up market capitalization and increase the
value of their options. He warned executives to put their houses in order. No
more inflated write-offs for restructuring charges, future operating expenses,
and “in-process research” to make future earnings look better. No more stash-
ing profits in the cookie jar for a rainy day. No more booking sales before deliv-
ery takes place. No more quibbling over how big a lie has to be before it is
“material” under Generally Accepted Accounting Principles.5
The lawyers and accountants in the room put down their forks and
started taking notes.
I suddenly felt a chill in the room. An unearthly voice seemed to be laugh-
ing, and I could not escape the feeling that he was mocking Levitt.
May 5, 1999: Was it really a case of Wag the Dog? The U.S. government said it
wouldn’t contest a lawsuit for damages filed by the Saudi owner of the drug
factory we bombed in Sudan last August. I sense the shadow is laughing.
August 2, 1999: Huge accounting frauds are coming to light every week.
Bankers Trust has paid $63 million in fines for stealing dormant client funds
to cover general expenses. Cendant, Livent, McKesson, Rite Aid, and Sunbeam
are embroiled in scandals. Carol J. Loomis, writing in Fortune about the SEC
crackdown, said the cascade of cases suggests “great expanses of accounting
rot, just waiting to be revealed.” She noted that when the Wall Street Journalpublished a front-page story in 1994 about how Jack Welch “smoothed” earn-
ings at General Electric with the “creative use of restructuring charges and
nied_c01.qxd 1/24/03 10:37 AM Page 28

Chapter 1 • The Meme 29
reserves,” the company got calls from other corporations saying, “Well, this is
what companies do. Why is this a front-page story?”
Eventually, “Someone may go to jail,”6 she wrote. I shivered. The night-
mare presence seemed to smile and grow larger as though he somehow
gained strength from these scandals, as bacteria thrive in dirt and darkness.
November 22, 1999: My copy of Fortune arrived in the mail today. I start idly
reading a transcript of speeches that Warren Buffett made in July and Septem-
ber at small but influential private gatherings of technology entrepreneurs and
venture capitalists. A shadow seems to fill the room, and I shiver. The great in-
vestor said that had he been at Kitty Hawk in 1903, he would have shot down
Orville Wright as a service to capitalists. “There were about 300 aircraft manu-
facturers in 1919–1939. Only a handful are breathing today,” Buffett said.7 Is
he mad? Or am I mad? Has not air transport vastly improved travel and com-
merce? Is not aerospace the largest U.S. export industry? Yet here was the
most admired capitalist in the world, telling people that investing in innovative
industries does not pay off.
Buffett did not say if he had considered the impact of dividends, mergers,
acquisitions, or name changes. He did not say whether the early aircraft mak-
ers had gone bankrupt. Nor did he provide numbers on returns or variabilities
to support his assertion that the aerospace industry was a bad investment. He
had selected an industry that may very well have yielded poor returns. Any
student of market history knows that instances of success and failure can be
found in accord with any untested assertion. But many other industries
looked just as promising in 1903—pharmaceuticals, tabulating machines,
and packaged foods, to name a few—that have matured to yield the 1,500,000
percent-a-century returns that the typical investment has averaged since then.
I am amazed to read that Buffett’s remarks drew tremendous applause
and admiration. Jeffrey Bezos, founder of amazon.com, is insisting that
all his executives study the speech. Lenin is supposed to have once said,
“We will all live to see the day that capitalists swing by our ropes from high
trees.” A member of the audience, doubtless with lips closed, shouted out,
“Who will sell us the rope?” Lenin promptly answered, “The capitalists will
sell it to us.”
Who but Lenin himself could have predicted that such a baseless claim,
so at odds with the dynamic and creative nature of the enterprise system,
could have been greeted with such acclaim at conferences on the marvels of
technology?
Mary Buffett’s book, Buffettology, says Buffett views stocks as groceries,
or perhaps a glorified type of annuity, to be bought only when available at
nied_c01.qxd 1/24/03 10:37 AM Page 29

30 Practical Speculation
discount.8 He refuses to invest in growth stocks such as technology issues be-
cause he does not understand them. Instead of taking the time to learn and be
able to discern what is worthwhile about the new, Buffett rejects innovation.
He is like those people who live in the hills hoarding goods necessary for sur-
vival, precious metals for barter, and guns to fight off any desperate survivors
of the apocalypse they are convinced is inevitable.
The antidote to this negativism is a belief in the creative power of individ-
uals to improve their situations through mutually beneficial exchange. This
belief, combined with a belief in the continuing wonders of technology and
innovation, leads to viewing stocks as an excellent investment.
Preparations for millennial celebrations are beginning all over, yet I can-
not get Buffett’s odd anecdotes and the puzzling hatred of the dynamic nature
of the enterprise system out of my mind.
I went to bed and fell asleep, only to be roused two hours later by a terri-
ble shock. Imagine a sleeping man who wakes up with a knife in his chest,
gurgling in his throat, covered with blood, no longer able to breathe, a man
who realizes he is going to die and does not understand why it is happening—
there you have it. Oh! Who can understand my horrible agony? I must escape
these fatalist obsessions.
December 31, 1999: It’s bonus time on Wall Street, and the rewards are worthy
of maharajahs. Morgan Stanley’s Internet analyst, Mary Meeker, will make
$15 million, Bloomberg News reported. Jack Grubman, a Salomon Smith Bar-
ney telecommunications analyst, will probably receive $10 million. At least
5,000 bankers, analysts, and traders will take home $1 million.9
The value of Bill Gates’ Microsoft shares topped $100 billion this year;
more, as Bloomberg’s Brian Rooney noted, than the gross domestic product
of Greece. If Microsoft stock continues to rise 59 percent a year, as it has
for the last decade, Rooney said, Bill’s fortune will surpass U.S GDP
by 2010.10
Every business related to stocks is thriving this year. Assets in Fidelity In-
vestment’s mutual funds have reached a record $1 trillion, and investment
banks have raised almost $24 billion for Internet companies. The Nasdaq has
risen 51 percent from October 19 through today.
It’s all fine, very fine. Yet I keep thinking of Albert Jay Nock’s description
in Memoirs of a Superfluous Man of the turn of the nineteenth century.
Nock quoted a passage from Turgenev’s Clara Militch to describe the spirit of
the time:
He dreamed that he was in a rich manor-house, of which he was the owner. He had
lately bought both the house and the estate attached to it. And he kept thinking,
nied_c01.qxd 1/24/03 10:37 AM Page 30

Chapter 1 • The Meme 31
“It’s nice, very nice now, but evil is coming!” Beside him moved to and fro a little
tiny man, his steward; he kept laughing, bowing, and trying to show Aratov how
admirably everything was arranged in his house and his estate. “This way, pray,
this way, pray,” he kept repeating, chuckling at every word; “kindly look how pros-
perous everything is with you! Look at the horses, what splendid horses!” And
Aratov saw a row of immense horses. They were standing in their stalls with their
backs to him. Their manes and tails were magnificent, but as soon as Aratov went
near, the horses’ heads turned toward him, and they showed their teeth viciously.
“It’s very nice,” Aratov thought, “but evil is coming!” “This way, pray, this way,”
the steward repeated again, “pray come into the garden; look, what fine apples
you have.” The apples certainly were fine, red and round, but as soon as Arratov
looked at them they withered and fell. “Evil is coming!” he thought. “And here is
the lake,” lisped the steward. “Isn’t it blue and smooth? And here’s a little boat of
gold—will you get into it?—it floats of itself.” “I won’t get into it,” thought Aratov;
“evil is coming!” but for all that he got into the boat. At the bottom lay huddled up
a little creature like a monkey; it was holding in its paws a glass full of a dark liq-
uid. “Pray don’t be uneasy,” the steward shouted from the bank. “It’s of no conse-
quence. It’s death. Good luck to you!”
“For the great majority, the last decade of the century seemed to offer
every encouragement to complacent hopefulness,” Nock wrote. “All the insti-
tutional voices of society were blended to form the sycophantic reassurances
of Aratov’s steward.”11
January 5, 1999: I’ve been reading a deeply unsettling theory proposed by the
evolutionist Richard Dawkins. He thinks that a new replicating entity has re-
cently emerged on earth. This entity is still in its infancy, but has already
achieved an evolutionary rate far ahead of traditional genes. He calls this new
entity a meme:
Examples of memes are tunes, ideas, catch-phrases, clothes fashions, ways of
making pots, or of building arches. Just as genes propagate themselves in the
gene pool by leaping from body to body via sperms or eggs, so memes propagate
themselves by leaping from brain to brain in a process which, in the broad sense,
can be called imitation. If a scientist hears, or reads about, a good idea, he passes
it on to his colleagues and students. If the idea catches on, it can be said to propa-
gate itself.12
A fertile meme acts like a parasite in the brain, turning it into a vehicle for
the meme’s propagation just as a virus takes control of the genetic mecha-
nism of its host cell. A meme, although Dawkins says it rhymes with “dream,”
is no mere ethereal concept. A meme that takes hold actually manifests itself
physically, as it modifies the nervous systems of millions of individuals.
nied_c01.qxd 1/24/03 10:37 AM Page 31
32 Practical Speculation
For more than three billion years, DNA was the only self-replicating
mechanism. Now, the new replicators, memes, are taking over and initiating
their own kind of evolution. As was the case with genes, selection will favor
the memes that exploit the environment to their own advantage.
I can scarce believe that a mere thought can yield such awesome power.
The meme concept has me altogether perturbed.
Seeking to escape my troubled reflections, I started leafing through “The
Horla,” a short story by de Maupassant. Suddenly I came across a passage re-
lating the narrator’s conversation with a monk:
Do we see the hundred-thousandth part of what exists? Look here; there is the
wind, which is the strongest force in nature. It knocks down men, and blows
down buildings, uproots trees, raises the sea into mountains of water, destroys
cliffs and casts great ships on to the breakers; it kills, it whistles, it sighs, it roars.
But have you ever seen it, and can you see it? Yet it exists for all that.
January 6, 2000: I am not mad. I have seen . . . I have seen . . . I have seen it!
After closing the millennium at a record high, the Nasdaq 100 has dropped 12
percent in the past three days. That fiber-optics stock everyone has been mak-
ing so much money on, JDS Uniphase, fell 20 percent. Rumors have it that
George Soros’ hedge funds are dumping huge holdings of Nasdaq stocks.
February 17, 2000: The meme is coming at me from all sides. I hear it, I see it
everywhere. It came out of the mouth of Greenspan while I was watching his
twice-yearly speech on the state of the economy to the House Banking Com-
mittee. First he said the economy was better than he had seen in half a cen-
tury. But then he proceeded to float an incredible theory that overturned an
axiom as fundamental to economics as gravity is to physics. He claimed that
demand created by market wealth threatened to outstrip the supply of goods
because stocks are too high:
Without doubt, the synergies of the microprocessor, laser, fiber-optic glass, and
satellite technologies have brought quantum advances in information availability.
These advances, in turn, have dramatically decreased business operational uncer-
tainties and risk premiums and, thereby, have engendered major cost reductions
and productivity advances. There seems little question that further major ad-
vances lie ahead.
. . .
The problem is that the pickup in productivity tends to create even greater increases
in aggregate demand than in potential aggregate supply [Emphasis added]. This oc-
curs principally because a rise in structural productivity growth has its counter-
part in higher expectations for long-term corporate earnings. This, in turn, not
nied_c01.qxd 1/24/03 10:37 AM Page 32

Chapter 1 • The Meme 33
only spurs business investment but also increases stock prices and the market
value of assets held by households, creating additional purchasing power for
which no additional goods or services have yet been produced. . . . [S]o long as the
levels of consumption and investment are sensitive to asset values, equity values
increasing at a pace faster than income, other things equal, will induce a rise in
overall demand in excess of potential supply. But that situation cannot persist
without limit because the supply safety valves are themselves limited.
. . . [T]he necessary alignment of the growth of aggregate demand with the
growth of potential aggregate supply may well depend on restraint on domestic
demand, which continues to be buoyed by the lagged effects of increases in stock
market valuations.
Shaken and in need of an independent opinion, I e-mailed Richard Zeck-
hauser, professor of political economy at Harvard’s John F. Kennedy School
of Government. Zeckhauser’s work examines possibilities for the democratic,
decentralized allocation of resources in accordance with the preferences of the
citizenry. He wrote back:
Neither supply nor demand can be out of line for long. Shortages are always a
short-term phenomenon unless the government interferes and fixes prices. The
reason, of course, is that price adjusts to equate supply and demand.
I think that Greenspan would be worried about a supply shortage because he
does not like the consequence of a temporary shortage; namely he does not like it
when prices rise to bring about an equilibrium. But, of course, this is a healthy re-
sponse, because this is the only way to bring out the resources that will produce
additional supply. But if you hate inflation above all else, you will not like this
response.
This could be a little like hating the swollen, red state of an infection. But of
course, the infection is really just our white blood cells fighting off some foreign
agent. We are better off with these fighters, despite their side effects, than we
would be without them. So, I would say that the price system does a good job of
dealing with supply inadequacies, but not without some dislocation in prices.
One of the elementary, inviolate principles of economics is that if supply
is scarce, prices for that good or service will rise until demand for it falls. This
natural equilibrium is based on rational expectations, and requires no inter-
ference from government. In the eighteenth century, Adam Smith wrote of
an invisible hand. In our day, Heyne observed in his classic text, The EconomicWay of Thinking, “People want more or less of a good as the cost those people
must pay decreases or increases.”
Now I know. I can divine. The reign of rational thought is over. Woe to us!
It has come. I have heard . . . the Meme . . . it is here . . . the Meme!
nied_c01.qxd 1/24/03 10:37 AM Page 33

34 Practical Speculation
March 1, 2000: Now the Meme is replicating and mutating. I saw it today in
Berkshire Hathaway’s annual report. Buffett again! “Equity investors cur-
rently seem wildly optimistic in their expectations about future returns.”
Greenspan again! Today, the Fed released verbatim transcript of its 1994
meetings. Never before had meeting transcripts been released to the public.
The Fed had decided in 1994 to release them with a five-year lag.
The transcripts show that Greenspan and his cohorts had been patting
themselves on the back for arresting a possible stock market bubble. “I think
we partially broke the back of an emerging speculation in equities,” Greenspan
told members of the Fed’s policy-making body, the Federal Open Market Com-
mittee, in a February 1994 conference call. “As we look back on this, I suspect
that there was a significant overshoot in the market. We pricked that bubble.”
The horror! When did the stock market become the Fed’s business?
Greenspan repeated his comment the following month, according to the
transcript of the March 22, 1994, FOMC meeting. “When we moved on Feb-
ruary 4th, [1994], I think our expectation was that we would prick the bubble in
the equity markets,” Greenspan told the committee members. (In the previ-
ous year, the Dow Jones Industrial Average had risen 18 percent—to 3967.)
Ah, I can imagine the scene. The Fed governors, seated at the long pol-
ished table in grand chairs, served on china by obsequious waiters, laughing
genially at the chairman’s jokes, grinning at their victory over the market. It
makes me think of the old men who used to sit in armchairs at the windows
of Manhattan’s grand clubs, murmuring with disapproval at the sight of a
stray Jew walking along Fifth Avenue.
The federal funds rate increases over the past eight months with no infla-
tion in sight—all is clear now! The old men at the Fed do not like to see ordi-
nary people making money in the stock market. They do not like the young
entrepreneurs making money in new technology ventures. They especially do
not like the day traders, who are said to make hundreds of thousands in a day
without even knowing the business of the stocks they trade. The old men
want investors to have graduated from the schools that they did and to look
like them. An elitist meme has taken over a country where everyone should
have equal opportunity to profit from an investment in capitalism. Alexander
Pope once said: “Most old men are like old trees. Past bearing themselves,
they will suffer no young plants to flourish beneath them.”
Despite the grotesque servility with which the media treat the old men,
they are only reincarnations of the senex amans, that comic character who ap-
pears throughout the centuries in literature and opera, the old man who tries to
win the young girl for himself. In The Canterbury Tales, he is the 60-year-old
bachelor January who insists on marrying a girl who is not more than 20, only
nied_c01.qxd 1/24/03 10:37 AM Page 34

Chapter 1 • The Meme 35
to be cuckolded by a lusty young rival. In Rossini’s Barber of Seville, Dr. Bartolo
pants after his young ward, Rosina. In Mozart’s The Marriage of Figaro, old Mar-
cellina tries to snare young, handsome Figaro by lending him money. Victori-
ans appreciated the senex amans theme so much that Gilbert and Sullivan used
it in Iolanthe, The Mikado, H.M.S. Pinafore, and The Pirates of Penzance.I went to bed and had a terrible nightmare. I felt somebody sucking my
life out—sucking it out of my neck as a leech would suck blood. Then he got
up, satiated, and I woke up, so beaten, crushed, and annihilated that I could
not move. Have I lost my reason? What has happened? What I saw is so
strange that my mind wanders when I think of it!
March 14, 2000: The Meme, moving with incredible speed now, has reached
the White House and London. President Bill Clinton and Prime Minister
Tony Blair called for immediate public access to raw genetic data collected by
private companies. “Our genome belongs to every member of the human
race,’’ Clinton said. “We must ensure that the profits of human genetic re-
search are measured not in dollars but in the betterment of human life.’’
Craig Venter, whose company, Celera, was on the verge of beating a govern-
ment team in a race to map the human genome, commented, “Being a busi-
ness seems to be an awful thing today.” The Amex Biotech Index plunged 13
percent today.
March 21, 2000: I can only wait, paralyzed, powerless. I feel the Meme’s pres-
ence nearby, looming over me, looking at me, dominating me. The Fed raised
interest rates today to 6 percent from 5.75 percent, claiming it “remains con-
cerned that increases in demand will continue to exceed the growth in poten-
tial supply, which could foster inflationary imbalances that would undermine
the economy’s record expansion.”
April 4, 2000: Judge Thomas Penfield Jackson ruled last night that Microsoft
violated antitrust law. The Nasdaq, synonymous with technology, lost 349
points yesterday in advance of the decision, and dived 575 points this morning
before miraculously wafting up to close at 4148, down 75.
A new blockbuster has hit bookstore shelves: Irrational Exuberance, by
Robert Shiller, the Yale professor who invented the contagious phrase and
passed it to the Fed chairman back in 1996.13
April 28, 2000: Nobody thinks there will be any more miraculous levitations in
the Nasdaq. Stanley Druckenmiller resigned from the Soros organization
today, saying he lost billions on technology stocks. “I never thought the Nas-
daq would drop 35 percent in 15 days,” he said. Yet, in the three terrible weeks
leading up to the April 15 tax deadline, that is exactly what happened.
nied_c01.qxd 1/24/03 10:37 AM Page 35

36 Practical Speculation
May 16, 2000: The Fed raised interest rates yet again today, to 6.5 percent.
Does the Meme want to destroy all?
August 31, 2000: The first year of the new era so happily welcomed is not even
over, but everything has changed to fear and viciousness. Rising interest rates
have choked off capital spending. Hundreds of thousands of entrepreneurs
and workers are out of work.
An enveloping torpor has set in everywhere from corporate boardroom
planning sessions to ordinary investors’ kitchen-table discussions.
The Meme is ubiquitous now. Reporters are reaching into their Rolodexes
to find “experts” whose chronic pessimism had discredited them in the 1990s.
The leader of the claque is Alan Abelson, the star columnist at America’s most
influential financial weekly, Barron’s. Two new stars were elevated to the pan-
theon: David Tice of the short-selling Prudent Bear Fund and Robert Shiller,
whose thoughts on “irrational exuberance,” high price/earnings ratios, and
general bearishness are in much demand on the TV networks.
December 6, 2000: The Meme is spreading like a viral pandemic. More and
more are being infected. The big shoes of the Fed chairman are higher off the
ground than the Nasdaq, already down 50 percent from its Y2K high. The
only thing lower than the Nasdaq is the record of the New York Knicks, whose
center fights with his own teammates when he does not get the ball. Alan
Greenspan and Patrick Ewing have too much hubris for their positions. They
could switch roles, and everyone would benefit.
December 7, 2000: We send Size 12 basketball shoes to Greenspan and suggest
that he trade places with the big center of the Knicks. We send him The Edu-cation of a Speculator as a further gesture of goodwill.
January 2, 2001: We receive an e-mail: “I’ve been reading your stock market
column on the Internet, and I liked the one where you said you were going to
buy a googol of Internet stocks on margin. I called my broker from my cell
phone. I tried to say, ‘Buy me such-and-such stocks.’ But instead of this I
shouted—I did not say, but I shouted—in such a loud voice that all the
passers-by turned around: ‘JUST . . . SELL . . . EVERYTHING!’ ”
January 3, 2001: The Nasdaq rises 324 points. The reader who sold everything
is lost! Like a pestilence, the Meme relentlessly pursues both those in its path
and those who flee from it. No one is safe.
February 7, 2001: A box and a letter arrive from the Fed. “Thank you very much
for sending the sneakers to Chairman Greenspan. However, it is against our
ethics policy to accept gifts, and we are accordingly returning them herewith
along with your book.”
nied_c01.qxd 1/24/03 10:37 AM Page 36

Chapter 1 • The Meme 37
We wonder whether the chairman scrupled to return the book by the pro-
fessor of irrational exuberance, Robert Shiller, who told us he sent a copy to him.
April 4, 2001: When a plague overwhelms a city, people trying to escape only
carry the disease to new places. So, too, the market has resumed its slide. The
value of the U.S. stock market has fallen by $5 trillion—31 percent—in just
over a year since its March 24, 2000, peak. It makes us feel so weak, so igno-
rant, so small. But that is what the Meme wants!
August 31, 2001: I awoke from a restless sleep last night and heard a chilling
voice chanting in the corner of my room: “You can’t trust yourself, can’t trust
the Street, can’t trust the CEO, can’t trust your broker, can’t trust the market.”
I turned on the light. The voice fell silent. No one was there.
September 15, 2001: Unspeakable horror. On September 11, a group of Islamic
fanatics destroyed the World Trade Center and one side of the Pentagon, the
very heart of America’s military power. Everyone is in a state of shock, practi-
cally immobilized by fear. The attack destroyed communications links in
lower Manhattan, the location of the New York Stock Exchange, and the mar-
ket has shut down indefinitely. All airliners and crop dusters have been
grounded. Nobody wants to leave home anyway. In Manhattan, the few open
hotels, restaurants, and theaters are deserted. The terrorists are the very ones
President Clinton failed to deal with after the attacks on our embassies.
September 16, 2001: A strange trio appeared on television today. Robert Rubin,
Jack Welch, and even Warren Buffett are on the side of the bulls. Rubin “sees
long-term strength,” and Welch says the United States is “the best place in the
world to invest.” With reluctant optimism, the Nebraska icon himself opined
that it would be “crazy” to sell stocks now. If only he had not added: “If prices
would fall significantly, there are some things I might buy,” he might have
helped stanch the market’s hemorrhage. Then again, there are rumors that if
the market declines, Buffett will make $500 million. I am not relieved, but
frightened and haunted, by what this trio has said.
Then there are the eerie charts. Loews Corporation reportedly lost hun-
dreds of millions of dollars in the last half of the 1990s by betting on market
declines. Loews Co-Chairman Lawrence Tisch often perused a chart showing
the Dow at the time of the 1929 crash and Japan’s Nikkei when it began its
tumble from 40,000 to 10,000. The chart now finally bears a macabre re-
semblance to the Dow and Nasdaq.
September 21, 2001, Morning: Last night, President Bush gave what many called
the finest American presidential address ever. He said that our grief had
turned to anger, and our anger to resolution; that we would bring our enemies
nied_c01.qxd 1/24/03 10:37 AM Page 37

38 Practical Speculation
to justice, or bring justice to our enemies. The market shot up on his speech.
But then the Meme called on one of its brothers in France to explode a chem-
icals factory. With the terror that had already spread, the explosion was more
than enough to cause the greatest decline in market history.
I was short the naked put, and there was a special open that might have
killed me. My brokers seem to be cousins with the Meme, and ordered me to
cover up my nakedness.
September 21, 2001, Evening: Ah! The Meme would make of us what we have
made of the horse and of the ox: its chattels, its slaves, its food. Woe to us! But
nevertheless, the animal sometimes revolts against the one who has subju-
gated it. . . .
The little nail can topple an empire. But the empire, when it knows that it
needs to protect itself, can fight back and accomplish marvels. Scientists first
split the atom to beat the Nazis. The countries of the world have finally awak-
ened to the fact that if they do not defend the technology and the trade that are
the Western way, then freedom itself will vanish. The market gained back al-
most everything it lost during the day. The brainwashing of the West by the
Meme has ended. I predict that there will be a gigantic rally in the market from
the Dow 8235 level reached today, and that the Meme, like Frankenstein and
many other monsters, will die in the fire that looked to be its greatest victory.
January 8, 2002: The Dow is now at 10,150, in an abundance of delight. The
puts that were selling at 100 to 200 have gone down to pennies. It is the same
as with the Thai banks that I owned during 1997. But this time, I am short,
not long, and the profit is mine, and the loss is the Meme’s. The Meme has
blown itself up. It is dead.
March 9, 2002: I look at the morning newspaper. A headline catches my eye:
“Buffett: ‘No feasting on this market.’ ” I read on. “‘Our restrained enthusi-
asm for these securities is matched by decidedly lukewarm feelings about the
prospects for stocks in general over the next decade or so,’ Buffett wrote in his
annual letter to shareholders. ‘Charlie [Munger] and I believe that American
business will do fine over time, but think that today’s equity prices presage
only moderate returns for investors.’ ”14
No . . . no . . . no! Without a doubt, the Meme is not dead! When will it
die? Only when people realize they must think for themselves: To count for
themselves. To believe in their abilities to create. To live longer and better. To
lend money to the men and women with the good ideas.
March 31, 2002: The market is up almost 20 percent from the low it set after
the World Trade Center attack last year. Perhaps the Meme and his darkness
are finally gone.
nied_c01.qxd 1/24/03 10:37 AM Page 38

Chapter 1 • The Meme 39
July 23, 2002: I am so sad I can hardly get out of bed. I sleep to escape the
Meme, who now seems to rule my waking hours. I bought stocks after the
panic last September, and neglected to sell them before going abroad. Upon
my return several months later, I find that my accounts have dwindled to pa-
thetic shadows of what they were. I am afraid, deeply afraid.
September 10, 2002: Tomorrow is the anniversary of the World Trade Center
attack, and everyone is in dread that something even more terrible will hap-
pen. A dirty bomb, perhaps, spewing radiation? S&P futures rise 10 points
and close at 911. Today’s New York Lottery numbers are 9-1-1. Any rational
person would call them coincidences. But maybe we have gone beyond ra-
tionality. Maybe the Meme has signed his name.
September 17, 2002: A thousand unspeakably horrible stories of evil hidden in
the lights and flash of the 1990s boom are crawling out, pulled out of the dark-
ness by prosecutors and the media. Dennis Kozlowski, the CEO of Tyco and a
golden boy of corporate America, has been indicted with his chief financial of-
ficer for bilking the company of $600 million. According to the company’s
own SEC filing, Kozlowski billed Tyco for his wife’s $1 million birthday party
on the island of Sardinia. The details included a welcoming line of gladiators
and a waiter pouring Stolichnaya vodka into an ice sculpture of a boy with the
liquid dispensed through the penis. The Kozlowskis did invite a few Tyco exec-
utives, and regarded it as a business expense.
The Meme loves it. I can hear its sarcastic laugh.
October 2, 2002: Hardly a week has gone by this year without a fresh disclosure
of secret deals, false earnings statements, or frauds committed in broad day-
light under the noses of corporate directors. The U.S. Justice Department has
opened more than 400 investigations into possible corporate fraud since the
beginning of 2000, and has charged more than 500 people with corporate
crimes. Enron’s chief financial officer has made a court appearance in hand-
cuffs, as have Tyco’s CEO and CFO. The former controller of WorldCom
pleaded guilty to cooking the books to come up with $5 billion in fraudulent
profits, and is facing a five-year prison term. More analysts are under investi-
gation nowadays than are writing research reports—not that anyone believes
the reports any more.
Global Crossing, WorldCom, Enron—all golden 1990s stocks, all bank-
rupt now. The Meme feeds on the news. I sense him growing stronger and
bolder. He has made the stock market his food. Just looking at the numbers
make my head ache. Nasdaq: down 3,908 points from the high of early 2000
to the low on October 4, 2002. The Dow: down to 7,528 from 11,700.
nied_c01.qxd 1/24/03 10:37 AM Page 39

40
Time Line of a Meme
Date Action
December 5, 1996 Federal Reserve Chairman Alan Greenspan opens Pandora’sbox with “irrational exuberance” speech; makes case fortargeting the market ’s “wealth effect.”
October 20, 1997 U.S. Justice Department sues Microsoft for requiringcomputer makers to install the company’s Internet Explorerbrowser if they want to license Windows 95.
May 18, 1998 United States, 20 states file antitrust case against Microsoft.
August 7, 1998 Bombings of U.S. embassies in Nairobi, Kenya, and Dar EsSalaam, Tanzania.
August 20, 1998 President orders retaliatory bombing of Osama bin Laden basein Afghanistan; bin Laden leaves one hour before attack.
July andSeptember 1999
Warren Buffett, in private speeches reported in November byFortune, says he would have shot down Orville Wright ’s planeas a service to capitalists, predicts years of poor performancefor U.S. stocks.
November 5, 1999 Judge Thomas Penfield Jackson rules Microsoft usedmonopoly power to stifle innovation.
February 17, 2000 Greenspan signals further increases in interest rates; saysstock market gains may create more demand for goods thancan be supplied.
February 18, 2000 Boiler Room, a film about a shady brokerage that cheats naïveinvestors, released. “A thoroughly enjoyable movie which doesan excellent job showing us how the lust for money cancorrupt us all,” wrote critic John Beachem.
March 1, 2000 Warren Buffett writes in annual report to Berkshire Hathawayshareholders that “Equity investors currently seem wildlyoptimistic in their expectations about future returns.”
March 8, 2000 Al Gore wins Democratic presidential nomination, inveighsagainst big business.
March 10, 2000 Nasdaq peaks at 5048.
March 14, 2000 President Clinton and U.K. Prime Minister Blair call forimmediate public access to raw genetic data collected byprivate companies. “Our genome belongs to every member ofthe human race,” Clinton said. “We must ensure that theprofits of human genetic research are measured not in dollarsbut in the betterment of human life.” Nasdaq falls 200 to4706. “Being a business seems to be an awful thing today,”says Craig Venter, founder and president of Celera, a genomics
nied_c01.qxd 1/24/03 10:37 AM Page 40

41
Continued
April 3, 2000 Judge Thomas Penfield Jackson rules Microsoft violatedantitrust law. Nasdaq drops 349. Next day, Nasdaq falls 575 to3649; rebounds to close at 4148.
October 12, 2000 Suicide bombers attack the USS Cole in the Yemeni port ofAden.
November 7–December 13, 2000
United States gripped with uncertainty as Florida presidentialelection ballots are counted and recounted. Gore concedeselection to Bush on December 13. Nasdaq loses 17% in theintervening five weeks, S&P drops 5%.
September 11, 2001 Islamic terrorists destroy the World Trade Center, WorldFinancial Center, and much of lower Manhattan; Pentagonattacked.
September 21, 2001 U.S. stocks conclude their worst week in 70 years.
December 2001 Enron files for bankruptcy protection.
April 2000 Robert Shiller, an economist who briefed Greenspan two daysbefore the “irrational exuberance” speech, publishes book ofthat name, becomes instant media star.
January 2002 Global Crossing files for bankruptcy protection.
June 2002 Adelphia files for bankruptcy protection. CEO arrested onfraud charges.
June 2002 Arthur Anderson convicted of obstructing justice in Enronfraud case, can no longer audit public companies.
July 2002 WorldCom files for bankruptcy protection. CFO and controllerarrested on fraud charges.
September 2002 Tyco’s former CEO and CFO charged with looting the companyof $600 million.
firm. “Instead of celebrating that a public company is doingthis and releasing it for free, they are complaining because acompany is doing it faster than they are and for less money.”
Date Action
nied_c01.qxd 1/24/03 10:37 AM Page 41

42 Practical Speculation
Ah, I understand it all now. The Meme knew all along that the contagious
optimism of the 1990s had left no one able to withstand a decline. It didn’t
want any short-sellers still solvent when the market finally went down. Now,
the market and business are subjects of public contempt.
The passing of the 1990s’ ebullience has left a vacuum. Viktor Frankl
said, “Unlike an animal, man is not told by drives and instincts what he must
do. And in contrast to man in former times, he is no longer told by traditions
and values what he should do. Now, knowing neither what he must do nor
what he should do, he sometimes does not even know what he basically
wishes to do. Instead, he wishes to do what other people do—which is con-
formism—or he does what other people wish him to do—which is totalitari-
anism.” I fear this will not end well.
nied_c01.qxd 1/24/03 10:37 AM Page 42
43
2 E A R N I N G SP R O P A G A N D A
The poor bastard didn’t even know that 10 percent of
the net was 10 percent of nothing.
—Mario Puzo, The Last Don1
Let’s start at the very beginning. The one thing that everyone, from the
most uninformed layperson to the most erudite professor, knows about
the stock market is that earnings determine returns. Chapter 1 of every fi-
nance textbook, Lecture 1 of every Investment 101 class, and every news dis-
patch all agree:
• Earnings and the market move up and down together.
• The greater the earnings increases, the higher the market’s return.
• When earnings are up, it is time to buy stocks, and when earnings are
down, it is time to sell.
• When the market’s price/earnings (P/E) ratio is high, it is time to sell.
Each of these axioms is false. As you’ll see, each is completely opposite to
the actual empirical relations. Almost everything investors are taught about
nied_c02.qxd 1/24/03 10:36 AM Page 43

44 Practical Speculation
the relation between earnings and stock market returns, whether in
business schools or on the stock market pages of newspapers, is
wrong.
Why do people so readily embrace these fallacies?
Like all propaganda, they have an appealing, superficial plausibil-
ity. The interests of those who promote propaganda are always dia-
metrically opposed to those of the propaganda’s targets. What
better way to maintain the propagandist’s power and profits than to encour-
age investors to buy and sell stocks in ways that further shift the wealth to the
propagandists?
It is true that professionals value stocks based on a discounted stream of
earnings, cash flows, and dividends. But that is one of those maxims, such as
“Never be disrespectful to authority,” that contains enough misinformation to
cause abundant harm if the investor follows it to the letter without consider-
ing the rest of the picture.
Stock moves from one day to the next are primarily related to transient
factors and random changes. In short-term periods, the market tends to go
down after several days of excessive optimism, and it tends to go up after a
similar run of excessive pessimism. Attributing these swings in optimism
and pessimism to earnings would be incorrect. It would also be dysfunctional,
because no matter whether news reports say stocks are going up on earnings
optimism or down on earnings pessimism, these assertions amount to noth-
ing more than an invitation to trade—and to trade the wrong way. If the pub-
lic were to realize this, however, it might also figure out that its interests
would be better served by less frequent trading—and that would mean less
power and fewer perks for the more successful and powerful players.
In addition to maintaining Wall Street in its accustomed comfort, the
earnings-returns fallacy gives an opening to other classes of players with dif-
ferent incentives: those who have no truck with American enterprise and mar-
kets. A poor earnings report always brings out the chronic pessimists, who
seem to relish the idea that business stinks and that stocks will fall. It gives
them one more off-the-wall reason that the American economy has been, is,
or will be much worse than it appears on the surface. A whole herd of stale fi-
nancial academicians with their own money safe, though stagnant, in T-bills
are always ready with flawed studies showing that when P/Es are above the
levels of the 1930s, the market is likely to fall dramatically. When P/Es get
high and stocks by chance go down in some subsequent period, how these
scholars swell with pride.
These studies, in turn, energize the value boys, who still revere Benjamin
Graham even though his methods enabled him to go broke at least twice and
nied_c02.qxd 1/24/03 10:36 AM Page 44

Chapter 2 • Earnings Propaganda 45
kept most of his followers out of the bull market of the 1980s and 1990s,
when the Dow rose 14-fold. The Rea-Graham mutual fund actually put Gra-
ham’s methods into practice in 1976. Investors who put money in the fund at
inception would have had two-thirds less 10 years later than if they had put
the same amount in the S&P 500, with dividends reinvested.
If only stocks would be down when past, current, and future earnings
look great, the sponsors and champions of these fallacies would be in ecstasy.
Unfortunately for them, things never work out that way. As they wait for that
sweet spot in time, they find they miss all the great accretions in wealth, much
to their seething resentment. There is no hatred more virulent than that of old
guard members who have stood idly by watching more vigorous minds re-
place them in the firmament.
Fuzzy Measures
The truth is, there is just too much uncertainty, latitude, and fuzziness in the
level, timing, and volatility of earnings comparisons and expectations to place
undue reliance on them. Consider this scene from Mario Puzo’s The LastDon. The studio big is talking to Ernest Vail, the gifted but naïve best-selling
author: “I smell a big hit. And remember—you have 10 percent of the net.
You have a natural flair. You can get rich on this picture, especially if it wins
the Academy.” (Previously the big had told Claudia, the heroine, that the
script was “a piece of .”)
Claudia, like a select few investors, and now the readers of this book,
knew better. She “could see Vail swallow the hook. The poor bastard didn’t
even know that 10 percent of the net was 10 percent of nothing.”
The catch to getting a percentage of net was highlighted by a 1989 article
in Los Angeles Lawyer.2 The authors, Steven Sills and Ivan Alexrod, wrote that
fewer than 5 percent of films showed a profit for “net participation pur-
poses.” In just one example, the 1994 film Forrest Gump was one of the most
successful movies of all time, grossing some $650 million. Winston Groom,
the author, had a contract to receive 3 percent of net profits. But like Ernest
Vail and the many investors who have watched with amazement as the value
of their shares vanishes along with corporate earnings, Groom was aston-
ished to find Paramount reporting a $60 million loss on the movie. Para-
mount had charged a 32 percent commission on Forrest Gump “to cover costs
of future films that might fail.” (The film’s star, Tom Hanks, more experi-
enced in the ways of Hollywood and perhaps benefiting from better legal ad-
vice, negotiated a share of the gross. As for Groom, he settled his lawsuit
nied_c02.qxd 1/24/03 10:36 AM Page 45

46 Practical Speculation
against Paramount for a promise of a share of the gross in a Gump sequel
that never materialized.)
Vail and Groom both learned the hard way about the all-too-ephemeral
nature of earnings. Unfortunately, financial life and death often hang in the
balance.
Testing the Beliefs
Shrewd articles know that they will not get far in life by relying on conven-
tional explanations of market moves. But the great majority of investors are
deceived on both the big and the small aspects of this relation.
To ensure that our readers do not fall prey to the deceptions,
we tested each one of the commonly held beliefs enumerated
earlier.
First, it is necessary to examine the actual relations between earnings and
market returns. There are many different leads, lags, and ratios to be tested.
The best way to reveal these relationships is with a scatter diagram, as dis-
cussed in Chapter 8. If these data tend to lie close to the line of best fit, then
there is a strong relation. If the data appear to lie in a shapeless mass around
the line, there is little or no relation. Each of the charts uses earnings data
from the Standard & Poor’s Securities Price Index Record for 2001, updated
with current figures, and returns data from the London Business School’s
comprehensive database of global markets, discussed in detail in Chapter 9.
We start with the relations in the same year. Stocks are supposed to go
down when earnings are down and go up with earnings are up. But they
don’t. In fact, the opposite relation holds:
1. If reported S&P 500 earnings rise in a year, the S&P 500 is likely to per-
form worse than average that year.
2. If reported earnings fall in a year, the S&P 500 is likely to perform bet-ter than average that year.
The inverse relation is shown in Figure 2.1. Notice how the line of best fit
slopes gently from the northwest quadrant to the southeast. This is the hall-
mark of what statisticians call a negative correlation. When earnings are down,
there are many more occasions when stocks are up than when stocks are
down. (Unless otherwise noted, both the y variable and the x variable—the de-
pendent and independent, respectively—will be measured as percentage
changes throughout this book.)
Earnings declined in 22 of the 65 years studied. The average return for the
S&P 500 during each of those down years was up 14.2 percent. This compares
nied_c02.qxd 1/24/03 10:36 AM Page 46

Chapter 2 • Earnings Propaganda 47
with an average annual return of 4.9 percent in the other 43 years, when earn-
ings increased.
We used regression analysis to calculate an equation that expresses this
slightly inverse relation between earnings and the next year’s market return
as a line of best fit: S&P 500 return = 9.6 percent minus one-fifth of the an-
nual percentage change in S&P earnings.
9.6% − 1/5 (S&P 500 ∆)
For example, say S&P 500 earnings rose 22 percent in a year. Plugging
that number into our formula gives 9.6 percent − 1/5 (22 percent), or a pre-
dicted rise of 5.2 percent for the S&P 500. (Bear in mind that the upward drift
in the market averages 9.6 percent a year, so a 5.2 percent gain would be sub-
par.) If S&P earnings fell 22 percent in a year, we would expect the S&P to re-
turn 9.6 percent − 1/5 (−22 percent), or 14 percent.
The equation explains some 5 percent of the total variation in stock prices
from normal. Another way of saying this is that if a person knew nothing
about earnings change in a year, the best forecast of S&P 500 returns in 2002
would be 9.6 percent—the average drift per year. That forecast would have a
wide margin of error, which would be reduced by 0.5 percent by using the
Figure 2.1 Change in Current Year’s Earnings as Predictor of Change inNext Year’s SPX, 1937–2001. Source: Standard & Poor’s Security PriceIndex Record.
–0.3
–0.2
–0.1
0.0
0.1
0.2
0.3
0.4
0.5
–0.5 0.0% Change in Current Year’s Earnings
% C
hang
e in
Nex
t Yea
r’s S
&P
500
Inde
x
0.5
y = 9.6% – R2 = 0.5%
1⁄5 (x)
nied_c02.qxd 1/24/03 10:36 AM Page 47

48 Practical Speculation
earnings formula. A reduction at least as large as that would occur a mere 7 in
100 times through chance variations alone.
Given that earnings and S&P 500 returns are inversely related during a
year, then, the question arises whether relations based on quarterly numbers
are predictive. No. The same inverse relation holds. The scatter diagram of
quarterly percentage changes in earnings versus the next quarter’s S&P 500
return shows this. Again, the dots cluster in the northwest and southeast parts
of the graph, indicating a negative correlation.
If earnings rise in a quarter, the S&P 500 is likely to perform below aver-
age in the next quarter. If earnings fall in a quarter, the S&P 500 is likely to
outperform in the next quarter, as shown in Figure 2.2.
Using the data for the 65-year period, during which time the trend of
quarterly S&P 500 returns was 2.5 percent a quarter, we worked out a regres-
sion formula that roughly predicts S&P 500 returns based on earnings
changes. The best formula for predicting the expected change in the S&P
index from one quarter to the next is:
Expected S&P returnin next quarter
less 1/16 of the year-over- yearpercent change in S&P quarterly earnings=
2 5. %
Figure 2.2 Change in Current Quarter’s Earnings as Predictor of Changein Next Year’s SPX, 1937–2001. Source: Standard & Poor’s Security PriceIndex Record.
Nex
t Qua
rter
S&
P 5
00 In
dex
% C
hang
e ov
er C
urre
nt Q
uart
er
0.4
0.3
0.2
0.1
0.0
–0.3
–0.2
–0.1
1.00.50.0Current Quarter’s YOY Earnings Change (%)
–0.5
y = 2.5% – R2 = 3%
1⁄16 (x)
nied_c02.qxd 1/24/03 10:36 AM Page 48

Chapter 2 • Earnings Propaganda 49
This predictive relation explains 1 percent of the total variation in S&P
500 Index prices. Because this calculation is based on 258 quarters, compared
with the 40 observations that went into the yearly relation reported previously,
the chances that this one is due to chance alone are less than 1 in 200.
While we were examining earnings and returns data up, down, and up-
side in search of relations, we discovered an unexpected predictive link (see
Figure 2.3). It is an old saw in the market that stocks have predicted nine of
the last five recessions. But as we analyzed all the possible relations between
earnings and market returns, we discovered that S&P returns in one quarter
anticipate profit changes in the next. The relation here is:
Next quarter’s earnings change = 2% plus 1/3 of the previous
quarter’s stock return
The preceding formula explains 3 percent of the variations in earnings
changes, and this is a highly statistically significant result for the 258 quarters
considered. The relation, of course, is good for predicting earnings, not returns.
We ran our conclusions by one of our readers, Bill Egan, a PhD whose
specialty is a rare combination of analytical chemistry and applied statistics.
Not only that, he is married to a psychometrician, so statistical acumen runs
in the family. The Egans ran some calculations of their own on independent
Figure 2.3 S&P 500 Predicts Earnings: Current Quarter’s Change in S&P500 as Predictor of Change in Next Year’s Earnings. Source: NiederhofferInvestments.
Nex
t Qua
rter
’s E
arni
ngs
Cha
nge
1.0
0.5
0.0
0.3 0.4–0.2Current Quarter’s Change in S&P 500
–0.3 –0.1 0.1 0.20.0
y = 2% + R2 = 3%
1⁄3 (x)
nied_c02.qxd 1/24/03 10:36 AM Page 49

50 Practical Speculation
data sets that verified our conclusions. Using weekly data from 1962 to 1994,
the Egans also found that the return in the S&P 500 is good at predicting fu-
ture earnings but that earnings moves themselves are inversely related to fu-
ture S&P 500 changes.
These regression equations do not explain past variations in stock re-
turns; they merely account for a portion. But this knowledge, scant as it is, is
better than being buffeted by the financial media like a tumbleweed in the
wind, and far better indeed than to end up like the unprofitable scriptwriter
Ernest Vail because you have tied your fortunes directly to “net.”
Irrational Ratios
The P/E-return relation follows like a carriage behind a horse from the earn-
ings-return relation. Low P/Es, in the popular mind, tend to be associated
with good returns and high P/Es with bad returns. That idea figured promi-
nently in the famous “irrational exuberance” speech of Fed Chairman Alan
Greenspan on December 5, 1996. Yale University Professor Robert
Shiller had used the phrase irrational exuberance when he presented
a P/E study to Greenspan at the Fed the day before. Shiller, in his
2000 book Irrational Exuberance, makes the case that high P/Es are
associated with inferior performance over the next 10 years and low P/Es are
associated with good performance over the next 10 years. He uses 10-year av-
erages of P/Es and 10-year forward returns to derive his conclusions. Because
of the high degree of overlap, one might reason that there are not enough ob-
servations in a statistical or practical sense to come to any conclusions with a
reasonable degree of confidence. After all, in 100 years, there are only 10 in-
dependent 10-year periods, and certainly the last 30 years (in which there are
three independent nonoverlapping 10-year periods) might be assumed to be
more important than the previous 70.
Professor Shiller told us at a luncheon interview that what actually
prompted the chairman to cross the long-standing line that had prevented the
Fed from fighting stock market battles was a calculated query that he had
posed to Greenspan at lunch: “When was the last time a Fed chairman actu-
ally commented that he thought the level of stock prices might be too high?”
Counting out the actual relation between broad-market P/E and subse-
quent stock performance is not as easy a task as it might seem. In March
2002, the price-earnings ratio of the S&P 500 was 29, according to Standard
& Poor’s; or 40, according to Barron’s; or 62, according to Bloomberg. Take
your pick. Compare those levels with the 16.1 average over the past 50 years—
nied_c02.qxd 1/24/03 10:36 AM Page 50

Chapter 2 • Earnings Propaganda 51
or, again, some other number of your choice. You might well ask how it is
possible to conclude anything about so mercurial a financial ratio.
There is no easy solution to the problem of such discrepancies in P/E
data. Many companies on a calendar year don’t report results until mid-April.
As a result, it is often difficult to determine whether a particular P/E number
reflects the past 12 months of reported earnings or calendar-year earnings.
Moreover, it is uncertain whether companies that lost money (and hence have
“negative earnings”) are included in the overall market’s P/E calculation. Yet
another problem is that the earnings may be revised subsequently, so that
data originally reported are quite different from what eventually appears in
summaries, price records, and data sources many years thereafter.
Looking back in time, the P/E-returns link is nebulous. The P/Es of 30
that prevailed in 1929 and the poor returns in subsequent years are always
cited as evidence of a predictive relation. But at the beginning of 1970, the
S&P 500 P/E was 16 and the subsequent five-year annualized return was −6
percent per year. At the beginning of 1994, the P/E was 21.3 and the subse-
quent five-year annualized return was 21 percent.
How can we determine, in a systematic, scientific fashion, the actual rela-
tion of P/Es and returns, instead of just relying on anecdotes and vague im-
pressions? The first step in discovering what relations exist, if any, is to use
the information that would have been available to an investor when making
the decision to buy or sell. We use the printed past copies of the Standard &
Poor’s Price Index Record for this purpose.3 The data considered were from
1974 to 2001.
Next, it is necessary to examine scatter diagrams. Figures
2.4, 2.5, and 2.6 show the relation between P/E levels at the
opening of a year to S&P 500 returns in subsequent years one,
five, and nine.
The charts show the shakiness and time-sensitivity of the P/E-returns re-
lation. In Figures 2.4 and 2.6, which illustrate one-year and nine-year returns,
the line slopes down from left to right, showing a slight inverse relationship.
In other words, high P/Es have a slightly negative, but statistically insignifi-
cant, and almost certainly random, impact on the market in the next one- and
nine-year time frames.
In Figure 2.5, the five-year returns chart, the line is horizontal, showing
no association between P/Es and returns for the next five years. For that time
period, P/Es had no predictive value.
In his 2000 book, Irrational Exuberance, Robert Shiller omitted to show
the five-year chart or those of any other time frames that showed a positive
relationship. Those charts would not have shown irrational exuberance. A
nied_c02.qxd 1/24/03 10:36 AM Page 51
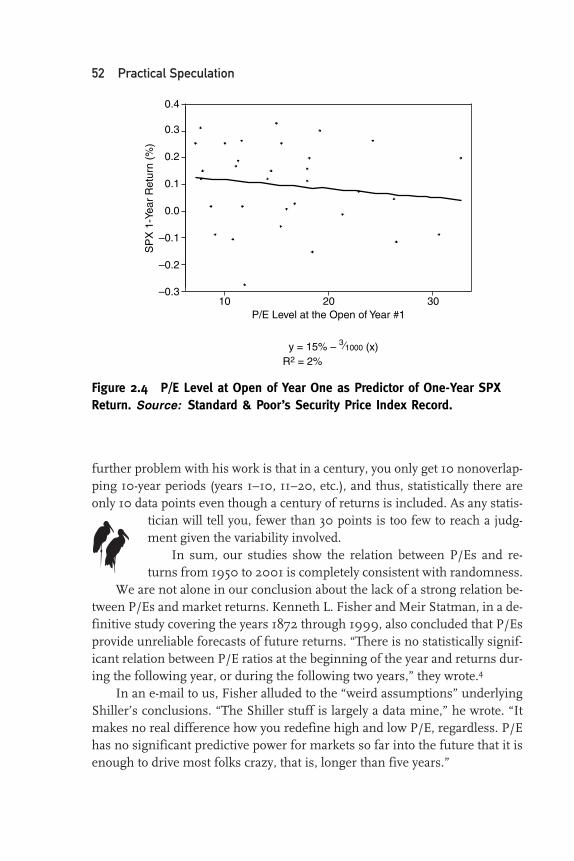
52 Practical Speculation
further problem with his work is that in a century, you only get 10 nonoverlap-
ping 10-year periods (years 1–10, 11–20, etc.), and thus, statistically there are
only 10 data points even though a century of returns is included. As any statis-
tician will tell you, fewer than 30 points is too few to reach a judg-
ment given the variability involved.
In sum, our studies show the relation between P/Es and re-
turns from 1950 to 2001 is completely consistent with randomness.
We are not alone in our conclusion about the lack of a strong relation be-
tween P/Es and market returns. Kenneth L. Fisher and Meir Statman, in a de-
finitive study covering the years 1872 through 1999, also concluded that P/Es
provide unreliable forecasts of future returns. “There is no statistically signif-
icant relation between P/E ratios at the beginning of the year and returns dur-
ing the following year, or during the following two years,” they wrote.4
In an e-mail to us, Fisher alluded to the “weird assumptions” underlying
Shiller’s conclusions. “The Shiller stuff is largely a data mine,” he wrote. “It
makes no real difference how you redefine high and low P/E, regardless. P/E
has no significant predictive power for markets so far into the future that it is
enough to drive most folks crazy, that is, longer than five years.”
Figure 2.4 P/E Level at Open of Year One as Predictor of One-Year SPXReturn. Source: Standard & Poor’s Security Price Index Record.
SP
X 1
-Yea
r R
etur
n (%
)
0.4
0.3
0.2
0.1
0.0
–0.3
–0.2
–0.1
3020P/E Level at the Open of Year #1
10
y = 15% – R2 = 2%
3⁄1000 (x)
nied_c02.qxd 1/24/03 10:36 AM Page 52
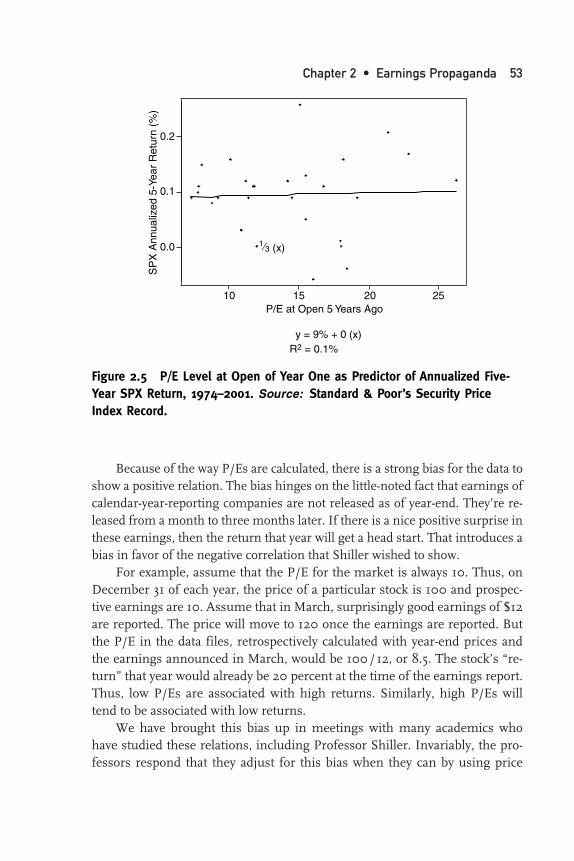
Chapter 2 • Earnings Propaganda 53
Because of the way P/Es are calculated, there is a strong bias for the data to
show a positive relation. The bias hinges on the little-noted fact that earnings of
calendar-year-reporting companies are not released as of year-end. They’re re-
leased from a month to three months later. If there is a nice positive surprise in
these earnings, then the return that year will get a head start. That introduces a
bias in favor of the negative correlation that Shiller wished to show.
For example, assume that the P/E for the market is always 10. Thus, on
December 31 of each year, the price of a particular stock is 100 and prospec-
tive earnings are 10. Assume that in March, surprisingly good earnings of $12
are reported. The price will move to 120 once the earnings are reported. But
the P/E in the data files, retrospectively calculated with year-end prices and
the earnings announced in March, would be 100/12, or 8.5. The stock’s “re-
turn” that year would already be 20 percent at the time of the earnings report.
Thus, low P/Es are associated with high returns. Similarly, high P/Es will
tend to be associated with low returns.
We have brought this bias up in meetings with many academics who
have studied these relations, including Professor Shiller. Invariably, the pro-
fessors respond that they adjust for this bias when they can by using price
Figure 2.5 P/E Level at Open of Year One as Predictor of Annualized Five-Year SPX Return, 1974–2001. Source: Standard & Poor’s Security PriceIndex Record.
SP
X A
nnua
lized
5-Y
ear
Ret
urn
(%)
0.2
0.1
0.0
20 2515P/E at Open 5 Years Ago
10
y = 9% + 0R2 = 0.1%
(x)
1⁄3 (x)
nied_c02.qxd 1/24/03 10:36 AM Page 53
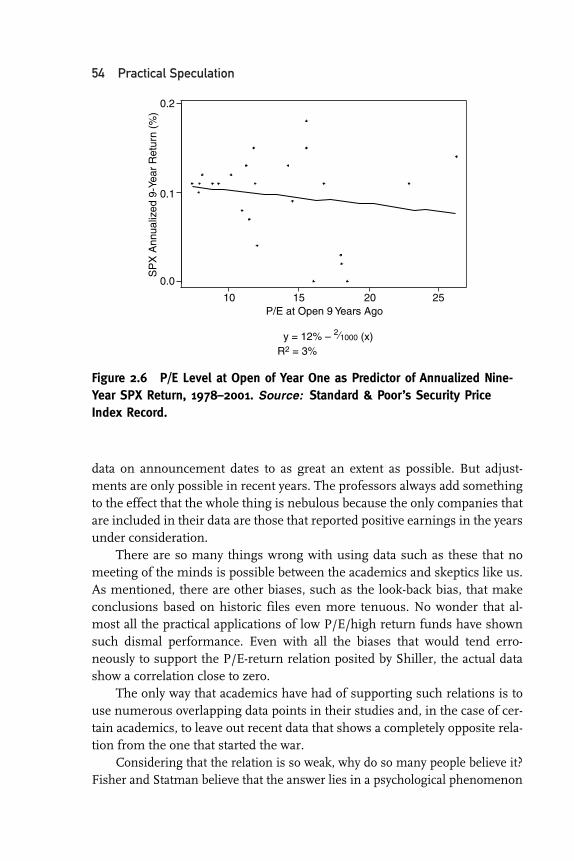
54 Practical Speculation
Figure 2.6 P/E Level at Open of Year One as Predictor of Annualized Nine-Year SPX Return, 1978–2001. Source: Standard & Poor’s Security PriceIndex Record.
SP
X A
nnua
lized
9-Y
ear
Ret
urn
(%)
0.2
0.1
0.0
20 2515P/E at Open 9 Years Ago
10
y = 12% – R2 = 3%
2⁄1000 (x)
data on announcement dates to as great an extent as possible. But adjust-
ments are only possible in recent years. The professors always add something
to the effect that the whole thing is nebulous because the only companies that
are included in their data are those that reported positive earnings in the years
under consideration.
There are so many things wrong with using data such as these that no
meeting of the minds is possible between the academics and skeptics like us.
As mentioned, there are other biases, such as the look-back bias, that make
conclusions based on historic files even more tenuous. No wonder that al-
most all the practical applications of low P/E/high return funds have shown
such dismal performance. Even with all the biases that would tend erro-
neously to support the P/E-return relation posited by Shiller, the actual data
show a correlation close to zero.
The only way that academics have had of supporting such relations is to
use numerous overlapping data points in their studies and, in the case of cer-
tain academics, to leave out recent data that shows a completely opposite rela-
tion from the one that started the war.
Considering that the relation is so weak, why do so many people believe it?
Fisher and Statman believe that the answer lies in a psychological phenomenon
nied_c02.qxd 1/24/03 10:36 AM Page 54

55
Spotting Corporate Earnings Propaganda
To an economist, earnings represent the recurring cash flows that can be
paid out to stockholders without reducing the value of the firm. But the
earnings reported to stockholders are accounting earnings,
subject to numerous conventions and assumptions that per-
mit wide latitude. Furthermore, accounting practices are al-
ways evolving. The best minds among accountants, consultants, and
managers unfortunately have strong incentives to use their knowledge
and talents to develop more dynamic, sophisticated, and opaque account-
ing techniques. As Darwin and Wallace pointed out with numerous ex-
amples, the end result of an adaptation is far removed from its original
expression. As a result, explanations of earnings quality contained in
books tend to be dated and incongruous.
For example, Haim Levy’s excellent text, Introduction to Investments,first published in 1980, advises the reader that high-quality earnings are
conservative, distributable, stable, ongoing, domestic, understandable,
operating, and normal. Low-quality earnings are said to be volatile, lib-
eral, unpredicted, nonrecurring, unrealistic, overstated, complex, off-
shore, and related to financial transactions. While all these examples are
sensible, they lack the compelling sharpness of a firing-line study of
current accounting practices such as the Wall Street Journal and the bet-
ter financial publications are always documenting. It is as though a cur-
rent book on manufacturing were to rely on a study of mid-19th century
division-of-labor practices.
Levy’s list of “red flags,” including long audit reports, reductions in
discretionary costs, and changes in accounting practices, seems more
appropriate for the new millennium. All the specific examples of over-
stated assets and understated liabilities, however, can be subsumed
under the rubric of excessive accruals relative to cash earnings, as de-
scribed in this chapter.
To keep the stock price ball in the air, companies must strive to con-
stantly meet analysts’ expectations. Accountants often seem to act as
promoters of the desired earnings picture rather than as watchdogs or
independent checkers. To guard against naïve digestion of earnings re-
ports, good analysts maintain checklists to sort out the good from the
bad. We compiled our own list of some currently popular accounting
techniques that obscure the picture of a company’s financial health.
(continued)
nied_c02.qxd 1/24/03 10:36 AM Page 55

56
1. Front-end income loading. Reporting income from a job imme-
diately although the work will take an extended period of time.
2. Borrowing. Using leverage to give the appearance of growth.
3. Capitalizing costs. Some companies capitalize costs as assets,
then amortize the deferred expenses over future periods.
America Online, for example, capitalized the expense of send-
ing out its software to potential future customers rather than
expensing the costs as incurred. Firms have substantial discre-
tion as to software development costs, start-up costs, and so
forth. Investors should look out for sudden increases in capi-
talized costs.
4. Timing costs. Manipulating discretionary costs such as advertis-
ing and R&D to smooth earnings.
5. Timing sales. Accelerating or decelerating sales activities to
smooth earnings.
6. Acquisitions Accounting I: Writing off R&D. When one company
buys another company, any excess paid above the acquired com-
pany’s assets is allocated between specifically designated intangi-
ble assets and goodwill. Some firms allocate a large portion of the
excess purchase price to an intangible asset called R&D in prog-
ress. After the purchase, they write it off and incur a one-time
loss. From then on, any benefits derived from such research are
not offset against any R&D costs. To get a better overall picture of
the company, a good analyst will ignore the write-off, keep R&D as
an asset on the balance sheet, and amortize it.
7. Acquisitions Accounting II: Fuzz. Combining big acquisitions
with cloudy disclosures that make it difficult to compare earn-
ings with previous periods.
8. Acquisitions Accounting III: Goodwill. Amortizing goodwill
over a long period of time will not affect earnings as much as
amortizing it over a short period. Thus companies that can write
off goodwill over a longer period have an advantage.
9. Restructuring charges. The costs involved in a restructuring are
usually expensed immediately. In a “big bath” strategy, companies
can “accidentally” overestimate the size of the restructuring re-
serve, then gradually reverse this error over time, generating a
nice stream of noncash income for the future.
nied_c02.qxd 1/24/03 10:36 AM Page 56

57
10. Consolidating results. The widely used “equity” method lets a
company report its entire share of a subsidiary’s income as part
of its own income, without having to report the subsidiary’s as-
sets or liabilities on the parent’s balance sheet.
11. Asset impairment charges. The Financial Accounting Standards
Board’s Rule 121 requires firms to write down the value of assets
on their balance sheets whenever the present value of the pro-
jected cash flows to be generated by those assets is less than their
book value. This gives management a lot of leeway, because it is
management that estimates future cash flows. Managers may
write down assets during years when earnings are poor anyway,
hoping investors will ignore this as a one-off event. With future
depreciation expenses thus reduced, future earnings will look
much better.
12. Accounting for stock options. Companies have much leeway in
deciding whether and how to report executive and employee
stock options as an expense. FASB gives a choice of three meth-
ods to companies that voluntarily choose to expense options.
13. Inventories and receivables. Manipulating reported earnings by
playing around with current assets such as accounts receivables
and inventory, with apt estimates of the salability of the former
and the collectability of the latter.
14. The storehouse. Relying on reserves, one-time gains in mar-
ketable securities, or sales of assets to smooth earnings.
15. Timing an accounting method switch. Adopting new accounting
standards early or late to maintain the earnings trend.
16. Changing auditors. This can mean that the management wants
to use accounting trickery to maintain the earnings trend. The
market generally punishes companies that change auditors, as it
can give the appearance of impropriety. In the wake of the
Enron/Andersen scandal, many firms had the chance to switch
from Andersen and be rewarded for it by the market.
S&P’s New Standard
The Standard & Poor’s securities rating firm has introduced a method of
calculating earnings that is designed to reduce earnings distortions. The
new measure, called “core earnings,” adjusts net income to include:
(continued)
nied_c02.qxd 1/24/03 10:36 AM Page 57

58 Practical Speculation
known as the “illusion of validity.” People are prone to believe and rely on the
accuracy of their judgments much more than the facts warrant. Fisher also
speculates that people believe in the P/E fantasy because our ancestors found
great survival value in being afraid of heights, and they passed along their
genes to us. “Anything in a heights framework generates fear,” Fisher wrote.
Even high P/Es.
Our friend Dr. Brett Steenbarger, professor of psychiatry and behavioral
sciences at the SUNY Upstate Medical University in Syracuse, New York,
whose primary research interest is multivariate behavioral modeling of the
stock market, suggested in a May 2002 e-mail to us that a second type of illu-
sion might be at work:
• Expenses from stock-option grants.
• Restructuring changes from ongoing operations.
• Write-downs of depreciable or amortizable operating assets.
• Pension costs.
• R&D expense assumed through acquisitions.
The measure excludes:
• Gains or losses from asset sales.
• Pension gains.
• Unrealized gains or losses from hedging securities.
In some cases, the change would be quite material. GE, for example,
reported net income of $1.42 a share in 2001. If the company had ex-
cluded gains from pension investments, however, earnings would have
been $1.11, according to S&P. Cisco Systems reported net income of 14
cents a share in fiscal 2001, but if the company had included stock-option
expenses, that would have been a 35 cent-a-share loss, S&P said.
Between the list of modern techniques of manipulation highlighted
here and S&P’s core earnings concept, the reader should have a good
heads-up on the usual suspects in the early naughties. These might be
supplemented with a foundation provided by the excellent books Qual-ity of Earnings by Thornton L. O’glove,5 Financial Shenanigans by
Howard Schilit,6 or The Dark Side of Valuation by Aswath Damodaran.7
nied_c02.qxd 1/24/03 10:36 AM Page 58
Chapter 2 • Earnings Propaganda 59
A group of researchers at the London Business School recently completed a study
in which they showed that traders who display a high degree of “illusion of con-
trol” also achieve subpar results in their trading.
The way “illusion of control” was measured was by giving the traders a com-
puter game that involved guessing numbers in a sequence and then assessing
their confidence re: future success. The traders didn’t know that the numbers rep-
resented a random walk. So the confident traders were a bit like chart readers who
express confidence in reading patterns derived from coin flips.
I would argue that traders and investors focus on earnings num-
bers for the same reason that dying people focus on the afterlife. It’s
also the reason why the No. 1 search engine topic immediately after 9/11
was “Nostradamus.” In the face of uncertainty, people have a need for
understanding and control. They will latch onto any explanation rather
than go without one. An illusion of control is better than no perceived
control.
This is why panic attack sufferers will construct elaborate hypotheses about
their illness. If their attack happens in a mall, they avoid malls; if the attack occurs
while thinking about a particular topic, they try to banish that topic from con-
sciousness. The example I use in my book is the patient who had her first attack
on the ramp of an interstate highway and who, thereupon, refused to drive on
ramps, including those of indoor garages and the like.
Such avoidance caused practical problems for the patient (who stopped driv-
ing altogether), but also reinforced the illusion that she could control her anxiety.
Seen from this perspective, when the media goes into a frenzy about the re-
lation between earnings and future stock prices, this can be seen as a response to
threat and uncertainty. It provides information about the psychological state of
market participants. And that might even be tradable information, though not in
the way that the media pundits intend.
Note how the financial news viewer ratings skyrocket in bull markets and
during market plunges. Those are the times viewers most feel a need to figure out
what to do with their money. They are either missing opportunities or losing
money. Latching onto technical and fundamental analysis is their way of search-
ing for answers and gaining control.
Ironically, one could probably use those viewer ratings as a
fairly accurate market timing tool!
Student Questioner
When we held our luncheon interview with Dr. Shiller, we expected the sparks
to fly. Strangely, Shiller was tentative about the robustness and resilience of
nied_c02.qxd 1/24/03 10:36 AM Page 59

60 Practical Speculation
his results. He pointed out that one of his students, Bjorn Tuypens, had pre-
pared a paper that questioned the accuracy of his conclusions. “Perhaps the
relation has changed or is no longer valid,” he told us.
Tuypens’ paper, “Stock Market Predictability: A Myth Unveiled,” pro-
vided further support for our conclusions:
The use of overlapping data for long-term stock returns, combined with the
nonstationary behavior of the dividend yield, gives rise to spurious regression
problems when regressing long-term stock returns on dividend
yields. . . . This regression (dividend yield versus subsequent one-year
and two-year returns) provides additional evidence for the argument
that the strong long-run forecasting power of the Campbell-Shiller re-
gressions is a myth, due to the use of overlapping data in too small a data set.8
On the other hand, Shiller told us that he remains confident that the mar-
ket is in for a period of abnormally low returns. He also expressed confidence
that “econometric studies will verify the significance of the negative P/E rela-
tionships” that he and his colleagues have found. He appeals here to an ito pro-
cess, a highly complicated, almost impossible-to-test relation involving what is
called stochastic calculus. Since the essence of such results is that current P/Es
influence returns in distant years much more than they influence current
years, the relation seems to us to be completely implausible. Furthermore,
such topsy-turvy relations relative to time are completely opposite to any that
we have found in real-life applications involving the calculation and testing of
tens of thousands of such relations.
It seems more likely, for example, that the P/E of the market as of year-
end 2002 will have a much stronger influence on 2003 returns than the P/E
that prevailed in 1993. Only a professor could argue against this.
Shiller emphasized to us that his current interests are in other fields.
How Earnings Propaganda Works
The adherence of investors and academics to causal relations that
are completely opposite from the empirical facts raises some deep
why and how questions.
Our explanation draws on lessons learned from the study of propaganda.
The propagandists of the market, who specialize in fear and greed to the same
degree as advertising pros and political propagandists do, make efficient use
of these spurious relations. When we first reported in 2002 in our column for
CNBC Money that the relation between P/Es and returns was almost entirely
nied_c02.qxd 1/24/03 10:36 AM Page 60

Chapter 2 • Earnings Propaganda 61
random—contrary to the standard paradigm that guarantees that the public
will always be leaning the wrong way—our ideas generated considerable skep-
ticism. Incredulous readers of our columns checked our credentials and
wrote in to say that Laurel, who earned a bachelor’s degree in fine arts, should
go back to playing the piano and that Vic should stick to racquet sports, as his
economics analysis was as bad as his hedge fund management. We were told
that we had completely misconstrued what the academics say about earnings:
that it is expectation that matters, not realization. The kindest thing said about
our theory was that we had simply rediscovered and put in convoluted, ab-
stract prose the simple maxim that you should buy when there is blood in the
streets and sell when the trumpets are sounding.
Still other readers objected that stock prices are determined by expectations
of earnings rather than the actual earnings themselves. As earnings come in,
they might provide little information about future expectations and thus would
not be expected to have an impact.
We do not buy that for a minute. Revisions in expectations must be
highly correlated with the actual reported comparisons of the earnings
themselves. Furthermore, numerous academic studies of the impact of
earnings revisions on the S&P 500 have been made, and none of these
have found any relationship between revisions in earnings and future re-
turns. (One curious result that has been found is that the variability of the
revisions in earnings expectations has a weak positive relation to returns
several years later.)
The article also brought a deluge of invective from the bearish camp. The
following was typical:
I think you guys are liers [sic] or just bad reporters. If you are a lier, you are a bad
reporter. So you must be both a bad reporter and a bad lier. Get a conscience.
You sound like you are long on your investments. . . . One can only conclude
your extreme irrational almost military-like bias can only mean that you are
long, you lost lots of money, and are holding on till death do you and your
money part.
The irony is that on April 1, the day we received this letter, we had a mas-
sive short position in the market, which we memorialized in a CNBC Money
dispatch that day.
The kind of name-calling employed in that message is a typical propa-
ganda technique. Propaganda induces individuals to take actions that benefit
the messenger more than the listener. The Fine Art of Propaganda,a 1939 classic on the topic published by the Institute of Propa-
ganda Analysis, outlined seven basic techniques to disseminate
nied_c02.qxd 1/24/03 10:36 AM Page 61

62 Practical Speculation
false information.9 To simplify the ideas enough for young students in public
schools, the book gave each technique a catchy name: “name-calling,” “glitter-
ing generality,” “transfer,” “testimonial,” “plain folks,” “card stacking,” and
“bandwagon.”
Here is our take on how each technique is used to disseminate the falla-
cies involving the relation of earnings and P/E to returns:
Name-calling: “Only a blindfolded bull would buy stocks at these levels.”
Glittering generality: “There’s no value in the market with these strato-
spheric P/Es.”
Transfer (invokes a name or symbol): “Until P/Es fall to Graham & Dodd
levels, we’re forecasting a Dow of 100.”
Testimonial: “The oldest and canniest investor I know is waiting for P/Es
to fall by another 50 percent before he considers buying.”
Plain folks: “I don’t know much, but the last time P/Es were this high and
dividend yields were this low was year-end 1928.”
Card stacking: “P/Es were above 20 at the beginning of 1929 and stocks
fell 40 percent in the next two years.” (Forget that P/Es were the exact
same level at the beginning of 1950, when prices rose 40 percent
over the next two years.)
Bandwagon: “None of the hedge fund managers at the conference in Bar
Harbor will touch these high P/Es with a 10-foot pole.”
How frequently is misinformation on the relation of earnings to market
returns transmitted? Millions of articles contain variants of the misleading be-
lief that the better the market earnings, the better the market return. Our own
search, using the Internet search engine www.google.com, found 2.7 million
articles containing the words “U.S. stocks,” with about 1.3 million also con-
taining the word “earnings” or “profit.” Of those, 323,000 contained “opti-
mism” or synonyms thereof. Some 75,000 articles contained a combination
of the words “earnings” or “profit” and “pessimism” or a synonym. No doubt,
some of these word conjunctions had nothing to do with our topic. But we can
make a rough estimate that the lie appears in half of all stories that mention
earnings and the market.
Why Do the Beliefs Persist?
Regardless of the propaganda techniques, rational people usually have a
mechanism to overturn false beliefs that hinges on the prospering of those
who can differentiate truth from falsehood. In this particular field, however, it
is hard to make such a distinction because the things that people observe
nied_c02.qxd 1/24/03 10:36 AM Page 62
Chapter 2 • Earnings Propaganda 63
most clearly are P/Es and returns of individual stocks. They know that when
earnings are bad for companies they own stock in, that they suffer losses, and
conversely, when earnings are good, they enjoy gains. This is true. The prob-
lem comes when they try to generalize this to the broad market.
Such generalizations suffer from logical errors: the fallacy of
composition, the fallacy of aggregation, and the ecological fallacy.
The following trains of thought show the fallacy of composition:
• “Since I can see the concert better by standing on my seat, it follows
that if everybody stood on their seats, we would all have a better view.”
• “Phil and Mary are excellent singers. They will form an excellent duo.”
• “The person who gets a gold medal is happy. If everyone got gold medals
they would all be happy.”
This error crops up in investors’ thinking as a confusion between what
people know about individual stocks and what they know about the market:
“If good earnings are good for my stock, and bad earnings are bad, then when
earnings for companies that make up the broad market are generally good,
that’s bullish and when earnings are generally woeful, that’s bearish.”
The fallacy of aggregation is the assumption that what holds true on a
small scale is also true on a large scale. The fallacy is usually illustrated by
pointing out the error of the statement that a six-foot man cannot drown in a
pond with an average depth of one foot. For our purposes, a better example is
that of the isolated miner who picks away at a mountain trying to find gold. It
is true that the more he picks away, the less the size of that mountain. How-
ever, without taking into account soil erosion, weather patterns, landslides,
and sloughing, as well as the feedback that occurs between the mountain and
efforts of hundreds of similar miners, we cannot make any assumptions
about the relation of one miner’s activity to the size of the mountain.
Similarly, everyone knows that individual stock prices are related in some
direct way to the favorability of earnings. But to generalize from that to the
system of the stock market and total profits in the economy requires hun-
dreds of leaps that ignore effects just as great as landslides down a mountain;
for example, the landslides of interest-rate rises and declines, tax policy
changes, and Federal Reserve actions.
A related error is the ecological fallacy—the assumption that what is
true on the large scale is true on the small scale. This mistake is common
to most studies of diet in a given population. A typical study will conclude,
for example, that the amount of fiber intake is positively related to longevity.
The finding, however, cannot be particularized to the recommendation
that an individual in a particular country should eat more fiber to live a
longer life.
nied_c02.qxd 1/24/03 10:36 AM Page 63

64 Practical Speculation
Our finding that earnings changes and stock prices are inversely related
brings disbelief because of the ecological fallacy. Those who hear it particular-
ize the finding. They say that, if true, this inverse relationship would mean that
individual stock returns are also inversely related to earnings changes, just as
the health studies fail to note differences between the activities and eating
habits of individuals within the individual countries. Victims of the ecological
fallacy fail to take into account industry differences and time differences
within the stock market. Thus, because they cannot accept that our inverse re-
lation could possibly be true, they reject it out of hand as antithetical to what
they know is true.
Another reason for the longevity of these mistaken notions undoubtedly
is that earnings are defined so vaguely as to defy scrutiny of any supposed re-
lation to market returns. Should the investor look at year-over-year compar-
isons or reported earnings relative to expectations? Current expectations, or
initial expectations? Official expectations or whisper numbers? Earnings rela-
tive to the stage in the business cycle, or relative to industry peers? And which
earnings are key? Operating? Pro forma? GAAP? Cyclically adjusted? Net?
The vagueness about precisely which earnings are being discussed barely
hints at the problem. Our friend Larry Leeds provided some insight into the
Time to Get Out (Artist: Susan Slyman, 2001).
nied_c02.qxd 1/24/03 10:36 AM Page 64

Chapter 2 • Earnings Propaganda 65
complexities involved. Larry has been running a hedge fund specializing in
stocks of retailers and has managed to garner a seven-year annual return of 42
percent as of year-end 2002. He likes to buy stocks of companies that report
poor first-quarter numbers. Often, their Christmas season was so good that
they have nothing in stock to sell, and so they miss their comparisons. Retailers
that report good first quarters still had plenty of good winter merchandise to
sell because their Christmas was terrible.
Furthermore, companies have developed multiple ways to paint the rosiest
possible picture of their finances. Chief executives who guide research analysts’
earnings estimates down so that their firms can beat them later are practicing a
nice form of card stacking. Such “positive surprises” have the virtue
of triggering the systems and recommendations of quants who have
found, based on stale studies, that such earnings surprises have pre-
dictive significance.
The Escalation of Hide-and-Seek
Corporate earnings propaganda has long been part of Wall Street routine, and
reporters love to catch companies at the game. As a wire service editor, Laurel
observed firsthand the corporate art of timing an earnings announcement. If
GAAP earnings are up, the company releases its statement just before or after
the close, and schedules a telephone conference an hour later so executives
can issue “guidance” on the next quarter to reporters and analysts. But if even
pro forma earnings are poor, then the time to announce is late at night, after
most news organizations have closed up shop or have only one reporter on
duty. The best time of all for discreet announcements of bad news is late on a
Friday, after newspaper editors have put the weekend business sections to bed
and left the office.
Any junior reporter is expected to find the obvious red herrings in earn-
ings reports. In the first week on the job, the reporter learns that a glowing ac-
count of record sales in the first paragraph is often followed by understated
references to a decline in profits or margins. No self-respecting beginner
would ever miss the announcement buried in the seventeenth paragraph that
the auditors quit rather than sign off on the latest financials, or that Chief Ex-
ecutive Smith, 49, is retiring immediately to pursue other interests and spend
more time with the family.
But an arms race of sorts developed. The more sophisti-
cated financial reporters became, the better the weapons the
companies used to fool them. Companies developed an
nied_c02.qxd 1/24/03 10:36 AM Page 65

66 Practical Speculation
amazing capacity to report earnings that top those of the corresponding
quarter of the previous year. General Electric, for example, reported 38 con-
secutive increases in quarterly earnings beginning in the third quarter of
1993. From the first quarter of 1995 through the third quarter of 2000, all of
the increases were between 11 percent and 16 percent, except for gains of 18
percent, 21 percent, and 20 percent, respectively, in the first three quarters
of 2000. One theory is that General Electric puts its profits in silos and takes
them out as needed. But General Electric’s practice of “managing earnings”
was just the beginning. As the twentieth century drew to a close, a rage de-
veloped among corporate finance officers for pro forma statements, off-bal-
ance sheet debt, and off-income statement losses.
Enron was the acknowledged leader in the new way of accounting. “Gen-
eral Electric’s next chairman may want to borrow a lesson or two from Enron,
which has been voted America’s most innovative company five years running
and displaced General Electric as the ‘best managed company’ in Fortunemagazine’s last ‘most admired’ survey,” wrote management consultant Gary
Hamel admiringly in the September 18, 2000, Wall Street Journal. Investors
who probed too deeply risked being publicly called an “ass ,” as then-
Enron Chairman Jeff Skilling called Richard Grubman, a Boston hedge fund
manager who dared ask for a balance sheet at an April 17, 2001, earnings
news conference. (We received similar treatment when we requested a no-
holds-barred interview with a General Electric executive in 2002. Not only
were we informed that all their executives were too busy to meet with us; we
were told never to call General Electric again.)
Within the weeks after Enron’s dramatic plunge from stock market
star to bankruptcy in November 2001, however, all earnings reports came
under suspicion, even those of General Electric and other companies that for
years had been above reproach. Newly skeptical investors beat one company
after another to within an inch of its life. General Electric, the world’s most
highly valued company, fell 39 percent in the first nine months of 2002. Criti-
cism of General Electric’s accounting was so widespread that the company de-
veloped a new mantra: “We manage companies, not earnings.” IBM dropped
6 percent on February 15, 2002, when the New York Times reported that the
computer maker didn’t disclose that fourth-quarter earnings had been in-
creased by the sale of a subsidiary product line.10 Tyco International Ltd., Com-
puter Associates, and Sprint Corporation were caught up in the chill.
The truth is that many companies try to prettify their earnings one way or
another. In the sidebar (pp. 55–58), we enumerate some considerations to
take into account when evaluating reported earnings.
nied_c02.qxd 1/24/03 10:36 AM Page 66
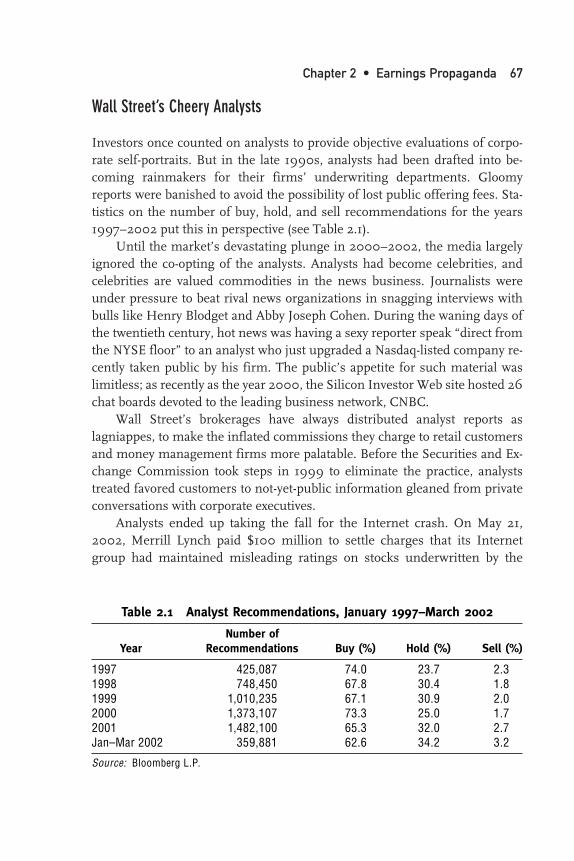
Chapter 2 • Earnings Propaganda 67
Wall Street’s Cheery Analysts
Investors once counted on analysts to provide objective evaluations of corpo-
rate self-portraits. But in the late 1990s, analysts had been drafted into be-
coming rainmakers for their firms’ underwriting departments. Gloomy
reports were banished to avoid the possibility of lost public offering fees. Sta-
tistics on the number of buy, hold, and sell recommendations for the years
1997–2002 put this in perspective (see Table 2.1).
Until the market’s devastating plunge in 2000–2002, the media largely
ignored the co-opting of the analysts. Analysts had become celebrities, and
celebrities are valued commodities in the news business. Journalists were
under pressure to beat rival news organizations in snagging interviews with
bulls like Henry Blodget and Abby Joseph Cohen. During the waning days of
the twentieth century, hot news was having a sexy reporter speak “direct from
the NYSE floor” to an analyst who just upgraded a Nasdaq-listed company re-
cently taken public by his firm. The public’s appetite for such material was
limitless; as recently as the year 2000, the Silicon Investor Web site hosted 26
chat boards devoted to the leading business network, CNBC.
Wall Street’s brokerages have always distributed analyst reports as
lagniappes, to make the inflated commissions they charge to retail customers
and money management firms more palatable. Before the Securities and Ex-
change Commission took steps in 1999 to eliminate the practice, analysts
treated favored customers to not-yet-public information gleaned from private
conversations with corporate executives.
Analysts ended up taking the fall for the Internet crash. On May 21,
2002, Merrill Lynch paid $100 million to settle charges that its Internet
group had maintained misleading ratings on stocks underwritten by the
Table 2.1 Analyst Recommendations, January 1997–March 2002
Number ofYear Recommendations Buy (%) Hold (%) Sell (%)
1997 425,087 74.0 23.7 2.31998 748,450 67.8 30.4 1.81999 1,010,235 67.1 30.9 2.02000 1,373,107 73.3 25.0 1.72001 1,482,100 65.3 32.0 2.7Jan–Mar 2002 359,881 62.6 34.2 3.2
Source: Bloomberg L.P.
nied_c02.qxd 1/24/03 10:36 AM Page 67

68 Practical Speculation
firm. The settlement came after New York Attorney General Eliot Spitzer re-
leased excerpts of e-mails showing that analysts privately disparaged com-
panies they publicly recommended.
At the time in question, Merrill’s rating system had five categories:
1. Buy
2. Accumulate
3. Neutral
4. Reduce
5. Sell
Ratings could be shaded, with 1–1 being higher than 1–3 and so forth.
Spitzer put together e-mail comments with published ratings in Table 2.2.
In sworn testimony, Merrill’s senior Internet analyst, Henry Blodget,
and his subordinate, Kirsten Campbell, both confirmed that the group never
rated a stock 4 or 5, according to an affidavit filed by Spitzer. “In lieu of as-
signing reduce or sell recommendations to stocks they no longer favored,
the Internet group instead merely quietly stopped covering the stock, with-
out any announcement or meaningful explanation to the retail public.”
Table 2.2 E-Mail Comments
PublishedCompany Date Analyst Comments Rating
Aether System (AETH) 3/15/01 “ fundamentals horrible” 3-1Excite@home (ATHM) 12/27/99 “we are neutral on the stock” 2-1
12/29/99 Six-month outlook is “ flat ” without any “real catalysts” for improve-ment seen.
Excite@home (ATHM) 6/3/00 “such a piece of crap” 2-1
GoTo.com 1/11/01 Nothing interesting about company 3-1“except banking fees”
InfoSpace (INSP) 7/13/00 “This stock is a powder keg, given 1-1how aggressive we were on it earlier this year and given the ‘bad smell’ comments that so many institutions are bringing up”
InfoSpace (INSP) 10/20/00 “piece of junk” 1-1Lifeminders (LFMN) 12/04/00 “POS” (piece of shit ) 2-124/7 Media (TFSM) 10/10/00 “piece of shit ” 2-2
Source: Affidavit filed April 8, 2002, by Eliot Spitzer, Attorney General of the State of New York,in New York State Supreme Court.
nied_c02.qxd 1/24/03 10:36 AM Page 68

Chapter 2 • Earnings Propaganda 69
While sophisticated investors knew that Merrill’s “3” rating meant “sell,”
Spitzer said, the general public did not.
In one notable case, Merrill’s Internet analysts initiated coverage on In-
ternet Capital Group, a client of the firm, with a 2–1 rating on August 30,
1999. The stock reached $212 on December 22, 1999, then began a long de-
scent. On October 5, 2000, with the stock at $12.38, Blodget predicted in an
e-mail to another senior analyst that the ICGE “was going to $5.” The next
day, he wrote: “There really is no floor to the stock.” Even so, the rating re-
mained 2–1. Despite Blodget’s pessimism, ICGE was on Merrill’s top 10 tech-
nology stocks list as late as September 12, 2002, Spitzer’s affidavit said.
Laurel had questioned Blodget’s ratings in an August 6, 1999, column
for Bloomberg that turned out to be her last for the company. The decision to
end the column was doubtless based solely on the news judgment of her
bosses and had nothing to do with Merrill’s 20 percent passive ownership in
Bloomberg.
Final Note
The objection may be raised that we have failed to consider the question
of earnings disappointments, or changes in analysts’ earnings projections,
or to compare the top-down predictions of the strategists with the bottom-up
estimates of the spoon-fed analysts. Some might complain that we have
no black box to which we feed data from the last business cycle. Some so-
phisticated readers may even darkly hint that we have failed to consider the
tens of thousands of academic articles that have tried to wrestle with these
questions.
Truth to tell, even the Spec Duo would find it taxing to review the bulk of
all this admirable knowledge. We reckon that it would take us two lifetimes to
read the academic literature alone. We did read hundreds of ar-
ticles. But the problem with many studies is that they used old
data, and arrived at formulas that were descrip-
tive instead of predictive. For a theory to be testable, it must
offer predictions. And it has not yet occurred to any financial
academic to investigate the effect of ever-changing cycles.
Exhausted by our battles, fearing that we will still be receiving variations
on the queries we have addressed here if we live to be 100, and eager to be
about our business, we can only retreat for a few happy hours to reread one of
our favorite Greek myths, the labors of Hercules, in preparation for our chap-
ter on the legendary value investor Benjamin Graham.
nied_c02.qxd 1/24/03 10:36 AM Page 69

70 Practical Speculation
When Vic played racquet sports, he would first break down the oppo-
nent’s backhand. Then he would break down the opponent’s forehand. Next,
he would hit some short shots that the opponent was not fast enough to reach.
Finally, when the only way that the opponent could possibly compete was by
leaning forward at all times, he would hit them deep. He prospered by getting
his opponent to lean the wrong way at all times during his matches.
If investors were to figure out that the market, by deluging them with
spurious correlations about earnings and stock returns, is playing that kind of
game against them, the broad flow of revenue to the market would
be reduced by 95 percent. The people who always buy at the high
and sell at the low, who jump in and out of mutual funds at pre-
cisely the wrong time, would sit out the game. Of course, they
might hold too long or sell too quickly, and there might be some transfer of
wealth—but they would not overtrade, and they would be far better off. As it
is, they call up their brokers and sell on earnings pessimism.
But guess what? Tomorrow there will be earnings opti-
mism, and they will have to do just the opposite.
nied_c02.qxd 1/24/03 10:36 AM Page 70

71
3 T H E H Y D R A H E A D S O FT E C H N I C A L A N A L Y S I S
The Hydra haunted the unfathomable Lernaean swamp,
the grave of many an incautious traveler.
—Robert Graves, Greek Myths1
In Greek mythology, the second task that the King of Mycenae demanded
of Hercules was to kill the Hydra, a nine-headed monster whose poison-
ous breath killed everything nearby. Hercules went after the beast with his
club, but as soon as he knocked off one head, two grew to replace it.
Hercules had it easy. When we accidentally call up the menu of techni-
cal indicators on our Bloomberg monitor, we find not just nine, but dozens
of colorful charts that we have concluded are poisonous to the investor: ad-
justable moving-average charts, regression lines, money flows, parabolic
stops, Bollinger bands, various oscillators, pivots, relative strength, trading
envelopes, stochastics (both bar and candle), point-and-figure charts, expo-
nentially smoothed lines, advance-decline lines, TICK, TRIN, Fibonacci
nied_c03.qxd 1/24/03 2:10 PM Page 71

72 Practical Speculation
retracement levels, and a software function that lets you draw straight lines
between whichever peaks or troughs strike your fancy. This cornucopia of in-
dicators does not begin to include all that are available. The Market Techni-
cians Association—the “official spokes-organization for technical analysts in
the United States,” according to the group’s president, Ralph Acampora—
lists 177 on its Web site.
In 45 years of trading, Vic and his staff members have tested every indi-
cator to which value is ascribed. So far, not one has passed the test. How-
ever, any important question deserves to be settled by putting “statistics on
the table.” Haphazard anecdotes, confident assertions, and
appeals to authority—even, or especially, our own author-
ity—will not do. We are always open to quantification and
testing of any rule.
The problem with technical analysis is that practitioners and advocates
fail to follow standard scientific procedure in presenting and evaluating its
techniques. Scientific procedure in this case would include an exact defini-
tion of an event, a test of the accuracy and uncertainty of the predictions
based on the event, a method for entering and exiting trades based on the
event, and a method for communicating and repeating the experiment so
that it can be verified and improved on. Practitioners of technical analysis
often object that it is an art, not a science, and cannot possibly be refuted.
We agree. The propositions of technical analysis are simply not
testable, as visual interpretations are not susceptible of precise defi-
nition. Technical analysis is so rife with subjective interpretations
that it must be regarded as more of a religion than a method, com-
plete with priests who bewilder the unwashed at high-priced seminars. Be-
cause subjective interpretation does not permit the formulation of precise
hypothesis or testable predictions, knowledge cannot advance.
Take Martin “Buzzy” Schwartz’s explanation of the secret of markets:
“When you look at the letter T, there’s an equal distance on the left side and
the right side of the T, hence the Magic T formula.” The investor is advised to
“totally embrace” the Magic T by “drawing trend lines and charts, recalculat-
ing averages, figuring inflection points, setting entry and exit prices.”
Schwartz offers this account of his success with the method: “The Magic T
and I became as one. Data ebbed and flowed in the most primal way, and I
rose and fell with it instinctively, viscerally, like a mollusk in the sands of high
finance.”2 Would that we were all happy as clams. While Schwartz truly seems
desirous of helping investors, we wish for more cerebral ways to separate the
market’s ebbs and the flows.
nied_c03.qxd 1/24/03 2:10 PM Page 72

Chapter 3 • The Hydra Heads of Technical Analysis 73
Or, consider this majestically broad statement of Joseph Granville: “The
market follows all the laws of physics, easily explained in terms of momentum,
gravity, attraction, acceleration, harmonics, time, space, energy, magnetism,
and even color as we deal with the entire spectrum of technical analysis weav-
ing a tapestry of infinite beauty.”3 Sounds beautiful. But somehow, we doubt
that Granville’s “on-balance volume contributor,” which the guru claims to
have taken “to a new level of excellence,” or even the “climax indicator” or the
“net field trend theory indicator” could justify his belief that any of them would
continue to be as accurate as they were when he took “investors and traders
completely out of the market” before the 1987 crash.
Turning to the 775-page collection of interviews with all the great knights
and damsels in the technical analysis brotherhood, compiled by Jack Schwa-
ger, who can help being heartened by Schwager’s promise that charts reflect
market behavior that is subject to certain repetitive patterns and that, with suf-
ficient experience, some traders will uncover an innate ability to use charts
successfully as a method of anticipating price moves?
As Schwager sums it up in his Trading Rule No. 4: “Find a chart pattern
that says the timing is right—now. Don’t initiate a trade without such a con-
firming pattern.”4 (Occasionally, he says, you might consider a trade without
such a pattern if there is a convergence of any measured moves, and sup-
port/resistance points at a given price area and there is a well-defined stop
point that does not imply much risk.)
It is enough to keep anybody awake at night wondering how to find such
patterns, and how to measure the moves, and where those well-defined stop
points might converge.
But whenever we do formulate a technical pattern in a quantifiable way,
test it, and discuss our findings, we find ourselves at the center of a great up-
roar, as followers of these and other indicators accuse us of failing to evaluate
the virtues of their chosen chart properly. So convinced are these critics of
their indicator’s value that settling the question by putting any of their propo-
sitions to the test seems futile. The hydra is always ready with another head—
a new technique, a new practitioner, a new market, a new source of past
data—to replace discredited technical indicators.
In the end, Hercules realized that the Hydra’s heads would stop
growing only if he sealed off the source with fire. That is what we’re going
to do here. We are going to take the key theme common
to the hundreds of technical analysis techniques and test it
with fire. The theme in question is, “The trend is your
friend.”
nied_c03.qxd 1/24/03 2:10 PM Page 73
74 Practical Speculation
Is the Trend Really Your Friend?
For a representative sampling of the many variations of “The trend is your
friend,” we turned to The Global-Investor Book of Investing Rules: Invaluable Ad-vice from 150 Master Investors, edited by Philip Jenks and Stephen Eckett.5 We
found that more than two dozen of the traders proffered “The trend is your
friend” in various permutations. A few examples:
• The trend is your friend in the last hour. (Alan Farley)
• Never short-sell stocks when they are going up. (Simon Cawkwell)
• Draw trend lines. (John Murphy)
• Frequently, what is low will go even lower, and what is high will con-
tinue to rise. (Marc Faber)
And our favorite:
• The trend is your friend unless it is about to end. (Thomas DeMark)
None of the writers of these trend rules backed them up with even a sim-
ple test. In fact, no test of “The trend is your friend” is possible, because the
rule is never put forward in the form of a testable hypothesis. Something is al-
ways slippery, subjective, or even mystical about the rule’s interpretation and
execution.
Prescientific societies, needing a feeling of control over storms, natural
disasters, predators, food sources, and other unpredictable vagaries of life,
relied on myths and rituals for explanation and guidance. They sacrificed
the best part of their food to the gods, made costly pilgrimages to holy
places, and showered gifts on priests, all to propitiate the gods who ruled
their fortunes. By and large, these practices have died out as the efficacy of
the scientific method became obvious. Yet, myth survives in the modern
age, partly as a reaction against the rapid change that science has brought
about. Even in the market alongside the most sophisticated mathematical
strategies and cold-eyed calculations of veteran traders, myths can be found
thriving.
But perhaps this is not so surprising. Modern investors, after all, find
themselves at the mercies of mysterious forces just as the cave dwellers did.
The market is changeable, complex, and seemingly fathomless. Sharp rises
can create great wealth and power. Sharp declines can lead to disaster and
death. The market is sometimes as giving as a mother, sometimes as hostile
as an angry ocean. It is no wonder that traders, faced always with the ques-
tion “What should I do now?” long for a simple indicator to navigate the mar-
ket’s mysteries.
nied_c03.qxd 1/24/03 2:10 PM Page 74

Chapter 3 • The Hydra Heads of Technical Analysis 75
Reviewing many of the 378,000 references to “trend following” on our fa-
vorite search engine, Google, we found an abundance of sites featuring testi-
monials from satisfied students of such systems, as well as stories about trend
followers who have achieved incredible riches. No wonder that a record 830
aspiring chart-readers, the most ever, took the Market Technician Associa-
tion’s annual competency exams on April 26, 2002, in Jupiter Beach, Florida.
Who could resist the allure of a trend-following indicator that makes it “virtu-
ally impossible to miss a major market move,” as the Cabot Market Letter put
it so tantalizingly in a spring 2002 edition?
The advertisements of technical trading indicators available to the seeker
for a price are indeed enticing. Active Trader magazine’s Internet store, for ex-
ample, offers a “groundbreaking primer,” Trading Classic Chart Patterns:
This comprehensive guide includes easy-to-use performance tables supported by
statistical research. By using a simple scoring system, you’ll learn how to predict
the performance of a chart pattern almost by looking at it. The “Trading Classic
Chart Patterns” section will serve as a handy reference guide for your favorite
chart patterns, including broadening tops, head-and-shoulders, rectangles, trian-
gles, and triple tops and bottoms. You’ll quickly learn about the Adam-and-Eve
combinations of double tops and bottoms, and how to select the best performers
while avoiding the losers. You’ll discover:
• How to use the price trend leading to a chart pattern as a gauge of future
performance.
• How tall formations perform substantially better than short ones.
• What a partial decline is and how to buy in early for a larger profit.
This book is an invaluable resource that provides the obvious answer—Yes!—
for every investor who has wondered if trading chart patterns can be profitable.6
Granted that some trend followers have achieved success. Doubtless their
intelligence and insights are superior to our own. But it is worthwhile to step
back and consider two fundamental questions:
1. Is their central rule, “The trend is your friend,” valid?
2. Might their reported results, good or bad, be best explained as due to
chance?
Our initial observation is that common sense argues against trend follow-
ing. Take two points on a price chart, draw a straight line between them and
extend that line. If the point later in time is above the first, the line slopes up.
If the later point is below the first, the line slopes down. What does that show,
except that a stock has been up or down?
nied_c03.qxd 1/24/03 2:10 PM Page 75

76 Practical Speculation
What strikes us as common sense, however, is not
enough to settle the question. We tested the trend proposition
as best we could by running numerous tests of our own devis-
ing. We also surveyed the extensive academic literature on
technical analysis, and updated and tested others’ work. We report the results
in this chapter.
Numerous obstacles beset anyone who tries to test momentum-trading
theories. The patterns themselves, as well as the studies purporting to show
their efficacy, all suffer from a basic problem: Patterns are based on prospec-
tive events that had not taken place when the fish was supposedly caught. The
fish, in other words, is counted while still in the water.
Two professors at Southern Methodist University, Venkat Eleswarapu
and Marc Reinganum, illustrated some of the difficulties in studying mo-
mentum in a recent paper, “The Predictability of Aggregate Stock Market Re-
turns: Evidence Based on Glamour Stocks.”7 The study concludes that the
returns of the market are negatively correlated with the returns
of glamour stocks in the previous 36 months. They find no ev-
idence that value stocks predict future returns. The study uses
data from 1951 to 1997 and therefore does not take into account the regime
shift that has taken place in glamour stocks since 1997. The Nasdaq doubled
from the end of 1997 to March 24, 2000, and tumbled 72 percent thereafter
through July 2002. Such dragons require new powers of divination in those
who would confront them. Moreover, the professors’ selective use of a group
of companies for which continuous earnings data were available on Compu-
stat may well have resulted in the omission of some beasts and stocks perti-
nent to the results.
Testing for Trends
We began our own tests by looking for trends from year to year. Using data
provided by the authors of Triumph of the Optimists, which we consider the
best investment book ever written, we found that trends in annual returns
have been absent for the last 102 years. For consecutive years, the correlation
is minus 0.02. (The correlation between the return in one year and the return
two years later is minus 0.25—much better.) In recent years, the correlations
have been even more negative; three consecutive negative annual returns in
the S&P 500 were last seen in 1939–1941. (As we write, near the end of 2002,
it looks like the market may complete a third down year, finally throwing the
trend followers a bone after their long privation.)
nied_c03.qxd 1/24/03 2:10 PM Page 76
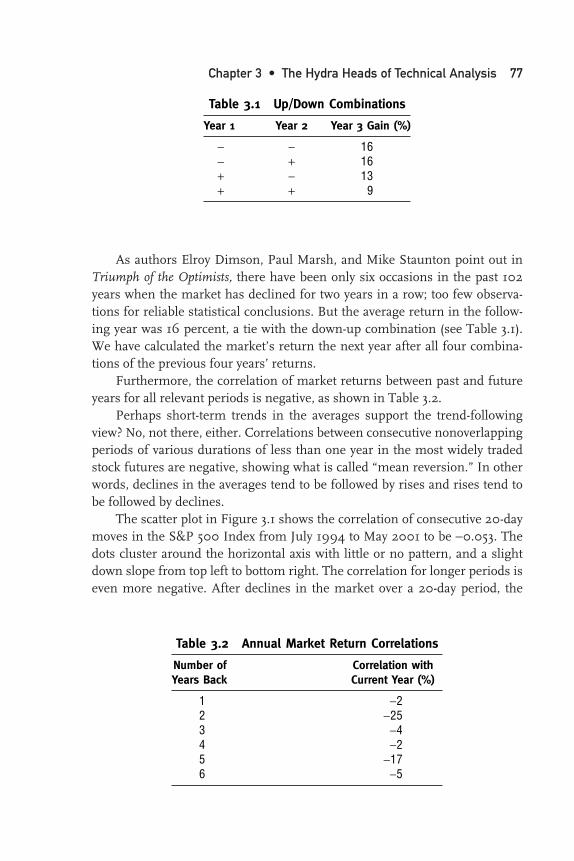
Chapter 3 • The Hydra Heads of Technical Analysis 77
As authors Elroy Dimson, Paul Marsh, and Mike Staunton point out in
Triumph of the Optimists, there have been only six occasions in the past 102
years when the market has declined for two years in a row; too few observa-
tions for reliable statistical conclusions. But the average return in the follow-
ing year was 16 percent, a tie with the down-up combination (see Table 3.1).
We have calculated the market’s return the next year after all four combina-
tions of the previous four years’ returns.
Furthermore, the correlation of market returns between past and future
years for all relevant periods is negative, as shown in Table 3.2.
Perhaps short-term trends in the averages support the trend-following
view? No, not there, either. Correlations between consecutive nonoverlapping
periods of various durations of less than one year in the most widely traded
stock futures are negative, showing what is called “mean reversion.” In other
words, declines in the averages tend to be followed by rises and rises tend to
be followed by declines.
The scatter plot in Figure 3.1 shows the correlation of consecutive 20-day
moves in the S&P 500 Index from July 1994 to May 2001 to be −0.053. The
dots cluster around the horizontal axis with little or no pattern, and a slight
down slope from top left to bottom right. The correlation for longer periods is
even more negative. After declines in the market over a 20-day period, the
Table 3.1 Up/Down Combinations
Year 1 Year 2 Year 3 Gain (%)
− − 16− + 16+ − 13+ + 9
Table 3.2 Annual Market Return Correlations
Number of Correlation with Years Back Current Year (%)
1 −22 −253 −44 −25 −176 −5
nied_c03.qxd 1/24/03 2:10 PM Page 77
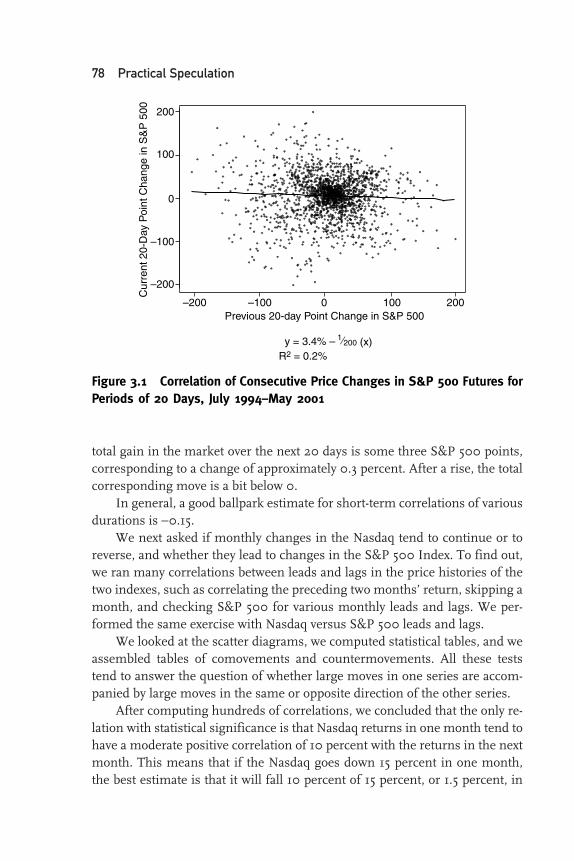
78 Practical Speculation
total gain in the market over the next 20 days is some three S&P 500 points,
corresponding to a change of approximately 0.3 percent. After a rise, the total
corresponding move is a bit below 0.
In general, a good ballpark estimate for short-term correlations of various
durations is −0.15.
We next asked if monthly changes in the Nasdaq tend to continue or to
reverse, and whether they lead to changes in the S&P 500 Index. To find out,
we ran many correlations between leads and lags in the price histories of the
two indexes, such as correlating the preceding two months’ return, skipping a
month, and checking S&P 500 for various monthly leads and lags. We per-
formed the same exercise with Nasdaq versus S&P 500 leads and lags.
We looked at the scatter diagrams, we computed statistical tables, and we
assembled tables of comovements and countermovements. All these tests
tend to answer the question of whether large moves in one series are accom-
panied by large moves in the same or opposite direction of the other series.
After computing hundreds of correlations, we concluded that the only re-
lation with statistical significance is that Nasdaq returns in one month tend to
have a moderate positive correlation of 10 percent with the returns in the next
month. This means that if the Nasdaq goes down 15 percent in one month,
the best estimate is that it will fall 10 percent of 15 percent, or 1.5 percent, in
Figure 3.1 Correlation of Consecutive Price Changes in S&P 500 Futures forPeriods of 20 Days, July 1994–May 2001
Cur
rent
20-
Day
Poi
nt C
hang
e in
S&
P 5
00 200
0
100
–200
–100
200Previous 20-day Point Change in S&P 500
–200 1000–100
1⁄200 (x) y = 3.4% – R2 = 0.2%
nied_c03.qxd 1/24/03 2:10 PM Page 78

Chapter 3 • The Hydra Heads of Technical Analysis 79
the next month. If it goes up 20 percent in one month, the best estimate is
that it will go up 10 percent of 20 percent, or 2 percent, in the next month.
This can be seen in the scatter plot in Figure 3.2 as a slight uplifting of the line
of best fit from the bottom left to the top right.
That does not reduce the uncertainty by much. In fact, the predictions re-
duce the squared error of forecasts by a mere 1 percent. Thus, while there is
some evidence of momentum in the Nasdaq, it isn’t very useful. All the other
correlations are random and consistent with chance. Considering the many
correlations that we ran, there is a reasonable likelihood that the one signifi-
cant correlation that we did come up with is the kind of chance result that
would occur if we picked the winner of a heads-and-tails coin-tossing contest.
Streaks in Sports
Taking a break from our scrutiny of indexes, we looked for insights on mo-
mentum in a completely different field: sports.
In sports, casinos, and stocks, there is nothing like a winning streak to
thrill players and onlookers. The excitement is conveyed by the common ex-
pressions “hot hand” and “in the zone.” In Fools Die, the late Mario Puzo de-
scribed the magic of a gambler’s $400,000 lucky night:
Figure 3.2 Nasdaq Monthly Performance as Indicator of Next-Month Returns.(Data are from year-end 1971, year of Nasdaq’s inception, through April 2002,a total of 370 monthly observations.)
–0.3
–0.1
–0.2
0.0
0.1
0.2
Cur
rent
Mon
th’s
% C
hang
e in
Nas
daq
–0.3 –0.2 0.0 0.1–0.1Previous Month’s % Change in Nasdaq
0.2
R2 = 1.3% y = 0 + 1⁄10 (x)
nied_c03.qxd 1/24/03 2:10 PM Page 79

80 Practical Speculation
He bet two hundred on the line, backed up his numbers and then bought all the
numbers for five hundred dollars each. He held the dice for almost an hour. After
the first fifteen minutes the electricity of his hot hand ran through the casino and
the table jammed full. . . . [When] the dice passed from his hands to the next
player, the gamblers at the table gave him a cheer. The pit boss gave him metal
racks to carry his chips to the casino cage.8
Plenty of examples of winning streaks in sports come to mind, particu-
larly in basketball. There was the 8,829-game run of the Harlem Globetrot-
ters from the 1960s to the 1990s. Before Michigan State’s basketball team
beat them in November 2000, they had not lost a college game since 1962.
The Los Angeles Lakers won 33 games in a row from November 5, 1971, to
January 7, 1972.
North Carolina’s NCAA Women’s soccer team had a 103-game unbeaten
streak from September 30, 1986, to September 17, 1990. From 1987 to 1997,
the Cuban National baseball team won 150 consecutive games.
Sometimes the hot hand shows up in an individual player during a single
game. In Game 3 of the NBA playoffs between the New Jersey Nets and
Boston Celtics on May 22, 2002, the Nets were ahead by 21 points at the end
of the third quarter, 74–53. That’s when Paul Pierce of the Celtics, perhaps
inspired by rousing comments from teammate Antoine Walker, entered “the
zone.” Until then, he had scored just 9 points, but he piled up 19 in the final
quarter. The Celtics won the game 94–90. (In this case, Walker’s individual
streak won out over a statistical streak in NBA history that had favored the
Nets. Until that day, 171 teams had headed into the fourth quarter with leads
of 18 points or more, and none had ever lost.)
The critical question is whether streaks are consistent with chance. If
athletes or teams are good, they are likely to win more than half the time. Is
their chance of winning better after they win a few times than when they
lose? Are hot hands real, or do they just seem that way because of the va-
garies of memory?
Most researchers who have studied hot hands conclude the concept is a
myth. The expert in the field is Cornell University psychology professor Thomas
Gilovich. In a series of studies, he looked at records of shots from the floor by
players in the Philadelphia 76ers, foul shots by the Boston Celtics, three-point
shots in the All-Star contest, and a shooting experiment with the Cornell college
team. In each case, he concluded, “detailed analyzes provided no evidence for a
positive correlation between the outcomes of successive shots.”
After sinking a few in a row, a player may think he is in the zone. But the
numbers show that the chance of hitting the next shot tends to decrease
slightly from the average level of some 50 percent.
nied_c03.qxd 1/24/03 2:10 PM Page 80
Chapter 3 • The Hydra Heads of Technical Analysis 81
One of the criticisms of these basketball studies is that they attempt to
measure individual hot hands in team sports where there is significant inter-
action. However, Jim Albert and Jay Bennett examined streaks of baseball bat-
ters and teams during the 1998 season in their 2001 book Curve Ball: Baseball,Statistics, and the Role of Chance in the Game, and found that only six of 30
teams showed streakiness, a result consistent with chance.9
Some studies have found evidence of streaks in other sports. A study of
hot hands in the Professional Bowling Association tour found some short-
term persistence in individual scores. In a noteworthy study of horseshoe
pitchers’ hot hands, Pomona College economics professor Gary Smith found
that the number of double ringers pitched showed strong persistence. After
two doubles in a row, the players in world championships pitch doubles 60
percent of the time. After two nondoubles in a row, they pitch double ringers
only 47 percent of the time. Smith disagreed with the basketball data of Cor-
nell’s Gilovich, and concluded that horseshoe players do have modest hot and
cold spells. Barry Nalebuff and Avinash Dixit, game theory experts and coau-
thors of The Competitive Edge in Business, Politics, and Everyday Life, have this
to say about the apparent difference between individual and team streaks:
While the statistical evidence denies the presence of streak shooting, it doesn’t re-
fute the possibility that a hot player might warm up the game in some other way.
The difference between streak shooting and a hot hand arises because of the in-
teraction between the offensive and the defensive strategies. Suppose Andrew
Toney does have a truly hot hand. Surely the other side would start to crowd him.
This could easily lower his shooting percentage. That is not all. When the defense
focuses on Toney, one of his teammates is left unguarded and is more likely to
shoot successfully. In other words, Toney’s hot hand leads to an improvement in
the 76ers team performance, although there may be a deterioration in Toney’s in-
dividual performance.10
“Which,” observed Hany Saad, the equities and derivatives
trader at the Royal Bank of Canada who called our attention to
the Dixit-Nalebuff study, “takes us back to Robert Bacon’s
handicapping principles and ever-changing cycles.”
The Market’s Momentum Pendulum
The belief in streaks is as common in the market—where it goes by the names
“trend” and “momentum”—as it is in gambling and sports. Just as a card
player feels “in the zone” after filling in a few flushes, everyone’s bullish when
stocks go up three weeks in a row and bearish after three down weeks. While
nied_c03.qxd 1/24/03 2:10 PM Page 81

82 Practical Speculation
players have memories, most people would agree that cards don’t have mem-
ory. But do stocks have memory?
The evidence on individual stocks favors the antitrend school. Jonathan
Lewellen, an instructor at the Massachusetts Institute of Technology, con-
cluded in a series of seminal studies that the evidence for mean reversion is
strong. He used 66 years of data, from 1932 to 1998, going through millions
of careful calculations and correcting for all the usual biases in studies of this
nature. Calculating the mean average price of a stock in a single year, he found
that stocks returned 41 percent toward the mean, on average, over the next six
quarters. From 1968 through 2000, Lewellen found the correlation was a neg-
ative 24 percent. Thus, if the return on a stock was 50 percentage points below
the mean in one year, the best prediction for the next six quarters would be a
rise of 24 percent times 50 percent, or 12 percent above the mean.
Normally, after showing that all the evidence is against a
theory, we would be content to end with a snappy conclusion
to the effect of “The trend is not your friend.” Yet no fixed rule
can be expected to last forever. Too many smart people are
around to anticipate and dissipate the effect. The cycles, as we often remind
ourselves, are always changing.
Have Things Changed?
Given that the evidence over the past 60 or 70 years is antithetical to the trend
followers on individual stocks, and that recent evidence on trends in the aver-
ages is equally unfavorable, we nevertheless had to ask ourselves, how is
trend-following doing right now, at the start of the new century, compared
with mean-reversion investing?
After all, academic findings too often come down the pike at exactly the
wrong time for investors. Take the groundbreaking 1981 study published in
the Journal of Financial Economics which concluded that small stocks consis-
tently registered higher returns than larger ones. The study’s release was fol-
lowed by 18 years in which small stocks lagged larger stocks. Regrettably, the
bad stretch began in 1983, after a honeymoon period gave the numerous new
small-cap investment vehicles inspired by the study enough time to attract a
lot of money. Dimson, Marsh, and Staunton called attention to this reversal of
fortune in a 1999 article entitled “Murphy’s Law and Market Anomalies.”11
Ironically, in 1999, the year the article was published, small caps recorded
one of their best years ever. In 2000 and 2001, they continued to do well
enough to outperform the S&P 500.
nied_c03.qxd 1/24/03 2:10 PM Page 82

Chapter 3 • The Hydra Heads of Technical Analysis 83
The truth is that the market panorama is rich enough to
find anecdotes that seem to support any kind of market rela-
tion. To find out whether the cycle might be changing once
again, whom are you going to call? The Speculators.
We took the 20 best and worst performers in the S&P 500 during the year
2000. (The current S&P 500 contains a few companies that were not around
at the beginning of 2000, so it was necessary to eliminate all such new addi-
tions from our tally.) We found that the 20 best stocks of 2000 returned an av-
erage of −11 percent over the subsequent 16 months (through April 29, 2002).
Calpine, down 76 percent, PerkinElmer Inc., down 76 percent, and Allergan,
down 32 percent, were among the bests that stumbled badly. (The situation
would have been even worse if such stocks as Enron, a stalwart member and
top performer of the S&P in 2000, had been included. Enron was delisted in
November 2001, and we had to drop its bad results, which would have taken
another 5 percentage points from the 20 best.)
The 20 worst stocks of 2000 were unchanged in the next 16 months, on
average. That list included some standout winners such as American Greet-
ings, up 91 percent from December 29, 2000, through April 29, 2002; Apple
Computer, up 55 percent; Cendant, up 91 percent; Circuit City, up 86 percent;
and Dell, up 48 percent. The S&P 500 Index itself declined 19 percent in the
16-month period (see Table 3.3).
Of course, buying the worst is by no means the road to guaranteed riches.
Yahoo!, down 86 percent in year 2000, went on to lose 53 percent more in the
next 16 months. Novell, Lucent, and Gateway suffered similar fates. World-
Com collapsed from $13.15 to $2.35, and proceeded to fall to 6 cents a share on
July 1, 2002.
We next tested large stocks to see if they are subject to trending. We had
noticed that large pharmaceutical companies often show three consecutive
weeks of rises or declines. For example, Johnson & Johnson fell three weeks
in a row starting the last week of April 2002. Would you have predicted that
the stock would rise the next week? Or would you have bet that it would fall
further into the cellar? A “yes” answer to the first question would indicate a
Table 3.3 Rankings and Returns
S&P 500 Stocks Return Next2000 Rank 16 Months (%)
20 best −1120 worst 0S&P 500 index −19
nied_c03.qxd 1/24/03 2:10 PM Page 83

84 Practical Speculation
“gambler’s bias” and a vulnerability to the law of small numbers. The second
question would show a “representation,” or hot hands bias. (In fact, Johnson
& Johnson fell for 10 straight weeks.) But this seeming piece of evidence for
the trend followers is anecdotal, nothing more. As Daniel Kahneman, Paul
Slovic, and Amos Tversky point out in their classic Judgment under Uncer-tainty: Heuristics and Biases, the common habit of assessing the probability of
an event by the ease in which instances can be brought to mind leads to an as-
sortment of predictable biases.12 An example would be assessing the risk of
heart attack among middle-aged people by recalling such occurrences among
one’s acquaintances. No one would take such an estimate seriously, but peo-
ple do its equivalent in the market all the time.
There are not enough Big Pharma companies to run a proper test of these
perceptions. Therefore, we chose as proxies the current 10 largest Nasdaq
stocks and the 10 largest S&P 500 stocks by market capitalization. Since Intel
and Microsoft were common to both lists, we were left with 18 companies. We
studied weekly prices from May 1997 to May 2002. To simplify our tests and
maintain a reasonable homogeneity in the results, we calculated the signs of
the moves in each of the first three weeks for each stock. There were eight
possibilities in all. Then we looked at the results that occurred in the remain-
ing week of the month for each stock. The averages and numbers of observa-
tions appear in Table 3.4.
We conclude that stocks in the lead triumph and prosper in the last week,
whereas those that are near the bottom meet disaster in the final week. When
a stock is up three weeks in a row, it adds an average 1.6 percent in the final
week. When a stock is down three weeks in a row, it falls an average 0.8 per-
cent. If stocks fall the first two weeks and then rise, they drop 1.4 percent by
Table 3.4 Streaking Stocks—Moves in the Last Week of the MonthCompared with Previous Weeks, 1997–2002
Number of Average MoveWeek 1 Week 2 Week 3 Observations Week 4 (%)
Up Up Up 156 +1.6Up Up Down 165 +0.6Up Down Up 188 +0.6Up Down Down 125 +1.3Down Up Up 108 −1.3Down Up Down 91 +2.8Down Down Up 114 −1.4Down Down Down 100 −0.8
nied_c03.qxd 1/24/03 2:10 PM Page 84
Chapter 3 • The Hydra Heads of Technical Analysis 85
the end of the month. Most striking of all was the group that reversed like a
pendulum during the first three weeks. Stocks that were down the first week,
up the second week, and down the third week tend to go up 2.8 percent in the
final week.
We can classify eight different groups of stocks based on their persist-
ence and reversibility in the first three weeks. Within each group and within
the sample of 1,047 company-weeks, there is much variation in perfor-
mance. The average variation in the performance of an individual company
during the final week is 10 percent. Chance doubtless contributes in large
measure to the results.
Yet putting it all together, after some simulation and calculations, we con-
clude that the superior performance of 2.8 percent in the final week for the
group of companies that zigzagged down up down during the first three weeks
is unlikely to have occurred by chance. Let’s call it a 1-in-20 shot.
By contrast, the tendency for momentum to continue in the final week for
the companies that registered three consecutive rises or three consecutive de-
clines is suggestive but not conclusive. It is about a 1-in-10 shot.
Putting one consideration with another, we found no evidence of a
regime shift in market dynamics that would favor trend following. The weight
of academic findings and practical results showed the tendency to mean re-
version to be intact, for all periods, all individual stocks, all averages, and all
new indexes that we might reasonably think of.
We conclude that the pendulum, rather than the streak, is the superior
model for U.S. stocks.
A Venerable Indicator of Great Ambiguity
Some countries have developed forms of technical analysis that are ideally
suited to their own cultural traits. In Japan, where ambiguity in negotiation is
a way of life, traders have developed and refined over many centuries the tech-
nique of candlestick analysis. As Steve Nison notes in his popular reference
book, Japanese Candlestick Charting Techniques, “As with all charting methods,
candle chart patterns are subject to the interpretation of the user.”13 This
should come as no surprise. All who have done business with the Japanese
know of their polite reluctance to give a simple “yes” or “no.” It would have
been amazing indeed if a country that prizes indirection had come up with a
precisely defined method susceptible of confirmation by experimentation.
Candlesticks show open, high, low, and close points. A rectangular bar—
“the body”—encompasses the close and the open, while “whiskers” extend
nied_c03.qxd 1/24/03 2:10 PM Page 85
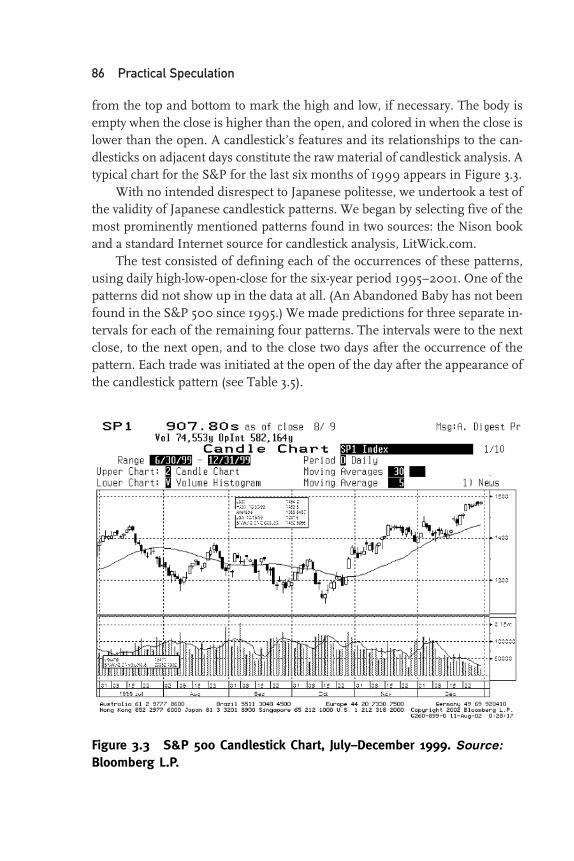
86 Practical Speculation
from the top and bottom to mark the high and low, if necessary. The body is
empty when the close is higher than the open, and colored in when the close is
lower than the open. A candlestick’s features and its relationships to the can-
dlesticks on adjacent days constitute the raw material of candlestick analysis. A
typical chart for the S&P for the last six months of 1999 appears in Figure 3.3.
With no intended disrespect to Japanese politesse, we undertook a test of
the validity of Japanese candlestick patterns. We began by selecting five of the
most prominently mentioned patterns found in two sources: the Nison book
and a standard Internet source for candlestick analysis, LitWick.com.
The test consisted of defining each of the occurrences of these patterns,
using daily high-low-open-close for the six-year period 1995–2001. One of the
patterns did not show up in the data at all. (An Abandoned Baby has not been
found in the S&P 500 since 1995.) We made predictions for three separate in-
tervals for each of the remaining four patterns. The intervals were to the next
close, to the next open, and to the close two days after the occurrence of the
pattern. Each trade was initiated at the open of the day after the appearance of
the candlestick pattern (see Table 3.5).
Figure 3.3 S&P 500 Candlestick Chart, July–December 1999. Source:Bloomberg L.P.
nied_c03.qxd 1/24/03 2:10 PM Page 86

Chapter 3 • The Hydra Heads of Technical Analysis 87
Of 15 tests, 4 came up with results in the direction of traditional candle-
stick interpretations. None of the patterns was statistically significant at the
usual 1-in-20 levels typically used by researchers as the minimum cutoff for
determining whether the phenomenon was consistent with mere chance
variations. Our tests thus failed to verify the validity of Japanese candlestick
analysis.
But perhaps we have been too scientific. Perhaps an unusual ability to
interpret these patterns might yield better results. “Technical analysis is
an art as well as a science” is an oft-repeated refrain we hear from technical
Table 3.5 Japanese Candlestick Pattern Trades
S&PBearish/ Number of Point Up
Pattern Bullish Period Observations Change % Z
Three black Bearish Open to close 21 3.7 57 119crows
Open to open 21 4.9 67 156
Open to next 21 5.7 57 156day ’s close
Engulfing Bearish Open to close 22 2.3 36 −79
Open to open 22 3.2 41 −92
Open to next 22 2.2 50 −47day ’s close
Doji in an Bearish Open to close 10 −0.6 50 −21uptrend
Open to open 10 −3.0 50 −69
Open to next 10 −2.5 40 −69day ’s close
Abandoned Bearish Open to close 0baby
Open to open 0
Open to next 0day ’s close
Tweezers top Bearish Open to close 57 0.9 51
Open to open 57 0.8 56
Open to next 57 −0.5 60day ’s close
nied_c03.qxd 1/24/03 2:10 PM Page 87

88 Practical Speculation
analysts. Doubtless many practitioners are more gifted with visual modes of
decision making than with numerical methods. Chess players, for example,
often see visual relations that they find difficult to quantify when explaining
how they came up with that one perfect move that won the game. Similarly,
architects, engineers, and artists frequently can look at a depiction of a
scene and fathom many relations that would be difficult even to define, let
alone quantify.
The great problem with that line of reasoning is that people are prone to
the “validity bias”—they believe that they are much more accurate in coming
to valid conclusions than they actually are. Humans are much too adroit at be-
lieving that relations exist when they don’t, and this illusion is responsible for
many errors in judgment and decision making in the markets and in life. In
particular, people tend to place unwarranted confidence in predictions that
match stereotypes, “with little or no regard for the factors that limit predictive
accuracy,” as Kahneman, Slovic, and Tversky wrote in Judgment under Uncer-tainty. And they persist in this misplaced confidence even if they know the
input information is scanty, unreliable, or outdated.
Even if a psychological bias were not involved in interpreting candlestick
charts and the like, it would not seem overly useful to tell the average investor
that certain people are gifted in visualization but find it impossible to put
their finger on how they arrive at their interpretations. The investor would
have no clear path to learn such techniques. And by merely following the
guidance of the superior visualizer, the investor could never know with as-
surance that the person’s gifts would continue to yield superior forecasts
under different conditions.
Technical analysis is silent on such crucial questions as what time frame
to use when searching for patterns. As our friend Shui Mitsuda, a great mar-
ket philosopher who works for a Japanese brokerage, observed: “By changing
the range of variables in a chart (duration, price range), the graph often shows
completely different faces. In the one-year range, Sony is a strong buy. In the
10-year range, I get too scared. In the one-month range, I have no idea.”
The greatest problems with using candlestick patterns to
trade, however, lie in the principle of ever-changing cycles and
the role of deception in the market.
Our friend Glenn Escovedo, a chess expert who trades for a white-shoe
Wall Street firm, sent us one of the most popular books in China, The Book ofStratagems by Harro von Senger, to give us some insight into Japanese techni-
cal analysis.14 The book contains deceptive techniques of great antiquity, two
of which we summarize here:
nied_c03.qxd 1/24/03 2:10 PM Page 88

Chapter 3 • The Hydra Heads of Technical Analysis 89
1. Fool the emperor and cross the sea: The Emperor Taizong, arriving at the
shore of the Yellow Sea with an army of 300,000 on the way to a battle in
Kogouryo, loses heart. Turning to his military advisors, he asks for advice.
Fearing the emperor will abort the campaign, the advisors build a boat
camouflaged as the home of a wealthy merchant. They lure him aboard,
then take to sea. When the candelabra starts swaying, the emperor orders
the curtains to be pulled back. “Where are we?” he roars. Faced with a fait
accompli, he regains his decisiveness and bravely sails on.
2. Openly repair the walkway, secretly march to Chencang: In 206 B.C.,
the military leader Liu Bang retreats to Hanzhong to escape a murder-
ous rival. To protect himself from attack, he burns the wooden walk-
ways and bridges in the mountain gorges along the way. Later that year,
he prepares for a new campaign in Chencang. To distract his enemies,
he orders a few troops to begin repair work on the walkways. The mili-
tary commander in Chencang laughs, thinking it will take such a mod-
est number of workers many years to restore the walkways. But Liu
Bang’s forces secretly march on a different route to Chencang, taking
the city by surprise.
“The Chinese have lived and died by deception for thousands of years,”
observed Escovedo. “Hard to believe they or the Japanese would take charts at
face value.”
What is even harder to fathom is the Western craze for Japanese candle-
stick analysis. In Japanese Candlestick Charting Techniques, Nison talks about
the technique’s gratifying popularity:
Online traders, day traders, institutional proprietary traders, and market makers
are just some of the candle charting enthusiasts. Web sites, real-time trading sys-
tems, and technical analysis software packages include candle charts. This attests
to the popularity and universal appeal candles have to trading today’s volatile mar-
kets. Candles are hotter than ever.
Even so, Nison’s book includes many Western-style elaborations on pure
candlestick patterns for “the seasoned technician,” including candlesticks
with trend lines, candlesticks with retracement levels, candlesticks with mov-
ing averages, candlesticks with oscillators, candlesticks with volume and open
interest, candlesticks with Elliot Wave, and candlesticks with market profile.
Acquaintances familiar with our thinking take care to discuss candlestick
patterns only behind our backs. Sometimes, however, a stray reference will
slip through, as when an e-mail extolling Nison’s book, meant for a more re-
ceptive target, mistakenly was sent to us. “Candlestick charting dates from
nied_c03.qxd 1/24/03 2:10 PM Page 89

90 Practical Speculation
Tokugawa times—late 16th, early 17th century,” the writer gushed. “The book
has pages and pages on the psychology underlying patterns like head and
shoulders, which the Japanese rice traders called ‘Three Buddha Top.’ The one
I like is ‘High Waves’—makes me seasick just to think about it.” After confid-
ing his yen to explore such formations as “Doji Star,” “Three White Soldiers
Advance on the Dark Shadow,” and “Candles Exhaust Themselves to Give
Light to Men,” the writer concluded:
Much as I admire Vic and Laurel, for me it is going to take [a lot] to overturn 400
years of profitable tradition.
Others among our correspondents tell us they have found creative uses for
their books on candlestick analysis. John Lamberg of Minnetonka, Minnesota,
one of our most sagacious correspondents—engineer, Monty Python afi-
cionado, Father Knows Best family man, and reformed technical analysis practi-
tioner—uses his book on candlestick patterns to steady the shaky leg of his
coffee table.
The Hydra’s Arms
We next studied another prominent Hydra head–the well-known TRIN, short
for the New York Stock Exchange Short-Term Trade Index. Its inventor,
Richard Arms, who charges $8,000 a year for his advisories, prefers the
eponymous “Arms Index.” CNBC, the most widely watched financial TV net-
work, uses the latter name when it flashes the current index reading every 20
minutes past the eyes of viewers.
The Arms Index represents the ratio of New York Stock Exchange up vol-
ume scaled down by number of rises, divided by the ratio of down volume,
scaled down by the number of declines. Some traders use a five-day average
for short-term forecasts.
Some favorable press came in early 2001, when pundit
Don Hays told Barron’s that he used the Arms Index to call the
exact bottom of the Dow Jones Industrial Average on March
22.15 (The Dow peaked 60 days later on May 21 after rallying 21
percent, then resumed its decline.)
So TRIN works, right?
It sounded intriguing. We decided to check. Working with Dr. Brett
Steenbarger, who has used TRIN in his own trading, we ran hundreds of re-
gressions with many lags and leads for many different back periods. We stud-
ied correlations of one-day, two-day, five-day, and 10-day TRIN with S&P 500
nied_c03.qxd 1/24/03 2:10 PM Page 90

Chapter 3 • The Hydra Heads of Technical Analysis 91
Index moves over the next 1, 5, and 10 days. Briefly, we found the results to be
consistent with randomness, with correlations close to or right at zero over
the last three and a half years. In other words, the Arms Index does not pre-
dict the future.
We were not the only ones to find difficulties with TRIN. In a study cited
by The Encyclopedia of Technical Market Indicators, Robert Colby and Thomas
Meyers tested TRIN from January 1928 to March 1987.16 Using daily data, they
performed many different tests to come up with predictions for one to twelve
months. Their finding: “We can only conclude that it has relatively limited
forecasting value for stock prices.”
Some may feel that the above conclusion is premature since it is based on
only 59 years of data. But in The New Technical Trader, Tushar Chande and
Stanley Kroll note three difficulties with using TRIN:
1. The ratios used in TRIN often obscure, rather than clarify, market ac-
tion. This is particularly true when market action is “mixed.”
2. The very process of smoothing TRIN with moving averages distorts the
picture of relative volume flows.
3. TRIN has a bounded scale for upside activity, but an unbounded scale
for downside activity.17
We spoke with Richard Arms in May 2001 to find out what he thought of
our conclusions, and to learn how he uses the index. In his words:
Laurel: Do you trade much?
Arms: I trade some money for myself, but my primary work is talking
with my clients. I put out an advisory for dozens of institutions. I
don’t trade much any more, because I’m occupied with other things.
Laurel: Millionaire? Centimillionaire?
Arms: Somewhere in the middle.
Laurel: From trading?
Arms: From trading, and from the fees I charge my clients.
Laurel: How would you advise people to use the index?
Arms: If you’re a trader, watch the five-day moving average. When it’s in
the 0.75 sort of area, you become a seller, and when it’s over 1.25 you
become a buyer. It’s a judgment thing. . . . The 10-day moving aver-
age allowed us to call the bottom perfectly on March 22, 2001.
Laurel: Can you elaborate on how to use judgment?
Arms: After working with it for so many years, it becomes a little . . . in-
stinctive. I’m not sure I can explain it, really. I explain it to my . . .
institutional clients. I look at a lot of things. I’m not just looking
nied_c03.qxd 1/24/03 2:10 PM Page 91

92 Practical Speculation
blindly at this index and saying buy or sell. It’s not just a simplistic
sort of thing.
Laurel: How many times have you used the Arms Index as a primary sig-
nal in the past five years?
Arms: It has given only two of those big major signals in the last five
years, this one and in October 1997. Then we have to go back to 1987
to get a similar signal.
If There Is Proof, We Cannot Find It
The problem is that “buy” levels for the 10-day average do not happen enough
to scientifically evaluate the Arms Index. You cannot estimate uncertainty
based on something that happens twice every five years.
Also, the signals happen to occur at times when the market is most down,
so basically what you are taking advantage of is the old adage to buy in panics.
Statistically, it is exceedingly difficult to evaluate a ratio of two ratios. In
statistical terms, the distribution of the ratio of two normal variables has an
infinite mean and an infinite variance. Larger samples do not help you reduce
uncertainty about the mean or variability of the indicator.
Numerically, the ratio is also highly problematic. Its variations are domi-
nated by changes in volume, which are themselves highly correlated with
price changes. The ratio itself varies from zero to infinity. A more stable mea-
sure might be based on the differences between volume and advances versus
declines, perhaps with a logarithmic operator thrown in for stability.
All things considered, working with the Arms Index is about as easy and
useful as holding a moonbeam in your hand.
We told Arms that we had found no correlation between TRIN’s moving
averages and subsequent S&P 500 moves, and he said it bothered him to hear
us say that. “All of Wall Street uses the index,” he said, “because it works.”
A Disagreement That Speaks Volumes
Many technical analysis (TA) practitioners, after reviewing one study or an-
other showing that their favorite technique doesn’t work, object that we failed
to consider volume. We merely point out that technical analysts themselves
cannot agree on how volume might work. Hany Saad, our trader friend at the
Royal Bank of Canada, took all three levels of the CMT exams before becoming
nied_c03.qxd 1/24/03 2:10 PM Page 92
Chapter 3 • The Hydra Heads of Technical Analysis 93
convinced that technical analysis does not work. He pointed out in a July 2002
e-mail to us:
Any technical analyst would argue that volume is 50 percent of the puzzle. Clas-
sical technical analysis suggests that a price move in certain direction should not
be trusted unless volume is flowing in the same direction of the move. In a bull
market, for example (whatever that is), volume should be higher on up days than
on reactions. That’s in a nutshell how Magee’s theory goes. In fact, this is even
mentioned in Charles Dow’s letters as described by Hamilton in “The Stock Mar-
ket Barometer.”
Here is where it gets real funny. Your favorite technician, Richard Arms, de-
veloped an indicator called Ease of Movement. Here is a description of the indica-
tor from “Technical Analysis from A to Z”:
The Ease of Movement indicator shows the relationship between volume and
price change. As with Equivolume charting, this indicator shows how much vol-
ume is required to move prices.
High Ease of Movement values occur when prices are moving upward on
light volume. Low Ease of Movement values occur when prices are moving down-
ward on light volume. If prices are not moving, or if heavy volume is required to
move prices, then the indicator will also be near zero.
The Ease of Movement indicator produces a buy signal when it crosses above
zero, indicating that prices are moving upward more easily; a sell signal is given
when the indicator crosses below zero, indicating that prices are moving down-
ward more easily.
So while Charles Dow states that volume should be there on up days of up-
trends to generate a buy signal, Richard Arms suggests the exact opposite. Who
should you trust? Neither. Studies conducted on volume as an independent vari-
able prove that it has no predictive value whatsoever.
Finally, you probably should know that if not for Vic, I would probably be
using the same TA tools I am ridiculing today.
Shouldering Ahead
Midway through the great crash of July 2002, a post came across our moni-
tors from a publicity-shy hedge fund manager whom we call Mr. E. “The tech-
nical action in the S&P since the big-cap rally last week is being threatened by
a massive head and shoulders going back to January 1998,” he wrote.
Since his July 10 message, the S&P broke through its January 1998 lows
and headed straight down to April 1997 levels. On Tuesday, July 23, 2002, it fell
below 800. By the usual methods of reckoning, the next stop for S&P futures
was 540. As for the Nasdaq 100, it looked to be headed for negative 2,690.
nied_c03.qxd 1/24/03 2:10 PM Page 93

94 Practical Speculation
We asked John Lambert, who estimated the next stop as 540, if he was
joking. He replied:
No, it was actually a mistake. I graphically made a quick measurement from the
top of the head to the neckline and used the length of that line segment to “pre-
dict” the low. Alas, I was on a semi-log scale so I did not measure the “correct”
number of points. Don Van made the measurement per Edwards and Magee and
came up with 300, close to what I get.
Your query prompted me to remove Edwards and Magee from under the cof-
fee table: “If the up move preceding the formation of the reversal area has been
small, the down move following it may, in fact, probably will, be equally small. In
brief, a reversal pattern has to have something to reverse. So, we really have two
minimums, one being the extent of the advance preceding the formation of the
Heads-and-Shoulders and the other derived by our measuring formula; whichever
is the smaller shall apply.”
Well now, this gives me some leeway. What is large and small? When does
the move preceding the formation of the reversal pattern start? Let’s define the
start of the move as a breakout in 1995. With a bit of engineering judgment, I
come up with 407 points preceding the formation of the Head & Shoulders pat-
tern. Subtracting 407 from 540 produces 543. Let’s round this down, as TA is
not, shall we say, a completely precise science. I get a target of 540. It appears
my initial calculation was not a mistake after all. That is a very good thing as I di-
vided all of my money and bet half on 540 and the other half, using Rick’s fa-
mous advice, on 22.
Did the apparent predictive success of Mr. E’s gigantic pattern mean that
trading head-and-shoulders patterns works? And with the financial world’s
very foundations seemingly about to crumble, did it matter?
It always helps to know what works and what does not, particularly dur-
ing panics. As the nineteenth-century author and journalist Daniel
Defoe documented in his account of London’s 1685 plague, worth-
less nostrums sell well to desperate people.18 It is important to keep a
clear head and take the long view. As to whether head-and-shoulders
patterns work well enough in the stock market to be profitable—they don’t, as
we can show.
Traders have used head-and-shoulders patterns since at least 1930. The
pattern consists of three peaks, the highest being in the middle. A horizontal
line—the “neckline” is drawn to connect the troughs between the shoulders
and the heads. The crossing of the neckline is supposed to signal that prices
will continue down away from the head.
An inverted pattern is read as bullish. Figure 3.4 shows a hypothetical
head-and-shoulders pattern.
nied_c03.qxd 1/24/03 2:10 PM Page 94

Chapter 3 • The Hydra Heads of Technical Analysis 95
Hypothetical Head-and-Shoulders Pattern
We believe that any wealth that accrued to Mr. E as a result of trading this pat-
tern—and we congratulate him for it—was due to luck and not a sure indica-
tor of future success. Any important question deserves to be
tested, however, and the results should be made public. Hap-
hazard anecdotes, confident assertions and appeals to author-
ity—even, or especially, our own authority—will not do.
As it happened, shortly before receiving Mr. E’s missive, we came across
a remarkable study, “Identifying Noise Traders: The Head-and-Shoulders Pat-
terns in U.S. Equities,” by Carol Osler of the New York Federal Reserve.19
After rigorous tests, she concluded that trading in individual equities based
on head-and-shoulders patterns is, on balance, unprofitable.
Osler wrote a computer program to identify head-and-shoulders patterns
based on the descriptions in eight technical analysis manuals. She applied it
to 100 firms with price data spanning July 2, 1962, to December 31, 1993, se-
lected at random from the Center for Research on Securities Prices at the
University of Chicago. All the technical analysis manuals were ambiguous
about the criteria for exit, but they agreed that a head-and-shoulders pattern
signified a major change of trend. Osler therefore wrote her program to re-
quire that a position be held until the price stops moving in the predicted di-
rection, with a stop loss of 1 percent.
Amazingly, given the lack of profitability associated with head-and-
shoulders patterns, volume around the time of the neckline crossing, the signal
Figure 3.4 Hypothetical Head-and-Shoulders Pattern
Pric
e
Time
LeftShoulder
HeadRight
Shoulder
Neckline
RightTrough
LeftTrough
nied_c03.qxd 1/24/03 2:10 PM Page 95

96 Practical Speculation
to put on a trade, increased by as much as one-quarter of an average day’s
volume.
How to account for the popularity of an unprofitable trading strategy? Ac-
cording to Osler, certain peculiarities of the human mind may account for its
acceptance. People are prone to see nonexistent connections between groups
of things. They tend to be overconfident in their own judgment. And they re-
member pleasant or successful experiences (e.g., profitable head-and-shoulders
trades) with far greater clarity than they do unpleasant experiences.
A few successes may bring the head-and-shoulders trader fame and funds,
encouraging new entrants. As Osler notes, cognitive psychologists have shown
through experiments that unrewarding beliefs and behaviors can survive a
long time when they are randomly reinforced.
Many market players say they do not believe in trading head-and-shoulders
patterns or any other visual chart patterns, but they like to know what such
traders are doing so they can eat their lunch. Lots of luck, says Osler. Even be-
fore transactions costs, trading against head-and-shoulders traders is just not
profitable in individual stocks. Another objection is that technical traders are
simply profiting from the psychology of uninformed individuals. The point
still holds—selling after such formations is unprofitable, whether the trader is
familiar with chart arcane or not.
When Laurel interviewed her, Osler had accepted a professorship in the
international economics and finance department at Brandeis, where she
plans to research the role of stop-loss and take-profit orders in the currency
market. One area of interest is the possible clustering of orders at round num-
bers. She did not plan to extend her head-and-shoulders work to S&P futures.
“Technical analysis is just not a hot topic,” she explained.
Osler grew up in the Boston suburbs and attended graduate school at
Princeton after graduating from Swarthmore. An afficionado of both squash
and ballet, she has avoided the risks of the trading floor, but enjoys taking aca-
demic risks. Ever since she went to the trading floor at Citibank to see how
order flow affected the currency market, she has been outraging the academic
establishment. “Order flow was an extremely unprofessional thing to care
about,” she said. Osler also fell astray of the norms by talking to traders, whom
academics widely view as too deceptive to yield valuable information. She re-
calls sending a colleague an e-mail outlining empirical evidence she had col-
lected on a certain subject, and asked him what he thought. He wrote back:
“First I’d have to see a careful worked-out model to see if it worked in theory.”
“My primary goal is to understand reality,” she said. “That is not univer-
sally accepted.”
nied_c03.qxd 1/24/03 2:10 PM Page 96
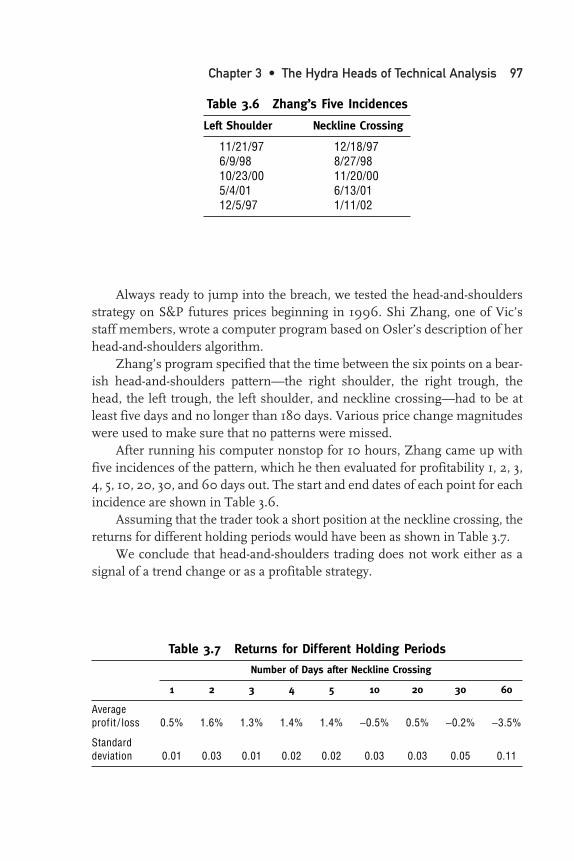
Chapter 3 • The Hydra Heads of Technical Analysis 97
Always ready to jump into the breach, we tested the head-and-shoulders
strategy on S&P futures prices beginning in 1996. Shi Zhang, one of Vic’s
staff members, wrote a computer program based on Osler’s description of her
head-and-shoulders algorithm.
Zhang’s program specified that the time between the six points on a bear-
ish head-and-shoulders pattern—the right shoulder, the right trough, the
head, the left trough, the left shoulder, and neckline crossing—had to be at
least five days and no longer than 180 days. Various price change magnitudes
were used to make sure that no patterns were missed.
After running his computer nonstop for 10 hours, Zhang came up with
five incidences of the pattern, which he then evaluated for profitability 1, 2, 3,
4, 5, 10, 20, 30, and 60 days out. The start and end dates of each point for each
incidence are shown in Table 3.6.
Assuming that the trader took a short position at the neckline crossing, the
returns for different holding periods would have been as shown in Table 3.7.
We conclude that head-and-shoulders trading does not work either as a
signal of a trend change or as a profitable strategy.
Table 3.6 Zhang’s Five Incidences
Left Shoulder Neckline Crossing
11/21/97 12/18/976/9/98 8/27/9810/23/00 11/20/005/4/01 6/13/0112/5/97 1/11/02
Table 3.7 Returns for Different Holding Periods
Number of Days after Neckline Crossing
1 2 3 4 5 10 20 30 60
Average profit / loss 0.5% 1.6% 1.3% 1.4% 1.4% −0.5% 0.5% −0.2% −3.5%
Standarddeviation 0.01 0.03 0.01 0.02 0.02 0.03 0.03 0.05 0.11
nied_c03.qxd 1/24/03 2:10 PM Page 97

98 Practical Speculation
Did You Really Expect a Straight Line to Point the Way?
It is not surprising that simple techniques like extrapolating trends do not lead
to consistent profits. All of us know from our childhood up that a key aspect of
winning in games and other competitive situations is deception. The first
game a child plays is peekaboo, and that may be our first step toward under-
standing that indirection is a better way to achieve goals than to lay all one’s
cards on the table. Animals practice deception, from the lowliest insect to the
highest primates. Adult humans are at least as knowledgeable as insects, and
they have the benefit of reading thousands of years of history going back to the
Trojan horse. Certainly the shrewd traders in the market should be more capa-
ble of raising the level of trickery above that of extending a straight line.
As the great New York Giants pitcher Christy Mathewson observed more
than a half-century ago: “Anybody’s best pitch is the one the batters ain’t hitting
that day. If they start hitting my fastball, they don’t see it anymore that after-
noon. If they start getting a hold of my curve ball, I just put it away for the day.”20
Siege of Troy, 1184 B.C. (Artist: Milton Bond, 2001).
nied_c03.qxd 1/24/03 2:10 PM Page 98

Chapter 3 • The Hydra Heads of Technical Analysis 99
On the battlefield, the best generals are the greatest masters of deception.
Our favorite in this regard is Stonewall Jackson, acknowledged as the greatest
leader in the Confederacy:
A favorite device with him was to institute inquiries in the presence of the crowd
around him as to roads and watercourses in a direction which he did not intend to
take; even to order maps to be prepared, and roads laid down, as though for in-
stant use. Having thus set every gossip talking and predicting his intentions, he
would calmly march directly in the opposite direction.21
Vic was fortunate enough to have been raised on board games from the
age of 3. His father was an avid checkers player, and as an adult, Vic took les-
sons for more than 15 years each in checkers and chess from two U.S. cham-
pions—Tom Wiswell and Art Bisguier, respectively. All board game players
know that deception is one of the keys, if not the key, to success. Wiswell
wrote some 15,000 maxims on checkers, a few of which Vic included in his
first book; we here present 10 from Vic’s unpublished collection that are par-
ticularly pertinent to deception:
1. Minefield—On the other hand, there are many tricks, traps, and swin-
dles on board, and you must keep a sharp lookout for them, or be am-
bushed and defeated. There is no safety guarantee; strategy, after all, is
the name of the game. Eternal vigilance is your best hope for sur-
vival . . . in checkers or chess.
2. Black Magic—The best trick of all is concealing your tricks.
3. The Confidence Game—It’s when you are most confident that you walk,
wide-eyed, into the hidden trap. It happens to patzers and world champi-
ons: it goes with the territory.
4. Close to the Vest—Don’t telegraph your punches. Old-timers had a say-
ing: “Play your moves close to the vest.” It’s a good maxim to follow even
if you don’t wear a vest.
5. The Switcher—You play hard against strong lines of play, but you may
be off guard when you are up against a weak opening. Before you know
it, your wily opponent has a winning game.
6. Action or Inaction—Some positions call for an aggressive attack or a
spectacular sacrifice, while others call for a quiet waiting move or an
innocent-appearing move that is really a “Lorelei,” tempting your oppo-
nent to go astray.
7. Confusing the Issue—Beware of the opponent who intently studies the
left side of the board, then quietly moves a key piece on the right side.
You have to look at the whole board to get the whole picture.
8. The Unexpected—Unless you are prepared to expect the unexpected, be
prepared to expect unexpected defeat.
nied_c03.qxd 1/24/03 2:10 PM Page 99

100 Practical Speculation
9. Houdini—Successful chess and checkers players have to be master ma-
gicians. They must escape unscathed from hopeless positions.
10. Hidden Trap—Sometimes you see a brilliant move, but fail to note a
fatal flaw at the very end. Try to see your combinations in their entirety.
Deception is as constant in the market as it is among the great masters of
board games. In response to a fellow trader’s query on the value of bid-asked
and trade size data, James Lackey described in a 2002 post to the Spec List
some deceptions that take place on a typical day:
What does it mean when Mr. Big touches his left ear after lighting a cigar and bets
his usual line in poker? What does it mean when Goldman goes high bid on
Nvidia and pushes the stock up by repeating his high bid up a dollar right before
lunchtime? What does it mean when the specialist for 3M spreads out the stock a
dollar after a decline of 50 cents then prints 50,000 shares?
Each stock has a personality. The personality is from the traders and the
market makers trading the stock. The key to intraday moves is to find the Ax. The
Ax is the market maker or makers who have the orders on a big day. The big
pushes of a dollar or more, when it is obvious who the buyer is, usually indicate
the end of the order. The best is Fidelity; they blast stocks. The worst is Janus;
they drip orders through many different firms.
One must realize the different motivations of traders, specialists and now the
ECNs [Electronic Communications Networks]. A great example is Goldman Sachs.
Not only are they GSCO on your Level 2 machine, they can be SILK, which is Spear
Leeds, which they own. Also they can be Spear’s ECN, REDI or be any other ECN,
INCA, Instinet, or they take or hit ISLD to fake out day traders. We have a machine
that tells us who bought or sold on ISLD. So if I offer 100 shares at 50 and Gold-
man takes the stock, I know. Which is probably somewhere close to the end of the
order. He has shown his cards, especially if he is high bid for a time.
They key to using time and sales and bid ask size is to know the players in the
stock. Much deception is used when printing those so-called blocks of stock. Also
bid ask size and spread is used to deceive traders into thinking stocks are either
strong or weak. It is much more difficult to judge NYSE because the market mak-
ers can’t be seen. The market makers actually stand in front of the specialist on
the floor. Therefore, you must judge the specialist’s moves. Usually if he is not
playing his usual games, he has big orders and no time to play. That is where you
want to be in, with a good hand, with a big pot.
Despite all the evidence that results relating to technical analysis
are consistent with randomness or the efficient markets hypothesis,
the field’s multifarious techniques continue to exert a certain fascina-
tion even on highly educated people. We found ourselves with a front-
row view of this phenomenon when Lamberg, the aforementioned
nied_c03.qxd 1/24/03 2:10 PM Page 100

Chapter 3 • The Hydra Heads of Technical Analysis 101
Monty Python fan, wrote a spoof of Martin Pring’s Know Sure Thing (KST)
indicator, to use in one of our columns debunking technical analysis:
I have spent over 10 years developing a technical indicator that allows me to pre-
dict the future movement of stocks with uncanny accuracy. My indicator, known
as the Guaranteed Known Thing (GKT), is based on number sequences that occur
throughout nature. It has made me a fortune. The GKT is based on the work of
two famous mathematicians: Johann Heinrich Lambert (1728–1777) and
Leonardo Pisano Fibonacci (1170–1259).
Lambert is renowned among physicists as the founder of the theory of light
measurement, and his Cosmological Letters are famous among astronomers. Lam-
bert attempted to explain the structure of the universe in these writings. In the
course of his work, he became aware of a color-triangle developed by Tobias
Mayer in Gottingen in 1758 to systematically construct many of the possible col-
ors. Building on Mayer’s work, Lambert created a triangle-based pyramid. King’s
yellow, cinnabar, and azurite occupy the three corners, and each side combines
the two corner colors to form seven hues. On the inside, all three basic colors con-
tribute to the color of each respective surface. The 45 hues of the lowest triangle
give way to increasingly higher and brighter triangles of 28, 15, 10, 6, and 3 hues.
The pyramid’s tip is white, for a total of 108 hues.
What does this have to do with making my fortune? I check the entire uni-
verse of stocks for action around the 45- and 108-day moving averages, then look
for golden-hued crosses at a sequence of 28-, 15-, 10-, 6-, and 3-day moving aver-
ages. The stocks that survive this incredibly powerful screen are then checked for
Fibonacci Fan and Arc intersections.
So powerful is this analysis that I caught the start, top, and bottom of the en-
tire Internet move. But I am not greedy and have decided to divulge the stocks
picked by the GKT indicator on my new hotline, the King’s Ransom. You can be
my first subscriber.
Lamberg’s mention of real mathematicians lent a certain believability to
the fabrication.
In fact, the GKT indicator sounded so good that one of our editors, one of
the sharpest minds in financial journalism, assumed it was real. When we in-
nocently referred after the column’s publication to the brilliance of Lamberg’s
fabrication, we were within a cat’s whisker of being fired once again.
Propaganda Aspects of Technical Analysis
Momentum indicators, straight-line extrapolations, reliance on subjective inter-
pretation by the specially gifted—where have we seen this kind of reliance on
nied_c03.qxd 1/24/03 2:10 PM Page 101

102 Practical Speculation
authority and glittering generality before? In the techniques of propaganda. In
Chapter 2, we examined propaganda and advertising techniques in
an attempt to explain the persistence of popular misconceptions
about the relation of earnings and stock market returns. These same
techniques may be discerned in the successful persuasion of the
public to buy technical analysis software, books, and seminars. Each of the
seven basic propaganda techniques enumerated in the Institute for Propaganda
Analysis’ classic text, The Fine Art of Propaganda, has an application in the field
of technical analysis:
Name calling: Those who do not subscribe to technical analysis are deni-
grated and ridiculed. Vic found himself the subject of this in 2001
after he gave an interview to the magazine Technical Analysis of Stocksand Commodities.22 The TurtleTrader, a leading trend-following tech-
nical analysis Web site, ran a post emphasizing Vic’s massive trading
losses in 1997 (trading short-term strategies against the trend).
“Here’s a guy who blew up his own trading account in a spectacular
fashion, and he’s knocking systematic trend-following?”
Testimonial: The TurtleTrader also remarked: “To accept any of what
Niederhoffer says is to ignore the existence of Bill Dunn, Jerry Parker,
Richard Dennis, John W. Henry, and all of the many Turtles.” (It
might be fair to note here that Richard Dennis, founder of the Turtles,
has authored his own share of losses and has closed funds amid mas-
sive drawdowns and liquidations.)
Glittering generality: The need for technical analysis is presented in a for-
mulation so general that it cannot be pinned down. The pioneering
technical analyst Charles Dow, originator of the Dow Theory
and the Dow Jones Industrial Average, gave a beautiful ex-
ample of this technique: “The market reduces to a bloodless
verdict all knowledge bearing on finance, both domestic and
foreign. . . . Price movements, therefore, represent everything every-
body knows, hopes, believes and anticipates. Hence, there is no need
to supplement the price movements.” With untestable statements
like that, it would be very hard for a man from Mars to distinguish
the level of knowledge in the field of technical analysis as we begin
the twenty-first century from that existing at the beginning of the
twentieth.
It is hardly surprising that Dow’s quote is featured on the home
page of the main selling document of perhaps the most respected
technical analyst in the world. This analyst’s system of reading
nied_c03.qxd 1/24/03 2:10 PM Page 102
Chapter 3 • The Hydra Heads of Technical Analysis 103
money flows was featured exclusively on the financial information
service where Laurel was an editor. Her bosses mandated daily cover-
age of its readings. In 1999, however, at Vic’s suggestion, Laurel
asked her reporters to obtain the technician’s actual results. A mo-
ment of truth occurred when an office researcher at the firm called
back after a few days and said there were no data to support the valid-
ity or predictability of the technique espoused. The researcher
pointed out that the analyst had bought winning stocks over the pre-
vious several years of the bull market, and said that the record spoke
for itself.
Transfer: In the nonfinancial world, individuals and groups often use re-
ligious or patriotic symbols, such as the cross or the flag, to cloak
themselves with an air of virtue. Technical analysts have put this to
good use. The very name “technical analysis” carries an aura of sci-
ence. Perhaps because interpretation is so subjective, the field also
carries a whiff of magic; one of the most well-known books on tech-
nical analysis is called Market Wizards. All financial Web sites, maga-
zines, and television programs like to have a technical analyst in their
stable of pundits to achieve “balance,” thereby conferring an air of
authority to the analysts. Many technical analysts invoke the names
of George Soros and Warren Buffett, contending that the success of
these legends is the result of a trend-following strategy related to
technical analysis rather than the fruit of leveraged tax-sheltered buy-
and-hold investments in a wide range of growing American busi-
nesses during a bull market.
One of the best uses of transfer we have seen appears in Trad-ing Chaos: Applying Expert Techniques to Maximize Your Profits.23 Au-
thor Bill Williams references Einstein when discussing his
Market Facilitation Index: “Comparing this to Einstein’s formula
E = mc2, we can solve for the constant c2 by transposing the m
(mass) c2 = E/m = Range/Volume.”
Card stacking: In technical analysis, examples to prove a point are chosen
retrospectively and selectively. The market is rich enough to provide
examples to both prove and disprove the validity of any chart pattern.
Bandwagon: One of the more prominent Web sites selling instruction in
technical analysis (“Just $999”) lists traders who supposedly use
methods similar to the ones of the course.
Plain folks: “Hey, I’m just a regular Jane or Joe, but I got rich by learning
how to connect the dots and draw a trend line. You, too, can make big
money in the market.”
nied_c03.qxd 1/24/03 2:10 PM Page 103

104 Practical Speculation
Some of the earmarks of pseudoscience apply here as well.
Robert L. Park, a physics professor at the University of Maryland,
compiled this list in a book called Voodoo Science: From Foolishnessto Fraud:
1. A discovery is pitched directly to the media.
2. A powerful “establishment” is said to be suppressing the discovery.
3. An effect is always at the very limit of detection.
4. Evidence for a discovery is anecdotal.
5. A belief is said to be credible because it has endured for centuries.
6. An important discovery is made in isolation.
7. New laws of nature are proposed to explain an incredible ob-
servation.24
Investors who are susceptible to the lure of propaganda and pseudo-
science may be disinclined to ask for scientific proof. Indeed, whenever we
have tried in our columns to provide a fair test of whether trend following
works, we have been greeted with vitriol. That is guaranteed to happen when
members of a cult are exposed to views that threaten their belief system. We
often publish examples of this hate mail in our column, to indicate the resist-
ance toward questioning the roots of the beliefs. A couple of samples:
I think it is horrible you are telling people to not use a system that could help
them save or make money just because you do not know how to use it (and prob-
ably are too lazy to take the time to really learn how to use it).
I’m so glad there are shortsighted, uneducated people like yourselves that write
such nonsense. Keep up the bad work . . . it just makes it easier for me to make
money from all of the “fundamentalists” who will never make a dime in the mar-
ket. No reply required.
That’s why you went broke. You belong in jail.
At least we are with distinguished company in being vilified for our views
on momentum. Amos Tversky, the father of research in cognitive biases, col-
laborated on many studies with Gilovich, the Cornell professor who con-
cluded that hot streaks in basketball are a myth. Tversky said that he lost more
friends from his studies than he could count. At least Tversky’s collaborator,
Kahneman, was compensated for losing all these friends. He won the Nobel
Prize for economics in 2002 for his demonstration that these streaks are
mere random variations.
We are consoled every now and then when we get a positive letter:
nied_c03.qxd 1/24/03 2:10 PM Page 104

Chapter 3 • The Hydra Heads of Technical Analysis 105
I’ve been following your contrarian methods and recently formed a hedge fund to
implement them. Suffice it to say my results and the anti-trend-following systems
that you led me to are making me, my family, and my investors very happy.
We are not alone in concluding that the virtue ascribed to technical analy-
sis is a chimera. Those who have studied the subject with a reasonable degree
of objectivity are fairly unanimous in concluding that many of the conven-
tional techniques of technical prediction are not of great merit. Here is what
Zvi Bodie has to say in the classic textbook, Essentials of Investments: “It should
be abundantly clear from our presentations that most of technical analysis is
based on ideas totally at odds with the efficient market hypothesis.”25 While
markets are not completely efficient, they’re pretty close, so any method that
purports to find inefficiencies had better be good.
Why Does the Myth Persist?
Beyond the psychological biases and propaganda, the persistence of belief in
technical analysis techniques is unsurprising, given the size of the industry
that has sprung up around it. If the premises of technical analysis were sub-
jected to testing, what would be the prognosis for all the seminars, courses,
trade fairs, software, analysts, hardware, societies, news programs, support
services, and staff that provide trend-following systems, not to mention those
involved in marketing and evaluating the systems? Technical analysis practi-
tioners are not anxious for a new paradigm that threatens their livelihood,
even if their own paradigm does not jibe with the facts.
We are reminded of the centuries-long success of the Delphic oracle. The
priesthood no doubt benefited to no small degree from a vast network of spies
who gathered intelligence on fleet building, military preparations, and the po-
tential for new colonies. But the most important reason for Delphi’s long suc-
cess was surely that the predictions were just ambiguous enough to keep
people coming back for more.
A Technical Approach That Can Be Tested
The question arises: Don’t you do anything but knock things down? Is there
an indicator that you do have hope for? If there is some predictive value to a
chart, then the numbers that create the charts will contain that information.
Science has always proceeded by trying to quantify rather than by relying on
nied_c03.qxd 1/24/03 2:10 PM Page 105

106 Practical Speculation
visual impressions and anecdotes. We do believe that prices
contain predictive significance. But we prefer to work with
the highs, lows, opens, and closes of the daily prices that go
into the charts.
The approach we take is based on a test-taking method pioneered by our
friend Adam Robinson, cofounder of the Princeton Review. It involves putting
yourself in the mind of the people who write questions for the Educational
Testing Service’s college entrance exams. The tests always begin with easy
questions where the obvious answers are correct and proceed to tricky ones,
where the obvious answers are wrong (but close to the right answer).
The way to handle those tricky questions is to avoid the obvious re-
sponse. The way to make money in stocks is to do the opposite of what seems
obvious—and recently profitable. (For example, if selling the rallies works
three days in a row, then it probably won’t work the fourth day. And if a tested
system fails to work one day, it probably will the next day.)
It is at least as hard to make money in the markets as it is to score high on
the SAT or the GMAT. But instead of throwing you hard questions toward the
end of an exam, the market likes to throw you tricky moves when you are off
guard, in hopes that you will give the wrong answer and thereby contribute
toward your broker’s Porsches, profit-sharing plans, and well-appointed din-
ing rooms.
On a long-term basis, the market loves to throw in a nice 10 percent rally
when the gloom is greatest. That a rally was coming always seems obvious
after the fact.
On a day-to-day basis, the market likes to throw out trick questions that will
make monkeys out of people who rely on visual impressions of charts. Take, for
example, the 80 times during the six-year period ending December 31, 2000,
that S&P 500 futures have gone up 20 or more points, or about a 2 percent rise.
(We use futures in all our calculations because they represent prices that you
can actually trade at and make or lose money, while the slow-moving index
often lags behind the real price moves.)
On days after big rallies, wise-guy traders like to set up for a decline be-
cause the market has a slight tendency to retreat on those days. What the mar-
ket likes to do on such occasions is to give those traders an easy profit the first
time. Next time, they will go short and the market will stick it to them.
The Princeton Review technique that we use in our own trading involves
the quantification of some 1,700 separate answers to questions posed by the
market. Before making a trade, we like to measure the accuracy or profitabil-
ity of each of these 1,700 answers to the questions that are most similar to
what the market is asking today. We take account of the uncertainty of the
nied_c03.qxd 1/24/03 2:10 PM Page 106

Chapter 3 • The Hydra Heads of Technical Analysis 107
results in each case and the ideal position relative to today’s range to place
entry and exit orders.
This approach uses standard technical data only. Thus, in essence, we
have devoured the Hydra.
Doubtless many other practitioners of technical analysis are using similar
methods. We hope that others will modify their visual and nonquantitative
techniques, to come into line with scientific procedure.
Testing the VIX Indicator
Now that we have described an approach to technical analysis in line
with the scientific method that has been so effective in advancing knowledge
in every other field, we can apply it to our own favorite indicator, the
Chicago Board Options Exchange’s Volatility Index, commonly referred to
as the VIX.
People forget that the market can go up when it has been declining for a
while, just as they forget it can fall after a prolonged rise. These swings in opti-
mism are among the most notable regularities in the market. Sentiment indi-
cators—the degree of bullishness and risk in options, the percentage of bullish
advisors, the percentage of advancing stocks, and the percentage of cash held by
mutual funds—swing back and forth from high to low like pendulums. The big
question is whether these changes in sentiment have any predictive power vis-
à-vis future moves in the general market.
As everyone knows, it is always darkest before the dawn. There is no mea-
sure for “darkest,” but the signals provided by the VIX are among the best we
have found. The index provides a measure of the expected level of volatility in
the market.
The normal level for the VIX is about 25. A good working hypothesis is
that when volatility is high—above 30 percent or so—investors tend to be
frightened, and it is a good time to buy. When volatility is low—below 25 per-
cent or so—investors tend to be complacent, and it is a good time to sell.
“When fortune means to men most good, she looks upon them with a threat-
ening eye,” as William Shakespeare wrote in King John, Act 3, Scene 4.
The VIX is calculated based on the coming month. As a practical matter,
however, expected volatility for periods up to a year correlates almost 100 per-
cent with the changes in one-month VIX.
We tested the VIX hypothesis by calculating the return on buying S&P
500 futures the first time the VIX closed above 30 and selling them the first
time the VIX closed below 25. Similar results could be obtained by buying an
nied_c03.qxd 1/24/03 2:10 PM Page 107

108 Practical Speculation
index-tracking mutual fund such as the Vanguard 500 Trust, or by purchas-
ing SPDRs Trust shares (spiders).
Figure 3.5 shows that using a 25–30 VIX system to swing from buy to sell
yields an average profit of 3.4 percent on 12 trades since October 1997. There
were two small losses.
David Simon and Roy A. Wiggins III came to similar conclusions sepa-
rately in a rigorous study, “S&P Futures Returns and Contrary Sentiment In-
dicators.”26
The professors looked at the effect on S&P 500 futures of each percent-
age point change in the VIX. They concluded that for each point increase
above the norm, the S&P goes up an extra 0.1 percent in the next 10 trading
days. Thus, given a normal VIX reading of 25, if VIX goes up to 35—10 per-
centage points above the norm—the S&P can be expected to rise 1 percent
extra in the next 10 days. Conversely, when the VIX falls to 15 percent, the
S&P can be expected to perform 1 percent worse than its normal move.
Simon and Wiggins also show what happens when the VIX is at high lev-
els and at low levels. Most impressive of all, they run what is called an “out-of-
sample test.” They demonstrate that with information available at the
beginning of each year, a forecaster could make a useful prediction. For ex-
ample, based on VIX levels, they came up with 39 forecasts that S&P futures
would go up in the next 10 days. In actuality, 22 of them went up and the av-
erage change was exactly as predicted: up 1 percent. Similar results occurred
for the occasions when the market was predicted to go up by 3 percent.
Professors Simon and Wiggins are not the usual run of academics who
obscure their results with impenetrable mathematics and statistics so that the
results are meaningful only to a handful of finance PhDs. Perhaps the reason
is that Simon, who teaches at Bentley College in Waltham, Massachusetts,
has an unusual background for a professor. He actually worked for a hedge
fund before going to academia, rather than the much more common reverse
situation. The professor is not averse to a bit of trading of his own, and he is
active in individual stock options. Furthermore, Bentley College has a trading
floor equipped with dozens of workstations and live feeds from all the major
data providers that most traders would envy. The students use these machines
to answer realistic trading questions that they are assigned in class.
An indicator like VIX might have validity because expected volatilities are
related to the returns that investors demand. When VIX registers high anxiety
and uncertainty in the market, investors naturally demand a higher rate of re-
turn to compensate them for the extra risk they perceive. Put another way,
they will only buy if the price is low enough.
nied_c03.qxd 1/24/03 2:10 PM Page 108

109
Figure 3.5 Swing System
Date VIXBuy S&P
500Sell S&P
500 Chg.
Duration ofTrade(Days)
Oct. 27, 1997 39.96 876.99Dec. 1, 1997 24.88 974.77 11.10% 35Dec. 24, 1997 30.47 932.7Dec. 30, 1997 24.93 970.84 4.10% 6Jan. 9, 1998 34.46 927.69 Jan. 14, 1998 24.21 927.94 0.00% 5Aug. 4, 1998 33.1 1,072.12Nov. 5, 1998 24.8 1,133.85 5.80% 93Dec. 14, 1998 32.47 1,141.20Dec. 18, 1998 24.66 1,188.03 4.10% 4Jan. 13, 1999 31.26 1,234.40 Mar. 8, 1999 24.98 1,282.73 3.90% 54Sept. 23, 1999 30.28 1,280.41Oct. 6, 1999 23.53 1,325.40 3.50% 13Oct. 15, 1999 31.48 1,247.41Oct. 21, 1999 24.77 1,283.61 2.90% 6April 5, 2000 30.59 1,487.37June 1, 2000 24.74 1,448.81 -2.60% 57Oct. 11, 2000 30.95 1,364.59Jan. 23, 2001 23.86 1,360.00 -0.30% 104Feb. 28, 2001 31 1239May 18, 2001 24.26 1,291.96 4.30% 79Sept. 6, 2001 32.48 1,103.50Nov. 23, 2001 24.78 1,153.00 4.50% 78June 20, 2002 32.5 1,007.10 N/A* N/A* N/A*
Average Return/Trade 3.40%StandardDeviation 3.40%Average Duration of Trade (Days) 44.5
VIX Swing System
Swing System Results
*At time of writing, VIX was still above 25.
10 wins in 12 trades
nied_c03.qxd 1/24/03 2:10 PM Page 109

110 Practical Speculation
This link between risk and expected return is central to the modern the-
ory of finance. The lower the expected risk, the lower the return required by
investors; and the higher the expected risk, the higher the required return.
All portfolio analysis, all Nobel Prizes given in the field, all students in busi-
ness school, all analysts taking exams, are taught and understand and accept
this relation. Corporations use it to determine which investments to accept,
and regulators use it to determine how much to let regulated companies
charge. Underwriters use it to determine the pricing of new and secondary
securities.
It is therefore not surprising that when market risk is perceived to be high,
subsequent returns are indeed high. That is exactly what a high level of VIX in-
dicates: a higher-than-average expected volatility for stocks during coming
months. Similarly, it is not surprising that when the level of VIX is low—that is,
the expected future risk of the market is perceived to be low—subsequent re-
turns from holding the stock market would turn out to be low.
While a 3.4 percent-per-trade return may not seem much, bear in mind
that it’s a multiple of the money market rates currently being paid for an en-
tire year.
Conclusion
We are under no illusion that our suggested recasting of technical analysis to
bring it into conformity with the scientific method will convince many techni-
cal analysts to change their ways. Nor do we think our workout showing the
theoretical and empirical utility of our own favorite indicator, the VIX, has
much chance of setting the world of technical analysts on fire. That is fine with
us. Not only does it make the game more interesting, but it will lengthen the
time that it takes for our approach and favorite indicator to become worthless.
No doubt certain technical indicators, under certain vague interpreta-
tions, work for certain selective periods. That is, in fact, guaranteed to happen.
But overall, the outcome has not been fruitful to the technical analysts. For
just when they are ready to throw the greatest amount of
money at a system they believe has worked the best in the past,
the system will lose the most in subsequent periods.
A good indirect indicator of the ever-changing cycles in technical analy-
sis is the marketing of technical trading systems. Such tools and techniques
typically are marketed as being the very ones used by the greatest technical
traders of all time. Such systems start off being offered to a handful of
nied_c03.qxd 1/24/03 2:10 PM Page 110

Chapter 3 • The Hydra Heads of Technical Analysis 111
specially picked wealthy investors for tens of thousands of dollars. Next, they
are offered to those wealthy enough to spend their time attending a seminar,
where the developer or a disciple explains the method. In the final stage of
the life cycle, these systems are offered in the back pages of technical analy-
sis magazines and books at prices ranging from $2 to $200. Only in Amer-
ica do firms exist that specialize in wholesaling beaten-down trading
systems.
All of which tends to support another rule included in that massive com-
pendium, Investing Rules:
• See what the trend followers are doing, and do the opposite.
Need we add that this one was from us?
Epilogue: Ode to the Hydra of Trin
Dr. Brett Steenbarger, the behavioral finance expert we introduced in Chapter
2, was an ardent devotee of many of the techniques of technical analysis be-
fore he met us. The mutual experimenting and reporting that he and Vic have
each undertaken since then have increased Steenbarger’s skepticism about
technical analysis to a large extent. He has memorialized the conversion pro-
cess and his current thinking with particular reference to material in this
chapter as follows:
Of Heroes and Hydras
Gather ‘round, ye Speculators, and I shall tell you a tale of heroes and hydras, and
that fiercest Hydra of all: the Hydra of TRIN. She was said to possess nine heads
of poison, the middle one immortal. A single bite from a single head was enough
to fell any hero.
I was but a young lad, filled with the enthusiasm of battle, when I set forth to
vanquish the monsters. Many complex strategies had I devised to party with the
likes of Cerberus, Medusa and, of course, the Hydra of TRIN. Indeed, my strate-
gies were so complex that I believed myself to be beyond defeat.
On my sojourn, however, I came across a teacher who questioned my ways.
He was a wise but strange man, speaking portentously of music and games of
skill. He warned me that my intricate battle plans would come to naught against
these fierce monsters. “Always take the direct approach,” he counseled. “Indirec-
tion is the quickest path to ruin.”
nied_c03.qxd 1/24/03 2:10 PM Page 111

112 Practical Speculation
I would have none of it. “Is it not written,” I asked, “that Medusa cannot be
approached directly, lest the hero be turned to stone?”
“Ah, yes,” the teacher smiled. “It is so. But did not Theseus take a direct path
nonetheless? He could not go after a different monster to conquer Medusa. He
had to go to her lair and seek her out with no intermediary.”
The teacher’s words made sense to me, and I vowed to make direct warfare
upon the Hydra of TRIN.
She was gruesome in appearance, filling me with fright and awe. Her heads
bobbed and weaved, dropping poison on the ground around her. Nothing could
grow in that ground. I found myself in a true wasteland. Around her serpentine
body lay the skeletons of heroes before me, who had proven inadequate to their
task. I prayed that I not meet their ignominious fate.
With my heart steeled, I approached the Hydra of TRIN with my mighty club
and gave a ferocious swing. So vicious was my blow that one of the heads—the
five-day TRIN—was severed from the body. Before I could rejoice, however, an-
other head sprang in its place: the 55-day TRIN. Furiously, I struck another blow.
This head, too, fell from the neck only to be replaced by the Open TRIN.
In the interim, the other heads swooped closer and closer to my body, snap-
ping their jaws and dripping their venom. I realized that I had to act fast or face a
painful death.
With a wide arc, I swung my club and severed two heads. But, alas, the Eli-
ades TRIN and the Bretz new TRIN replaced these.
The venomous heads swung lower, nipping the edge of my robes. I realized
in that moment that Death was upon me.
In anguish, I called out to the spirit of my teacher. To my amazement, his
words filled my ears, as surely as if he were standing barefoot beside me. “Take
the direct approach,” he intoned. “There is power in simplicity.”
“But what will vanquish the Hydra of TRIN?” I cried in desperation.
“Remember, my pupil,” the words came to me. “Volume is a proxy for
volatility. The TRIN measures volatility as a function of price rises and declines.
There is nothing in the ratio that cannot be derived from a direct investigation of
price change and volatility.”
With that, a brilliant torch appeared in my hands. My confidence renewed
and my resolve strengthened, I held the eight heads at bay with the torch, searing
them before they could grow back. The center head thus exposed, I chopped it at
the root with my sword, burying it forever in the ground where it could menace
heroes no more.
I am an old man now, and have fought many a battle. But no lesson shines so
brightly as the one I learned from my teacher that day. I say to you now, valiant
speculators and heroes: “Listen to the words of my teacher. In the midst of dark-
ness, always take the straight, illumined path. The torch of wisdom is mightier
than any warrior’s club.”
nied_c03.qxd 1/24/03 2:10 PM Page 112

Chapter 3 • The Hydra Heads of Technical Analysis 113
All in all, our battle with the market momentum Hydra shows her to be a
myth. We hope that this chapter will help illuminate the murky caverns of the
mind where the Hydra dwells. Furthermore, we hope our approach will allow
readers to reflect on and build beliefs about market momentum that are
closer to science than superstition. There is an infinite poetry and beauty to
market moves, with inexhaustible wealth awaiting those who can unravel the
future course of movement.
nied_c03.qxd 1/24/03 2:10 PM Page 113

nied_c03.qxd 1/24/03 2:10 PM Page 114

115
4 T H E C U L T O FT H E B E A R
This will all end badly, we’ve not the slightest doubt,
and the only question is when. Probably not tomorrow, as we
say. But that’s as far out as we’ll go.
—Alan Abelson, “Up and Down Wall Street,” Barron’s, May 24, 1993(Dow Jones Industrial Average at 3492)
When we see a man who persists in wearing galoshes on his feet, mit-
tens on his hands, a heavy wool jacket on his back, and a ski cap on
his head on a warm summer day, we know that we are witnessing someone
who has succumbed to false beliefs. The man must have believed that it was
going to be very cold and wet outside, and he was wrong. If we were trained psy-
chologists, we might attribute the behavior to a dysfunction in separating real-
ity from belief. Very young children have a similar problem in differentiating
between the two. By the age of 10 or 11, they usually can identify fantasy, and ex-
cept for autistic children, they behave in a manner consistent with reality.
It is amazing to see an adult who has not only maintained a false belief
for his entire working life, but has also consistently ridiculed others who do
nied_c04.qxd 1/24/03 10:33 AM Page 115

116 Practical Speculation
not share his beliefs. Such an adult still sits in the catbird seat at one of the
world’s most prestigious financial publications—a news magazine that, ac-
cording to its marketing materials, circulates among hundreds of thousands
of the world’s wealthiest and most influential decision makers.
The man is Alan Abelson, author of the weekly Barron’s column, “Up
and Down Wall Street,” for the past 36 years. Abelson’s irreverence toward
the most powerful figures in politics and finance, his facility with words,
and his puns have earned him a reputation as the wittiest writer about Wall
Street. No one, be he the chairman of the Federal Reserve or a U.S. presi-
dent of either party, is safe from his sardonic pen. Circulation doubled in his
first year of writing the column, and kept growing. Today, the paid circula-
tion of Barron’s is 300,000, and the average household net worth of its read-
ers is $1.2 million.
From the start, Abelson played a dual role as editor-columnist at the pub-
lication that gave him far more than the usual power for a columnist. In 1998,
he received a Lifetime Achievement Award from the Loeb Foundation, ar-
guably the most important organization in financial journalism. While he no
longer serves as editor, he commands speaking fees of $10,000.
Skepticism, Science, and Self-Esteem: A Multitrillion-DollarCase Study
Though he is a clever and talented writer, by any objective standard Abelson
has the distinction of being one of the worst market forecasters in history. He
has been skeptical, if not outright bearish, on the stock market for his entire
tenure as a Barron’s columnist. Yet during this period, the Dow Jones Indus-
trial Average and S&P 500 gained some 3600 percent, with reinvested divi-
dends, perhaps the greatest accumulation of wealth in history. On January
21, 1966, the Friday before Abelson’s first column appeared, the Dow closed
at 988.14. Thirty-four years later, on January 14, 2000, the average reached a
high of 11,722.98.
The key to a happy, successful life is to be humble about one’s knowledge
and open enough to admit the possibility of change and to adjust our thinking
when facts contradict our beliefs. In the market, it means a determination to
keep up with new ideas and academic theories that influence the practitioners
and to have a procedure for judging and testing the work of others before tout-
ing it to us.
nied_c04.qxd 1/24/03 10:33 AM Page 116

Chapter 4 • The Cult of the Bear 117
We all know people who do not rely on logic, who cling defiantly to biases
and errors in thinking in the face of incontrovertible evidence to the contrary.
The tendency to hold onto manifestly illogical beliefs is the subject of an en-
tire line of study in psychology. One of the great contributions of the psychol-
ogist Leon Festinger was the theory of cognitive dissonance. Festinger
cataloged rationalization techniques that people use to preserve their self-
esteem when facts run afoul of their beliefs. The theory was developed as a re-
sult of Festinger’s famous study of a doomsday cult, recounted in his 1956
book, When Prophecy Fails.1
With two colleagues, Festinger infiltrated a small group of believers led
by Marian Keech, a Midwest woman who claimed to be hearing messages
from outer space. Keech believed that a flood would destroy the world, but
that flying saucers would take her and her followers safely to the planet Clar-
ion before the devastation began.
Keech’s adherents quit their jobs and shed their money, houses, posses-
sions, and, in some cases, their spouses to await the day of rescue. One evening,
Keech heard from Clarion that the saucers would come at the stroke of midnight
on December 21. On the evening of December 20, her followers gathered in
Keech’s living room. The moment passed in utter silence. No one knew what to
do. At last, at 4:45 A.M., Keech’s face lit up. She said she had just heard from
Clarion that the world had been saved by the faith of the little band of believers.
Until then, the group had shunned publicity and not sought new recruits.
Now, they called up the media and handed out leaflets on street corners that
described how they had saved the world through their purity, prayers, and
steadfast faith.
When facts and belief come into obvious dissonance, the logical response
is to adjust the beliefs. Whether the dissonance occurs in a doomsday cult or
in a corporate boardroom or a trading room, self-esteem often gets in the way,
and the adjustment does not always occur. For Marian Keech and her follow-
ers, the unresolved inner conflict was so great that mere rationalization could
not ease the discomfort; affirmation from others was required to allay the
shame of having acted foolishly.
Undercover research is frowned on today, and since Festinger’s study, re-
search into cognitive dissonance, groupthink, and similar irrational phenom-
ena has consisted mainly of Monday-morning quarterbacking of past events
and contrived experiments involving college students. The remarkable thing
about Abelson’s columns is that they provide a real-world case study of cogni-
tive dissonance involving trillions of dollars of lost wealth and the reputations
of powerful securities firms.
nied_c04.qxd 1/24/03 10:33 AM Page 117

118 Practical Speculation
As Festinger noted, the attempt to maintain consistency in one’s beliefs
and self-esteem gives rise to maladaptive behavior. When you have gone far
out on a limb and so many people have followed you, and there is much “sunk
cost,” as economists would say, it is difficult to admit you have been wrong.
That is exactly why the scientific method was developed: so that people, be
they scientists, traders, doomsday cult leaders, or leading financial colum-
nists, could adjust their beliefs based on constant feedback between hypothe-
ses and evidence.
The scientific method involves experiment and observation.
Its essence is a humble attitude toward one’s state of knowledge.
There are as many ways of doing science as there are scientists,
but everybody agrees that it involves four elements:
Induction: Forming a hypothesis—a testable statement.
Deduction: Making specific predictions based on the hypothesis.
Observation: Gathering data.
Verification: Testing the predictions against the data.
Throughout the 1990s, while the Dow and S&P 500 quintupled and the
Nasdaq enjoyed a ninefold gain, Abelson predicted an imminent crash based
on one or more of the following: overextended prices; high price/earnings
ratios; weak pessimism; weak bullishness; strong bullishness; high interest
rates; inflation resulting from low interest rates; a weak dollar; fiscal extrav-
agance; low dividend yields; the weakness of the Fed; Clinton’s fiscal extrav-
agance; the narrowness of the market’s advance; the percentage of stocks
below their 52-week highs; market capitalization as a percentage of GDP;
the growing number of chartered financial analysts; the oversupply of new
equity; a shortage of stocks to meet the demand of mutual funds; the pres-
ence of the “little guy” in the market; the generous salaries paid to nannies
in Greenwich, Connecticut; an indoor skating rink in a Hamptons home;
similarities to conditions prevailing before past crashes; trouble overseas;
the imminence of recession; the imminence of recovery; debt reduction;
the inability of companies to raise prices; and Abelson’s favorite, specula-
tive excess.
The adjustment of beliefs afforded by the scientific method
surely was not taking place.
The market’s major decline in the new century made Abelson’s
ideas finally appear relevant. This does not chasten us in the least. Investors
who followed the columnist’s advice during the many years he was wrong
would have long ago lost all their chips.
nied_c04.qxd 1/24/03 10:33 AM Page 118

Chapter 4 • The Cult of the Bear 119
The Critic’s Story
In a July 25, 2001, interview, Abelson told Laurel that he approached the mar-
ket as a skeptic. “That’s the contribution I think I’ve made to financial journal-
ism,” he said. “You’re supposed to bring a critical presence to the field.”
Without in any way minimizing the importance of skepticism to the field of fi-
nancial journalism, or Abelson’s own laudable contributions to the field, we
would draw a line between skepticism and unrelenting gloom in the sunshine.
Laurel interviewed Abelson at Barron’s offices in the World Financial
Center in lower Manhattan. Barely two months later, terrorist attacks de-
stroyed the neighboring World Trade Center, forcing Barron’s and its parent
company, Dow Jones & Company, to abandon 200 Liberty Street for New
Jersey. On the day of the interview, lower Manhattan really did look like the
center of the financial world. The harbor was full of private yachts, and the
mirrored buildings reflected the July sun.
Abelson was waiting at the elevator doors to lead the way to his office. A
short, trim man, he wore tan slacks and a blue-and-white shirt with a bright
plaid tie. His office was not particularly large, but it was private and it had a
river view. A four-shelf bookcase lined one wall. Two computer terminals sat on
the desk. A few cactus plants provided the only greenery. Laurel and Abelson
sat at a small table.
Abelson had not contemplated a career as a financial journalist, he said.
Born October 12, 1925, in New York City, he graduated from Townsend Har-
ris High School, then earned a dual degree in English and chemistry from
New York City College. He earned a master’s degree in creative writing at the
renowned University of Iowa Writers’ Workshop.
Back in New York, he took a job as copy boy at Hearst’s New York JournalAmerican, one of the city’s several now-extinct afternoon papers. He became a
reporter in the business section, and in 1956 went to work as a jack-of-all-
trades at Barron’s.His first job at Barron’s was editing investment stories, “which was inter-
esting because I didn’t know anything about investing.” To learn, he read a
manual on markets from cover to cover. The rest of his market knowledge
came through interviewing sources and from perusing Securities and Ex-
change Commission filings in the fray of reporting.
He began developing a style of reporting—tough-minded, skeptical—
modeled on nonfinancial journalism. “Until the 1960s, nobody ever wrote
anything critical of the stock market,” he recalled. Press releases and the
speeches of corporate chairman were summarized unquestioningly. The best
nied_c04.qxd 1/24/03 10:33 AM Page 119

120 Practical Speculation
writing—Ida Tarbell’s exposé of John D. Rockefeller’s Standard Oil Trust, for
example—had been done by generalists, not financial journalists.
“There’s so much bullishness in Wall Street,” he said. “Brokerage houses
turn out tons of material, companies issue press releases—that’s all bullish. I
don’t think sounding a skeptical note is threatening the life of the republic;
I think that’s what journalists are supposed to do.”
In 1966, then-editor Robert Bleiberg asked Abelson to write a column.
Speculation was rampant. The market was filled with colorful characters. It
seemed to Abelson that the period had been created especially for him to
write about.
Nevertheless, he said he took the job reluctantly. “The column was always
a sideline,” he said. “I was assistant managing editor, I was running several
departments. Those were my priorities. We always had a very thin staff.”
Laurel noticed two copies of Peter Bernstein’s Against the Gods: The Re-markable Story of Risk, one of the finest histories of statistics available, on
Abelson’s shelf.2 She remarked on them to Abelson, and asked if he had stud-
ied statistics. The answer was no. “Statistics can really be the undoing of a
journalist,” he said. “They’re too fascinating, like crossword puzzles. People
are always making statistical comparisons—in the end, they don’t add up to
anything.” He does not, he added, read financial books.
Neither does he own stocks, to avoid conflict-of-interest accusations in
lawsuits, an occupational hazard for business journalists. Fortunately, Dow
Jones had a generous profit-sharing plan for the greater part of his tenure.
Laurel asked him if he had indeed been bearish all through the bull mar-
ket. “Some people think I’ve been bearish all my life,” he replied.
Had he ever had doubts about what he had written or felt embarrassed by
his calls?
“How can you be right all the time?” he said, with the magnanimous hu-
mility of someone who had been wrong almost all the time. “I’ve never been
in doubt, or I wouldn’t have written it. I can’t say I’ve ever been embarrassed
by anything at all.”
It is worth noting that a number of writers besides Abelson have been
bearish for decades. But most of them have been relegated to the world of
newsletters of the hard-money persuasion, the kind sold on late-night televi-
sion and by direct mail. They require unusual promotion because they have
been so wrong, and most sensible people ignore them. Howard Ruff, with his
1970s-era forecast for $1,000-an-ounce gold, comes to mind. (As we write,
gold is at $350, down from $850 in January 1980.)
The unusual thing about Abelson’s columns is that they appear at the
front of arguably the most credible financial publication of all. It is as though
nied_c04.qxd 1/24/03 10:33 AM Page 120

Chapter 4 • The Cult of the Bear 121
the American Medical Association or the New England Journal of Medicine told
us to not to go outside because the air pollutants would cause suffocation. As
Carl Hovland and Herbert Kelman have shown, people change their re-
sponses much more in response to high-credibility sources than low-
credibility sources.3 As we tried to understand Abelson’s enduring
influence, our research on cognitive dissonance led us to other in-
sights from social psychology, and to the literature on cults.
Comfort and Fear
One similarity is that both cults and financial writing like Abelson’s play to the
human need for certainty, control, and simplicity in a complicated world. The
price/earnings ratios and naïve measures of length and breadth cited as rea-
sons for bearishness by Abelson and his sources over a decade are readily avail-
able to the technologically unsophisticated investor, and thus provide illusory
comfort. Statistical testing, by contrast, requires knowledge and effort, and oc-
casionally—if not usually—rejecting hypotheses that are disproven by the facts.
A further parallel is the reliance on fear. Cults rely on a mix of positive
and negative controls, but to keep followers in line, negative emotions domi-
nate. David Koresh, leader of the Branch Davidians, “was always putting
things in the negative, always threatening,” one cult member told Flo Conway
and Jim Siegelman, authors of the 1995 book Snapping.4 “He would describe
hell and start screaming in the most horrible way to show people what it was
like to burn in hell.”
A recurring theme in Abelson’s columns is the appeal to fear. Over and
over, without regard to changing conditions, he conjures up the horrible ca-
tastrophe of 1929, when people jumped out windows and ruination came to
those who speculated. After rallies followed the severe declines of 1973–1974,
1987, 1997, and 1998, you would think that common sense would indicate a
suspension of calamitous predictions, but no.
Psychologists have shown that an emphasis on fear provides a powerful
incentive for change. Driver education films are more effective when they
show the blood and broken bones of accident victims than when they display
a controlled crash with plastic dummies, according to a well-known study by
Ronald W. Rogers and C. Ronald Mewborn.5 One has to admire the vividness
Abelson brings to the feared prospect of a market disaster.
Vic learned early in his career that people pay a lot more for a negative
forecast than a positive forecast, and they will pay more attention to it. Why?
Most people tend to be optimistic, and it is usually justified in the market. If
nied_c04.qxd 1/24/03 10:33 AM Page 121

122 Practical Speculation
someone predicts disaster, it’s unusual and noteworthy. A more important
question is whether the forecaster’s reasoning is logical. In Abelson’s case, we
must ask: What pursuit could have been more pointless than to write a bearish
column week in, week out, during the entire run of the greatest bull market in
history? We like to visit university bookstores to keep abreast of the latest
books. Often we come across titles so specialized and arcane that we throw up
our hands in disbelief that anyone could devote the necessary time to such a
topic. Vic, for example, spotted a tome in the Williams College bookstore on
the influence of Oriental coin collectors in nineteenth-century Mexico. The late
Senator William Proxmire entertained America by awarding similarly point-
less taxpayer-funded studies the Golden Fleece Award. (One memorable award
went to the Environmental Protection Agency for spending $1.2 million in
1980 to preserve a Trenton, New Jersey, sewer as a historical monument.)
As we perused hundreds of Abelson’s columns, we could not help being
reminded of the coin collectors and the Golden Fleece Awards. Abelson’s ir-
relevance, however, was potentially harmful to any of the hundreds of thou-
sands of Barron’s readers who might actually have traded on his advice—or
who had become so accustomed to seeing him wrong that when the crash did
come, they held tight to their stocks in the belief that Abelson was crying wolf
once more.
Taxonomy of the Oeuvre
In Chapters 2 and 3, we noted how investors are manipulated into
leaning the wrong way by what amounts to promotional propa-
ganda about earnings fallacies and untested folklore about trading
patterns. Tables 4.1 and 4.2 show how the characteristics of propa-
ganda and pseudo-science show up in Abelson’s columns.
One of the beauties of the marketplace is that traders who are wrong in
their views tend to be replaced by those who are right. The wrong traders lose
their money. The accurate traders tend to gain more money and support. A
similar feedback mechanism works in the scientific field. Those who report
correct results find that other scientists extend and confirm them. Those who
report flawed results tend to be discredited. They lose students and funding,
and their articles are not accepted for publication.
Feedback, in fact, is a fundamental law of nature. Standard biology texts
contain many pages devoted to the feedback mechanisms that keep the body’s
systems from getting too far out of order. Feedback is used in almost every
electronic device. It is, for example, the basis of the modern amplifier.
nied_c04.qxd 1/24/03 10:33 AM Page 122

Chapter 4 • The Cult of the Bear 123
No such self-correcting mechanism exists in the field of writing. It is
possible to be wrong for a long time and still maintain one’s cachet and
power. Indeed, the lone wolf, the chronic iconoclast tends to be even more
rare and more newsworthy as others stampede to the other side. Such has
apparently been the case with our hero. His views became very rare, and his
sources tended to retire or wither. Yet he survived and thrived, helped, of
course, by his brilliance, his creativity, his wide swath of nonfinancial
knowledge, his flair, and his rapier wit. When his employees at Barron’smoved on to other careers, they created similar bastions of bearish thought
in major brokerages and newsletters, where they, too, benefited by standing
against the tide.
In short, Abelson was not subject to the normal self-correcting process
that exists in other fields. That is probably the answer to why beliefs that are
not in accord with profitability or survival often are prevalent in nontrading,
non-self-correcting fields.
When we started writing our column together, we decided that we would
try a different tack. Trading is hard. We knew that our forte was not specific
trading suggestions for individual stocks, but rather principles and forces that
affect markets, and predictions of broad market moves based on a scientific
historical approach.
To overcome our limitations, we decided to trade based on our own re-
search. Rather than recommending what readers should do, we gravitated to a
level where we reported what our own research was and how we would trade
Table 4.1 Propaganda Devices and Abelson’s Rhetoric
Propaganda Device Example
Name calling Calls evidence of stocks offering superior returns “blahblah.”
Glittering generality “How can you be right all the time?”
Testimonial, bandwagon Describes his distinguished, invariably bearish sourcesas the most perceptive on Wall Street, “ the smartmoney.”
Testimonial Quotes analysts with bearish forecasts.
Plain folks Does not read any financial books.
Has no interest in statistics.
Card-stacking Relies on indicators as diverse as the strength of thedollar to the salaries of nannies in Greenwich, as longas they offer a bearish forecast.
nied_c04.qxd 1/24/03 10:33 AM Page 123

124 Practical Speculation
based on that. This practice gave us the benefit of a self-correcting process in
that if our trades were good we would prosper, and continue, and if our trades
were bad, we would lose and tend to pull in our horns.
In retrospect, we wish we had given ourselves the luxury of staying in the
ivory tower. On the other hand, the information and knowledge we commu-
nicated would have been less focused, less practical, and less falsifiable had
we not been eating our own cooking.
It seems on the surface that Abelson shares some of the charac-
teristics that people talk about when they’re describing unscientific
and untested thought. Probably the reason is that he’s not subject to
Table 4.2 Why People Believe Alan Abelson
Percent of TimeUsed to Justify
Reason Bearish Forecast
Problem-solving inadequacies: seeking only examples that confirm a hypothesis, slowness to change the hypothesis even when obviously wrong; finding causality in coincident relationships. 100
Appeal to authority. 95
Representativeness (ignoring larger context in which a seemingly unusual event occurs). 90
Hasty generalization; a handful of members (facts) used to judge the entire group (situation). 85
Post hoc, ergo propter hoc: Correlation mistaken for causation. 85
Use of scientific language but not method. 80
Unprovable assertions. 60
Anecdotes used as evidence. 55
Emotive words and false analogies. 50
Reductio ad absurdem: the slippery slope fallacy (eating icecream will lead you to put on weight; soon you will weigh350 pounds and die of heart disease; therefore ice creamleads to death). 35
Bold but unsupported statements. 30
Ad hominem: redirecting focus from thinking about the idea to thinking about the person holding the idea. 30
Rationalization of failures. 25
Circular reasoning. 5
nied_c04.qxd 1/24/03 10:33 AM Page 124

Chapter 4 • The Cult of the Bear 125
the feedback process. On the other hand, he’s been quite correct in the past
few years. While we’ve had our share of good trades and bad trades, certainly
the reader who followed Abelson’s advice since early 2000 would have done
much better than if they had followed ours. We tip our hats to him.
That said, we found some insight in Michael Shermer’s Why People BelieveWeird Things: Pseudoscience, Superstition and Other Confusions of Our Time as to
how Abelson, his sources, and his followers were able to maintain erroneous
beliefs for so long despite so much evidence to the contrary.6
Using the Weird Things classification as a guide, we systematically ana-
lyzed the 525 “Up and Down Wall Street” columns that appeared in Barron’sduring the decade of the 1990s. Table 4.2 provides an estimated breakdown
of the use of illogical reasoning.
Table 4.3 lists highlights of Abelson’s columns during the 1990s, with
notes on how the forecasts turned out. We chose each quote to give a flavor of
the anecdotally inspired predictions, the reliance on discredited authorities,
and the endless repetition of simplistic, untested indicators. Some quotes are
included merely to illustrate Abelson’s general opinion of his subject.
We will not continue with 1998 and 1999, as the Dow rose 50 percent
and the Nasdaq 100 more than tripled, except to mildly observe that Abelson
disapproved of the rise.
But we cannot forgo reprinting at length the wildest hodgepodge
of indicators ever to be found in one column. On September 30,
1996, Abelson, citing Robert Farrell, “Merrill Lynch’s master sage
and our good buddy,” wrote:
[T]he dividend yield on the Standard & Poor’s 500 of 2.1 percent is the lowest of
this century. The value of stocks relative to GDP is the highest ever. The Tobin
Q Ratio (financial assets/corporate balance-sheet assets) is the highest ever. And
so is the ratio of the S&P 500 to book value. Ditto, the SP 500 price-to-sales ratio
of 4.45.
The value of stocks relative to house prices is at peak levels. The number of
hours a working stiff must labor to buy the S&P 500 has risen to a record 53.75.
Trading volume on the New York Stock Exchange is the most ever. The ratio
of Nasdaq to Big Board volume is also at a peak. IPOs, mergers, and stock buy-
backs are all at record highs. There are an unprecedented number of mutual
funds, and the volume of money pouring into them is twice last year’s peak an-
nual rate. As never before, investors are snapping up the shares of aggressive
growth funds.
The number of people registered to sell stocks and bonds is 527,000, the most
in history and 30 percent more than in 1987. There are a record number—32,000—
of candidates to become Chartered Financial Analysts. Seat prices on the NYSE have
nied_c04.qxd 1/24/03 10:33 AM Page 125

126
Table 4.3 Selections from Alan Abelson’s “Up and Down Wall Street”(1990–1999)
Date Quote Reality Check
12/31/90 We’re convinced that the bear market willawake from its snooze and come roaring backto life, red in tooth and claw. Serious bearmarkets, like this one, don’t quit until they ’vetotaled the investment landscape (forconfirmation, see 1973–1974).
The Dow, then at 2629,rose 20% in thefollowing year.
1/6/92 We’re also fascinated by the two ominous below-the-line black bars of 1973 and 1974, amelancholy span that followed another stockmarket era in which multiples didn’t count andthe only thing that did was growth.
The Dow, then at 3201,rose 3% in 1992. In1973–1974, the marketlost two-thirds of itsvalue, after inflation.
9/28/92 This market ’s headed for a full-fledged fall.The uncertainty of the election, the sorrycondition of the economy, the weakness inthe dollar, the inability of lower rates tofurnish their customary lift, the woeful spiritsof the consumer and the blighted job market,add all of these to stock prices that are stillway overvalued by any reasonable standard—and how can you be anything but bearish?
The Dow was then at3250. Thereafter, itslowest point in the 1990swas 3136 on October 19,1992.
10/12/92 Dick Russell, “ the true disciple of CharlesDow, the latter-day incarnation of WilliamPeter Hamilton, the tireless keeper, defenderand explicator of the Dow Theory,” says abear market began October 5, when the Dowclosed below a magic level, confirming similarbehavior by the Transports months earlier.“This is the really big one,” he told Abelson—the end of the bull move that began in 1974.
The Dow, then at 3136,rose 14% over the nextyear.
5/24/93 That we contemplate the possibility of afurther rally, however, doesn’t mean we’veundergone a midnight conversion. The marketis still horribly overvalued in all the ways thatcount. Froth is everywhere. And the false godof momentum has in his thrall legions oflobotomized followers who have kited scoresof stocks to lunar levels. This will all endbadly, we’ve not the slightest doubt, and theonly question is when. Probably nottomorrow, as we say. But that ’s as far out aswe’ll go.
The Dow, then at 3492,had more than six yearsand 8200 points to gobefore peaking at 11722on January 14, 2000.
nied_c04.qxd 1/24/03 10:33 AM Page 126

Table 4.3 Continued
Date Quote Reality Check
10/4/93 You know the sort of blah-blah-blah we mean:those earnest sermons whose text describesthe kind of wonderful returns common stockshave delivered going back to when Noah finallybeached the ark and whose message to theflock is simple: the devil is in the deposits, sohurry to your bank, gather up what pittanceremains in those musty vaults, proceedimmediately to put it to work in a mutual fundand you’ll be rewarded way beyond dreams ofavarice.
A dollar invested in theVanguard 500 Index fundat the end of September1993 would have become$1.72 by April 30, 2002.A dollar invested in a CDat 5% would havebecome $1.43.
11/1/93 Turmoil in Russia, atrocities in Bosnia,murders in Haiti , strife in Somalia, fires inSouthern California, weakness in the bondmarket, higher taxes, you name it—thismarket responds with admirable consistency:Everything’s for the best. And maybe it is.But for some unfathomable reason—therelative handful of stocks that are able tofollow the averages to new high ground or thesteady decline in cash in the hands ofmutual-fund managers (which is the realgauge of investor sentiment these days) orthe swell of over-the-counter trading or thesoggy action in utilities or the rich price-to-book-value multiple, nearly 3.5 times, atwhich the Industrials are selling or the poorexcuse, less than 2.8%, that passes for ayield on the Dow or the flood of equityofferings or the slight itch behind our leftear—we don’t believe it. Just ornery, weguess.
The Dow rose 7.5% overthe next year.
6/27/94 It isn’t that we’re congenitally predisposedtoward a negative view of equities. It ’s merelythat we date this bull market to the end of1974, which suggests it ’s way past its naturalspan.
The bull market hadmore than five years togo. The Dow was then at3636.
11/20/95 Barton Biggs, “in one of his wonderfullyliterate weekly commentaries” for MorganStanley, likens buying technology stockstoday to sitting in on the “last poker gameson the Titanic.”
It was a very long pokergame. The MorganStanley High Tech Index,then at 171, peaked at1162 on March 27, 2000.
(continued)
nied_c04.qxd 1/24/03 10:33 AM Page 127

128
Table 4.3 Continued
Date Quote Reality Check
2/5/96 Felix Zulauf, “our friend and Swiss sage,” saysgold is “ the buy of a lifetime.”
Gold peaked three daysprevious at $415.50, alevel not topped for sixyears and counting. Theprice slid as low as $253on August 25, 1999.
3/18/96 Joe Rosenberg, “investment consigliere ofLoews Corp.” and “a virtual portfolioparagon,” shows a chart of the Dow as proofthat the bull market is in a final climacticstage. “When pressed for how far a declinewill carry, he turns a bit demure and hazardsat least 25%. But he obviously anticipatessomething nastier.”
Five years later, fromJanuary 2000–September 2001, theDow fell 28%.
3/25/96 Barton Biggs, “a firm believer in regression tothe mean, thinks the pendulum is bound toswing away from financial assets. He envisionsreturns on stocks, for example, averaging a4%-a-year improvement through the rest of thedecade, a steep drop from ’95’s astounding37.5% jump and the hefty 16.7% annualaverage gain over the past five years. He thinksthe big returns will come from Asian equities,emerging markets and nonresidential realestate.”
The average annual gainfor S&P 500 futures was24% for the rest of thedecade.
5/27/96 Andrew Smithers, “a world-class investmentprofessional” bearish on U.S. stocks sinceyear-end 1993, presents “ for the firsttime . . . a coherent reasoned case for asecular bear market.” Smithers, following theindication of the Q ratio, put his own moneyin cash, in safe banks, and advised everyoneto do likewise.
From year-end 1993through year-end 2002, aperiod that included oneof the worst bearmarkets in U.S. history,S&P futures rose 88%,an average annual gain of7%.
8/18/97 (After a 247-point drop in the Dow)Commiserate as we do with the victims—wehaven’t seen so many wailing widows andscreaming orphans since way back in ’87—wefelt the same rush we get from viewing aneclipse of the sun.
After the Octobercrashes in both 1987and 1997, the Dow rose11% through the end ofthe year.
nied_c04.qxd 1/24/03 10:33 AM Page 128

Chapter 4 • The Cult of the Bear 129
reached an all-time pinnacle of $1.45 million. There are more investment clubs
active—22,000—than ever before. And there are 4,700 hedge funds, or comfort-
ably more than one for every stock listed on the Big Board (3,419).
Farrell comments that he remembers drawing up similar lists back in 1968,
time of the last secular market peak. Trouble developed in the second half when
the only thing that stopped making record highs was prices.
“Similarly,” Bob observes, “we have posted many activity and participation
records in 1996, and prices have shown limited response. This failure to respond
to record demand suggests informed selling and, when combined with record val-
uation levels, raises doubts about the longevity of the bull market.” As that last
phrase suggests, Bob is a true pundit. A true pundit always says the end is near,
but he never says the end is here.
It was not until January 2000—more than three years later—that the
Dow reached a peak. The average was then at almost exactly double its level of
5882 on the day the article on Farrell was published.
Abelson has, on rare occasions, quoted sources who do not subscribe to
his views. In the “Up and Down Wall Street” column of June 22, 1998, John
Hussman, a hedge fund manager and University of Michigan professor, ex-
plained why price-to-book, dividend yield, and price/earnings multiples had
been “worse than useless” as investment guides. Hussman said the P/E ratio
has not been of much help in determining whether the market is too high be-
cause of “the hazards inherent in the ratio, notably the volatile nature of earn-
ings” and because “the ratio is often highest when profits are most depressed.”
Stocks have at times been extravagantly overvalued and still have performed
Table 4.3 Continued
Date Quote Reality Check
10//21/97 Even the most casual observer of theinvestment scene knows that intelligence ismore of a handicap than a help in achievingsuccess on Wall Street. Name any successfulWall Streeter. We rest our case.
Too bizarre to rebut.
Ditto.11/3/97 [After the worst point drop in the Dow everprompted the closing of financial markets]:What do you call a 550-point drop in a singleday?
A start.
And what do you call a 337-point rise on overa billion shares the very next day?
A mistake.
nied_c04.qxd 1/24/03 10:33 AM Page 129

130 Practical Speculation
well, he noted, “if earnings have been good, inflation benign, interest rates
subdued, and the technical trends, especially breadth, favorable.” Which had
been the case in recent years.
But the following week, on June 29, 1998, Abelson was back to citing a
Bob Farrell statistic du jour: The percentage of the average family’s assets in-
vested in equities had climbed to an unprecedented 38.3 percent. The previ-
ous peak was in 1968, when 37.9 percent of financial assets were made up of
stocks. “What ensued, it greatly grieves us to report, was the vicious market
plunge of 1969.”
Time after time, Abelson provided forums to market gurus whose forecasts
had gone badly awry, often for years. If the seer provided a chart purporting to
show how the market’s latest fever graph ascent resembled that before 1929,
1973, 1987, or Japan in 1990, a dozen paragraphs were not out of the question.
At the dawn of the twenty-first century, the market’s Cassandra finally
had his day. The Dow Industrials peaked on January 14 and began a long de-
scent. The technology stocks of the Nasdaq followed soon after in a calami-
tous, drawn-out crash that was indeed reminiscent of the terrible times of
1973–1974. Yet we cannot help but recall the account of the stock market
panic of April 1864, as told by William Worthington Fowler in his 1870 book,
Ten Years in Wall Street:
Signs and portents of coming disaster multiplied. . . . When [Anthony W. Morse]
entered the regular board that morning, he found nearly every broker eager to sell
at heavy concessions, before the call of stocks opened, and the feeling in the street
was still worse. At half-past eleven o’clock, a broker rose in his seat, and an-
nounced the failure of Morse & Co. An appalling stillness, like that which pre-
cedes a tornado, followed the words, then the storm burst. . . . The palace of
enchantment, built by a strong and cunning magician of so many golden hopes,
passed away like a cloud-pageant. . . .
We started to go home early in the afternoon. At the corner of William Street
and Exchange Place, we met S . He was a harmless but very disagreeable
lunatic, a Cassandra, who predicted nothing but evil. He had for six weeks been
uttering his doleful prophecies. When he caught sight of us, he began to throw up
his hands and give vent to hollow laughs, which grated very disagreeably on our
keyed-up nerves. “I told you so! I told you so! Ha, ha, ha!” We tried to shake him
off, but he stuck to us like a leech, hovered about us like an owl, and chuckled
when he had wrenched out of us the reluctant acknowledgment that we had not
yet sold our stocks.7
A sweet triumph, indeed. How we wish Abelson had written novels
instead. As Shermer pointed out in Weird Science, heresy does not equal
correctness.
nied_c04.qxd 1/24/03 10:33 AM Page 130

131
Figure 4.1 Abelson and the Dow, 1989–2001
19901991
19921993
19941995
Year
19961997
19981999
20002001
(Dow 7539, bottom that still stands)With the market still selling at afabulously elevated P/E, the effecton multiples—and the stock market—of a rate cut this time around will bepallid, putrid, or pathetic. (08/31/98)
(Dow 3636)We date this bull market tothe end of 1974, which suggestsit’s way past its natural span. (06/27/94)
(Dow 3101)We don’t see the economyrecovering with sufficient vigor andspeed to bail out the current awesomevaluation levels of share prices. (12/30/91)
(Dow tops 5000)Balloons have beenknown to burst. (11/27/95)
(Dow 3442)We kind of doubt this bull marketstill has six months, let alone two years,of life left. (02/08/93)
(Dow 3250)The market’s headedfor a full-fledged fall. (09/28/92)
(Dow 5705)The decline and fall of thetechs is a preview in livingcolor of the decline and fallof the market as a whole. (06/24/96)
(Dow 7442)What do you call a 500-point dropin a single day? A start. And whatdo you call a 337-point rise on overa billion shares the very next day?A mistake. (11/03/97)
(Dow tops 10000)Even while the markets werelegging it to new highs, theadvance/decline lines weresinking to new lows. The last timeit happened was in 1929. (03/29/99)
(Dow 2629)The bear market will awakefrom its snooze and comeroaring back to life, red intooth and claw. (12/31/90)
0
2,000
4,000
6,000
8,000
10,000
12,000
14,000
1
2
3
4
5
6
7
8
9
10
4
5
6
7
8
9
10
3
2
1
Dow
Jon
es In
dust
rial A
vera
ge
nied_c04.qxd 1/24/03 10:33 AM Page 131

132 Practical Speculation
Abelson should be given due credit for criticizing Wall Street’s cheerlead-
ing machine. Moreover, no one would argue that he has upheld the prevailing
ethical standard of financial journalism by holding no interest in any of the
securities he writes about. We have a different approach that we believe is
equally ethical, or more so: We tell our readers what we are going to buy, and
after our columns are published, we do what we said we would do. That way,
we play on the same field as our readers do. We suffer with them—or profit
with them—as the case may be. The prospect of putting one’s chips on
the table tends to concentrate the mind wonderfully and to bring sobriety to
the act of writing.
It has become an adage to many on Wall Street that the time to become
bearish on stocks will occur when Alan Abelson finally turns bullish. We
doubt that this apostasy will occur in our time. Nor can we expect any of his
followers to abandon their hero. At this point, they have too much invested
in their beliefs, emotionally and financially—and may have lost too much
money—to be swayed by reason.
Psychologists, looking back on our age, may wish to use the 36-year
panoply of irrational, dysfunctional belief as a case study to replace the rather
limited and specialized post-World-War-II religious example of the Keech cult
used in today’s social psychology classes. They doubtless will explain the rea-
sons for the destructive behavior in terms of the tremendous blow to self-
esteem that would occur from admitting the falsity of one’s leitmotiv, both
social and financial, during this period.
But we prefer a simpler assessment. The columnist has been so wrong
for so long on his one-sided prediction that if he were ever to close the trade
out, he would lock in a terrible loss by maintaining the unrealized loss in per-
petuity. No closure is possible, either in Abelson’s mind or in his readers’
minds. As long as the prediction is open, the nuclear catastrophe that stops
civilization and brings the Dow down to the triple-digit level of his beginnings
might occur and provide vindication (see Figure 4.1).
Like many others, we will be saddened when, in the words of the physicist
Max Planck, the financial columnist is “dragged kicking and screaming from
his aerie perch.” However, this chapter in history should serve in the minds of
all investors as an example of the folly of failing to adjust one’s
beliefs to the constantly shifting weight of evidence and struc-
tural changes in our economy.
nied_c04.qxd 1/24/03 10:33 AM Page 132

133
5 “ W E A R E N U M B E R O N E ”U S U A L L Y M E A N S
“ N O T M U C H L O N G E R ”
Pride goeth before destruction, a haughty spirit before a fall.
—Proverbs 16:18
We can be the one company that can change the world. It’s
maybe the first time there’s ever been such a company. Cisco
is in the position. This is the Internet revolution. . . . We can
be perhaps the most successful company in history.
—John Chambers, Chief Executive Officer, Cisco Systems1
Most people would agree that powerful corporate leadership is impor-
tant in considering which stock to buy. The star CEO whose words
put wings to a grand vision attracts capital. But as the Greek historian
Herodotus observed in the fifth century B.C., power can bring outrageous ar-
rogance, or hubris, characterized by moral blindness and temptation to abuse
the weak. This tragedy is occurring in our time as one company after another
nied_c05.qxd 1/24/03 10:31 AM Page 133

134 Practical Speculation
collapses under charismatic but flawed leadership, destroying the wealth of its
shareholders.
Much has been written about the comeuppance of the dot-coms. But far
more wide-reaching in impact on America’s pocketbooks and the economy
was the crash of three big New Economy blue chips: Enron, Cisco, and Lu-
cent. Enron went from $90 a share on August 17, 2000, to the largest corpo-
rate bankruptcy in history on December 2, 2001. (It was soon eclipsed by the
demise of WorldCom.) Cisco fell from $80 a share in March 2000 to $8.60
as of October 2002, and Lucent declined from $77.77 in December 1999 to 58
cents in the same period. An investment of $100,000 at the height of these
stocks would have been reduced to less than $5,000.
Yet all three had been 1990s wonder stocks, featured on countless bro-
kerage “recommend” lists right through the catastrophic denouements. So
firm a grip did these stocks have on the nation’s imagination that the January-
February 2002 issue of AARP’s magazine, Modern Maturity (which claims the
largest circulation in the United States), cited unnamed “experts” who were
recommending Lucent and the already-bankrupt Enron as good safe invest-
ments in the post-September 11 downturn.2
We do not insist that a comeback is out of the question for any of these
companies; we are great believers in the second chance. But we would all like
to spot the next Enron before it blows up. We began studying in earnest how
to go about this in January 2002, after a reader sent us the following letter
(Enron’s shares were by then trading in pennies):
I am a retired person who invested all my savings in Enron since it was consid-
ered a blue-chip company and paid dividends. What do you suggest I should do?
Do you think they could successfully restructure the company? Will the stock
come back to $20, if not to the high? I would be very grateful if you would kindly
reply to my e-mail. I am extremely depressed and very anxious to know your
thoughts on Enron’s future. Thanks.
In studying how to spot a company destined to plunge from the heights
to the depths, we studied CEOs who made outrageous boasts, and we
searched for executives known for humility. We delved into the Wall Street
superstition which says a jinx often afflicts companies that
build flashy headquarters buildings, talk their way onto maga-
zine covers, name stadiums after themselves, or make head-
lines with big acquisitions. Our tests showed that there is
something helpful in all of these, and we report the results in this chapter.
Our first insights came from an ancient Greek tale that involved, curiously
enough, technological genius.
nied_c05.qxd 1/24/03 10:31 AM Page 134

Chapter 5 • “We Are Number One” 135
The Tale of Icarus
Daedalus, a brilliant engineer, earned much honor from Crete’s King Minos by
building a splendid palace with a running-water system. Daedalus also built a
labyrinth to hide the Minotaur, the monstrous issue of the king’s wife’s passion
for the white bull of Poseidon. When King Minos learned that Daedalus had as-
sisted the queen in consummating the union, he imprisoned Daedalus. Daedalus
secretly fashioned wings from wax and feathers for himself and his son, Icarus, to
escape to Sicily. When the time came, Daedalus counseled his son:
Icarus, I advise you to take a middle course.
If you fly too low, the sea will soak the wings;
If you fly too high, the sun’s heat will burn them.
Fly between sea and sun!
Take the course along which I shall lead you.
But Icarus could not resist the temptation to soar high into the sky. His wings
disintegrated as the sun softened the wax, and he plunged into the sea.
Hubris is the sin to which the great and gifted are most susceptible, and it
provided Greek tragedians and historians with a rich source of material. Re-
counting the punishments of heroes who aspired to godly heights provided
catharsis, scholars say, allowing Greek audiences to cleanse themselves of fear
and pity without becoming paralyzed by those emotions. Some writers pre-
sented the hero as wholly blameless. Aeschylus, for example, believed that the
gods begrudged human greatness and inflicted hubris on men at the height of
their success.
Twenty-five centuries later, hubris is still a potent force in our lives, from
the moment we reach out as toddlers and challenge the gods with our invinci-
bility by touching the stove’s red-hot burner. We all have our own examples of
hubris. Vic’s personal favorite is of Old Man Hemingway. He heard the tale
from the owner of a pipe company he visited in Houston during his days in the
mergers-and-acquisition business. Hemingway was in the habit of ending
meetings with lower-level executives by picking up a copy of the New York Timesand holding it in front of his face. One day he was found dead, with 15 bullet
holes in his paper. Apparently, a lower-level employee, enraged by his boss’
hubris, knew the newspaper gesture only too well and took the opportunity to
do him in.
Our favorite newspaper, the National Enquirer, is adept in recounting sto-
ries about hubris. Jennifer Lopez is apparently a frequent culprit. According
to the Enquirer, J-Lo’s handlers warn you never to look her directly in the eye,
and never to call her by her name.3 This custom has historical roots in the
nied_c05.qxd 1/24/03 10:31 AM Page 135

136 Practical Speculation
royal French court under Louis XIV. Courtiers were under orders to always
avert their eyes in the Sun King’s presence, and they were expected to proffer
their wives as a token of their esteem.
In Wall Street’s tragedies, hubris often turns out to have been the culprit.
The late historian Robert Sobel, surveying the past century of business down-
falls in his 1999 book When Giants Stumble: Classic Business Blunders and Howto Avoid Them, prominently featured hubris in his list of 15 deadly sins that de-
stroyed such leading companies as Osborne Computer, LTV, Schwinn, and
Packard Motor Car.4 (Sobel’s list also included nepotism, nonstrategic expan-
sion, cutting corners, isolation, and dependency.)
The sense of being above the world is basic to hubris. The revered British
negotiator Sir Harold Nicolson pinpointed the attitude in his 1939 classic,
Diplomacy: “The dangers of vanity in a negotiator can scarcely be exagger-
ated. . . . It may bring in its train vices of imprecision, excitability, impatience,
emotionalism, and even untruthfulness.”5
The “above it all” element of hubris may have been present when Cisco
president John Chambers accused Silicon Valley executives in February 2000
of undermining the value of their companies by awarding “hired gun” options
that allowed executives and employees to cash out after only three years.
Chambers made his admonition just 17 days after he cleared $142.9 million
by exercising 1.15 million Cisco options at what turned out to be near-peak
prices, according to Infoworld, an online news site.6
Both Cisco and Enron employed ingenious mechanisms to banish debt
from the corporate books. In 2002, the Wall Street Journal caused a sensation
by reporting that Enron traders had secretly forced up consumer energy
prices in California by using trading strategies with such nicknames as Fat
Boy, Ricochet, Load Shift, Get Shorty, and Death Star.7
The Corporate Story Board
Beyond the arrogance of power, a common theme in corporate stories of
hubris and downfall is that executives tell—explicitly or implicitly—stories
that analysts want to hear. In an e-mail to us, Flavia Cymbalista, a Brazilian-
born PhD who studies the effects of uncertainty on behavior, observed, “Ana-
lysts love a ‘savior.’ ” Sometimes, she said, analysts like a story enough to help
make it come true, by encouraging their firms to provide cheap capital to the
company. “Other times the story is unsustainable and sooner or later this be-
comes apparent.” Some successful traders gain an edge by exploiting their
nied_c05.qxd 1/24/03 10:31 AM Page 136

Chapter 5 • “We Are Number One” 137
backgrounds in the arts and humanities to practice “script analysis,” she
noted. “They listen to the stories companies are telling and to the stories that
the market is hearing and make their bets according to their judgment of how
good the story is as such and how it’s likely to unfold.”
With such a willing audience, it is only natural for a CEO to boast a bit.
But woes follow when executives start to believe their own fish stories.
The leaders of Lucent, Enron, and Cisco were nothing if not storytellers.
At Lucent, Carly Fiorina ran a $90-million brand-building campaign that, as
BusinessWeek said in an August 2, 1999, cover story, “helped transform the
company from a humdrum maker of phone equipment to an Internet player
supplying the gear for the New Economy.” The ads asked: “Who’s at the Cen-
ter of the Communications Revolution?”8 In the next three years, Lucent
high-flying stock lost 97 percent of its value, leaving its investors wishing they
had put their money into something a bit more humdrum.
In 1999, Enron Chairman Kenneth Lay boasted of his company’s nine-
fold growth in value to $40 billion during the 1990s. “We will do it again this
coming decade,” he predicted to a group of awed oil and gas executives. Two
years later, Enron was ruined, its leaders under federal investigation for mas-
sive fraud. On August 14, 2001, shortly before Enron’s downfall, Lay wrote in
an e-mail to employees: “Our performance has never been stronger, our busi-
ness model has never been more robust. We have the finest organization in
American business today.” The e-mail surfaced in congressional hearings five
months later.
Fiorina and Lay were treading a well-worn path. Cisco Systems Chair-
man John Chambers’ 1999 prediction of continued 30 percent-to-50 per-
cent annual profit growth was promptly followed by four straight quarters of
50 percent-plus profit declines. Cisco is a true modern tragedy and Cham-
bers an exemplary storyteller.
Cisco’s Storyteller
As a child, Chambers suffered from dyslexia. He went on to earn law and
business degrees, but never overcame a dislike for reading. Like many suc-
cessful dyslexics, he compensated by relying on a prodigious memory. He
often gave speeches without notes.
His first job was as a salesman at IBM. The Washington Post’s Mark Lei-
bovich reported in an April 6, 2001, profile that Chambers still remembered
what the recruiter told him: “You’re not selling technology; you’re selling a
nied_c05.qxd 1/24/03 10:31 AM Page 137

138 Practical Speculation
dream.” He became a great salesman for IBM and then for Cisco, tirelessly
promoting a vision of a New World Network with Cisco at its center. “Cham-
bers’ sales pitches included the implicit message of invincibility,” Leibovich
wrote. In August 1996, the year after becoming CEO, Chambers told USAToday, “There’s only one company in this industry that controls its destiny,
and it is Cisco.”9 Chambers hobnobbed with President Clinton and other
world leaders, spreading his network vision. In 1998, Forbes ASAP named
Cisco the country’s most dynamic company. A September 13, 1999, BusinessWeek cover story dubbed Chambers “the Internet’s No. 1 salesman.”10
By September 1999, stock options had made millionaires of 2,000 of
Cisco’s 17,000 employees. Chambers used his sales talent to keep turnover
among his workers low, personally distributing ice cream and sweets. Be-
hind the talk and the ice cream, though, Cisco was not winning much busi-
ness in the $225-billion market crucial to his vision of growth: selling
equipment to the big local phone companies. In 1999, Cisco accounted for
less than 1 percent of telephone equipment sales. The Bells preferred to buy
from Cisco’s far bigger rivals: Lucent, which Chambers loved to mock as an
“Old World” company, and Canada’s Nortel.
On August 26, 1999, desperate to catch up, Cisco agreed to buy Cerent, a
two-year-old maker of fiber-optic networking equipment, with just 285 em-
ployees, for a whopping $6.9 billion in stock. On September 15, 1999, he told
Sixty Minutes anchor Diane Sawyer: “We’re going to change everything in this
industry.”
In early 2000, after the big corporate push to buy computer and network-
ing equipment for the new century was over, doubts about future growth
began to surface. Chambers would have none of it. His executives were still
predicting sales growth in the 30 percent to 50 percent range in companies
where the economy was strong, according to a February 9, 2000, article in the
Los Angeles Times.11
In March 2000, the huge gains in Internet stocks began to unravel. Cisco
shares traded at a high of $80.06 on March 27, 2000. In the next 18 days, the
stock slumped 29 percent. Chambers remained optimistic, likening Cisco to a
weapons broker in wartime. “We’re the experts in everything,” Chambers told
BusinessWeek for a May 15, 2000, cover story. “We sell arms to everyone.”12
More and more companies cut back on their growth forecasts, but Chambers
would have none of it. Well into 2001, he stuck with his projections of 30 per-
cent to 50 percent long-term revenue growth, relying on what CIO Magazine,in an August 1, 2000, article,13 called Cisco’s “godlike ability to peer into
every nook and cranny of the business, 24/7” with its “virtual close” tracking
software. Unfortunately, customers, fearful of shortages, had inflated their
nied_c05.qxd 1/24/03 10:31 AM Page 138

Chapter 5 • “We Are Number One” 139
orders. By year-end 2000, demand had fallen off a cliff. The alternative
telecommunications companies and dot-coms—Cisco’s primary customers—
began disappearing. Cisco switches sold for 15 cents on the dollar.
Undaunted, Chambers continued to sell the story. Speaking in New Delhi
to the Confederation of Indian Industry on January 17, 2001, Chambers told
his audience that “voice transmission and then data transmission over the In-
ternet would become free of cost. . . . that education would change forever with
the advent of education over the World Wide Web . . . and that E-business over
the next five years would grow by over five times. . . . Mr. Chambers stated that
Cisco learned from every company in the world and became No. 1 or No. 2 in
four years in each market it entered.”14
On February 6, 2001, Cisco fell short of Wall Street earnings estimates.
Its “godlike ability” to forecast had failed. In March, Cisco announced plans to
cut 16 percent of its workforce, or 8,000 jobs, and Chambers acknowledged
that Cisco’s growth rate went from 70 percent in November to negative in Jan-
uary and February. “No one has ever decelerated at that speed,” he told the
Washington Post. It goes with the territory “of being the most profitable,
fastest-growing company in history.”
Four quarters of declining earnings followed, breaking a steak of 40 quar-
ters of growth. The stock market had valued Cisco at $532 billion at its peak,
making it briefly the most valuable company in America. By October 2002, its
market value had declined to $62 billion.
The Executive Boast
Our friend Ed Gross, whose adept card-counting on the blackjack tables led to
his banishment from Las Vegas casinos (and a new career as an options trader
and market maker), says gamblers, even skillful ones, who entered the casino
bragging how easily they expected to win invariably ended up losers.
The tendency for stocks to go down in like manner after executive boast-
ing is part of a general character flaw that might be called, “Did You Sum-
mit?” Outside magazine’s February 2002 issue has an illuminating article
on mountaineering search-and-rescue missions observing that whenever a
climber descends from the heights, the onlookers who rush over do not
ask, “Did you enjoy?” or “Did you learn?” but “Did you summit?” The
insistence on reaching the peak, regardless of weather conditions and the
abilities of the climbers, is what leads to disaster. Many famous moun-
taineering deaths, including Mallory’s fatal attempt of Everest in 1924, can
be traced to it.15
nied_c05.qxd 1/24/03 10:31 AM Page 139

140 Practical Speculation
Once on the summit, CEOs naturally want to stay there. But competi-
tion at the top is always the most intense. Rivals are bent on coming up with
alternate ways to make or market every product, and the consumer is fickle.
When CEOs believe that they are the best at something, it breeds an atmo-
sphere of invincibility that opens the door for disaster. The CEOs who show
lack of humility by boasting could be demonstrating unwillingness to face
up to the harsh and ever-changing realities of the marketplace. Perhaps they
find boasting easier than putting in the energy necessary for the humdrum
pursuit of profits. In the worst case, boasting could be a cover-up for a seri-
ous problem.
The scientist Albert Einstein put it nicely in a 1936 speech on education
in Albany, New York, that was reported in Great Ideas in Physics: “Desire for
approval and recognition is a healthy motive; but the desire to be acknowl-
edged as better, stronger, and more intelligent than a fellow being or fellow
scholar easily leads to an excessively egoistic psychological adjustment, which
may become injurious for the individual and for the community.”16
The desire to be on top is not limited to CEOs. Money managers, too, suf-
fer from the tendency. In response to one of the columns we did on hubris for
MSN MoneyCentral, a reader wrote: “Niederhoffer is the best example of pride
signaling the fall. Right after he was the No. 1 hedge fund manager, in 1996,
he wrote a book, gave the keynote speech at many conferences, and promptly
fell into oblivion.”
We cannot deny the truth of what our correspondent wrote, but we can
guarantee that in the future Vic will never again strive to be first in the hedge
fund world. He has learned that “sure and steady” wins the race. The power of
compounding is such that a slight but consistent edge over the 10 percent re-
turn from a buy-and-hold strategy is sufficient to achieve anyone’s financial
goals. To strive for a much greater return requires taking more risk. That extra
risk can be ruinous, especially when the adversary’s bankroll is much bigger
than yours.
Hubris and Chutzpa
We want to draw a clear line between visionary ideas and delusions of
grandeur. Self-confidence is prerequisite to success. Hubris, however, is an ex-
aggerated self-confidence that is difficult to sustain in light of the facts. Alas,
none of us is perfect. The trap is sprung when people afflicted by hubris try to
maintain a constant sense of being on top. They can replicate the emotional
nied_c05.qxd 1/24/03 10:31 AM Page 140

Chapter 5 • “We Are Number One” 141
feeling of confidence “either by altering their standards, rules and goals, or by
reevaluating what constitutes success,” Michael Lewis wrote in “Self-Conscious
Emotions,” in the Gale Encyclopedia of Childhood and Adolescence.17
Vic’s father, Arthur Niederhoffer, unfailingly humble about his own nu-
merous achievements as cop, lawyer, and scholar, masterfully drew the dis-
tinction between confidence and hubris in an article for the Connecticut LawReview of Winter 1970–1971. Artie’s subject was the arrogance of power dis-
played by the judge in the trial of the Chicago 7. The American Bar Associa-
tion’s canon of judicial ethics calls for judges to be “temperate, attentive,
patient, impartial.” When defendant Bobby Seale’s lawyer had to go to the
hospital, Judge Julius J. Hoffman denied Seale’s request for an adjournment.
He also ordered two attorneys jailed without bond for contempt of court, re-
peatedly interrupted the defense lawyers, and denied virtually all their mo-
tions. Artie wrote:
How is it possible for a Federal judge to have become so rabid toward the de-
fense that “he upheld prosecutors’ objections even when he had not properly
heard or understood them,” and turned the proceedings into a judicial disaster?
We think the best explanation for these excesses is the classic one of Hubris.
Implicit in the classic Greek philosophy of justice was the concept of a di-
vinely decreed social order in which every human being had his particular place
and role. Hubris was the fatal flaw of character that impelled a man to violate the
most cherished mores. Inexorably Nemesis punished the violator who, as Aristo-
tle puts it, “moved from happiness to misery.” It was the most compelling theme
of Greek tragedy, but there is no hint of this shattering experience in Webster’s
Third International, that defines hubris rather prosaically as “overweening pride,
self confidence, or arrogance.”
In Jewish folklore we find a similar concept—chutzpa, which also connotes
insolence, audacity, or arrogance.
If both hubris and chutzpa are forms of arrogance, what is the distinction be-
tween them? Hubris is a reflection of a civilization at the peak of its power, on the
verge of assuming mastery of the known world. Its heroes hurled challenges to
the gods on Mount Olympus. We think immediately of Prometheus, Sisyphus,
Agamemnon and Oedipus. By comparison, chutzpa is a relatively modern term
rooted in the ghetto existence of a weak, dispersed and alienated Jewish minority.
Hubris grows from a sense of power; chutzpa is a compensation for the lack
of power.
Hubris may be disguised for a long time. It is often interpreted as evidence of
high standards and integrity that marks a man for honor until the fatal flaw
causes him to overreach. Hubris carries with it an almost religious aura, but
chutzpa rarely exceeds the limits of the profane.18
nied_c05.qxd 1/24/03 10:31 AM Page 141
142 Practical Speculation
It Ain’t Boasting If You Can Do It
How can we separate the Enrons, the Ciscos, and the Lucents—not to men-
tion the Long-Term Capital Managements, Scott Papers, and Winstars—from
winners like Genentech, once ridiculed for saying it would use biotechnology
to develop a profitable drug? Genentech did just what it said it would; it be-
came the first company to receive FDA approval for a biotech drug. It was
later acquired by Roche in a series of stock purchases at up to seven times the
original 1986 offering price. Even after the long tech collapse, the Nasdaq 100
as of the end of July 2002 included 23 stocks that had more than tripled over
the previous five years. Qlogic, Echostar, Idec Pharmaceuticals, Medimmune,
and Amazon.com were up more than sixfold.
Is there a way to distinguish companies with grand ambitions that will go
on to reach the stars from those destined to suffer the end deemed necessary
by the Greek tragedians?
As scientists, we need to quantify the effects of hubris. We began with a
search of boastful phrases on the google.com search engine. “We’re the
best,” “best company,” and “We’re No. 1” yielded over 100,000 entries. We
found 11 companies that used these magic phrases. We threw in a couple of
beautiful examples from Martha Stewart and Priceline.com
for good measure, although they didn’t contain the exact
wording. We then calculated performance of the stocks
against the S&P 500, from the date of the remark through
year-end 2001.
The sample size is too small for any degree of statistical confidence, but
the results are shockingly bad. The average relative performance was an as-
tonishing 24 percentage points below the S&P 500. Five companies—Enron,
Gateway, Human Genome Sciences, Priceline.com. and Sprint-PCS—fell
more than 50 percent. The date, the quote that triggered it, and the subse-
quent performance are shown in Table 5.1.
While we may have missed some boastful remarks, we made an effort to
include the performance of all companies that satisfied the criteria, regardless
of subsequent performance.
After publishing our Boastful 13 study on CNBC Money, we received the
following extraordinary letter from a person whose insights deserve a com-
plete quote:
I retired from Lucent Technologies as an engineer after 30 years with the com-
pany. My career went back to Western Electric Company. Lucent excelled at leading-
edge manufacturing. Not very glamorous, but consistently profitable; that was
what it inherited from Western Electric, one of the best manufacturers. During
nied_c05.qxd 1/24/03 10:31 AM Page 142

143
DifferencePercent from
Quote Change to S&P 500Stock Date Quote 1/14/02 (% points)
ContinentalAirlines (CAL)
1/18/00 “We’re the best positionedairline for the future.”
−27 −5
Dell Computer(DELL)
9/28/00 “We’re No. 1 in the UK,Sweden, Ireland, and Francein the business market.”
−16 6
Delta Air Lines(DAL)
6/14/01 “We are the best in thebusiness.” (VP describingwhy Internet-in-the-skyventure will work)
−31 −25
Enron (ENE) 12/31/99 “From the world’s leadingenergy company . . . to theworld’s leading company!”(banner hanging incorporate headquarters inlate 1999)
−98 −76
Fidelity Nat ’l (FNF) 6/14/00 “We’re No. 1 in all leadingfinancial indicators versusthe competition.”
45 68
Gateway (GTW) 3/26/99 “Gateway’s goal is tobecome No. 1 on the Web,not because we are thebiggest, but because weare the best.”
−80 −69
Human GenomeSciences (HGSI)
5/7/01 “We are No. 1 by at leastan order of magnitude,possibly two.”
−52 −42
KPMG Consulting(KCIN)
6/7/01 “We are the best in theindustry.”
−6 5
LaSalle Hotel Prop(LHO)
7/2/01 “We were the best-performing REIT in 1999.”
−33 −25
Martha Stewart(MSO)
8/21/01 “I can almost bend steelwith my mind. I can bendanything if I try hardenough.”
−15 −14
(continued)
Table 5.1 The Boastful 13
nied_c05.qxd 1/24/03 10:31 AM Page 143

144 Practical Speculation
the intervening AT&T years, exciting marketing and personnel types gradually re-
placed the stodgy old engineering management. Eventually, the entire manage-
ment down to first-level supervisor was saturated with people who didn’t know,
understand or like manufacturing, nor did they like those who did.
An example: During my last days at Lucent, our vice president sent his assis-
tant down for a number of days to our plant in order to explain—to all 1,200 peo-
ple—our new, world-class manufacturing strategy that was to finally take us
unquestionably past Nortel and make us “No. 1.” Reportedly, this young lady’s
prior experience was that of a kindergarten teacher—a very good one. She sat us
in groups of seven, each group composed of persons who didn’t know each other
very well and who had different diversity and work backgrounds—in order to pro-
mote open communication. She then handed out a coloring sheet with four
crayons to each of us. We then were instructed during the next four hours to fill in
picture parts corresponding to the part of the strategy that she was explaining at
the time with, of course, the appropriate company-approved color. Very little had
to do with manufacturing; most of it had to do with image and how we were going
to enter, and by the way dominate, new markets by buying new hi-tech com-
panies. (We ended up that year by buying and trying—unsuccessfully for the
most part—to integrate 31 new companies, many of which were duplicating our
own developing products. Meanwhile, we gradually dismantled our own capabili-
ties that we could have, and should have, easily upgraded.)
DifferencePercent from
Quote Change to S&P 500Stock Date Quote 1/14/02 (% points)
Priceline.com(PCLN)
8/17/99 “Priceline will reinvent theenvironmental DNA ofglobal business,” andproduce “a totally differentform of energy.”
−92 −77
Rational Software(RATL)
4/20/00 “We are the best-keptsecret on Wall Street.”
−38 −17
Sprint-PCS (PCS) 7/21/00 “We’re the best wirelessphone service available.”
−71 −48
Average −39 −24
Table 5.1 Continued
nied_c05.qxd 1/24/03 10:31 AM Page 144

Chapter 5 • “We Are Number One” 145
Now, most of these people had 20 or so years of experience. Many had col-
lege degrees, and/or intense technical training. I’m no dummy, myself. I gradu-
ated with a BSME during Viet Nam when they only let one out of five finish in
engineering, and passed my engineering licensing test on the first try. I earned an
MBA in mid-career, while pursuing graduate engineering work simultaneously. I
had also the experience of surviving a decade of downsizing along with most of
the others present, so I knew enough to keep my mouth shut.
But one of the employees who was buying into all the “mutual trust” rhetoric
kept his hand up insistently long enough that he was finally recognized. He ques-
tioned one of the more obvious flaws, and it was publicly explained to him that the
company needed “team players” who were “open to change and new ideas”—that
perhaps some of the people in his group with “different” cultural backgrounds
could explain it to him.
In the fable, the little boy who observed that the emperor had no clothes on
was not chastised. When honest, trusting, and knowledgeable employees play out
the little boy’s role, the effect is disastrous for the employees; when the market
takes on that role, it is disastrous for the whole company.
But how does a company go overnight from aggressively executing a century-
long tradition of adding real value of society, to being introspectively and passively
fascinated by its own self-valued fantasy-image? The only answer that I can come
up with is that it takes two components at the top: a determined ignorance and a
pervasive, self-justified willingness to intimidate.
I believe pride and its twin, arrogance, inevitably produces the ignorance.
After all, there’s no sense wasting time learning if you’re already the expert, right?
But I have not yet figured out exactly how we come to so easily intimidate others
who have a history of competence and who share our own self-interests. Perhaps
success reinforces our confidence in our abilities to the point that we believe we
are discounting the opinions of subordinates for their own good. Possibly pride
and arrogance play roles also. Or perhaps, way deep down, do we suspect that our
pride-produced ignorance has trapped us? At any rate, we seem to adopt the sur-
vival instincts of gladiators when we least need them. People are the strangest cre-
ation in the universe.
There is always tension between the ambition to excel that leads to corpo-
rate greatness and the excessive boastfulness that led Icarus to fly too close to
the sun. Perhaps no company illustrates this better than Continental Airlines,
which we mentioned in a January 17, 2002, column titled “‘We’re No. 1’ Usu-
ally Means ‘Not Much Longer’ ” as an example of a boastful company. (We
faulted Continental for saying “We’re the best-positioned airline for the fu-
ture.”) The airline’s director of public relations immediately fired off a letter to
us. “What can we do? We were voted the best on time, the most satisfactory to
all passengers, the best managed. Does that really make us a candidate for
nied_c05.qxd 1/24/03 10:31 AM Page 145

146 Practical Speculation
shorting, as you suggest?” Actually, we specifically said we were not recom-
mending that any of the boastful companies be shorted. We rarely recom-
mend shorting, given the market’s upward drift. Nevertheless, Continental
stock did tumble 61 percent in the subsequent six months.
Hunting for Humility
To balance our investigation into hubris, we looked for humble executives.
We wanted to find the corporate counterparts to Pete Sampras in tennis,
Sparky Anderson in baseball, Walter Payton in football, Mike Krzyzewski in
basketball, and Wayne Gretzky in hockey. Companies with executives who
could say, as Anderson did: “My daddy told me, ‘Son, be nice to everyone you
meet—be nice and treat that person like he’s someone.’” Companies with ex-
ecutives who, instead of doing the equivalent of the funky chicken after scor-
ing a point, bow their heads after a spectacular putaway, as Sampras does.
“He is so concentrated on the task at hand that I barely ever notice him
smile,” one Sampras fan wrote.
We found just 10 of these companies after searching through hundreds
of thousands of articles published over the past three years, looking for con-
junctions of “CEO” with such words as “low key,” “down-to-earth,” “modest,”
and “unassuming.” They are Allstate, Biomet, Costco Wholesale, Electrolux,
Lockheed Martin, Wal-Mart Stores, Weyerhaeuser, and White Mountains In-
surance. (The list also included AOL Time Warner and Computer Associates,
which have since come under federal investigation for improper accounting
practices. Whoops! But this reminds us of the great Golda Meir quote: “Don’t
be modest. You aren’t that great.”)
We compared the performance of these humble companies with that of
the S&P 500. It turned out they outperformed the market by 40 percentage
points from the dates of the statements containing the keywords through
January 21, 2002.
Humble companies won some attention in October 2001 when James
C. Collins came out with Good to Great: Why Some Companies Make theLeap . . . and Others Don’t.19
Collins found 11 companies—Abbott Laboratories, Circuit City, Fannie
Mae, Gillette, Kimberly-Clark, Kroger, Nucor, Philip Morris, Pitney Bowes,
Walgreen, and Wells Fargo—that had the kind of down-to-earth, attention-to-
detail style that turned them into great companies. He found that their re-
turns were seven times that of the market in the 15 years after their transition
nied_c05.qxd 1/24/03 10:31 AM Page 146

Chapter 5 • “We Are Number One” 147
to greatness. One dollar invested in the good-to-great companies in 1965
would have grown to $471 versus $56 in the overall market, or almost eight
times the market return.
So Much for Celebrity
The CEOs of these companies are invariably self-effacing. “There is a direct re-
lationship between the absence of celebrity and the presence of good-to-great
results,” Collins said in an interview published in the October 2001 online edi-
tion of Fast Company magazine. “Why? First, when you have a celebrity, the
company turns into ‘the one genius with 1,000 helpers.’ It creates a sense that
the whole thing is really about the CEO. At a deeper level, we found that for
leaders to make something great, their ambition has to be for the greatness of
the work and the company, rather than for themselves.”20
Much has been made of Collins’ scientific, painstaking method of re-
search. The book was five years in the making and involved 21 researchers
whom Collins affectionately calls chimps. It took six months and vast banks
of computers just to come up with the companies. We would point out that
since Collins selected the companies for their superior market performance
Table 5.2 “Good to Great” Stock Performance June 30, 2001, to July 30, 2002
Company Percent Change
Abbott Laboratories −18.2Circuit City −2.8Fannie Mae −12.2Gillette 8.4Kimberly-Clark 3.9Kroger −23.9Nucor 12.4Philip Morris −4.2Pitney Bowes −7.0Walgreen 3.3Wells Fargo 5.7
Average: −3.2
S&P 500 −27.3
nied_c05.qxd 1/24/03 10:31 AM Page 147

148 Practical Speculation
in the first place, of course they displayed it. There is thus no prospective evi-
dence, no scientific finding, indeed no reason whatsoever aside from anec-
dotes to believe that leaders or companies showing these characteristics
would perform any differently in the future than a group of randomly selected
companies.
Good to Great calculated performance through June 2001. We took pencil
to paper and updated the calculation through February 2002 (see Table 5.2).
The average performance of the 10 companies over the eight-month pe-
riod was −3.2 percent, outperforming the S&P 500 by 20 percentage points in
one of the worst market declines ever.
We would like to believe that the performance differences found by
Collins will hold up in the long run. There is something ugly and unbusi-
nesslike about the tendency of CEOs to brag about their company’s superior-
ity, instead of focusing on their own pursuit of excellence.
Just What Is Humble?
Finding indications of humility is more difficult than finding indications of
arrogance. Many different statements can indicate humility, but arrogance
seems to be present when certain specific types of things are said. Then, too,
as Dizzy Dean once observed, “It ain’t boasting if you can do it.” The English
chess grandmaster Nigel Davies told us that Jose Raul Capablanca, world
champion from 1921 to 1927 and probably the greatest natural chess player of
all time, once said, “As one by one I mowed them down, my superiority be-
came evident.”21
Davies commented in a January 19, 2002, e-mail to us: “Was this hubris?
Probably more a statement of fact. I am much more wary of apparent humil-
ity than apparent hubris. Those who feign humility can be both arrogant
and deceitful.”
The one company with by far the most mentions for humility in the
search engines is Berkshire Hathaway. But it was Berkshire’s CEO, Warren
Buffett, who made the following remark, reported in Fortune on November
22, 1999:
Sizing all this up, I like to think that if I’d been at Kitty Hawk in 1903, when
Orville Wright took off, I would have been farsighted enough, and public spirited
enough—I owed this to future capitalists—to shoot him down. I mean, Karl
Marx couldn’t have done as much damage to capitalists as Orville did. . . . There
were about 300 aircraft manufacturers in 1919–1939. Only a handful are breath-
ing today.
nied_c05.qxd 1/24/03 10:31 AM Page 148

Chapter 5 • “We Are Number One” 149
Evidently, the “world’s greatest investor” has come to believe so thor-
oughly in his own press that he now presumes to assist the gods in punishing
today’s Icaruses for their attempts to soar.
The Skyscraper Indicator
In the twenty-first century, as in the time of Cheops, there will undoubtedly be
taller and taller buildings, built at great effort and often without real economic
justification, because the rich and powerful will still sometimes find satisfaction
in traditional ways of demonstrating that they’re on top of the heap.
—William J. Mitchell, “Do We Still Need Skyscrapers?” Scientific American22
Far too often, a company, country, or civilization builds a tall, lavish
building and experiences disaster shortly thereafter. Start in Babylon, circa
2800 B.C., when the conqueror Nimrod attempted to build “a tower that
reaches to the heavens, so that we may make a name for ourselves.” The
Lord, we are told in the “Book of Genesis,” threw the builders into confusion,
halting construction permanently.
Right up to modern days, the landscape is littered with disastrous exam-
ples of the tendency to build high before a fall. The soaring towers of Southeast
Asia, completed before the 1997 crash, come to mind. The world’s current
tallest buildings, the Petronas Towers, were completed in Kuala Lumpur in
1997, the year the Malaysian stock market fell 50 percent. The December 28,
1999, christening of the world’s largest video display, the Nasdaq’s $37 million
MarketSite Tower in Manhattan’s Times Square, came just three months be-
fore a 70 percent, 18-month crash in the Nasdaq Composite Index. Enron had
almost completed a lavish 40-story tower designed by celebrity architect Cesar
Pelli when it filed for bankruptcy in 2002.
John Newbegin, who runs a Web site called nycskyscrapers.com, wrote
us: “I was totally fooled [as to Enron’s true financial condition] by the beauti-
ful building. . . . They appeared to be by far the most prosperous of all the en-
ergy companies I saw, judging from the appearance of the edifice. I was
convinced that they were huge and had all kinds of innovative assets and in-
frastructure all over the U.S.”
On October 10, 2002, Enron’s brand-new skyscraper, complete with an
eight-story-high trading floor, was sold for one-third of its $300 million cost to
help pay off some $50 billion owed to creditors.
As we write in 2002, the new “tallest” building, the Shanghai World Fi-
nancial Center, is under construction in China. Even higher towers are pro-
posed for India and New York. Investors should beware.
nied_c05.qxd 1/24/03 10:31 AM Page 149

150 Practical Speculation
Our friend Don Siskind, one of the most respected real estate attorneys
on Wall Street, singled out the Lloyds of London building, Drexel Burnham
Lambert’s 7 World Trade Center offices, and David Paul’s savings and loan in
Miami as prime examples. “All of the foregoing took more or less the shape of
a phallic symbol,” he noted.
A great new building can indeed put spring into the step. As an unnamed
Alcoa executive put it in a 1953 interview with Architectural Forum:
We used to think of ourselves as a staid, conservative sort of company. But you
should look at us now! Working in the most experimental office building in the
U.S. suddenly put all of us into a really daring, youthful, experimental frame of
mind. I think we all started to perk up.23
An Architect’s Opinion
For further insight into the phenomenon, we consulted William Mitchell,
dean of the School of Architecture and Planning at the Massachusetts Insti-
tute of Technology, in an interview and series of e-mail exchanges. In a semi-
nal December 1997 Scientific American article titled “Do We Still Need
Skyscrapers?” Mitchell had argued that the computer and telecommunication
revolutions have reduced the need to keep centralized paper files and assem-
ble office workers in expensive downtown locations. After the destruction of
New York’s World Trade Center on September 11, 2001, his ideas seem re-
markably prescient.
We found Professor Mitchell in an office stacked with skyscrapers of
bookshelves twice his height. (The intensive use of capital in the form of book
stacks in the very valuable and limited space available in the office provides a
nice metaphor of one of the major findings in urban economics: The more
valuable the land, the more economical it is to build higher buildings, so as to
concentrate capital and labor.) It turned out that the professor is a man of
many hats as well as provocative theories. He writes a book every year or two,
serves as dean of the school, teaches a few classes, and serves as architectural
advisor to the president of MIT on a massive half-billion-dollar center for
computer, information, and intelligence sciences.
The World Trade Center attack, Mitchell said, highlighted yet another ar-
gument against skyscrapers: security concerns. Vulnerability to natural disas-
ters also argues for decentralization.
Sparks flew when Vic, who named four of his six daughters after Ayn
Rand heroes, asked what Mitchell thought of Howard Roark, the architect
hero of The Fountainhead.24 Mitchell responded by recalling the book’s final
nied_c05.qxd 1/24/03 10:31 AM Page 150

Chapter 5 • “We Are Number One” 151
scene, where Roark stands proudly atop an immense skyscraper that he has
designed, gazing haughtily down at the lesser mortals, as an example of ab-
surd megalomania. “I’m more inclined to believe that great architecture
comes from listening well, being sensitive to the nuances and messy com-
plexities of everyday life, carefully solving real problems, and showing a little
humility.” Roark, however, saw architecture as the pure, heroic expression of
an individual’s will.
We pressed Mitchell for examples that support his assertion that sky-
scrapers were becoming dysfunctional. Since his daughter is attending New
York University’s Stern School of Business Administration, we asked him to
imagine what he might say to her graduating class about the lessons architec-
ture holds for investors.
“Skyscrapers,” Mitchell said, “exist essentially to exploit concentrations of
infrastructure and population in urban centers.” Downtown land is expen-
sive, so there is a motivation to build as high as possible to reap the maximum
return on investment. “But, the higher you build, the greater the proportion of
each floor that must be devoted to structure (holding the building up and pro-
viding resistance to wind) and to vertical circulation (elevators, pipes, and
ducts). No matter how valuable the site, you eventually reach a point where it
makes no economic sense to add another floor. It is technologically possible
to go beyond this point, but the reasons for doing so are ones of pride and
prestige, or bragging rights about being “the tallest.” Manhattan’s World
Trade Towers and Kuala Lumpur’s Petronas Towers are clear examples of
skyscrapers that were pushed higher than the point of rationality in order to
gain attention and prestige.”
Investors, he went on to say, should take a good look at organizations that
seek the title of “the tallest.” “I suspect you would find that going for the title
of ‘tallest’ is a pretty good indicator of CEO and corporate hubris. I would look
not only at ‘tallest in the world,’ but also more locally—tallest in the nation,
the state, or the city. And I’d also watch out for conspicuously tall buildings in
locations where the densities and land values do not justify it; skyscrapers
make a lot more sense in Hong Kong than they do in Omaha.”
“When it comes to buildings,” he concluded, “bigger may be better, but
biggest usually isn’t best.”
Best Use, or Boast?
Despite the appealing plausibility of Professor Mitchell’s theo-
ries and the great esteem we felt for him, we agreed that a
nied_c05.qxd 1/24/03 10:31 AM Page 151

152 Practical Speculation
quantifiable test was in order. After all, surely there are companies that build
tall office buildings not out of hubris, but in the normal course of business. The
question is whether very tall downtown buildings represent uneconomic hubris
that will ultimately lead to comeuppance in the stock market, or merely a ra-
tional attempt to make the most of valuable land by maximizing the number of
face-to-face meetings between bankers, lawyers, accountants, and traders.
Thus, we found ourselves once again taking up our fa-
vorite tools, the pencil and the back of the envelope, to do
some counting. This approach is highly recommended not
only for testing theories about tall buildings but for testing any
other theories or conventionally accepted views about markets.
For our test, we used skyscrapers named for publicly traded companies in
a list published by the Council on Tall Buildings and Urban Habitat of the 100
tallest buildings in the world. The results show that in the cumulative one-
year, two-year, and three-year periods after completion of the buildings, the
stocks performed 9, 19, and 22 percentage points, respectively, worse than the
Dow Jones Industrial Average (see Table 5.3).
The past decade’s trend for very tall towers in Asia provides further sup-
port for Mitchell’s argument. In 1990, all the 50 tallest buildings were in the
United States; in 2002, after the destruction of New York’s World Trade Cen-
ter, six of the 10 highest are in Asia. We need not elaborate on just how mis-
erable a decade the 1990s was for Asian stocks.
The situation is actually even more unfavorable for tallest-building com-
panies than appears at first glance. Many skyscrapers that in their day were
among the world’s tallest have been torn down or destroyed. In most cases, this
occurred in conjunction with the failure of the company that built them. The
Singer Building, built in 1908, the Manhattan and the Central buildings, both
built in 1930, and the New York World building, built in 1890, no longer exist.
One of the problems with architecture in general, and tall buildings in par-
ticular, is that the occupant’s fortunes and needs are likely to change over the
years from design to finish. Buildings designed to give the best and brightest
lawyers, engineers, financiers, and accountants a place to exchange ideas face-
to-face are strangely out of date in an age when many of these specialists pre-
fer working out of some rural paradise with high-speed telecom links instead
of taking a two-hour commute to a congested urban center.
Thus, architecture is subject to the same law of ever-changing
cycles as the market.
Taking one consideration with another, the results on tall
buildings support the hypothesis that hubris is indicative of inferior subse-
quent stock performance.
nied_c05.qxd 1/24/03 10:31 AM Page 152

153
Date ofBuilding Year (%)
Company Completion 1 2 3
Commerzbank (CBK.GR) 1997 −21 −11 −29Dow 16 44 36NationsBank (Atlanta) (NB) 1993 −4 42 103Dow 2 36 72NationsBank (Charlotte, N.C.) (NB) 1992 −7 −10 33Dow 13 15 54Suntrust Banks (STI) 1992 3 9 57Dow 13 15 54U.S. Bank 1992 9 18 76Dow 13 15 54Mellon Bank (MEL) 1991 52 52 32Dow 5 18 21AT&T (T) 1989 −35 −14 12Dow −4 15 21IBM (IBM) 1988 −23 −7 −27Dow 27 21 46Bank One 1987 −7 35 16Dow 12 42 36NationsBank Plaza, Dallas (NB) 1985 −49 −61 −40Dow 23 25 40NationsBank Center, Houston (NB) 1984 26 −35 −51Dow 28 56 60First Interstate Bank 1983 −3 26 24Dow −4 23 51Transco 1983 35 42 11Dow −4 23 51Citicorp 1977 −12 −8 −18Dow −3 1 16John Hancock 1976 −11 −18 −28Dow −17 −20 −17Sears (S) 1974 −3 13 −3Dow 38 63 35First Interstate Bank 1974 0 7 33Dow 38 63 35Amoco 1973 0 −5 5Dow −28 0 18Transamerica 1972 −35 −56 −55Dow −17 −40 −16
(continued)
Table 5.3 How Stocks Did after Completion of a “World’s Tallest” Building(Cumulative 1-, 2-, and 3-Year Change versus Dow Industrials)
nied_c05.qxd 1/24/03 10:31 AM Page 153

154 Practical Speculation
The Magazine Cover Indicator
As our Florida attorney friend William Harrell points out, “Hubris goes out of
its way to let you know of its existence, while humility does not.” As media or-
ganizations depend on loudmouths for copy, we considered the question of
the performance of companies featured on business magazine covers.
“Whom the gods would destroy, they first put on the cover of BusinessWeek,”wrote Paul Krugman of Enron’s Kenneth Lay, in an August 17, 2001, article
for the New York Times.25 Krugman gave no data to support his conclusion,
and in typical fashion, used the anecdote to argue for decreased reliance on
markets and increased reliance on government intervention.
In fact, many CEOs have gone on to great heights after being featured by
BusinessWeek. What is needed to shed light on the subject is a complete enu-
meration of all companies featured on magazine covers during a sufficient
Date ofBuilding Year (%)
Company Completion 1 2 3
USX (X) 1970 −13 −11 −9Dow 6 22 1Bank of America 1969 −17 −10 17Dow 5 11 27General Electric (GE) 1933 0 18 40Dow 4 44 80Chrysler 1930 −29 −43 1Dow −53 −64 −39Woolworth’s 1913 1 −2 5Dow −31 26 21
Difference (Percentage
Points)
Average 1 year company performance −5.7Average 1 year Dow performance 3.3 9
Average 2 year company performance −1.2Average 2 year Dow performance 18.3 19.5
Average 3 year company performance 8.2Average 3 year Dow performance 30.3 22.1
Table 5.3 Continued
nied_c05.qxd 1/24/03 10:31 AM Page 154

Chapter 5 • “We Are Number One” 155
period of varying market conditions so we may draw statisti-
cally reliable conclusions, as well as compare the performance
of these companies to the market during relevant subsequent
periods.
Our study of Time’s Person of the Year awards, which go back to 1926,
does indicate a hubristic curse. The first company to receive the honor was
Chrysler in 1928. The following year, Time featured Owen Young, chairman
of General Electric. Both companies declined about 70 percent over the next
two years. The most recent executive to receive the Time award was Jeffrey
Bezos, founder of Amazon.com, on December 27, 1999. The online book-
seller’s stock declined 80 percent in the year after the award.
Only in bull markets, it seems, do companies and businesspeople make
the cover of Time. The only others we found were General Motors Chairman
Harlow Herbert Curtice in 1955, Cable News Network founder Ted Turner in
1991, and Intel Chairman and CEO Andy Grove in 1997. On average, the six
companies to receive the award declined an average of 10 percent in the next
two years, versus an average gain of 20 percent in the S&P 500 for the same
two-year period.
Because neither the BusinessWeek covers nor the Time awards were
numerous enough to permit statistically valid conclusions, we studied
every company featured on the cover of Forbes from 1997 through 2001. The
results show that companies perform about 5 percentage points worse
than the market in the month after making the cover, and in line with the
market over the subsequent five months. The one-month underperfor-
mance appears unlikely to have occurred by chance variation alone—
roughly 1 in 20.
The Stadium Indicator
The naming of stadiums comes to people’s minds immediately when they
think of corporate excess. A recent and vivid illustration came February 27,
2002, when Enron, having filed for bankruptcy protection, was forced to sell
the naming rights for Enron Field for $2.1 million to the Houston Astros,
with 27 years remaining on a $100 million contract. “Enron went into bank-
ruptcy and caused a great deal of pain for their employees and people who did
business with Enron,” Astros owner Drayton McLane explained during a
Houston press conference. “Their name really didn’t have the connotation
that we wanted.”26
nied_c05.qxd 1/24/03 10:31 AM Page 155

156 Practical Speculation
The stadium jinx has been widely noted. The Wall Street Journal, inspired by
the unfolding Enron debacle, published a lead article in December 2001 about
the inordinate tendency of companies to suffer bankruptcy, financial difficul-
ties, or drastic declines in market value after naming stadiums after themselves.
Enron, TWA, PSINet, and Fruit of the Loom went out of business under the
“stadium jinx,” while CMGI Inc., Savvis Communications, 3Com, and Conseco
merely showed stock price declines ranging from 85 percent to 92 percent.27
Chris Isidore, a sports-business columnist at CNN/Money, created a Sta-
dium Sponsors’ Stock Index after Enron’s bankruptcy filing. The index
tracks 50 publicly traded companies that have paid to put their names on sta-
diums. The index fell 34 percent in 2002, 11 percentage points worse than
the S&P 500 Index.
Corporations are beset by the same harmful tendencies as investors.
When they are at their peak, they reach for the sun. The stadium itself is not
only an example of a wasteful expenditure unrelated to the company’s pri-
mary activity; it also signals boastfulness, excessive pride, and a resulting lack
of focus.
The problem is that all studies of stadiums that we have
seen are anecdotal in nature. The lists of stadiums tend to be
incomplete, with no source cited, and often leave out great
rises in stocks after renaming deals. Qualcomm (San Diego
Padres), General Motors (Vancouver Canucks), PepsiCo (Denver Nuggets),
and Compaq Computer (Houston Rockets) all named stadiums after them-
selves, and all are still very much alive and kicking.
We performed a systematic study of the stadium jinx. The
Almanac of Architecture and Design contains a complete list for
all Major League baseball, football, hockey, and basketball sta-
diums, including data on cost, capacity, architecture, and com-
pletion date.28
We went to the Web sites of the companies and found the year the re-
naming took place. We then constructed Table 5.4 showing the performance
of 31 companies from the year of acquisition of naming rights to three years
thereafter. The results indicate that during the year of naming and in the sub-
sequent year, the companies performed significantly worse than the S&P 500.
However, in the second and third year after the naming, the results are mixed
to bullish. The results were helped by Qualcomm’s 2680 percent gain in the
second year.
Like most transactions in life and markets, acquisitions can be very good
or very bad. For an acquired company, a good acquisition lets the owner cash
nied_c05.qxd 1/24/03 10:31 AM Page 156

Chapter 5 • “We Are Number One” 157
in and enjoy a profit—the self-interested, wholly appropriate incentive for
starting a company in the first place. For the purchaser, a good acquisition
provides an opportunity to save on costs, to improve marketing or to invest
capital at higher returns than are available internally.
At worst, an acquisition is a desperate attempt by the seller to unload bad
merchandise based on adverse private information, or an effort by the acquir-
ing company to create a facade of enhanced profitability.
Most acquirers, we hasten to say, would never dream of succumbing to
the alluring temptations that come with acquisition accounting. But some
find that a steady stream of purchases much improves their ability to deliver
the consistent quarterly growth so dear to analysts, and they are not averse to
painting the lily for temporary advantage.
Nothing improves a corporation’s ability to manipulate earnings like a
series of acquisitions. With a few flourishes of the pencil, a chief financial
officer can find a cornucopia of profits in an acquired company’s earnings,
pension plans, medical plans, and assets held on the balance sheet below
market price.
In Table 5.5, we show the results from our statistical test of what
numerous or infrequent acquisitions signal in a relatively homogenous
sample of large buyers—the companies that make up the S&P 100 index.
After reporting the results, which seem to support the virtue of abstemious-
ness on the part of large companies, we share some insights for acquirers
and investors from a highly successful serial acquirer of privately held
companies.
For more than 50 years, accountants have been trying to create rules that
will make acquisition accounting fair. The Financial Accounting Standard
Board’s 2001 ban on “pooling of interest” accounting in mergers is a recent
example. (Without pooling, companies must amortize the premium, or
“goodwill,” they paid for the target company over a period of years, thereby de-
pressing earnings.) But as in all arms races, acquirers—and their consultants
and experts—are vigorous in mounting new attacks and finding new ways to
put the best foot forward.
With investors paying more attention these days to accounting treat-
ments, we are fascinated by the possibility of developing statistical profiles of
serial acquirers versus abstainers. Might a predilection for acquisitions be a
sign of hubristic overconfidence in the company’s ability to
run other businesses? Are abstainers unusually confident in
their ability to run their businesses without benefit of acquisi-
tions? Because these questions are difficult to test, we started
nied_c05.qxd 1/24/03 10:31 AM Page 157

158
Table 5.4 The Stadium Indicator: Naming Rights and Stock Returns
Difference with S&P 500Return Percent
Naming Naming 1 Year 2 Years 3 YearsStadium Ticker Rights Year After After After
The Target Center TGT 1990 −3.5 −20.8 −4.2 −27.3The Delta Center DAL 1991 −7.7 −40.7 −43.3 −48.5America West Arena AWA 1992 −86.0 28.0 666.6 1502.8The United Center UAL 1994 −38.6 −9.8 12.4 45.4Coors Field RKY 1995 −2.0 −47.9 −12.8 69.3The Fleet Center FBF 1995 −8.2 −7.2 20.7 8.4General Motors Place GM 1995 −8.6 −28.9 −59.0 −88.3Key Arena KEY 1995 10.9 40.7 72.0 −11.6Trans World Dome TWA 19953com Park COMS 1995 46.7 123.3 −75.8 −93.8Continental Airline Arena CAL 1996 9.6 63.7 −45.6 −34.5Ericsson Stadium ERICY 1996 34.5 33.8 45.9 435.2Edison International Field EIX 1997 5.8 −25.7 −66.6 −99.6Qualcomm Stadium QCOM 1997 −4.4 −33.1 3414.4 1507.6Alltel Stadium AT 1997 −0.1 24.7 65.2 20.8Network Associates Coliseum NET 1998 61.3 −75.7 −124.2 −45.0Bank One Ballpark ONE 1998 −23.3 −86.6 −61.9 −39.2American Airline Arena AMR 1998 −34.3 −47.1 0.3 −40.7Safeco Field SAFC 1999 −61.6 −30.8 −20.9Conseco Fieldhouse CNC 1999 −61.1 −64.2 −78.8Pepsi Center PEP 1999 −33.3 13.8 25.7Staples Center SPLS 1999 −48.3 −66.8 −29.2Adelphia Coliseum ADLAC 1999 23.9 5.4 −25.2Fedex Field FDX 1999 −27.7 −17.8 22.9Mellon Arena MEL 1999 −20.4 35.7 16.0Gaylord Entertainment Center GET 1999 −20.1 −38.1 −11.7Comerica Park CMA 2000 37.3 44.6Enron Field ENE 2000 97.5 −76.8Xcel Energy XEL 2000 59.2 64.1PNC Park PNC 2001 −10.0American Airline Center AMR 2001 −30.1
Average −4.75 −8.58 148.13 180.05
Median −7.97 −19.29 −11.74 −27.27
Standarddeviation 39.86 50.47 695.60 513.15
% Up 33 39 44 41
# OB 30.00 28.00 25.00 17.00
Source: www.ballparks.com.
nied_c05.qxd 1/24/03 10:31 AM Page 158

159
Table 5.5 Paying the Piper for Serial Acquisitions: Purchases 1998–2001versus Performance January 1–July 12, 2002
PercentCompany Ticker Purchases Change
15 most acquisitiveGeneral Electric GE 66 −28.6Tyco TYC 32 −76.7Clear Channel Communications CCU 31 −33.9Citigroup C 28 −28AES AES 15 −79.6AOL Time Warner AOL 14 −59.1United Technologies UTX 14 −2General Motors GM 13 −4.1American International Group AIG 12 −20Microsoft MSFT 12 −21.7Wells Fargo WFC 12 −13.6Cisco Systems CSCO 11 −62.4Ford Motor F 11 −19.8Intel INTC 11 −40.2J.P. Morgan JPM 11 −16.9
Average % return −33.8
Companies with 1 acquisitionBank of America BAC 1 9Black & Decker BDK 1 13.9EMC EMC 1 −36.4Harrah’s Entertainment HET 1 19.1International Paper IP 1 1.5May Department Stores MAY 1 −18.2Medtronic MDT 1 −24.5Medimmune MEDI 1 −47.73M MMM 1 2.3Merck MRK 1 −22.5Oracle ORCL 1 −29.9Pfizer PFE 1 −19.2Pharmacia PHA 1 −23.6RadioShack RSH 1 −11.1Sears S 1 −2.4SBC Communications SBC 1 −24.3The Southern Co. SO 1 −0.2
Average % return −12.6
Companies with no acquisitionsAllegheny Technologies ATI 0 −14.1Ltd Brands LTD 0 11.4Anheuser-Busch BUD 0 8.8
(continued)
nied_c05.qxd 1/24/03 10:31 AM Page 159

160 Practical Speculation
with a modest preliminary study of the relation of acquisitions to stock per-
formance.
Taking the companies in the S&P 100 at the start of 1998, we counted the
number of acquisitions each made over the next four years, through 2001. We
came up with three groupings for comparison: the top 15 acquirers, com-
panies that made no acquisitions, and companies that made one acquisition.
We calculated their stock performance from January 1, 2002, through July 12,
2002. The results appear in Table 5.5.
As the table shows, serial acquirers underperformed abstainers by 19.1 per-
centage points, and they underperformed the S&P 100 by 12.8 percentage
points. Abstainers beat the S&P 100 by 6.8 percentage points.
The urge to merge can be good or bad, and each acquisition must be
judged on its merits. However, during the most recent four years, the urge
has been inversely related to year-to-date 2002 performance.
From long experience on all vantage points of the acquisition arena—Vic
founded and for 25 years spearheaded a very active mergers-and-acquisition
brokerage—we suggest that in certain types of markets, an acquisition might
offer the temptation to overstate earnings. If the truth comes out, the stock
may be hammered.
Table 5.5 Continued
PercentCompany Ticker Purchases Change
Avon Products AVP 0 3Baker Hughes BHI 0 −19.1Burlington Northern Santa Fe BNI 0 0.2Cigna CI 0 −3.7Norfolk Southern NSC 0 17.1Campbell Soup CPB 0 −19.4Nortel Networks NT 0 −95.5Colgate-Palmolive CL 0 −23.3Philip Morris MO 0 −6.4Delta Air Lines DAL 0 −65.3Raytheon RTN 0 7.3FedEx FDX 0 −3.8Toys R Us TOY 0 −10.4Gillette G 0 −13.5Xerox XRX 0 −38.1
Average % return −14.7
S&P 100 −21.5
nied_c05.qxd 1/24/03 10:31 AM Page 160

Chapter 5 • “We Are Number One” 161
Making Mischief with the Books
We have no knowledge of the accounting probity of any of the companies in
the news today. But we can say that, in general, most mischief begins with as-
sets held on the books of acquired companies at original cost. If the acquired
company bought the assets many years before, or if the assets are worth much
more than they cost (as must be assumed if they were bought at a premium),
then there is great potential for an acquiring company to sell off these assets
at the market price for a nice profit.
A second source of temptation is the potential boost to the acquiring com-
pany’s earnings from the acquisition. When a company’s stock is selling at 20
times earnings and it buys something at 10 times earnings, there is an imme-
diate pickup that can be calculated based on the number of shares and earn-
ings involved.
A third major line of misstatements is the prospect of writing certain
items up or down to advantage. The common practices of writing up goodwill
for tax purposes, or writing down pension obligations and medical plans of
the acquired firms, are treasure chests in this regard.
We emphasize that we have no reason to believe that serial acquirers are
any more prone to such temptations than those that acquire less frequently.
Multiple acquisitions are merely a possible signal, an area of concern in cer-
tain kinds of markets. Others, however, have come to similar conclusions. In a
classic 1986 study, “The Hubris Hypothesis of Corporate Takeovers,” Richard
W. Roll found that acquiring companies often perform worse than the market
after a deal, and that the motivation for the purchase thus could not rationally
be stock price appreciation. He posited that the main motivation would have to
be . . . hubris.29
To assist our readers in evaluating acquisitions, we are pleased to present
insights from a friend who is among the world’s leading experts in the sub-
ject: Vic’s partner of 35 years, Dan Grossman. Grossman has managed and
bought a wide variety of businesses and, through his law practice, has been in-
strumental in forming and developing many companies, including the drug
maker Syntex. Dan recently sold a number of his businesses profitably and is
writing a book about his adventures in the M&A business.
Advice on Acquisitions from Dan Grossman
• Avoid businesses requiring exquisite management. Buy a company
that regular people can run.
nied_c05.qxd 1/24/03 10:31 AM Page 161

162 Practical Speculation
• When evaluating an acquisition, picture what it will be like trying to sell
it. Look for the type of business that buyers, especially public com-
panies, will want to acquire.
• Avoid mixing acquisition analysis with some other need in your life.
Don’t look to acquire a company because it will get you involved with
golf or sailing, or because it is in a glamorous location, or because you
have been laid off and need a place to work. It is hard enough to be ob-
jective analyzing an acquisition on its own merits without throwing in
all kinds of personal needs and desires.
• Have a good accountant explain to you how inventory can be used to
juggle earnings, and why, for some companies, it is almost impossible
for a buyer to determine the accuracy of reported earnings for a given
year.
• Time is the friend of a growth company and the enemy of the bargain
or value company. The longer you are going to own, the more impor-
tant to pay up for growth.
The results of our preliminary study on acquisitions may unduly reflect
the unusual pessimism of the current stock market. Yet given the sad fates of
serial acquirers over the past few decades—the conglomerates, the rollups,
and all the companies that became marquee names in the market value rank-
ings by paying princely sums of their own soaring stock for tiny, unprofitable
companies—it does not seem inappropriate to conclude that both acquirer
and investor should be on guard when reaching for the stars.
Lords on Boards
The hiring of celebrities as marketing tools is often associated with hubris in
the executive office. RJR Nabisco put golf pros on the payroll before being
bought by KKR (another act of hubris that brought on a long period of under-
performance for the company). Kmart’s association with Martha Stewart,
Kathy Ireland, and Jaclyn Smith did it no good. Even in bankruptcy, Kmart
continued the same losing strategy, announcing in April 2002 that it had hired
the Creative Artists Agency to get its name and products placed in movies.
We tested this phenomenon systematically in September 2001 by study-
ing the relation between stock returns and the number of board members
with titles in the 50 largest companies by market value in Britain’s FTSE 100.
(We counted knights, baronesses, earls, a viscount, a lady, and a dame, along
with lords and right honorable lords. We awarded an extra point if the chair-
man was a lord.)
nied_c05.qxd 1/24/03 10:31 AM Page 162

Chapter 5 • “We Are Number One” 163
We then listed the companies’ five-year stock performance, eliminating
three that had not been around long enough in their present form. It turns
out that the more lords on board, the worse the stock performance over the
previous five years.
Our observations on the relationship of lords and earnings raise the ques-
tion of which way causality runs. Was it the lords who caused the lackluster
performance or the lackluster performance that prompted the companies to
use lords as window-dressing?
HSBC Holdings, the fourth most valuable company in the FTSE 100, had
the greatest number of lords—seven titled board members and a knighted
chairman, Sir John Reginald Hartnell Bond.
Eight of the 10 largest FTSE 100 companies had at least three lords. The
largest, BP (formerly British Petroleum), has four lords. GlaxoSmithKline, the
second largest, has six lords on board and a knighted chairman. About half
the companies have between one and three lords. The largest company with-
out lords was insurer CGNU, No. 13 on the FTSE.
We also invented the earnings/lords (E/L) ratio—a measure of attractive-
ness along the lines of the price/earnings (P/E) ratio.
A small or negative numerator (earnings) and a high denominator (lords)
would result in a small or negative ratio. For example, HSBC made 75.5 cents
a share last year and has eight lords on board. Therefore, it has an E/L ratio of
0.09, putting it in the bottom third of the companies with both lords and prof-
its. Powergen plc, with one lord and $1 of earnings per share, has it the high-
est E/L ratio. Cable & Wireless lost 93 cents a share last year, and has three
lords on board; thus, its ratio is negative.
We hypothesize that investors might want to stay away from companies
with small or negative earnings/lords ratios. However, our observations are
merely a first step toward defining the market implications of ossification ver-
sus innovation. Proper testing of this idea would require the analysis of sev-
eral years of data unavailable in computer databases. In the spirit of science,
we hope that our efforts will form the basis for further study.
Summing It All Up in Iambic Pentameter
After quantifying the market effects of executive boasting, flashy headquarters
buildings, magazine cover stories, stadium deals, and big acquisitions, we con-
clude that such instances of hubris can send a company’s stock plunging. We
suspect that corporate golf courses (Lucent), opulent offices (RJR Nabisco),
moves to Florida (Scott Paper), sex scandals (General Electric, Bendix), and
nied_c05.qxd 1/24/03 10:31 AM Page 163

164 Practical Speculation
executive pay exceeding $100 million a year (General Electric, Apple, Siebel
Systems, Oracle, Cisco) might be profitable areas for future hubris tests.
The Greeks believed that the stately and portentous language of iambic
pentameter, which corresponds to the emotional heights of human speech,
enhances the impact of tragedy. (An iamb is a weak syllable followed by a
strong syllable, and iambic pentameter contains five weak-strongs to a line,
with many artistic liberties taken.) We will therefore close with some heroic
verses by Victor’s daughter, the producer and writer Galt Niederhoffer, whose
coming-of-age novel American Thighs is written in iambic pentameter:
Hubris is on everybody’s mind of late
Humility seems like a memory.
It seems that only yesterday that
Enron’s chairman, Kenneth Lay
Did boast of feats unmatched in a decade:
“We’ve grown nine-fold to $40 billion
And we’ll do it again before too long.”
A messenger from the EconomistWas witness to his grandiosity
Reporting on the New Economy
He found in Enron the epitome.
So often history repeats itself
And so was Cisco twinning over times
Referring to its staunch predecessors
As relics of the Old Economy
Behold, not more than 12 months ago,
Cisco offered its own grand prophecy
Predicting 30 percent to 50
Though such growth occurs mainly in tragedy
So diminished is the growth of tech firms now
The media now calls them shriveled men.
nied_c05.qxd 1/24/03 10:31 AM Page 164

165
6 B E N J A M I N G R A H A M :M Y T H I C A L
M A R K E T H E R O
When Benjamin Graham died at age 82, he was one of the
great legends of Wall Street, brilliant, successful, ethical—the
man who invented the discipline of security analysis. Now, 20
years after his death his memoirs are reaching the public at
last—a hugely successful chronicle of one of the richest and
most eventful lives of the century.
—Kirkus Review, June 9, 1996
The ancient Greeks had Hercules, the mighty hero deified by Zeus for
noble deeds and worshipped by men. In the twenty-first century, Ameri-
cans have Benjamin Graham.
Tales of the prowess of Hercules—and his promiscuity—passed from
generation to generation in Greece. The modern hero of the investment world
has similar characteristics and impact. On the Internet, we found thousands of
nied_c06.qxd 1/24/03 10:25 AM Page 165

166 Practical Speculation
articles eulogizing Graham and not a single one with any negatives. The most
frequent epithets: “father of security analysis,” “a prophet,” “the legendary in-
vestor,” “founder of value investing,” “master of the investment game,” “the
Confucius of value investing,” “pioneer of value investing,” and “the revered
mentor to the most successful investors of all time.” Graham is said to have
amassed a fortune by following a method of buying stocks selling below half
their net cash liquidation value. The method is outlined in Graham and Dodd’sSecurity Analysis, a book widely known as the bible of value investing.1
Graham’s followers include such famous and successful investors as his
former student Warren Buffett, who was active during his mentor’s lifetime
in leading worshipful tributes to him. “We are here for only one reason,” Buf-
fett said on a cruise with Graham that he organized for wealthy investors, “to
listen to the wisdom of Benjamin.”
Like most legends, many of these encomiums are half-truths
at best.
Illusory Bargains
Let’s start with the difficulties of buying companies at 50 percent of net cur-
rent asset value. Common sense would tell you that if a business were selling
at half its net liquidating cash value, the major owners or the chief executive
or their friends or the company’s bankers or accountants would quickly buy
the stock for themselves and their families and good friends, and then liqui-
date immediately at a beautiful premium.
Vic operated one of the most extensive merger-and-acquisition busi-
nesses in the United States for more than 35 years. In the course of his busi-
ness, he visited tens of thousands of privately held companies. He never
found a single one available for such a price. Nor has anyone else he knows of.
The stock exchange in the 1930s seemed to offer such bargains. However,
high commissions and wide spreads between bid and ask prices made the
bargains illusory.
Modern companies that seem to have Graham-type characteristics and
have not been gobbled up are mere will-o’-the-wisps, luring investors to buy
them with bad news likely to follow. We, and all others we know of, have been
victimized much more often than we have profited by trying to grab at such
ephemera. A recent notable example came when we bought Aether Systems,
a company with $50 cash value per share that was selling for only $30. Aether
lost money at such a remarkable rate that the stock slid to $2 soon after we
bought it. The cash value fell right along with the stock price. Vic’s daughter,
nied_c06.qxd 1/24/03 10:25 AM Page 166

Chapter 6 • Benjamin Graham: Mythical Market Hero 167
Katie, bought that one on Vic’s recommendations, and the resulting loss
quickly sobered her on her budding career as a value stock picker and sent her
back to finish up her PhD in psychology.
Buffett also felt the lure of seemingly irresistible discounts from book
value. In the early days of his career, he used to like to buy such companies.
Everybody in the merger business has oodles of them for sale: There are re-
gional department stores in declining towns, distributors of American steel
products doomed to be displaced by imports, producers of machinery for tex-
tile firms and other manufacturing businesses in the declining stage of their
life cycles, which require huge capital investments merely to compete with
more economical modern substitutes.
Certainly the tax loss provided by Berkshire Hathaway allowed Buffett to
make plenty of such acquisitions and must have been helpful in accumulating
wealth for himself and his stockholders. Finally, however, Buffett’s attorney,
Charlie Munger, the legendary “Charlie” who shares the dais with him at
Berkshire Hathaway’s annual meetings in Nebraska, told him in effect to stop
buying dying dinosaurs. As Charlie pointed out to Buffett, such companies
tied up capital endlessly, consistently lost money, and were never able to be
sold at higher prices than Buffett had paid for them, because nobody else
wanted them.
When Vic was in the mergers business, he found that most acquirers
share Charlie’s views. He was never so lucky as to find buyers who would
reach for bargains regardless of future profits. Thus, when the mass market-
ing techniques that Vic used netted companies for sale in such fields as shoe
manufacturing, retail candy stores, carpets, and so forth, he would regretfully
tell the owners that he was unable to find the right potential partner for them,
and that he would be happy to refer them instead to an employee stock own-
ership specialist. For a typical melange of companies that Vic found he could
not sell, see the companies owned by Berkshire Hathaway, listed in the com-
pany’s annual report.
Like Buffett, Vic found that the owners of such companies always were
willing to work for the new owner at salaries much lower than they currently
were receiving—if the new owner did not interfere with their “entrepreneurial
drive and independence,” as Buffett puts it. The only mustache on the picture
was that these owners would only work for the low salary until they received
the highly inflated price they had agreed to sell for, or until the company came
into some incredible good fortune that enabled it to rise from the grave.
Another basic problem with Graham’s approach is that, in both theory
and practice, investors are paid to lend capital to businesses that are growing
too quickly and earning too high a rate of return on their equity to finance
nied_c06.qxd 1/24/03 10:25 AM Page 167

168 Practical Speculation
their opportunities for investment from internal sources or borrowing from
banks. Companies selling at discounts tend to be those that are not growing
businesses. By avoiding investment in such companies, one forgoes the extra
returns that are in fact available.
This is all for the good. Companies tend to prosper if they produce things
for which there is unsatisfied demand by responding to constantly shifting and
unfathomable consumer tastes and thereby giving us the goods we want in the
quantities we desire. An invisible hand tends to create incentives for people to
make money, while at the same time bettering our material well being. This
idea was first memorialized in 1776, by Adam Smith in The Wealth of Nations,developed further in Principles of Economics by Alfred Marshall 100 years later,
and has since been featured in the introductory chapters of most economics
texts. The economics texts of the 1950s and 1960s were notable exceptions, as
they presented the invisible hand and the incentives as mere capitalist ration-
alizations for an evil system. It is our impression that those followers of Gra-
ham who have been to college were weaned on such texts.
Performance Test
Considering the great gap between Graham’s theory of value investing and the
chances of putting it into practice, it is not surprising that performance of the
funds he managed was not as attractive as legend would have it. The universally
revered apostle of prudent investing was devastated after the crash of 1929.
After finishing 1928 with a 60 percent return, he lost 20 percent in 1929. He
lost 50 percent more in 1930. In 1931, he lost 16 percent. In 1932, much to the
relief of his investors, he lost a mere 3 percent. Journalist Janet Lowe, in Ben-jamin Graham on Value Investing: Lessons from the Dean of Wall Street, wrote:
Though Graham was able to stumble back and regain his footing in the market
rather quickly, after Black Tuesday, Ben’s high-risk days were over. Afterward, he
struggled to squeeze the best possible return from his investments, while at the
same time seeking that wide margin of safety. The average returns on Ben’s port-
folio descended from the heights of the pre-Depression years.2
Graham always believed that a Dow of more than 100 was too high, and
when it got there, he never again felt comfortable in the market. As the Dow
never fell below 100 after 1942, Graham was always leaning toward being too
defensive. In the early 1950s, when the Dow was about 300, he began to pull
back from his business and advised his students against going into investing:
nied_c06.qxd 1/24/03 10:25 AM Page 168

Chapter 6 • Benjamin Graham: Mythical Market Hero 169
The market was “too high.” Because he believed for so long that the market
was overvalued, his investment performance did not measure up to a buy-
and-hold strategy or any other sensible alternate strategy. In 1956, the year the
Dow topped 500 for the first time, he left the business for good and devoted
himself to a life of pleasure.
One of the most curious—and murkiest—aspects of Graham’s perfor-
mance record is the question of how much his success was attributable to
Geico, the insurance company he later sold to Buffett. Graham wrote in TheIntelligent Investor that the one investment he made without following his own
methods was the purchase of Geico.3 It is likely that the returns he realized
from Geico were much greater than the total returns he realized by applying
his own methods. The insurer has also been the mainstay of Buffett’s success,
providing copious cash float for arbitrage transactions.
One thing we do know about the returns from following Graham’s meth-
ods. In 1976, a student founded a mutual fund devoted to putting Graham’s
theories into practice. It was called the Rea-Graham fund. When the fund was
liquidated or merged in 1998, it was worth $3.6 million in assets. In this day
and age, where a fund manager with a good story can often start with $500
million in seed capital and attract billions more with just a few successful
years, the ending total assets of this fund shows that its actual performance
was meager at best.
Table 6.1 shows how $10,000 invested in the Rea-Graham
fund at its inception in 1976 would have fared versus the
S&P 500.
Thus, we can summarize the performance in practice of Graham’s
method as follows: His performance was disastrous in the 1930s when he liq-
uidated. He started again in the late 1930s and got out of the market in 1956,
missing the move from Dow 500 to Dow 1000 over the next 20 years. A fund
that put his methods into practice from 1976 to 1996 underperformed the
S&P 500 by a factor of 4 to 1.
Value’s Dismal Performance
On the surface, Graham’s message to buy value stocks seems perfectly reason-
able. Who does not want value for his money? But there is one small problem:
Contrary to widespread belief, value stocks have consistently underperformed
growth stocks since at least 1965. The evidence was provided, quite by chance,
by the venerable research firm Value Line.
nied_c06.qxd 1/24/03 10:25 AM Page 169

170 Practical Speculation
Unintentional experiments often are provided by the gods to allow mortals
to see the light. John/Joan, who lost his penis in circumcision as an infant, was
raised as a girl. His twin brother was raised as a boy. The outcome was that
Joan acted just like a boy, and eventually reassumed the identity of a boy.4
The gods of investment provided a similar unintentional experiment to
determine which class of stocks provides better long-run returns: value or
growth. Value Line is an admirable service whose research director, Sam
Eisenstadt, is a young-hearted person who always looks to improve his own
knowledge and the products he provides his customers, despite the firm’s
great track record. In 1965, prompted by gains in value stocks and by Sam’s
desire to offer clients an alternate rating system, Value Line started selecting
Table 6.1 Rea-Graham Fund Performance versus S&P 500 (Dividends Reinvested)
Starting Investment = $10,000 (June 30, 1976)
Period Ending Rea-Graham ($) S&P 500 ($)
12/31/76 10,846 10,51312/31/77 11,194 9,75812/31/78 12,355 10,39412/31/79 14,362 12,31212/31/80 15,837 16,31212/31/81 18,391 15,5168/19/82 18,856 13,8203/31/83 23,035 20,7343/31/84 23,789 22,5343/31/85 26,928 26,7743/31/86 34,380 36,8143/31/87 37,602 46,4553/31/88 38,273 42,5643/31/89 41,182 50,2343/31/90 43,101 59,8743/31/91 43,478 68,4733/31/92 45,797 76,0023/31/93 49,662 87,5483/31/94 48,213 88,8253/31/95 48,291 102,6273/31/96 54,005 135,4703/31/97 57,467 162,2903/31/98 65,215 240,0009/30/98 57,709 223,29011/15/98 60,898 247,606
]
nied_c06.qxd 1/24/03 10:25 AM Page 170

Chapter 6 • Benjamin Graham: Mythical Market Hero 171
the best value stocks in their universe. The firm divided its sample of 1,500
companies into 10 groups based on value, updating the selections each
month. The selection system used the same key variables that
almost everyone else uses to define value stock (i.e., price to
sales, price to book, and price to earnings). But there was one
difference that today, almost four decades later, makes all the
difference in evaluating the stocks’ long-term performance. In contrast to ret-
rospective studies of value stocks, the Value Line companies were selected
contemporaneously. Thus, the Value Line value stock performance record is a
real-life unintentional experiment with no back-testing, survivor bias, or arm-
chair quarterbacking.
The procedure has remained the same since 1965. Each group is up-
dated each month. Results are reported every six months in Value Line’s Se-lection and Opinion publication. The one problem is that the firm reports
price appreciation rather than return, and our studies have shown that the
dividend yields of value stocks are 2 percent higher, on average, than those of
growth stocks.
We report the results of the experiment in Figure 6.1 and Table 6.2.
Value Line Group 1, consisting mainly of growth stocks, quickly outpaced the
three value stock categories. By March 2002, the growth stocks had returned
almost 28 times the return of the best-performing “value” group, “low
Figure 6.1 Value versus Growth
April Totals for Each Year
Gro
wth
of $
100
Inve
sted
(Div
iden
ds R
einv
este
d)
1965 1969 1973 1977 1981 1985 1989 1993 1997 2001
GROUP 1
LOW P/SLS
LOW P/E
LOW P/BK
0
10,000
20,000
30,000
40,000
50,000
60,000
70,000
nied_c06.qxd 1/24/03 10:25 AM Page 171

172 Practical Speculation
price/sales.” (How Value Line came to be capable of such calculations is dis-
cussed in Chapter 10.)
Certain aspects of Graham’s life do have a mythical quality. After the
tragic suicide of Graham’s son in France, Graham traveled from his home in
California to collect the deceased’s belongings. On arriving, he fell in love with
his late son’s girlfriend, Marie Louise. As Graham was already married, he
suggested to his fourth wife, back home in California, that she share him with
his new amour. Much to Graham’s wife’s distress, she thenceforth saw her
husband only six months out of every year. The tale has odd echoes of Zeus’
philandering and Persephone’s annual six-month descent into the underworld
to be with her husband, Hades, lord of the dead, during the winter months.
Belief in Zeus and the feats of Hercules eventually dwindled into in-
significance. We suspect that the legendary father of value investing will be
treated no better by the gods.
Table 6.2 Value versus Growth (Dividends Reinvested)
Group 1 Low Price/Sales Low P/E Low Price/BookStarting Value 100 100 100 100
January 1970 216 191 205 188January 1980 2,782 815 1,450 1,086January 1990 16,540 1,326 3,034 1,296March 2002 46,885 1,698 1,555 1,250
nied_c06.qxd 1/24/03 10:25 AM Page 172

173
7 N E W S F L A S H :C O M P U T E R W R I T E S
S T O C K M A R K E T S T O R Y !
The foundation of all morality is to have done, once and
for all, with lying; to give up pretending to believe that for
which there is no evidence, and repeating unintelligible propo-
sitions about things beyond the possibilities of knowledge.
—Thomas Henry Huxley1
We are all familiar with the truth of the proverb that one lie begets an-
other. Assertions have implications. When implications turn out to
be false, obfuscation, or “further-putting-into-perspective,” is necessary to ex-
tend the original lie.
Nowhere is this principle better seen than in the typical story on daily
market moves in the financial media. These stories are generated with a sim-
ple formula:
Stocks (rose/fell) on (earnings/interest-rate) (optimism/pessimism)
nied_c07.qxd 1/24/03 10:20 AM Page 173

174 Practical Speculation
The possible combinations are limited, but well within the capabilities of
reporters without much trading experience or statistical knowledge:
Stocks rose on earnings optimism. Stocks fell on earnings pessimism.
Stocks rose on interest-rate optimism. Stocks fell on interest-rate pes-
simism.
A fancy report will combine the two:
Stocks fell on expectations that rising borrowing costs will cut into corpo-
rate earnings.
Stocks rose on expectations that lower borrowing costs will boost corpo-
rate earnings.
The assumption about the earnings-market return relation in this formula
is, as readers know by now, completely fallacious. As shown in Chapter 2, the
time to get ready to buy is exactly when earnings look worst, and the time to
sell is when earnings look best. But there is another aspect to these formulaic
stories: Although human beings write these reports according to the blueprint,
the stories could just as well be done with a computer. In fact, we have
patented a Market News-O-Matic program and debut it later in this chapter.
But back to the blueprint. Once the ball is rolling, the reporter is bound to
continue down the fallacious track to fulfill the market’s never-ending need
for promotional material and contributions from the public. The next step,
therefore, is to introduce a money manager. She just sold her position in an
industry based on lowered earnings expectations. (You must know about her
so that you can buy her fund, or sell that stock yourself, or possibly hire that
prescient fund manager in the future.) If all the fund managers in the re-
porter’s Rolodex are busy on TV, the statement can always be attributed to
“some investors.”
Next, the reporter will attempt to find a quote pertinent to the chosen
theme from one of the Federal Reserve officials or government economists
who are always giving a speech somewhere on any given day. If the Fed chair-
man himself is speaking, the story practically writes itself. “Declines deepened
after Federal Reserve Chairman Alan Greenspan said consumer spending,
which makes up two-thirds of demand in the U.S. economy, won’t increase as
much as it has following past recessions,” ran one story from a major wire ser-
vice. This statement “cast doubt on how much an economic recovery will fuel
corporate profit growth.” Bingo! The reporter has succeeded in working the
chairman’s words into support for the earnings fallacy embedded in his story’s
lead paragraph.
nied_c07.qxd 1/24/03 10:20 AM Page 174

Chapter 7 • News Flash: Computer Writes Stock Market Story! 175
Next comes an enumeration of a list of companies whose
stocks declined that day after analysts cut forecasts on their earn-
ings. Propagandists call this card stacking; the reporter, apparently
heedless of the worthlessness of anecdotal evidence, presents this list as con-
firmation of his theme.
The reporter’s unconscious work on behalf of the market is now com-
plete. He has allowed a manager to tout her fund. He has provided, based on
a series of extrapolations that are possibly incorrect, an analysis of a statement
by the chairman of the Federal Reserve. He has completely tied up the in-
vestor in specious conclusions. More important, he has encouraged investors
to be fearful and to overtrade. For good measure, he has publicized names of
brokerages available to assist investors in their overtrading.
Harm Done
Such stories are completely worthless to anybody who trades. They are purely
descriptive, anecdotal, and backward-looking. They are harmful to anybody
who trades on the assumptions they contain. But the damage does not end
with the hapless investor. If current earnings strength is the key to market
moves, by natural extension the main job of corporations is to construct and
deliver a steady stream of favorable earnings comparisons. Can anyone doubt
that the string of 35 positive earnings comparisons in General Electric, with
the skepticism it engenders about the underlying process, as well as the mas-
sive attempt by companies like Enron to sell debt (which is good for corporate
earnings per share but bad for survivability), has poisoned the atmosphere of
the early Naughties?
You might think that there would be checks and balances on such pro-
paganda because of the obvious harm. Scholars might undertake an aca-
demic study of the phenomenon, and some enterprising reporter might
publicize the results to puncture the ballyhoo. But most academics have
axes of their own to grind. Even to read the most basic academic journal
relating to economics or finance these days requires membership in a
postadvanced-calculus, postadvanced-econometrics, postcanned-computer-
program-using club that only professional economists who registered for
all these courses in their postdoc education could hope to unravel. Even if
academics communicated their conclusions in language that laypeople
could decipher, the information would not be of much use. By the time a
nied_c07.qxd 1/24/03 10:20 AM Page 175

176 Practical Speculation
study goes through the usual rounds of peer review and publi-
cation in an academic quarterly, a few years will have passed,
and the cycle is likely to have changed.
Part of the harmfulness of a lie is that it crowds out other statements that
might add to knowledge. Many investors undoubtedly know that selling stocks
on bad news, earnings-related or otherwise, and buying on good news will get
them in trouble. Since the main thing investors and editors are at-
tuned to hearing is the earnings-market return myth, any commenta-
tors who might know what factors really did create the market move
that day are left twisting in the wind. By focusing everyone’s attention
on a bogus explanation, the investor is led away from finding out the truth
from some other source.
Stock moves from day to day are in the main randomly related to
ephemeral factors of the day. They tend to go down after there has been exces-
sive optimism over the previous several days, and they tend to go up after there
has been excessive pessimism. These swings in optimism and pessimism
have little, if anything, to do with earnings. However, it would be completely
dysfunctional for reporters to attribute the swings to excesses in anything like
public sentiment. Such a report might lead to the thoughtful decision that per-
haps the solution would be less trading. Even worse, investors might pay less
attention to what the channels of communications are transmitting. That
would be bad for the ecosystem of the newspaper and TV and Internet purvey-
ors as it would cut down on advertising revenues from brokerages and stock
exchanges. Moreover, it might keep the public from making its maximum con-
tribution to the market’s vast machinery of brokers, specialists, analysts, and
investment bankers.
The bottom line for investors is that no matter whether news reports say
stock is going up on earnings optimism or down on earnings pessimism,
these assertions amount to nothing more than an invitation to trade the wrong
way. If an investor had a guardian angel, he might hear a whispered: “Listen! A
lot of ephemeral things go on. The thing to know is that stocks are a claim on
infinite future earnings. What happens today should not affect your view of a
stock, because you are buying it for its long-term discounted value. Do not let
the market take you and your loved ones away to the poorhouse.”
The Market News-O-Matic
After studying the subject from a wide variety of statistical, economic, and
psychological angles, after reading more than a thousand academic articles on
nied_c07.qxd 1/24/03 10:20 AM Page 176

177
Figu
re 7
.1M
arke
t New
s-O-M
atic
Inpu
t Dow
pric
e(t
oday
, yes
terd
ay)
> o
ne-d
aym
ove?
n =
?E
arni
ngs
new
s?(y
/n)
Ear
ning
sne
ws?
(y/n
)
Inte
rest
-rat
em
ovem
ent?
(y/n
)
Cal
cula
te1.
up/
dow
n2.
cha
nge
3. p
erce
nt c
hang
e
Writ
e fir
stpa
ragr
aph
Writ
e fir
stpa
ragr
aph
Writ
efo
reca
st
Prin
t out
Inpu
t ear
ning
sne
ws
(y/n
)
Inpu
t 52-
wee
k hi
gh/
52-w
eek
low
Dow
pric
e
Inpu
t ear
ning
sne
ws
(y/n
)
Inpu
t mad
e-up
reas
on
Inpu
t Fed
eral
new
s (y
/n)
Inpu
t int
eres
t-ra
teop
timis
m/p
essi
mis
m
Writ
e ea
rnin
gsne
ws
para
grap
h
Yes
Yes
Yes
Yes
No
No
No
R =
“E
very
one
is a
frai
d to
buy
befo
re th
e em
ploy
men
t num
ber.”
BE
AR
ISH
R =
“A
ny h
int o
f goo
d ne
ws
is g
oing
to b
e ta
ken
very
wel
l by
the
mar
ket.”
BU
LL
ISH
Mad
e-U
p R
easo
ns
(fro
m r
eal n
ews
stor
ies)
R =
“M
ost a
naly
sts
agre
e th
atth
e ec
onom
ic r
ecov
ery
fore
cast
for
the
next
few
mon
ths
will
not
lift a
ll bo
ats.
”
R =
“M
ore
than
60%
of a
ll co
mpa
nies
have
bea
t the
ir fo
reca
sts.
”
R =
“R
etai
l sto
cks
wer
e lif
ted
by b
ette
rth
an e
xpec
ted
sam
e-st
ore
estim
ates
.”
R =
“A
s lo
ng a
s w
e se
e m
ore
than
50%
of a
ll st
ocks
mor
e th
an 3
0%fr
om th
eir
one-
year
hig
hs, t
his
is ju
sta
bear
mar
ket r
ally
.”
R =
“O
f cou
rse,
all
bets
are
off
if th
ew
ar d
oes
not w
rap
up q
uick
ly.”
AL
L-P
UR
PO
SE
R =
Not
all
stoc
ks a
dvan
ced;
how
ever
,“I
t’s a
mar
ket o
f sto
cks,
not
a s
tock
mar
ket.”
R =
“Yo
u ca
n’t r
eally
look
at v
alue
s, y
ouca
n’t r
eally
look
at f
unda
men
tals
. It’s
all
abou
t psy
chol
ogic
al r
eact
ion
toda
y.”
n =
2
n =
3
n =
4
n =
5
nied_c07.qxd 1/24/03 10:20 AM Page 177

178 Practical Speculation
the subject, after running and vetting our ideas by the greatest minds in the
field, after spending thousands of our own hours calculating the numbers by
hand, rechecking the original sources, and directing and supervising our mul-
tifarious talented staff in similar pursuits, we can recommend an effective an-
tidote to financial news coverage: From time to time, investors should make
up stock stories themselves for their educational amusement.
We drew our inspiration from Alan Turing, the genius British codebreaker
who proposed a test for artificial intelligence. The test is, “Can a computer be
programmed to produce a product that could be completely indistinguishable
from a human effort?”
In the case of stock market reporting, the answer is yes (see Figure 7.1).
Our program proceeds through a simple series of steps. Say the market
is up. There can be two reasons. Either it is earnings optimism or interest-
rate optimism. If a major company reported good earnings and its stock
went up, then attribute it to the latter. If, on the contrary, the major company
reported good earnings and its stock went down, then attribute the market’s
up move to interest-rate optimism. Throw in some benign comments
from Doc Greenspan or one of the minions dispatched daily to feather the
nests of the Fed’s clients at the government dealers and brokers, and you
have a story.
Readers should test their understanding and creativity by trying this out
at home. For practice, apply the preceding basic formula to a down day. If pos-
sible, attribute the decline to poor earnings reports from one or more com-
panies. If you can find no plausible examples of poor earnings, go to Plan B,
which is to talk instead about interest-rate pessimism. Be sure to throw in a
comment or two from Alan Abelson’s list of reasons to be bearish and woeful
(see Chapter 4).
With the current vogue for downsizing in our economy, it is nice to know
that you have within you the makings of another career, that of a newspaper
reporter.
The following is a sample story generated by the Market News-O-Matic:
Today’s Market: U.S. Stocks [Rise/Fall] on Earnings [Optimism/Pessimism]
By Victor Niederhoffer
Junior Staff Writer
[First Paragraph]
(New York, Niederhoffer News)—U.S. stocks [rose/fell] as unexpectedly [strong/
weak] earnings from [company] fueled [optimism/pessimism] for a rebound in
earnings by year-end.
nied_c07.qxd 1/24/03 10:20 AM Page 178

Chapter 7 • News Flash: Computer Writes Stock Market Story! 179
[Price Paragraph]
The Dow Jones Industrial Average [rose/fell] [# points], or [percent change] to
[price]. The Standard & Poor’s 500 Index rose [rose/fell] [# points], or [percent
change] to [price]. The technology-laden Nasdaq Composite Index rose [rose/fell]
[# points], or [percent change] to [price].
[Fed Paragraph]
Stocks [pushed higher/lost ground] in the afternoon after Federal Reserve Chair-
man Alan Greenspan said that [technology is improving productivity and creating
a virtuous circle of sustainable economic growth/too many people have made too
much money from stocks, and that the resulting demand for goods threatens to
unbalance the economy].
[Earnings Paragraph]
[Company] [jumped/fell] [# points], or [percent change] after beating analysts’ av-
erage estimate by [# cents/dollars] per share.
[Money Manager Puff Paragraph]
“Stocks had sold off because of bad earnings, and now they are recovering,” said
[name of money manager], who oversees [$ amount] at [name of establishment]
and recently [bought/sold] shares of [company mentioned above].
[Below Their Highs Paragraph]
A study released by [name of firm] showed that [percent] of all New York Stock Ex-
change issues are trading below their 52-week highs.
[Nonfalsifiable Prediction Paragraph]
“The main event is still earnings. If earnings are [good/poor], the market will re-
spond [positively/negatively],” said [money manager name], who oversees [$ amount]
at [name of firm]. “Of course, all bets are off if the war in Afghanistan against Osama
bin Laden drags on.”
[Up/Down, Volume Paragraph]
[#] stocks [rose/fell] for every [#] that [fell/rose] on the New York Stock Exchange.
Some [#] shares changed hands, [percent change] [above/below] the three-month
average.
[Made-Up Reason Paragraph]
“You can’t really look at values, you can’t really look at fundamentals. It’s all about
psychological reaction today,” [money manager name], who oversees [$ amount]
at [name of firm].
nied_c07.qxd 1/24/03 10:20 AM Page 179

180 Practical Speculation
[Chronic Bear Paragraph]
Most observers agree that the economic recovery forecast for the next few months
will not lift all boats. David Tice, manager of the Prudent Bear Fund, expects new
lows in the market next year. Tice took profits recently in National Semiconductor
and Intel, which have risen [percent] in the past month on optimism for an im-
proving global economic outlook.
nied_c07.qxd 1/24/03 10:20 AM Page 180

181
Part TwoPractical
Speculation
“First, Build a Palace for Your King”: A Survival Lessonfrom a Chess Master
Part One described what is wrong with common approaches to investing. We
debunked the myths and propaganda surrounding the earnings-return rela-
tion and technical analysis, presented a case study of chronic negativism, de-
flated the ballyhoo about value stocks, ran the media’s market coverage under
a whole-body scan, and quantified the effects of hubris and humility on indi-
vidual stocks. But we aren’t the sort of people who only tear down and never
offer anything constructive.
nied_c08.qxd 1/24/03 10:17 AM Page 181

182 Practical Speculation
In Part Two, we provide a series of approaches that together can serve as
a foundation for investors. We begin with the one thing that comes before
everything else in the quest for investment success: survival.
We are as bullish as ever on stocks. The upward sweep of research and
progress will conquer the icy, old-hearted mien that descended on the market
at the beginning of the century. However, the vicious declines of 2000–2002,
as well as Vic’s own disaster in 1997, have prompted us to rethink how we
prepare for risk.
Like all simplifications, our approach is not a panacea. But it is based on a
deep philosophical idea from a master of strategy in an area where the greatest
minds have been at work for more than 1,000 years. What is more, it has been
tested on the firing lines in millions of confrontations. It was in the chess strat-
egy of David Bronstein, a Russian player whom some consider the greatest
chess genius who has ever lived, that we found our Holy Grail for trading. In
his classic work, The Modern Chess Self-Tutor, Bronstein set forth a combina-
tion of defense and offensive strategy that is elegant yet revolutionary:
At the start of the game, you should not be thinking either about mate, or about
rapidly gaining a big material advantage. A systematic approach consists in pro-
ceeding to one’s aim in stages, and since the system is confrontational, you must
all the time reckon with your opponent’s ideas and counter-actions, and should be
concerned not only about giving mate, but also about ensuring the safety of your
own king. First you must build a shelter for your king . . . a securely defended
command post.”1
The advice may have carried a secret poignancy for Bronstein. A Soviet
citizen, he tied for the 1951 world chess championship with the government’s
favorite, Botvinnik. Because Bronstein’s father was a dissident, it has always
been suspected that his family’s safety would have been in grave jeopardy had
he won outright.
Let’s apply Bronstein’s strategy to investing. At the start of the game, at-
tend to your defenses. Reckon with the market’s tendency to swing violently
against you, and make sure you are not in over your head. Protect yourself and
your family. Take account of the possibility that a long-term illness could keep
you from working or require substantial treatment outlays for a family mem-
ber. Set aside enough for college educations. Squirrel away enough to main-
tain the home.
We offer no hard-and-fast rules about how much to set aside. But con-
sider Bronstein’s advice:
Players who by nature are accurate and cautious can be advised to construct not a
shelter, but a virtual palace with double pawn walls and a personal guard.
nied_c08.qxd 1/24/03 10:17 AM Page 182

Practical Speculation 183
Once your king is secure, the offense then can be mounted in three stages:
1. First, attack to weaken the adversary’s pawn screen.
2. Then, attack with pawns to create a breach in the defenses.
3. Finally, mount an invasion with long-range pieces.
Applying this approach to markets, it is much more important to gain a
steady, reasonable advantage than to risk a wipeout by going for a startling
and enervating win. That is why people who can eke out 2 percent a year more
than the averages have billions of dollars under management. It is not just
chance. Therefore, when your financial defenses are in place, start out by
making small, short-term “swing” trades, buying when the market is oversold
and selling when it becomes overbought.
After making good profits and adding to your speculative capital with the
swing method, start taking long-range buy-and-hold positions. You will thus
be able to participate in the market’s million percent-a-century returns without
risking your survival when the inevitable storms of life and the market come.
Checkmate (Artist: Charles Munro, 1987).
nied_c08.qxd 1/24/03 10:17 AM Page 183

184 Practical Speculation
Bronstein’s advice on the dangers of being too shortsighted and too ag-
gressive can be applied to putting together a portfolio:
You should not bring into play only your favorite piece, but should seek a plan of
action by which the pieces make moves in turn, creating a united group in attack
and defense. . . . You must ask each piece what it can usefully achieve on its own,
what help it requires from the other pieces, and in what it itself is prepare to help
them.
Translated into trading terms, a stock that is sensitive to the market’s
fluctuations might balance a long-term sleeper speculation.
There it is, in all its brilliance and simplicity. Defend first. Don’t give your
enemy any targets. Make the opponent extend himself if he is going to attack
your very formidable house.
To keep ourselves honest and to benefit from the widely dispersed knowl-
edge outside the noisy realm of talking heads and self-promoting market
gurus, we circulated our Bronstein strategy among our friends. A scholarly
day trader, Bipin Pathak, objected that the approach counseled trading to
avoid loss instead of trading to win.
Our answer: You can’t win if you’re dead. The player, as Bronstein em-
phasizes, should never lose sight of the main goal: to win. One great long-
term winner will make up for numerous small losses, but to survive in the
interim, you need a stable base.
Nigel Davies, a chess grandmaster living in London, shared an insight
into tournament play that is apropos here:
One of the peculiarities of the laws of chess is that they permit you to make an
“agreed draw” at any time. You make your move, verbally offer a draw, press your
clock and your opponent then thinks it over. This has led to the practice of some
players making draws in very few moves, which are known as “Grandmaster
draws” because of their prevalence in games between Grandmasters. They are not
popular with tournament organizers, the public or anyone else for that matter.
But they can be very useful weapons.
When I was playing more regularly in round-robin tournaments I would im-
mediately mark down all the games with Black against strong players as being
those in which a draw is okay On those days I would play very carefully and per-
haps make a draw offer around move 10–15. If my opponent wanted to fight then
he’d be taking a risk, if not you get the day off and save your energy for the next
game. Like any self-respecting predator I try to pick out the weaklings.
In my experience, players who make a few draws in a tournament will very
rarely have a really bad result. But those who go all out in every game will put
much more pressure on themselves, and sometimes make a REALLY bad result.
nied_c08.qxd 1/24/03 10:17 AM Page 184

Practical Speculation 185
The idea is not to seek to eliminate risk entirely by shooting only for draws
or staying out of the market. The millennial market shakeup left too many peo-
ple terrified of risk. They are like our grandfathers and fathers after crashes of
the 1920s and 1970s, taking 2 percent profits on their stocks and selling when
they have a 10 percent loss—if they dare to venture into the market at all.
Yet investors now depend more than ever on the market to meet their fi-
nancial goals. Work, family life, and retirement savings are inextricably bound
to the market in an ecological web of spending, confidence, and capital invest-
ment. Adapting Bronstein’s survival principle has improved our own game in
chess, life, and the market.
Chess players, recall, have only eight pawns and eight pieces—and yet the
game is mind-bendingly complex, particularly since the opponents seek to
block each other at every turn. Stock investing, by contrast, has thousands of
players and practically infinite combinations. Where to start? In the following
chapters, we describe how to use quantitative methods to look for cases where
the market overestimates risk.
nied_c08.qxd 1/24/03 10:17 AM Page 185

nied_c08.qxd 1/24/03 10:17 AM Page 186

187
8 H O W T OA V O I D S P U R I O U S
C O R R E L A T I O N S
I can only say that there is a vast field of topics that fall
under the laws of correlation, which lies quite open to the re-
search of any competent person who cares to investigate it.
—Francis Galton1
Most of our knowledge is based on analyzing how two things relate to
one another. Folk wisdom cautions, “All that glitters is not gold.” In
Economics 101, we learn that prices fall when the quantity supplied rises. In
the field of investments, people base their expectations on links—perceived or
actual—between two things.
Here is a list of the things commonly thought to influence the movements
of stocks. Some of these variables are direct: When they’re high, stocks are ex-
pected to rise. Others are indirect, or inverse: When they’re high, stocks are
expected to fall. We culled the items on the list from several standard invest-
ment texts and hundreds of articles on the Internet.
nied_c08.qxd 1/24/03 10:17 AM Page 187

188 Practical Speculation
Direct Relations
• Better-than-expected earnings.
• Change in investor sentiment toward neglected firms (in January).
• Dividend yield.
• Earnings growth.
• Earnings yield.
• Insider buying or selling.
• Level of CEO ownership.
• Liquidity.
• Debt level.
• Debt rating.
• Research and development expenditures.
• Risk.
• Sales growth.
• Short-term interest rates greater than long-term rates.
• Similarity to takeover targets in an industry.
• Stock buybacks.
Inverse Relations
• Accrued earnings minus cash earnings.
• Excluded expenses in pro forma quarterly earnings reports.
• Float.
• For mutual funds, top rating of fund or manager.
• Inventory increases.
• Membership in industry with superior recent performance.
• Price to book, sales or earnings.
• Return over previous 36 months.
• Rising interest rates.
• Size (depending on latest trend).
Research and practice related to these relations can be found in
abundance on the search engine google.com. Most of the academic
studies use arcane statistical analysis, retrospective data files, and
old data; none takes into account the ever-changing cycles of the
marketplace. The practitioners don’t take account of uncertainty or luck. Few
of these assumptions are ever put to the test. The sad fact is
that most relations are wills-o’-the-wisp, persisting just long
enough for the public to lose money.
nied_c08.qxd 1/24/03 10:17 AM Page 188

Chapter 8 • How to Avoid Spurious Correlations 189
The only way to separate ephemeral relations from the
ones you can trade on is to put the assumptions to the test. Our
hero, Francis Galton, the father of statistical analysis, often
counseled: “Count! Count! Count!” The best method of count-
ing, for all scientists, scholars, and investors, is to draw a scatter diagram, a
plot of the values of two things on a graph.
Figure 8.1 shows the scatter diagram used in Chapter 2 to illustrate the
inverse relation between earnings in one year and stock market returns in
the next. The line slopes slightly downward from left to right, indicating a
negative relation. Thus, contrary to popular belief:
• Rising earnings in one year lead to lower stock prices in the next.
• Falling earnings in one year lead to higher stock prices in the next.
If the line had sloped upward, it would have suggested the opposite: that
rising earnings in one year lead to higher stock market prices in the next,
while falling earnings lead to lower stock prices.
The importance of scatter plots is widely recognized. A host of seminars
offer training in using scatter plots as a decision-making tool for businesspeo-
ple, government administrators, and researchers of all stripes. The vaunted
Figure 8.1 Change in Current Year’s Earnings as Predictor of Change inNext Year’s SPX, 1937–2001. Source: Standard & Poor’s Security PriceIndex Record.
–0.3
–0.2
–0.1
0.0
0.1
0.2
0.3
0.4
0.5
–0.5 0.0Change in Current Year’s Earnings
Cha
nge
in N
ext Y
ear’s
S&
P 5
00 In
dex
0.5
y = 9.6% – R2 = 0.5%
1⁄5 (x)
nied_c08.qxd 1/24/03 10:17 AM Page 189

190 Practical Speculation
Six Sigma approach to management excellence, widely held to be behind the
success of such companies as General Electric, the world’s biggest company
by market value and sales, includes the use of scatter plots, as the following
Internet notice from Applied Performance Strategies Inc. describes:
Six Sigma Green Belt Training
Participants are introduced to the Six Sigma business methodology and given the
opportunity to use the statistical tools required to successfully participate in a Six
Sigma event. The workshop is designed around a process simulation to help learn
the Define, Measure, Analyze, Improve, and Control methodology. Statistical
tools include process flowcharting, SOPs, response and variables diagrams,
Input-Process-Output (IPO) process, histograms, scatter diagrams, [emphasis
added] Pareto diagrams, control charts, run charts, design of experiments, mea-
surement systems, and FMEAs.
Some schools, realizing how critical data analysis is to their students’ fu-
ture careers, teach scatter plots early on. Fifth-graders at the Humboldt County
School District in Nevada learn to “collect, organize, read, and interpret data
using a variety of graphic representations including tables, line plots, scatter
plots, [and] histograms; [and] use data to draw and explain conclusions and
predictions.”
Like all good things, the tools available to make scatter diagrams are con-
stantly improving. The best by far that we have found is contained in the
Number Cruncher Statistical System, a statistical analysis software package.
Number Cruncher’s scatter program software contains so many good features
that it made Vic—who is very difficult to please—want to dance. Included are
such things as trend lines, polynomial spline, lowest curve fitting, sunflower
and box plots, overlays, connecting points, transformations to log or exponen-
tial scales, symbols for groups, confidence bands, three-variable plots, three-
dimensional charts, and colors and font sizes of all descriptions.
How to Build a Scatter Diagram
Now, let’s build a scatter diagram from scratch. Computer programs such as
Excel, Minitab, or the “freeware” R will do the work, but it’s all to the good if
you know how it’s done. Understanding the method may give you new in-
sights and help you spot errors.
Say you decide to study the relation between changes in interest rates in
one year and stock market returns in the next. The first step is to collect ob-
servations on two things. We assembled 39 years of data on each variable and
nied_c08.qxd 1/24/03 10:17 AM Page 190

Chapter 8 • How to Avoid Spurious Correlations 191
plotted each pair in the graph in Figure 8.2. The arrows going from the num-
bers in the chart to the scatter diagram show you how to plot the variables.
The arrows point to the values for 1995 and 1980, when interest rates and
stock returns were both exceptionally high.
It is customary to place the thing that is thought to be predicted or influ-
enced on the vertical axis, while the predicting or influencing variable goes
on the horizontal axis. The joint values are indicated by dots, X’s, check-
marks, or letters.
Visually, if the swarm of points lies from lower left to upper right, then
the association is positive. That would indicate:
Figure 8.2 Percentage Change in T-Bill Rates and S&P 500 Futures in Next Year.Source: Standard & Poor’s Security Price Index Record.
% C
hang
e in
S&
P 5
00 in
Cur
rent
Yea
r 40
30
20
10
0
–30
–20
–10
10050% Change in T-bill in Previous Year
0
y = 2.3% – R2 = 2.3%
Date ∆ SPX ∆ T Bill T–1
200120001999199819971996199519941993199219911990198919881987198619851984198319821981198019791978197719761975197419731972197119701969196819671966196519641963
–13.0%–10.1%
19.5.526.7%31.0%20.3%34.1%–1.5%7.1%4.5%
26.3%–6.6%27.3%12.4%2.0%
14.6%26.3%1.4%
17.3%14.8%–9.7%25.8%12.3%1.1%
–11.5%19.1%31.5%
–29.7%–17.4%15.6%10.8%0.1%
–11.4%7.7%
20.1%–13.1%
9.1%13.0%18.9%
10.8%18.9%
–15.9%2.8%1.4%
–10.3%84.3%–2.6%
–20.0%–41.0%–13.5%–6.8%42.6%2.3%
–21.5%–9.6%
–12.8%13.3%
–28.5%–24.4%21.1%30.7%51.1%41.2%
–16.5%–23.1%–9.7%45.7%39.7%
–24.1%–38.8%29.2%21.6%4.8%7.1%
17.5%8.2%
21.7%5.8%
1⁄10 (x)
nied_c08.qxd 1/24/03 10:17 AM Page 191

192 Practical Speculation
• High values of one variable are accompanied by high values of the
other.
• Middle values of one variable are accompanied by middle values of the
other.
• Low values of one variable are accompanied by low values of the other.
If the swarm of points goes from upper left to bottom right, the associa-
tion is negative; high values of one variable would be accompanied by low
values of the other, and so on. If the points fall in a shapeless mass, then there
is little or no association.
In this case, the diagram shows a negative association between interest
rates in one year and stock prices in the next.
The scatter plot provides a first impression of a relation between two
things. But the analysis can be taken much further. The next step is to per-
form a series of calculations based on the departure (or variance, or deviation)
of each observation from the mean. The goal is to determine how strong the
relation is.
To start, the values can be grouped in a 2 × 2 table according to whether
they lie above or below the mean—in this case, 8.9 percent for stock returns
and 5.2 percent for interest-rate changes (see Table 8.1).
Notice that there are 15 matches where both are above or both below, and
24 misses where one is above and the other is below. A good quick-and-dirty
estimate of the degree of relation is the number of matches less the number
of misses normalized by the total. In this case, that would come to:
That number, −0.23, is a rough measure of correlation, +1 being the most
direct relation where there are 100 percent matches, and −1 being the most in-
verse relation where all the observations were misses.
15 24
390 23
−( )= − .
Table 8.1 2 × 2 Table of T-Bill Rate Changes in OneYear and S&P 500 Return the Next Year
S&P 500 Return Next Year
Below Mean Above Mean
T-Bill rate changesBelow mean 7 14Above mean 10 8
nied_c08.qxd 1/24/03 10:17 AM Page 192

Chapter 8 • How to Avoid Spurious Correlations 193
The negative correlation indicates an inverse relation between interest
rates and S&P changes.
To calculate the 2 × 2 table, draw a vertical line at the average of the hori-
zontal numbers and a horizontal line at the average of the vertical numbers.
The two lines divide the graph into four quadrants. Then, count the number
of entries in each of the quadrants and place them in the table.
A More Accurate Measure
But much information is lost when using numbers that merely relate to their
position above or below the mean. To remedy this, we can use a more accu-
rate and sophisticated correlation coefficient that weights the matches and
misses by their magnitudes. The one most often used is called the Pearson
Product Moment correlation.
The correlation coefficient between two variables is calculated from the
covariance between them. The correlation-covariance relationship is:
Where Γyx stands for the correlation coefficient and S is standard
deviation.
The covariance between Y and X is defined as:
The refers to the mean, or average, of the individual Ys and Xs.
Thus, we are computing the average product of how much each pair jointly
varies from their means. If one is above and the other is below, it reduces the
covariance. (N is the sample size, and it is reduced by one to give the proper
degrees of freedom.) In this case, the Y variable—the dependent variable—is
the S&P 500 percentage change in the next year, and the X variable is the
change in T-bill rates in the current year.
Here are the steps in calculating the covariance between the two variables:
1. Calculate the mean of all the values in X. Do the same for Y.2. Subtract the mean from each individual observation.
3. Multiply each pair of differences (variances), and calculate the average.
Y X and
COVyx
Yi Y Xi X
n=
−( ) −( )−
Σ1
Γyx
COVyx
SySx
nied_c08.qxd 1/24/03 10:17 AM Page 193

194
Tabl
e 8.
2Co
varian
ce
YiYi
−Y
XiXi
−X
(Xi −
X)(Yi
−Y
) Dat
e(%
)(%
)(%
)(%
)(%
)
2001
−13.
0−
13.0
−11
.8=
−24.
910
.810
.8−
2.8
=8.
0−1
.98
2000
−10.
1−
10.0
−11
.8=
−22.
018
.95
18.9
−2.
8=
16.1
−3.5
319
9919
.519
.5−
11.8
=7.
7−1
5.9
− 15
.9−
2.8
=−1
8.7
−1.4
419
9826
.726
.7−
11.8
=14
.82.
82.
8−
2.8
=0.
0−0
.01
1997
31.0
31.0
−11
.8=
19.2
1.4
1.4
−2.
8=
−1.4
−0.2
819
9620
.320
.3−
11.8
=8.
4−1
0.3
− 10
.3−
2.8
=−1
3.1
−1.1
119
9534
.134
.1−
11.8
=22
.384
.384
.3−
2.8
=81
.518
.14
1994
−1.5
− 1.
5−
11.8
=−1
3.4
−2.6
− 2.
6−
2.8
=5.
40.
7319
937.
17.
1−
11.8
=−4
.8−2
0.0
− 20
.0−
2.8
=22
.81.
0919
924.
54.
5−
11.8
=−
7.4
−41.
0−
41.0
−2.
8=
−43.
83.
23
Mea
n11
.8M
ean
2.8
Cova
rian
ce14
.86
nied_c08.qxd 1/24/03 10:17 AM Page 194

Chapter 8 • How to Avoid Spurious Correlations 195
Table 8.2 shows how it works with the most recent 10 years of data on in-
terest rates and S&P 500 returns.
Thus, the covariance between Y and X is 14.86, divided by 10 years minus
1, or 9 (referred to as nine degrees of freedom):
To convert this covariance into a correlation coefficient, calculate the stan-
dard deviations of Y and X. Square the differences of each observation from
the mean to remove the + and − signs. Then, total them up (see Table 8.3).
The variances are the totals divided by n − 1:
For the standard deviation, take the square root of these numbers. The
square root of 2.86 percent is 16.9 percent. The square root of 11.07 percent is
33.3 percent.
25 7
92 86
99 6
911 07
.. %
.. %
=
=
COVyx
14 86
91 65
.. %=
Table 8.3 Correlation Coefficient
Yi −Y (Yi −Y)2 Xi −X (Xi −X)2
(%) (%) (%) (%)
−24.9 6.2 8.0 0.6−22.0 4.8 16.1 2.8
7.7 0.6 −18.7 3.514.8 2.2 0.0 0.019.2 3.7 −1.4 0.0
8.4 0.7 −13.1 1.722.3 5.0 81.5 66.4
−13.4 1.8 −5.4 0.3−4.8 0.2 −22.8 5.2−7.4 0.5 −43.8 19.2
Sum 25.7 99.6
nied_c08.qxd 1/24/03 10:17 AM Page 195

196 Practical Speculation
Finally, simply plug those numbers into the correlation formula:
Here is a more elegant way of expressing it:
As with the rough estimate we made from the 2 × 2 table, departures
from the mean were the basic elements in computing the numerator and the
denominator of the preceding formula.
A Workhorse Equation
The Pearson Product Moment correlation coefficient defined previously is the
workhorse for studies of relations that appear on scatter plots. It measures the
linear degree of association between two things by showing how closely the ob-
served values fit around a straight line. In simple terms, if the vertical distance
of the dots from the slope line is small, then the correlation is high.
In the case of Treasury bills and S&P 500 returns, the correlation is 0.29
for the 10-year example shown in Tables 8.2 and 8.3, but it is –0.07 for the full
39-year data series displayed in Table 8.1. This shows instability all too typical
of correlations between economic time series. The culprit in this particular
case was just one year, 1995, when high values of interest rates and stock
appreciation jumped the correlation up from a small negative to a high pos-
itive. (We thank Steve Stigler for kindly bringing this outlying data point to
our attention.) In the world of stock market speculation, it would not be sig-
nificant enough to trade on. In practice, we have found any number above
0.10 or below −0.10 based on 100 or more observations to be useful. The
general formula we follow for usefulness is that the correlation coefficient
where
and
ZxXi X
Sx
ZyYi Y
Sy
=−
=−
ΓΣ
xyZx Zy
n=
×( )− 1
Γ
Γ
yxCOVyx
SySx
yx
=
= ( ) ( ) =1 65
16 9 33 30 29344
. %
. % . %.
nied_c08.qxd 1/24/03 10:17 AM Page 196

Chapter 8 • How to Avoid Spurious Correlations 197
times the number should be greater than 10. Thus, for 50 observations, a cor-
relation of 0.20 would be useful and for 20 observations, a correlation of 0.50
would be useful.
The information provided by the correlation coefficient is useful to in-
vestors in many ways. For example, it can tell you approximately how much of
the movement in the Y variable—in this case, the S&P 500—can be explained
by the X variable.
Another way of putting this is that the square of the correlation coeffi-
cient is the amount by which a linear predictor of one variable by the other is
not attenuated by a regression back to its mean value.
The correlation coefficient cannot be used to directly predict the amount
of change in the explained variable that a change in the independent variables
creates. For that, a regression equation is necessary. A regression equation
consists of a straight line that fits the points on a scatter diagram. It requires a
slope and a y intercept. The slope is the correlation coefficient multiplied by a
factor of the standard deviation of the y variable divided by the standard devia-
tion of the x variable.
In the case of the interest rate return data, the regression equation is:
S&P 500 return = 2.3 percent less one-tenth of a percentage change
in Treasury bill rates
The most frequently used regression equation is fitted by minimizing
the squared distance of the values in the graph from a straight line. The line
always goes through the point corresponding to the mean of y and the mean
of x. To compute the regression line by hand from a scatter diagram, calcu-
late that point of intersection and then draw a straight line from that point to
your estimate of the y intercept (i.e., the average of the y values when x is ap-
proximately 0.) If you want to gain a measure of the variability about that
line for prediction or control purposes, draw two parallel lines at an equal
distance from the line so that the space between them includes about 95 per-
cent of the points.
Scatter plots have many uses in addition to revealing relations. Probably
the most useful is the visual observation that leads to discovery of possible
outliers caused by either an error in data collection or a changed relation.
Enhancements of scatter diagrams are available and useful. Colors, symbols,
or letters for various groupings can assist evaluation. The colors green and
yellow and the letters H, Q, and Z are all distinctive and are often used. Cir-
cling groups of observations that share similar characteristics may highlight
important relations among the points that would not be clear from the usual
summaries that come out of standard computer programs. New scatter
nied_c08.qxd 1/24/03 10:17 AM Page 197

198 Practical Speculation
diagrams can be created by varying the tallies and shadings of the line. De-
tailed discussions of these and other enhancements can be found on the In-
ternet; the search engine google.com alone has 1,580 entries on “scatter
diagram enhancements.”
Our favorite way to enhance a scatter diagram is to show the path of a
time series. All that is required is to draw arrows between the dots in the se-
quence they occur.
Avoid Fallacious Conclusions
Whatever you do, never place too much reliance on scatter diagrams, correla-
tions, or regression formulas. They are associations, not a proof of causation.
Seemingly statistically significant correlations are often due to chance or hid-
den factors.
Graphs are particularly vulnerable to misinterpretation. A famous ex-
ample of seeing patterns that indicated causal relations that were, in fact,
mere random fluctuations occurred in the bombing of London during
World War II. Newspapers published maps pinpointing where German air-
craft dropped bombs, and people scrutinized the maps to see which areas
were left untouched, in the belief that the patterns revealed the residences of
German spies. Subsequent analysis showed that the bombing patterns were
completely consistent with chance. A discussion of the tendency to infer
causes from random data, such as the geographic incidence of cancer, is
contained in Rational Choice in an Uncertain World, by Reed Hastie and
Robin M. Dawes.2
The most serious problem in this regard is the drawing of conclusions on
causality based on spurious or bogus correlations. Such false conclusions are
usually built on one or more of the following flaws:
• Failure to account for the possibility of randomness.
• Omission of a third variable that causes the other two.
• Failure to consider mobility, or changes in the population itself.
• The fallacy of aggregation.
Sadly, most studies of market relations suffer from all these fallacies si-
multaneously. For a great case study, we recommend many of the academic
works previously cited in this book. However, an even better introduction is
provided by Purdue University’s “Spurious Correlations Contest.” The 1998
winner is timeless and ineffable. Ron Malzer’s entry is based on the observed
nied_c08.qxd 1/24/03 10:17 AM Page 198

Chapter 8 • How to Avoid Spurious Correlations 199
high correlation of the population of Oldenburg, Germany, and the number of
storks sighted there: Oldenburg, Germany, has the world’s highest proportion
of adults who read the works of Immanuel Kant, and each year its
population is increased due to the immigration of Kantonians from
other places. As Kant discussions increase, there is pressure on the
cooks to prepare ever-increasing quantities of wurst. As quantities
increase, quality decreases. Bad wurst has been known to lead to thought disor-
ders. This leads to serious misinterpretations of Kant’s work, called unkantver-stehenlassenhummels. Written discourse about the error leads to disorders of the
eyes just from having to read such a long word. The resulting double vision
leads to spurious sightings of storks, with data reported at least double the ac-
tual numbers involved.3
Let’s examine the problem of specious correlations systematically.
The Error of Randomness
The failure to impute chance or randomness as an explanation for a sup-
posed market relation is by far the most common problem in analyzing cor-
relations. Almost everything you read in the financial pages about what is
going on in markets is mainly attributable to chance. The most common ex-
ample here is the breathless reporting of some mutual fund manager’s rec-
ommendations on individual stocks or future market direction. “Mr. X could
forecast the exact high. He bought at the exact low and wrote a book. He
bought some ABC before the recent run-up and sets a target for the stock of
$100.” Yes, of course. There always are going to be managers and advisors
from among the tens of thousands who called the last up wave right. But did
their success come through superior insight? A much more likely explana-
tion is chance.
A classic investment scam capitalizes on this failure to consider the role
of chance. A prediction is mailed out to half the people on a list of “targets.”
The other half receives the opposite prediction. The ones who received
whichever prediction turned out to be correct are then split into two groups,
half receiving one prediction and the other half receiving the opposite. After
five or so iterations, you have a small group of followers who think you are a
genius. Then you ask for big bucks.
The same failure plagues discussions of correlation between technical in-
dicators and market performance. So many technical indicators are out there,
as discussed earlier in this book, that there will always be one or another indi-
cator, one or another practitioner, one or another seminar speaker or pro-
moter, with a hot hand.
nied_c08.qxd 1/24/03 10:17 AM Page 199

200 Practical Speculation
A discussion of this in Chapter 3 of Vic’s previous book, The Education ofa Speculator, illustrates how even a very long string of consecutive price moves
in the same direction is consistent with randomness. In 1995, the yen de-
clined 16 Fridays in a row. Yet taking account of all the different commodities
and days, such a run was not improbable at all. Similarly, random moves ex-
plain almost every old adage that you will hear about the market. High on the
list are the Super Bowl indicator and the January barometer. This list of ex-
amples could be vastly extended.
There is a great antidote for drawing spurious relations from random
phenomena. The antidote is to read a statistics book on multiple comparisons
or a chapter on the subject in any of the multivariate statistics books. A good
book here is Multiple Comparison Procedures by Yusef Hochberg and Ajit
Tamhane (John Wiley & Sons, 1987). The gist of all such work is that if you
search for a thousand different relations or look back on the winners of thou-
sands, then you have to adjust the actual odds against the phenomena by a
similar factor of—say—a thousand.
The Error of Omission, or the Missing Third Variable
The second most common cause of errors leading to faulty conclusions about
stocks is mobility in conjunction with the omission of a third variable. Let’s
turn again to those messengers of fecundity, the Scandinavian
storks. Data from Germany, Denmark, and Norway show that the
greater the number of storks, the greater the number of births. In
The New Statistical Analysis of Data, T. W. Anderson and Jeremy D.
Finn explain the correlation in a nice way: “Districts with large populations
have a large number of births and also have many buildings, in the chimneys
of which storks can nest.” Thus, it is population that explains both the fre-
quency of births and sightings of storks. They illustrate with a diagram, as
seen in Figure 8.3.
It would be a good idea for all students of market relations to post Fig-
ure 8.3 somewhere near their work desk as a reminder of this pitfall.
Examples of omitted third variables abound in market studies. Typical
in this research are the studies of the validity of technical indicators based
on sentiment. Almost all of these show that after sentiment reaches a certain
optimistic level, the market becomes bearish; and after the swing to undue
pessimism, the market becomes bullish. As shown in the technical indica-
tors chapter, there is a strong negative correlation between the recent move
in the market and subsequent performance. But all sentiment indicators,
nied_c08.qxd 1/24/03 10:17 AM Page 200
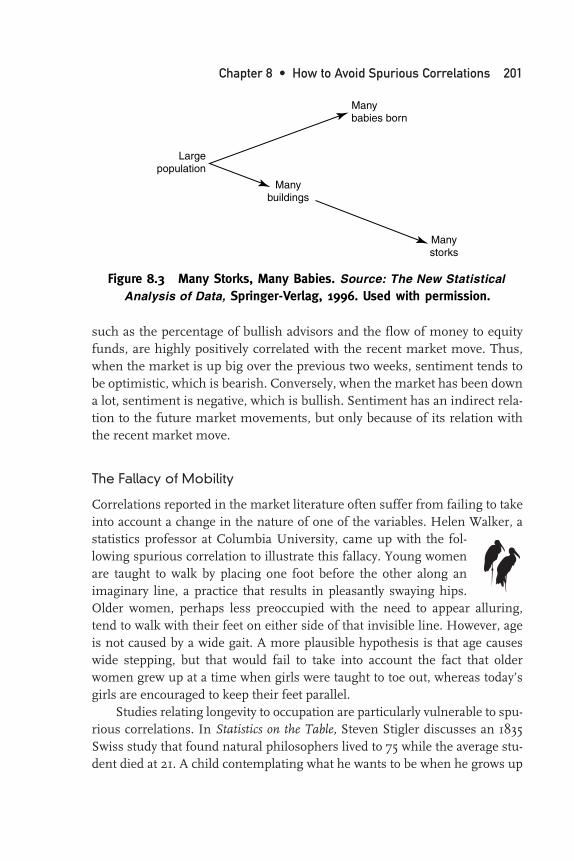
Chapter 8 • How to Avoid Spurious Correlations 201
such as the percentage of bullish advisors and the flow of money to equity
funds, are highly positively correlated with the recent market move. Thus,
when the market is up big over the previous two weeks, sentiment tends to
be optimistic, which is bearish. Conversely, when the market has been down
a lot, sentiment is negative, which is bullish. Sentiment has an indirect rela-
tion to the future market movements, but only because of its relation with
the recent market move.
The Fallacy of Mobility
Correlations reported in the market literature often suffer from failing to take
into account a change in the nature of one of the variables. Helen Walker, a
statistics professor at Columbia University, came up with the fol-
lowing spurious correlation to illustrate this fallacy. Young women
are taught to walk by placing one foot before the other along an
imaginary line, a practice that results in pleasantly swaying hips.
Older women, perhaps less preoccupied with the need to appear alluring,
tend to walk with their feet on either side of that invisible line. However, age
is not caused by a wide gait. A more plausible hypothesis is that age causes
wide stepping, but that would fail to take into account the fact that older
women grew up at a time when girls were taught to toe out, whereas today’s
girls are encouraged to keep their feet parallel.
Studies relating longevity to occupation are particularly vulnerable to spu-
rious correlations. In Statistics on the Table, Steven Stigler discusses an 1835
Swiss study that found natural philosophers lived to 75 while the average stu-
dent died at 21. A child contemplating what he wants to be when he grows up
Figure 8.3 Many Storks, Many Babies. Source: The New StatisticalAnalysis of Data, Springer-Verlag, 1996. Used with permission.
Manybuildings
Manystorks
Manybabies born
Largepopulation
nied_c08.qxd 1/24/03 10:17 AM Page 201

202 Practical Speculation
might well be advised to place more weight on the nature of the job than to
any possible benefits in life expectancy, however, given mobility between oc-
cupations. After all, most students don’t die students; if they can make it
through those dangerous student years, they turn into natural philosophers,
sculptors, or clerks.
A study on the life expectancy of conductors nicely illustrates how omis-
sion of a third variable—the achievement of living to a certain age or not—bi-
ases most studies of longevity based on occupation or lifestyle. On average,
conductors live to age 74. Poets live much shorter lives. Yet, that does not
mean prospective artists could improve their longevity by choosing conduct-
ing over poetry. To become a conductor, extensive training is necessary; 35
would be a reasonable expected minimum age for inclusion in the fraternity.
Those who died as students and those who died in childhood have no chance
of making the mark. Once this is factored in, the apparent longevity of con-
ductors disappears. The average life expectancy of males who reach the age of
35 is about 74, the same as conductors.
This type of fallacy in correlation analysis is well known, yet this bias is
often present in Wall Street studies. Using samples of stocks that were created
and weighted with surviving companies, much work tends to conclude that
value stocks are supreme. Careful analysis, however, often reveals that the re-
sults are skewed by the construction of the files. Small companies are included
in the growth files only on attaining a certain size; as a result, many fast-growing
companies are omitted. The value files, on the other hand, include many
companies experiencing financial difficulties. If the company’s financial diffi-
culties worsen to the point that it goes belly up, it is not represented in the
files. If it survives, it is included.
Much of the superior retrospective performance attributed to value stocks
is attributable to this survivorship bias. Except for this flaw, the studies of
James P. O’Shaughnessy are a model of good research. Note, however, that
O’Shaughnessy decided to leave the mutual fund business after a value mutual
fund based on the models in his 1998 book, What Works on Wall Street, suf-
fered from dismal performance.4 A subsequent venture that sold customized
baskets of stocks over the Internet closed its Web site in September 2001. Al-
most all other mutual funds based on such correlations have had similar re-
sults. A good case in point is the Rea-Graham Fund, which was first to apply the
correlations discovered by Benjamin Graham between value stocks and returns
for the benefit of investors. The fund’s performance since inception earned
it the lowest Morningstar ranking possible in all categories. But it looked good
on paper.
nied_c08.qxd 1/24/03 10:17 AM Page 202

Chapter 8 • How to Avoid Spurious Correlations 203
The Fallacy of Aggregation
If low P/Es are associated with high subsequent returns for individual stocks,
then a low P/E for the market is associated with higher subsequent market re-
turns—this is an example of what statisticians call the fallacy of aggregation.
The Curse of Specious Correlations
It has been shown that shoe size is highly correlated with reading
skills, but this does not mean that buying bigger shoes would help
kids read better or that reading more will make the feet grow. In-
stead, a third unmeasured factor is involved: age. As children get
older, their reading abilities grow along with their feet.
While every student is taught to be careful about inferring causation from
correlation, it is amazing how rarely this is taken into account in the numeri-
cal work of system developers and quants of all stripes. Invariably they come
up with a relation, the correlation between this indicator and that, and the
subsequent superior performance. If they could only remember the studies of
storks, shoe size, conductors et al., and pay more attention to the scatter plots,
they would waste much less time chasing after spurious systems.
In Gilbert and Sullivan’s comic opera Rudiggore, Mad Margaret loses her
sanity because the baronet she loves is doomed by a curse to commit a crime
once a day. Only the enunciation of the word “Basingstoke” can bring her
back temporarily to her senses.
A solution is found, the curse is finally broken, and the entire ensemble
toddles off happily to settle in the bucolic Hampshire town of Basingstoke.
Back when Laurel was at the wire service editing stock market stories,
Vic often cautioned her about attributing price moves to anecdotal examples
of ephemera, especially those involving earnings woes or up/down volume
in individual stocks. Eventually, Vic shortened his messages to the word
“Basingstoke.”
It is a much more serious error to attribute causal relations to two things
that are attributable, as is so often the case, to purely spurious factors. In view
of the seriousness of this crime, we recommend to readers that whenever
they feel the tendency to succumb to such an attribution, they repeat the
word unkantverstehenlassenhummels three times. The rewards for readers who
diligently apply this technique will be early retirement to a splendid mansion
and numerous wurst dinners in Oldenburg, Germany.
nied_c08.qxd 1/24/03 10:17 AM Page 203

nied_c08.qxd 1/24/03 10:17 AM Page 204

205
9 T H E F U T U R EO F R E T U R N S
The source of all market triumphs is not bullishness or
bearishness, but the investigating human mind.
—Correspondence from Brett Steenbarger, PhD, June 23, 2002
The history of science is replete with examples of monumental collections
of data that sparked revolutions in knowledge. Tycho Brahe’s careful and
extensive astronomical calculations, based on observations made with his inno-
vative telescopes, led to the development of Johann Kepler’s laws on planetary
motion. The data on plants collected by Carl Linnaeus in the early eighteenth
century laid a base for Charles Darwin’s discoveries and groupings. Painstak-
ingly exact and detailed measurements by Henry Cavendish and Antoine
Lavoisier on the various chemical elements led to Dmitri Mendeleyev’s discov-
ery of the periodic table.
A similar advancement in knowledge in the field of investments came
during the 1960s when the University of Chicago Center for Research in Se-
curities Prices published the first reliable and comprehensive database of daily
prices of U.S. stocks, from 1926 to 1960. The science of securities analysis
nied_c09.qxd 1/24/03 10:58 AM Page 205

206 Practical Speculation
exploded shortly thereafter. The ensuing contributions in the fields of portfolio
analysis, capital structure of corporations, option pricing, the efficient markets
hypothesis, the theory of behavioral finance, and rational expectations have
been well chronicled and memorialized with numerous Nobel Prizes. Ac-
counts can be found in any standard college finance text.
It took four more decades to complete a comparable database for all
countries. Elroy Dimson, Paul Marsh, and Mike Staunton of the University
of London Business School undertook this immense project. The professors
published their findings in a 2002 book, Triumph of the Optimists: 101 Years ofGlobal Investment Returns. Within Triumph’s pages, an investor may find de-
finitive information on inflation-adjusted returns for stocks versus bonds
and Treasury bills, real dividends, correlation between markets worldwide,
and the relative performance of value and growth stocks.
Unlike most books written by academics, Triumph avoids hasty generaliza-
tions and biased sampling procedures. The authors rightly fault earlier invest-
ment studies for arbitrary selection of starting and stopping points, the
tendency to include the good and exclude the bad, and the exclusion of all but a
small slice of the global picture. Their work epitomizes outstanding investment
research.
Great works can be created in humble circumstances. Shakespeare was
an actor and entrepreneur who reworked old plots so that his company
could make a buck. Cervantes wrote a parody of the mania for knight er-
rantry books to repay his debts. Rabelais wrote humor to help cure the pain
of his sick patients. Dimson told us that he and his colleagues thought
of Triumph as “a labor of love, just a small contribution that could lead to a
paperback meant for light reading on planes.” He added, “Our families
would be less kind about our fixation.” Staunton, who collected the data,
prefers to gather statistics by himself from original sources at specialized li-
braries instead of delegating the work. He wrote his doctoral thesis on air-
line ticket prices.
The main conclusion of Triumph is that a random selection of U.S. stocks
returned 1,500,000 percent in the twentieth century. Yes, big losses occurred
at times, such as the back-to-back losses of −28 percent and −44 percent in
1930 and 1931, or the 10 years from 1970 to 1979 when stocks hardly budged
while the dollar lost 28 percent of its purchasing power.
But overall, adjusted for inflation, the return on U.S. stocks amounted to
about 6 percent a year—better than any other class of securities. Moreover, the
U.S. returns were comparable to those achieved in most other industrialized
nations. Sweden’s and Austria’s were even greater. These returns are shown
in Figure 9.1.
nied_c09.qxd 1/24/03 10:58 AM Page 206

Chapter 9 • The Future of Returns 207
The New Forecasters
The implications for market forecasting in the twenty-first century are im-
mense. In ancient times, people traveled to Delphi to consult the Oracle on
important questions. There, among mountains of awesome height, they rev-
erently listened to mystic pronouncements on such weighty matters as the
best sites for colonies and the advisability of war. These pronouncements,
muttered by a consecrated village woman of Delphi from a hidden room
within the temple, may have benefited from the intelligence gathered by a
priest-operated spy network that extended throughout the known world. Even
more important, many of the Oracle’s forecasts were ambiguous enough for
Delphi’s priests to claim accuracy no matter what the outcome. But we will
make a bold prediction here: Future seekers of knowledge will make their way
to the 14-nation database of Dimson’s group at the London Business School.
Indeed, imposing Greek columns give the school a certain resemblance to its
ancient counterpart (see Figures 9.2 and 9.3).
The London Oracle received one such important question through us
when Frederick C. Scharack, a reader, asked: “But which particular company or
companies would you have chosen back in 1900 to achieve your 1,500,000 per-
cent return? Is there an actual company that survived over this period and had
Figure 9.1 Nominal and Real Returns, 1900–2001. Source: Elroy Dimson et al., Triumph of the Optimists: 101 Years of Global Investment Returns,Princeton University Press, 2002. Used with permission.
8
6
4
2
0
–2
–4
Ita Bel Ger Spa Fra
Jap
Den Swi IreNet
hW
ld UKCan US
SAfSwe
Aus
BondsEquities
Annualized Percentage Return
2.3
–2.1
–1.0
3.3 3.5 3.6
4.3 4.44.7 4.7
5.5 5.5 5.6
6.2 6.57.0
7.4 7.5
1.3
2.62.8
1.51.1 1.2 1.3
1.6 1.5
2.3
1.1
2.4
–0.4
–2.2
–1.5
1.9
nied_c09.qxd 1/24/03 10:58 AM Page 207

208 Practical Speculation
this kind of performance, or are the returns based on indexes where new win-
ning firms regularly replace the losers until they, too, fall by the wayside?
Wouldn’t this kind of substitution bias all security indexes upward?” Here is
Dimson’s response:
If we choose a company that did survive over a specific interval, it will inevitably
have different machines and different employees. The business has changed, but
that does not in itself matter to a stockholder. Similarly, a mutual fund that survives
contains a changing cast of constituent securities. All one can do is “follow the
money.” That is the investment strategy underpinning our indexes. The indexes
represent the cumulative performance of a portfolio, for a strategy to perform well
over a long term. There is no need for any constituent company to survive.
Do Not Be Satisfied with 1,500,000 Percent Profit
We have begun to make humble attempts to stand on the shoulders of Dim-
son and his colleagues in our own speculations. To start, we wondered
whether one needs to be in the market all the time, or whether adroit timing,
so useful in other areas, might improve returns. We devised three variations
that may increase the effectiveness of a simple buy-and-hold long-term invest-
ment strategy. We invited a colleague, trader Alix Martin, to join in the im-
provisation, and we also report his variation.
Figure 9.2 London Business School
nied_c09.qxd 1/24/03 10:58 AM Page 208

Chapter 9 • The Future of Returns 209
Variation 1: A Stumble, a Skip, and a Jump
If Cole Porter had put the “Triumph” theme to the music of “Night and Day,”
it might have gone like this:
Like the steady support of a lifelong friend
Like the flow of Victoria Falls
Like the steady state of electric flow,
Like the steady rise of the Dow
Like the ching, ching, ching of the cash flow
As the ships come into dock
So a voice within me keeps repeating, stocks, stocks, stocks.
Figure 9.3 Temple of Apollo at Delphi
nied_c09.qxd 1/24/03 10:58 AM Page 209
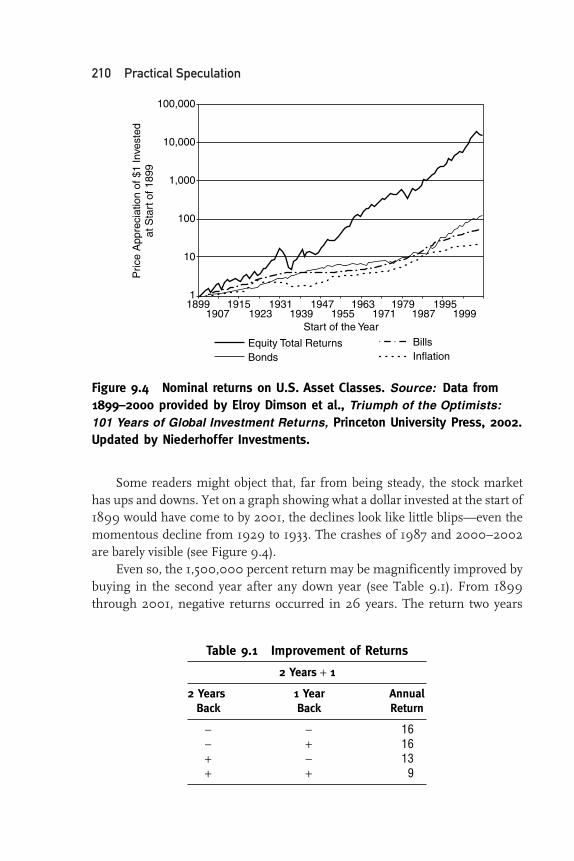
210 Practical Speculation
Some readers might object that, far from being steady, the stock market
has ups and downs. Yet on a graph showing what a dollar invested at the start of
1899 would have come to by 2001, the declines look like little blips—even the
momentous decline from 1929 to 1933. The crashes of 1987 and 2000–2002
are barely visible (see Figure 9.4).
Even so, the 1,500,000 percent return may be magnificently improved by
buying in the second year after any down year (see Table 9.1). From 1899
through 2001, negative returns occurred in 26 years. The return two years
Table 9.1 Improvement of Returns
2 Years + 1
2 Years 1 Year AnnualBack Back Return
− − 16− + 16+ − 13+ + 9
Figure 9.4 Nominal returns on U.S. Asset Classes. Source: Data from1899–2000 provided by Elroy Dimson et al., Triumph of the Optimists:101 Years of Global Investment Returns, Princeton University Press, 2002.Updated by Niederhoffer Investments.
Start of the Year
1
10
100
1,000
10,000
100,000
18991907
19151923
19311939
19471955
19631971
19791987
19951999
InflationBills
BondsEquity Total Returns
Pric
e A
ppre
ciat
ion
of $
1 In
vest
edat
Sta
rt o
f 189
9
nied_c09.qxd 1/24/03 10:58 AM Page 210

Chapter 9 • The Future of Returns 211
later averaged 16 percent, with 23 years up and just two years down. The stan-
dard deviation was a modest 19 percent.
Table 9.2 shows the correlation of returns between past and future years
for all relevant periods. The pattern of mean reversion is amazingly consistent.
The correlation between returns in one year and the return two years later
turns out to be negative 0.25. That is significant for 100 years of data, with a
probability of less than 1 in 100 of occurring by chance (see Table 9.3).
As Porter might have put it:
Up and down, that’s how to trade.
You buy after a down year, sell after a gain.
Just make sure you skip a year
Whether up or down when trading, dear
We’ve tested this every way.
Variation 2: Lucky 5
Seasonality is always a suspect in stock returns. The authors of Triumph ex-
plore whether there are good months to buy and sell. They review whether Jan-
uary is a good month to buy and conclude that it might show a high return for
U.S. small caps. They believe the market may tend to rise in the summer—the
opposite of the conventional wisdom on the “summer slump.” Such issues,
the authors suggest, will “continue to intrigue.”
They certainly intrigued us enough to inspire a study of whether certain
years show higher-than-average returns. We explored whether years ending in
a particular digit, such as 5, might be good times to buy, and whether years
ending in other numbers, such as 0 or 7, are not so favorable.
As Table 9.4 shows, the average return for years ending in 5 is 32 percent.
The average return for years ending in 0 or 7 is close to 1 percent.
To test whether these intriguing results were nonrandom, we put all 100
returns into an urn. Then we chose 10 groups of 10 returns. We repeated the
process 1,000 times.
Table 9.2 Correlation of Returns
Correlations between current year and1 year back −2%2 years back −253 years back −44 years back −25 years back −176 years back −5
nied_c09.qxd 1/24/03 10:58 AM Page 211

212 Practical Speculation
Next, we computed the difference between the largest and the lowest re-
turns. This turned out to be above 30 percent just 2 percent of the time.
Thus, we conclude that years ending in 5 are great times to buy, and years
ending in 0 or 7 are bad times to buy.
Studies of the best years to buy bonds, bills, and the Consumer Price
Index showed completely random results.
Table 9.3 Buy Stocks Second Year after a Fall
Total Two TotalReturn Years Return
Year (%) Later (%)
1903 −0.15 1905 0.221907 −0.29 1909 0.21910 −0.09 1912 0.071913 −0.08 1915 0.391914 −0.06 1916 0.061917 −0.19 1919 0.211920 −0.18 1922 0.311929 −0.15 1931 −0.441930 −0.28 1932 −0.11931 −0.44 1933 0.581932 −0.1 1934 0.041937 −0.35 1939 0.031940 −0.07 1942 0.161941 −0.1 1943 0.281946 −0.06 1948 0.021957 −0.1 1959 0.131962 −0.1 1964 0.161966 −0.09 1968 0.141969 −0.11 1971 0.181973 −0.19 1975 0.381974 −0.28 1976 0.271977 −0.03 1979 0.261981 −0.04 1983 0.231990 −0.06 1992 0.091994 0 1996 0.212000 −0.112001 −0.11
Number of observations 25Average return 0.16Medium return 0.18Significant deviation 0.19Percent up 92%
nied_c09.qxd 1/24/03 10:58 AM Page 212

Chapter 9 • The Future of Returns 213
Variation No. 3: The Limits of Leverage
Alix Martin, a Paris-based student of statistics and consultant to many Euro-
pean telecom companies, offered the following variation on the 1,500,000
percent theme:
Wall Street pundits typically recommend an asset allocation split between stocks,
bonds, and cash. But over the past century, an investor who had 70 percent in
stocks, 20 percent in bonds, and the remaining 10 percent in T-bills would have
turned $1 into “only” $5,070, one-third of what one would have made by being
fully invested in stocks.
Is it possible to improve on the “100 percent in stocks” strategy? It may not
have been in 1899, but it is today. One can buy stocks on margin, or buy futures,
to increase exposure to stock returns beyond 100 percent. If an investor had had a
200 percent exposure to stocks during the twentieth century, instead of turning
$1 into $15,000, he would have made $1,723,781.
Is too much of a good thing possible? Yes: With a 300 percent exposure,
our fictional investor would have lost everything in 1931. Even a winning
blackjack player can go bust if his bet is too large relative to his bankroll. The
same phenomenon is at work here: gambler’s ruin.
Moreover, investors or funds trying to implement this strategy would face
additional costs: They would have to pay margin rates to be allowed to hold
more stocks than they have the cash for, and would need to buy or sell stocks
at the end of each period to maintain exposure at the desired level.
To make the study more realistic, Alix subtracted T-bill returns from
stock returns for the part of the exposure that goes beyond 100 percent, as an
Table 9.4 Average Return
Year PercentEnding Return
0 11 62 103 104 125 326 117 08 259 13
nied_c09.qxd 1/24/03 10:58 AM Page 213

214 Practical Speculation
approximation of margin rates. Even with this more restrictive hypothesis, ad-
ditional exposure—that is, leverage—improves the fully invested strategy. A
150 percent exposure would have more than tripled the gains over the century,
turning $1 into $47,228.
With hindsight, Alex wrote, the best asset allocation would have been 164
percent stocks. This turns a dollar into $50,950, nudging up the compounded
return from 10 percent to 11.3 percent. But that would have been a wild ride:
from 1928 to 1932, one would have lost more than 90 percent. Anyone daring
enough to muster more than 225 percent exposure would have gone bust. As
he concluded, “Nobody said this was not risky.”
Will the Optimists Keep on Triumphing?
While it is impossible for any rational person to dispute the returns that Dim-
son and his colleagues have so thoroughly documented, there is considerable
controversy as to what future returns might be. From their Greek-columned
London fortress, the professors have kindly given us their view on this ques-
tion. In a nutshell, they believe that the twentieth century benefited from an
extraordinary coalescence of factors, and that returns in the next 50 years will
not be as good as those of 1900–2001.
In particular, Dimson cautions against extrapolating from America’s fa-
vorable historical experience. “Should Belgians or Danes, with their much
poorer historical returns, do the same and project much lower stock market
returns than the United States? That would be odd. Compare a low Belgian
stock market forecast with a high U.S. forecast. The investor who predicts
high American returns must explain to me why she thinks America is
undervalued relative to other countries. The investor who predicts low Belgian
returns must explain why she thinks Belgium is overvalued relative to other
countries. The only sensible position is to project returns that appear to repre-
sent a reasonable reward for risks that may occur in the future. That is what
we seek to do in Triumph of the Optimists.”
Second Opinion
For answers to truly hard questions, it was customary in the glory days of
Greece to consult the Oracle of Zeus at Olympia as well as the one at Delphi.
Hewing to custom, we sought a second opinion from Richard Sears, our
nied_c09.qxd 1/24/03 10:58 AM Page 214

Chapter 9 • The Future of Returns 215
favorite U.S. oracle. A retired managing partner of a leading actuarial firm,
Richard currently presides over his investments from the Palisades Moun-
tains in New York. He also runs a Web site, www.gtindex.com, devoted to
tracking technology guru George Gilder’s stock picks. Richard wrote:
It seems to me like fatal conceit to presume to explain something as complex as
free markets by reference to a few variables. With respect to the stock market, I
doubt anyone can say with confidence why what happened in the past happened.
Or predict the future. Any more than one can predict future weather.
The term “fatal conceit” refers to a book of that title by Austrian econo-
mist Friedrich Hayek. In it, Hayek described why the highly dispersed nature
of economic information dooms all attempts at central planning.1
As we write in mid-2002, surrounded by pessimism, our view is that the
required return for holding stocks is at levels unseen since 1990, or 1980, or
1950, when memories of depressions or crashes were still hanging in the air.
If ever there were a time that investors would only buy risky investments
when the anticipated returns were in the 50 percent-and-over area, this time
would seem to be now. We see no reason that our expectations will be disap-
pointed. Why shouldn’t an improvement in life span or the rules of the game
of business reap in the next 50 years the kind of results that greeted investors
in the past 50?
As Dimson and his colleagues note, a remarkable number of positive in-
fluences converged in the twentieth century: technology, liquidity, diversifica-
tion, free trade, and the victory of capitalism over socialism. But consider also
that returns for U.S. stocks were about the same as those for the United States
during a period in which Britain went through two world wars, lost her em-
pire, moved through times when her very survival looked like a long shot, and
then followed all that up with a variety of social policies including tax rates at
the margin of more than 100 percent—all of which presumably should have
been quite negative for stock performance.
Despite our differences on how much optimism is warranted for the mar-
ket’s next century, we and the Dimson group reach similar conclusions as to
where we are going to end up in the future. “A typical real return for equities
in most countries over the past century has been 4 percent to 6 percent a
year,” they wrote us. “Gazing into the future, a reasonable prediction to us
would be to take a percentage point or two from that.”
Perhaps we would add 1 percent or 2 percent to that. Taking compound-
ing into account, the difference is that we would look for 1.5 million percent in
the next century, and they might expect 1 million percent.
nied_c09.qxd 1/24/03 10:58 AM Page 215

216 Practical Speculation
To put things in a homely setting, consider two travelers who start from
London and head for California. One arrives in San Jose and the other in San
Francisco. Whichever of us is right, the returns are superb. They are cause for
great optimism. And they provide a beacon of light that should guide all in-
vestors to err on the side of optimism in planning their investments: They
should buy stocks at every reasonable opportunity to gain wealth for them-
selves and their heirs.
nied_c09.qxd 1/24/03 10:58 AM Page 216

217
10 T H E P E R I O D I C T A B L EO F I N V E S T I N G
It is the accumulation of objective knowledge that
brings the future in sight.
—Gerard Piel, The Age of Science: What Scientists Learned in theTwentieth Century 1
In any field, the pursuit of knowledge starts with the accu-
mulation of disconnected facts and properties. The next
step is to uncover the one- and two-variable effects that explain
the properties. These efforts reduce the extent of uncertainty.
The field then awaits a Copernicus, a Darwin, a Linnaeus, a Mendeleyev, a
Watson, to come up with a classification scheme that fits the myriad proper-
ties and relations into a coherent whole.
Take chemistry circa 1870, before Dmitri Ivanovich Mendeleyev and Julius
Lothar Meyer independently came up with the periodic table of elements. John
Dalton had discovered the atomic structure of elements early in the century.
Most of the elements had been discovered and analyzed. Methods for process-
ing them were available, and procedures for combining them were known.
Groups of elements had been observed to possess similar electrical properties.
nied_c10.qxd 1/24/03 10:57 AM Page 217

218 Practical Speculation
The discovery of the periodic table simultaneously unified those discon-
nected facts and relations, and opened a new frontier. The ordering of the ele-
ments by atomic weight permitted the prediction not only of individual
properties but relations with other elements. The elements in each column of
the table show similar properties. As you proceed along the “periods,” or
rows, across the columns, the movements from metals to semimetals to gases
are also predictable. More than a century later, the periodic table is still on the
wall of most laboratories around the world, used by practitioners and students
to make sense of the behavior and properties of the elements and their multi-
farious molecular configurations.
It is beautiful and reassuring for the chemist to know that an element’s
properties can be predicted based on its position in the periodic table. But
where is the comparable knowledge vis-à-vis the properties, let alone the pre-
dictive qualities, of individual stocks?
Granted, stocks exhibit stochastic properties; that is, their movements
may be analyzed statistically according to a random probability distribution,
although not predicted precisely. Even these stochastic properties vary de-
pending on the economy, world events, and the state of mar-
kets around the globe. The difficulty of acquiring knowledge is
compounded by the peculiar readiness of markets to follow the
principle of ever-changing cycles: By the time an investor has identified the
payoffs, as well as the likelihood of the tendency’s continuation, they are
much diminished.
Moreover, in no field has such little advancement of knowledge been at-
tained as in stock investing during the past century. Not only are most of the
properties of stock prices untested; they are often described in a pre-
scientific manner not susceptible to testing, as we have shown. On
those occasions where properties are stated in a testable fashion,
other deficiencies are present. Invariably, neither a measure of vari-
ability nor the uncertainty attached to the estimate is given. Often the data are
analyzed in such a way that no investor could have acted in time to take ad-
vantage of the supposed relation. The influence of ever-changing cycles is
everywhere neglected.
True, investments are a branch of the social sciences, not the physical sci-
ences, and no immutable rules are to be expected. But the continual use of du-
bious methods and data, the avoidance of testing, the reliance on authority,
the cultish reverence paid to celebrity investors, the pronouncements
of selective gurus, and the attempts to mislead with propaganda,
are far more widespread than in any other field. Of course, the
propagation of these delusive approaches is merely a necessary and
nied_c10.qxd 1/24/03 10:57 AM Page 218

Chapter 10 • The Periodic Table of Investing 219
natural part of an ecological system in which the public pro-
vides the grist for the mill that makes the market wheels turn.
But this does not excuse us from trying to rectify the situ-
ation by calling, “Statistics on the table!”
Begin with the Facts
As the current state of knowledge about investments—disconnected facts and
a few relations—is on a par with what was known in chemistry before the dis-
covery of the periodic table, we start with the disconnected facts we know
about the market:
• Stocks tend to go up at a rate of about 10 percent or 12 percent a year
over most long periods.
• Insiders—the officers and directors of a company—tend to buy and sell
at propitious times.
• The higher a company’s expected growth rate, the higher the current
price relative to current earnings.
• The performance of stocks with higher or negative P/E ratios versus
those with lower P/Es is inconsistent.
• Corporate assets available for activity are the result of and are restricted
by various amounts of debt, original ownership equity, and retained
earnings.
Certain relations are also known about stocks:
• The higher the risk, the higher the return.
• Risk can be reduced by diversification. This risk reduction decreases as
the number of stocks in a portfolio increases. As much as 80 percent of
the maximum risk reduction can be achieved with as few as 15 stocks.
• In most periods, small companies tend to perform better than big
companies.
• Certain kinds of stocks do better at certain times of the year than at
other times.
• Companies that innovate and spend proportionately large sums on re-
search tend to be rewarded, prospectively and retrospectively, more
than companies that concentrate on relatively fixed and unchanging
businesses.
• Companies that have monopolies fixed by the government often perform
better for extended periods than do others (e.g., large pharmaceutical
nied_c10.qxd 1/24/03 10:57 AM Page 219
220 Practical Speculation
companies, with franchises essentially protected by the Federal Food
and Drug Administration bureaucracy, have tended to do well).
The one characteristic that distinguished the periodic table from all previ-
ous attempts at classification was its astounding ability to predict. Mendeleyev
left spaces in his table for as-yet-undiscovered elements and described their
properties in advance. Scandium, gallium, and germanium were discovered
shortly thereafter, with properties closely matching Mendeleyev’s predictions.
In the field of finance, we find a far different situation. Financial predictions
are ridiculed with a contempt usually reserved for weather forecasts:
• Isn’t it strange how the same people who laugh at gypsy fortunetellers
take economists seriously?
• “Ask five economists and you’ll get five different answers (six if one
went to Harvard).”—John Kenneth Galbraith
• “An economist is an expert who will know tomorrow why things he pre-
dicted yesterday didn’t happen today.”—Laurence J. Peter2
Then there was Harry Truman, who said he wanted a one-armed econo-
mist “so the guy could never make a statement and then say, ‘On the other
hand, . . . ’ ”
How helpful it would be if there existed a classification scheme for stocks
as perfect as the periodic table of elements—one that would place companies
into groups according to their properties regardless of their industries or bal-
ance sheets, one that had been scrutinized and tested over many years by aca-
demic and practical users, one not subject to the many ephemeral factors that
affect the moves of stock groups in different bullish and bearish environ-
ments, and most important, one that would enable reliable predictions.
In addition to providing a rudder and base for further research, such an
ideal scheme should provide the same sense of order that standards provide
in such areas as building specifications, electrical wiring, and the diagnosis
and treatment of disease.
Incredibly, a parallel to the periodic table of elements does exist in the
field of stock selection. It has stood the test of time, made money for those
who have used it, provided a method of predicting the performance of stocks
for 37 years, and has been thoroughly vetted and reproduced by academic and
industry evaluators. It is the Value Line stock ranking system.
A Classification System for Stocks
Every week since the early 1970s, Value Line has been classifying companies
into groups. The group or rank is Value Line’s expected price performance of
nied_c10.qxd 1/24/03 10:57 AM Page 220

Chapter 10 • The Periodic Table of Investing 221
the stock for the coming 6 to 12 months. Stocks ranked “1” are expected to do
best, and stocks ranked “5” are expected to underperform. The classification is
based mainly on the quarterly earnings comparisons of the individual com-
panies compared with a cross-section of all companies, and the relative price
performance of the companies.
The elements in the higher period, or row, of the periodic table of ele-
ments tend to be lighter and more common than those in the bottom period.
Similarly, Value Line notes: “Stocks ranked ‘1’ in timeliness are often more
volatile than the overall market and tend to have smaller capitalizations.” This
is a key qualification that is crucial to the study of the validity and reliability of
the classification scheme.
Value Line’s timeliness classification system was invented by Sam Eisen-
stadt, who started as a proofreader at the firm in 1946, fresh out of the Army
after World War II. Value Line was then a sleepy company with 15 employees
in offices in the Borden Building at 350 Madison Avenue. The founder,
Arnold Bernhard, had become interested in a value standard for stocks as a re-
sult of the financial difficulties his family suffered in the 1929 crash.
Bernhard felt that emotional extremes drove the market too high in the
late 1920s and too low in the early 1930s. He noticed that there was a rela-
tionship between annual earnings and stock prices and plotted them on a log-
arithmic scale. He would plot the annual earnings of an individual company
on a transparency and superimpose it over the price history, an early effort at
visual regression. This fitting process would produce a multiplier on the earn-
ings, which could then be applied to an earnings forecast to arrive at a “nor-
mal value.”
This line became known as the Value Line. Stock prices fluctuated above
and below the line—evidence of over- and undervaluation. “I cannot say ex-
actly where Bernhard got the inspiration for this procedure, but I consider it a
major achievement at that time, when stock selection was considered to be an
art, not a science,” Eisenstadt said. “This was a pioneering effort in the at-
tempt to separate stock prices from emotional extremes.”
Mendeleyev, in trying to come up with the classification that would order
the elements into groups with similar properties, put each element on a play-
ing card. On train trips, he played Solitaire with the cards as he tried to sort
them into proper groups. Finally, he came up with the concept of atomic
weights. It had already been observed by John A. R. Newlands—and dismissed
as absurd by the English Chemical Society—that chemical groups repeated
every eight elements, similar to the octave in a musical scale. (Today’s periodic
table sorts by number of protons, instead of by weight.)
As Eisenstadt proofread the records and got to know Value Line’s opera-
tions, it gradually occurred to him that companies might be fitted into rows
nied_c10.qxd 1/24/03 10:57 AM Page 221
222 Practical Speculation
and columns of performance by comparing their characteristics to each other
in a single time period. He came up with the idea of looking at companies in
cross-sections, rather than individually. “Almost like a crossword puzzle,” he
recalled 55 years later in an interview.
The problem was how to order the stocks.
At City College, where Eisenstadt received his training as a statistician,
the cutting-edge technique of regression was just then becoming practical to
implement. As discussed in Chapter 8, regression attempts to find the best
estimate of the linear effect of a group of explanatory variables on a dependent
variable. The method of least squares is usually used to come up with these
estimates. In simple terms, the equation minimizes the sum of squares of the
deviations between predicted and actual values.
Eisenstadt reasoned that he could use least squares regression analysis to
find how all the stock returns in a six-month period were fitted by their most
recent quarterly earnings and price comparisons as well as by their long-term
histories of prices and earnings.
In practice, regression analysis requires large-scale computer power.
Such computers were just then starting to become widely available. Eisenstadt
persuaded Value Line to let him rent time on an IBM 7094—a machine that
computed with one-hundredth the speed of today’s personal computers and
cost about 10,000 times as much.
With five or more variables providing the explanation and hundreds of
stocks to consider, it often took more than one week on a computer as big as a
double-haul truck to come up with the results. Whenever the computer was
turned on, the lights in the entire building dimmed to half their normal
power. Nevertheless, the computer allowed Eisenstadt to analyze companies
in relation to each other, and thereby develop the foundation for the Value
Line classification system.
How Valuable Is Value Line?
How does the system stack up relative to its predictive accu-
racy? Does it refute in any way the proverbs about the gross er-
rors in forecasting?
Because Value Line publishes each week a timeliness and
technical ranking for each of the stocks it covers (currently about 1,700), the
constant churning required for a portfolio to use all the ranking changes each
week would be impractical. Many of the stocks are small and relatively illiq-
uid, and commission costs would eat up most of the gains in a small account.
nied_c10.qxd 1/24/03 10:57 AM Page 222

Chapter 10 • The Periodic Table of Investing 223
A good test of Value Line’s practical value is to take the stocks classified into
each group, using the information that would have been available to sub-
scribers as of the end of each calendar quarter, to look at the performance of
these companies for the next quarter without any rebalancing, and then to re-
peat the process for each subsequent quarter. The results of this test are
shown in Figure 10.1.
The record of the timeliness rankings is stellar. There is a perfect direct
relation between predicted group performance and actual. The average return
of 4.3 percent a quarter for the Group 1 stocks is highly superior to the 1.0 per-
cent average for the Group 5 stocks.
Although a difference of a few percentage points a quarter does not look
like much in isolation, the power of compounding makes the differences
highly significant by the end of the period. One hundred dollars invested in
the Group 1 stocks at the end of the second quarter of 1983 would have grown
to $1,319 at the end of the second quarter of 2001. This is 13 times as much as
the hundred dollars invested in Group 5 would grow and about 2.4 times
as much as Group 3. Results are reported every three months in Value Line’s
Selection & Opinion.As for the statistical significance of the results, the average variability of
the mean quarterly return for each group comes to between 1 percent and 1.5
percent. Thus, the differences between the performance of Groups 1 and 2,
and the other three groups, are three variabilities away from the other, or
about 1 in 500 to have occurred by chance variations alone.
Figure 10.1 Value Line Timeliness Rankings: Quarterly Rebalance,September 30, 1983–June 30, 2002
2.08%
4.31%
3.64%
2.81%
1.01%
5.0
4.5
4.0
3.5
3.0
2.5
2.0
1.5
1.0
0.5
0.0
Per
cent
age
1 2 3 4 5
nied_c10.qxd 1/24/03 10:57 AM Page 223

224 Practical Speculation
Note, however, that the variability of the returns in Group 1 and Group 5
appears to be higher than for the three middle groups.
An interesting practical test of Value Line’s timeliness system is to con-
sider what would happen if we bought the Group 1 stocks and sold the
Group 5 stocks on a quarterly basis. We found that the long-short system
makes money in 75 percent of the quarters. The average performance ap-
pears in Table 10.1.
Looking at the record as a whole, the prospective record of Value Line’s
timeliness rankings is the greatest practical demonstration of forecasting accu-
racy in the history of prediction, dating back at least 4,000 years to the Oracle
of Delphi. The predictions have been disseminated to millions of people, bil-
lions of dollars have been invested in following the predictions, and the
methodology has not changed much over time.
Others support our analysis. Writing in 1973, the Nobel Prize winner Fis-
cher Black reviewed Value Line’s performance and concluded, “Yes, Virginia,
there is hope. . . . Most investment management organizations would im-
prove their performance if they fired all but one of their securities analysts
and then provided the remaining analyst with the Value Line service.”3
Mark Hulbert, dean of accreditation for stock-picking newsletters, put the
Value Line Investment Survey record in perspective as of April 30, 2002. Value
Line was among the top five performers on a risk-adjusted basis in all four of
Hulbert’s evaluation time frames—5 years, 10 years, 15 years, and 20 years.
Hulbert’s calculations are shown in Table 10.2.
Hulbert concluded that an investor need not follow all the weekly Value
Line recommendations to achieve the reported returns. Rebalancing a portfo-
lio once a year with Group 1 stocks would result in about the same perfor-
mance as updating weekly because of savings on brokerage commission and
spread, Hulbert reported in the January 2001 issue of the Hulbert FinancialDigest.4
Table 10.1 Performance of Value Line Timeliness GroupsLong/Short Strategy
(Long Group 1 with Group 5 Hedge)
Group 1 Group 5 Long/Short
Annual return 17.48% 3.08% 12.86%Annual standard deviation 27.53% 23.19% 21.51%Beta 1.323 1.225 0.097
nied_c10.qxd 1/24/03 10:57 AM Page 224

Chapter 10 • The Periodic Table of Investing 225
James J. Choi, in an academic review of Value Line’s performance pub-
lished in the September 2000 Journal of Finance and Quantitative Analysis,concluded:
Value Line’s raw record is impressive. Over the entire sample period, the average
rank portfolio returns are ordered exactly as Value Line predicts. In addition,
Ranks 1 and 2 almost double the market’s annualized return, while the inverse is
true for Rank 5. I find (after extensive statistical attempts to explain the anomalies
away) that Value Line continues to outperform relative to current models of ex-
pected return before transaction costs, with mean abnormal portfolio returns
reaching magnitudes of up to 45 basis points a month, even after controlling for
market momentum and earnings surprise effects.5
Value Line’s Other System
Not as well known as the timeliness effects, and strangely reminiscent of the
periodic table’s bifurcation into groups as well as periods, Value Line has de-
veloped a further classification of stocks based on their technical perfor-
mance. In the spirit of pure technical analysis, these rankings are based on
price moves alone, with particular reference to the changes up to the current
month from each of the 11 previous months.
These rankings are developed by such elementary statistical means that it
almost hurts. The technique is a cross-sectional regression of the price appre-
ciation of each stock on the left side of the equation versus 10 measures of past
short-term and long-term price appreciation on the right side. Eisenstadt
likens the results of the procedure to the movements of a snake slithering up
and down based on the terrain it has just passed and sees ahead but with each
part of the snake’s body dependent on the other. Results on a real-time basis
Table 10.2 Value Line Investment Survey Ranking
Value Line Ranking among Wilshire 5000Investment Survey Newsletters Measured over Annual ReturnAnnual Return (%) (Risk-Adjusted) How Many Years (%)
15.8 2 20 14.412.3 3 15 11.413.5 5 10 11.813.7 4 5 7.7
Source: Mark Hulbert. Used with permission.
nied_c10.qxd 1/24/03 10:57 AM Page 225

226
Tabl
e 10
.3Su
mm
ary
Stat
istic
s
Tim
elin
ess
Gro
ups
12
34
5VL
Arith
met
ic
Geom
etri
c an
nual
ret
urn
15.4
1%13
.13%
9.85
%6.
48%
0.08
%11
.37%
Exce
ss r
etur
n4.
05%
1.77
%−1
.52%
−4.8
9%−1
1.29
%An
nual
sta
ndar
d de
viat
ion
25.9
0%18
.67%
16.0
4%16
.13%
21.6
3%17
.60%
Shar
pe0.
600.
700.
610.
400.
000.
65An
nual
Alp
ha2.
55%
1.80
%−0
.33%
−3.2
4%−1
1.43
%T
(a=
0)0.
711.
16−0
.41
−2.5
7−4
.76
Long
-Sho
rt=
15.3
4%Be
ta1.
231.
000.
890.
871.
10Si
gma
=19
.4%
Corr
elat
ion
with
ben
chm
ark
0.83
0.94
0.98
0.95
0.90
T=
3.39
4%
of t
imes
por
tfol>
bmk
59.7
%62
.5%
40.3
%27
.8%
20.8
%L
>S
70.8
% o
f tim
eT
(% o
utpe
rf=
.5)
1.65
2.12
−1.6
5−3
.77
−4.9
5T(
%>
.5)
=3.
536
T (p
ort.r
et=
mkt
.ret
)1.
541.
25−1
.90
−3.7
5−4
.43
n=
72W
ilcox
RS
1.62
1.92
−2.1
4−3
.70
−4.7
33.
40AC
F(1)
for
exce
ss r
etur
ns0.
03−0
.28
−0.2
60.
030.
000.
08AC
F(2)
for
exce
ss r
etur
ns−0
.18
0.01
0.11
0.01
−0.0
2−0
.22
nied_c10.qxd 1/24/03 10:57 AM Page 226

227
Tech
nica
l Gro
ups
Valu
e Li
ne V
aria
bilit
y1
23
45
VL
Arith
met
ic
Geom
etri
c an
nual
ret
urn
16.2
1%12
.08%
9.51
%6.
69%
−0.9
0%11
.37%
Exce
ss r
etur
n4.
84%
0.72
%−1
.86%
−4.6
8%−1
2.26
%An
nual
sta
ndar
d de
viat
ion
27.9
1%18
.45%
15.7
2%18
.00%
24.1
6%17
.60%
Shar
pe0.
580.
660.
600.
37−0
.04
0.65
Annu
al A
lpha
2.88
%1.
23%
−0.4
0%−3
.71%
−12.
41%
T (a
=0)
0.72
0.68
−0.4
3−2
.20
−3.7
2Lo
ng-S
hort
=17
.11%
Beta
1.30
0.97
0.87
0.95
1.15
Sigm
a=
22.6
%Co
rrel
atio
n w
ith b
ench
mar
k0.
820.
920.
970.
930.
84T
=3.
228
% o
f tim
es p
ortfo
l>bm
k56
.9%
56.9
%38
.9%
30.6
%25
.0%
L>
S 69
.4%
of t
ime
T (%
out
perf
=.5
)1.
181.
18−1
.89
−3.3
0−4
.24
T(%
>.5
)=
3.3
T (p
ort.r
et=
mkt
.ret
)1.
670.
48−1
.99
−2.7
3−3
.32
n=
72W
ilcox
RS
1.40
0.95
−2.2
6−3
.18
−3.6
33.
52AC
F(1)
for
exce
ss r
etur
ns0.
28−0
.08
−0.1
60.
18−0
.04
0.21
ACF(
2) fo
r ex
cess
ret
urns
−0.0
8−0
.01
0.19
−0.2
10.
01−0
.09
Sour
ce:
Valu
e Li
ne.
nied_c10.qxd 1/24/03 10:57 AM Page 227

228 Practical Speculation
are available since 1983. Amazingly, stocks in the Technical Analysis Group 1
have performed even better than the Timeliness Group 1 (see Figure 10.2).
The 1983–2002 performance difference between the top and worst
ranks for the technical groups (4.7 percent versus 0.7 percent) is slightly
greater than for the timeliness groups in the same period. As in the timeli-
ness groups, the variabilities of Group 1 and Group 5 are highest, and all the
results are highly unlikely to have occurred by chance variations alone (see
Table 10.3).
What would happen if the timeliness and technical groups were com-
bined? What reactions—chemical, electrical, or profitable—might arise?
The returns, when classified by both timeliness and technical analysis,
seem to carry what the academics would call incremental information and what
the average user would call opportunities for nice extra profits. Within each tech-
nical “period,” the timeliness groups tend to further segment the returns.
For example, the Timeliness 1 and Timeliness 2 categories give an average
of 6 percent a quarter when ranked with Technical 1 versus about −1 percent
for the three other timeliness categories with Technical 1. Similarly, within the
Timeliness 1 category, the Technical 1 and Technical 2 periods give returns of
5.5 percent versus about zero for the other three Timeliness categories within
Timeliness 1.
As good as the Value Line rankings are by group and period, we can im-
prove them by noting that they seem to work much better in the first and
fourth quarters than in the second and third (see Table 10.4).
Figure 10.2 Value Line Technical Groups: Quarterly Balance, June 30,1983–June 30, 2002
4.7%
3.4%
2.7%
2.1%
0.7%
5.5
4.5
3.5
2.5
1.5
0.5
–0.5
Per
cent
age
1 2 3 4 5
nied_c10.qxd 1/24/03 10:57 AM Page 228
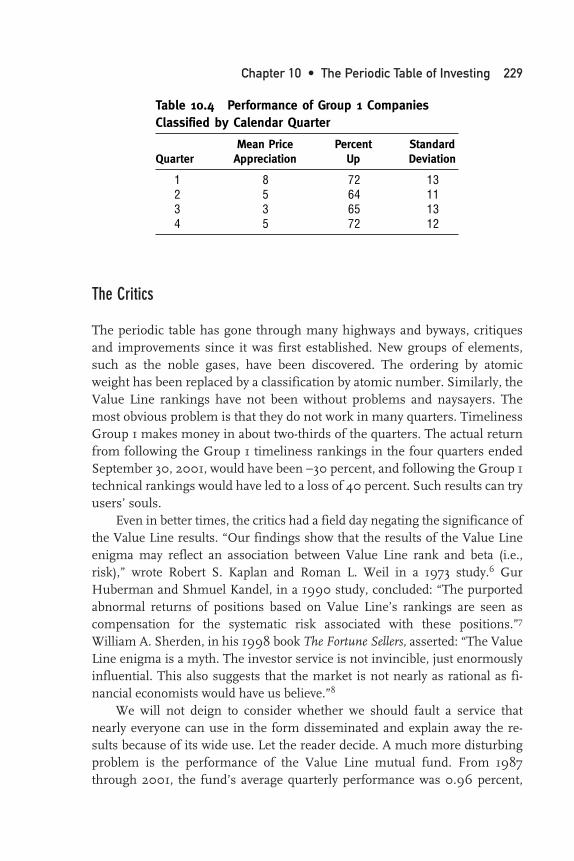
Chapter 10 • The Periodic Table of Investing 229
The Critics
The periodic table has gone through many highways and byways, critiques
and improvements since it was first established. New groups of elements,
such as the noble gases, have been discovered. The ordering by atomic
weight has been replaced by a classification by atomic number. Similarly, the
Value Line rankings have not been without problems and naysayers. The
most obvious problem is that they do not work in many quarters. Timeliness
Group 1 makes money in about two-thirds of the quarters. The actual return
from following the Group 1 timeliness rankings in the four quarters ended
September 30, 2001, would have been −30 percent, and following the Group 1
technical rankings would have led to a loss of 40 percent. Such results can try
users’ souls.
Even in better times, the critics had a field day negating the significance of
the Value Line results. “Our findings show that the results of the Value Line
enigma may reflect an association between Value Line rank and beta (i.e.,
risk),” wrote Robert S. Kaplan and Roman L. Weil in a 1973 study.6 Gur
Huberman and Shmuel Kandel, in a 1990 study, concluded: “The purported
abnormal returns of positions based on Value Line’s rankings are seen as
compensation for the systematic risk associated with these positions.”7
William A. Sherden, in his 1998 book The Fortune Sellers, asserted: “The Value
Line enigma is a myth. The investor service is not invincible, just enormously
influential. This also suggests that the market is not nearly as rational as fi-
nancial economists would have us believe.”8
We will not deign to consider whether we should fault a service that
nearly everyone can use in the form disseminated and explain away the re-
sults because of its wide use. Let the reader decide. A much more disturbing
problem is the performance of the Value Line mutual fund. From 1987
through 2001, the fund’s average quarterly performance was 0.96 percent,
Table 10.4 Performance of Group 1 CompaniesClassified by Calendar Quarter
Mean Price Percent StandardQuarter Appreciation Up Deviation
1 8 72 132 5 64 113 3 65 134 5 72 12
nied_c10.qxd 1/24/03 10:57 AM Page 229

230 Practical Speculation
versus 4.6 percent for the Value Line timeliness rankings over 1983–2001
(see Figure 10.3).
“We’ll always lag the Group 1’s,” said Alan Hoffman, the Value Line mutual
fund’s manager, in an interview. “The Group 1 is a theoretical number that ig-
nores transaction costs and dividends.” Moreover, he noted, the Value Line
fund’s assets range between $300 million and $350 million. Many of the Group
1 stocks trade only a couple of thousand shares a day. “You could never buy
enough of the 1’s to actually make a portfolio of them.”
Mr. Hill Strikes It Rich
We would contrast these results with those of Henry Hill, a long-time Value
Line subscriber from Florida. Starting in 1977, Hill religiously rebalanced his
portfolio every week based on the Group 1 rankings. We spoke to Hill, who is
85, in March 2002. He told us that he turned an initial investment of
“$80,000, something like that,” into $48 million as of 2000, or $26 million
after taxes and living expenses.
Hill began studying the stock market as a civil engineering student at
Purdue University in Lafayette, Indiana, in the 1930s. “My math professor
and I were both interested in the market. We tried to determine what factors
influenced value. We decided consistent growth in earnings was the principal
feature.” After graduation in 1938, he went to work in the petroleum business
Figure 10.3 Value Line Fund versus Timeliness Group 1, 1987–2001.Source: Mark Hulbert. Used with permission.
5.0
4.5
4.0
3.5
3.0
2.5
2.0
1.5
1.0
0.5
0.0
Per
cent
age
Value Line Fund0.79%
1 2
Timeliness Group 14.6%
nied_c10.qxd 1/24/03 10:57 AM Page 230

Chapter 10 • The Periodic Table of Investing 231
in Venezuela, but continued to study the stock market. He heard about Value
Line in 1944. “Sam [Eisenstadt] had almost the same approach as I did. But I
was having a hell of a time following 20 stocks by hand, and he had a com-
puter. That was the last time I did any work” on picking stocks.
Hill says he has a solid wall of account transaction records that impressed
the CPA sent down by Money magazine to audit him for an article three or four
years ago. Until recently, he bought all 100 of the Timeliness Group 1 stocks,
rebalancing his portfolio every week. “Five or six years ago, when Sam [Eisen-
stadt] checked on the technical rankings, it looked like there would be some ad-
vantage to confining ourselves to stocks ranked Group 1 from both the
Timeliness and Technical standpoints.” This reduced the stocks in his portfolio
to between 18 and 46. “It made it easier to manage the account.”
In 1999, facing a serious illness and concerned that his wife, Ollie, would
find managing the account burdensome, Hill liquidated his stocks and
bought Treasury bills with the proceeds. As it happened, the market was
about to begin its worst downturn since the 1970s. The account now provides
a tax-free income of $1 million a year.
Thus, the practical implementation of Value Line ratings has made
Mr. Hill rich.
A Mind Still Open after 58 Years
As Will and Ariel Durant wrote in The Lessons of History after a lifetime of
studying the panoply of world history, it is appropriate to ask at the end of a
seminal study what use the study has served. Have you found in your work
only amusement, only a method of scratching out a living amid a stormy mar-
ket, a way of finding some good and bad stocks? Have you learned anything
about the nature of markets, of companies, of science?9
Sam Eisenstadt is alive and kicking after 58 years of continuous service at
Value Line, and well able to reflect on his record. In 2001, in fact, he attended
a swing dance night at the Niederhoffer house and danced circles around
most of the younger attendees—including Victor, who still fancies himself
something of an athlete. In October 2001, Eisenstadt graciously consented to
an interview to look back over his career. We started by asking him why he
feels the timeliness classification has worked and whether he was discour-
aged by recent results.
“The rationale behind using earnings momentum and earnings surprise
is their tendency to persist, which does not get fully priced into the stock,” he
said. “At least, that is what academic studies seem to show. The fact that they
nied_c10.qxd 1/24/03 10:57 AM Page 231

232 Practical Speculation
have not worked well recently is more a reflection of a ‘value’ bent to the mar-
ket than the argument offered. I daresay when the market reverts (as it always
has) to a growth orientation, you’ll see a revival in both earnings momentum
and surprise.”
We asked him if he is pleased by what he has accomplished. “To some ex-
tent, I am pleased—primarily by questioning the efficiency argument. In the
late sixties, Wall Street was on the defensive with an onslaught from the Uni-
versity of Chicago claiming that we were all in effect wasting our time. There
was no response forthcoming from the financial community. We had a record,
albeit a short one at the time, that indicated we were on to something. Since
then, the efficient market adherents have softened their arguments, and I
daresay Value Line had something to do with it.”
Value Line initially placed much importance on time series analysis, but
changed its approach in 1964–1965. We asked Eisenstadt why.
“We were trying to separate stocks from one another. Time series sepa-
rates years from one another—finding years of over- and undervaluation. Our
problem was to differentiate stocks. In order to do so, we had to measure all
stocks with a common yardstick, rather than a different formula for each com-
pany, which resulted from time series analysis. Since we assumed we could
not predict the market, it made sense to reduce everything to a relative basis
and bypass the market forecast. There were always relatively underpriced or
overpriced stocks—regardless of the level of the market.”
Then we asked the hard question. What would he have done differently?
“In the early years, we spent almost all the time working with time series
analysis—a leftover from the visual fittings that Arnold Bernhard had devised
in the early thirties. Early on we started to use multiple regression analysis to
increase the number of factors and years to get better fits—which, of course
the process produced. Despite the better fits, we did not get the kind of results
we were striving for. We were attempting to predict absolute prices for indi-
vidual stocks using their own histories of prices, earnings, dividends, and
book values, and so on. Because we were dealing with absolutes, we had peri-
ods of time when most stocks were undervalued or overvalued, without saying
much about individual stocks.
“We spent many years [until 1965] working in this environment. It’s dif-
ficult for me to take myself back, since at this point I know the future, but I
should have gone to cross-sectional analysis at a much earlier time and
changed the system to a relative [ranking] basis.
“As for the future—50 years from now—I think stock selection will be-
come increasingly difficult. We will become more and more dependent on ac-
curate earnings forecasts, which I suspect have not improved much over the
nied_c10.qxd 1/24/03 10:57 AM Page 232

Chapter 10 • The Periodic Table of Investing 233
years. With computers humming and quants concentrating on the field, I can
only see the problem becoming increasingly difficult. We’ll have to keep up
with the development of new statistical techniques and high-powered com-
puters to provide us with an edge.”
He concluded with some enduring guidance:
I have learned that stock selection is not a random process. The application of sta-
tistical methods can be helpful, but it is very difficult to outperform the market.
We are working with very low information coefficients that become statistically
significant when the universe is large. Nor does the system work
equally well in all phases of the market. There are times when a
“value” approach produces better results. The system is adaptive,
however, and adjusts to a changing environment. If the environment
changes rapidly and frequently, it creates difficulties for the system. Nevertheless,
over the 36-year history of the system, it has had a respectable batting average and
attracted the attention of the academic community.
His advice for future investigators: “Don’t give up and become compla-
cent. We’re only explaining a tiny amount of the unknown. Be curious, keep
an open mind, and persist.”
nied_c10.qxd 1/24/03 10:57 AM Page 233

nied_c10.qxd 1/24/03 10:57 AM Page 234

235
11 W H E N T H E Y S W I N GF O R T H E F E N C E S , W E
R U N F O R T H E E X I T S
What Should I Trade?
Lyrics by Victor Niederhoffer and Laurel Kenner. To the tune of“What Is a Man?” from Pal Joey by Richard Rodgers andLorenz Hart.
There are so many, so many ways to tradeBut baseball is the model that’s for meIt tells the Average JoeHow he can make some doughThe times change far too much to trade without it
1. What’s a good trade?Should I buy stocks now?Am I a bull? Am I a bear?Am I the value or the growth kind?Am I the old or the tech kind?
What’s a good trade?Trading’s like baseball
nied_c11.qxd 1/24/03 10:56 AM Page 235

236 Practical Speculation
Win with a bat, or win with a glove.Value has lagged since the world beganWhat should I buy? What should I sell?What makes a winning trade?
2. First, runs expandStocks set to fall thenNext, runs contract—bull’s horns are sharpIt’s all so easy after the factVol first goes down, Bulls are set to frown
When balls are dead, Time to steal basesWhen balls are live, Swing from the heelsCycles have changed since the world beganOffense at times, Defense at times.That makes a winning trade.
One afternoon in March 2002, we were sitting on a bench on 81st Street
with Larry Ritter, dean of baseball history, talking about players and
seeing how far Vic could hit a tennis ball down Broadway. We both knew we
were in the presence of one of the greats, and requested Larry’s advice on how
to begin this chapter. He told us to always begin with Babe Ruth. There really
is no better way to begin, because the Babe epitomizes an important predic-
tive relation between baseball and the stock market. We call it the Home Run
Indicator. Consider:
• In 1927, two years before the Crash, Ruth hit a record 60 home runs.
Similarly, in 2000, two years after Mark McGwire broke Roger Maris’
record of 61 home runs in 1998, the market began to decline drastically.
• In the 1930s, Ruth’s slugging dropped to .500 and lower; and America
slid into the Great Depression. (We’ll return to this pattern of home
runs and market moves.)
nied_c11.qxd 1/24/03 10:56 AM Page 236

Chapter 11 • When They Swing for the Fences, We Run for the Exits 237
Unlike the well-known Super Bowl Indicator (mentioned as a
spurious correlation in Chapter 8), the Home Run Indicator does
not rest on the outcome of a single game. Rather, it relies on the
tendency of long-term trends in the market and society to show up
first on the baseball field. Two examples:
1. The internationalization of baseball preceded that of the stock market
by more than 100 years. Baseball teams toured the world starting in
1888, but the New York Stock Exchange listed its first foreign company
only in 1990.
2. Baseball was integrated in 1944, with Jackie Robinson breaking the bar-
rier. The NYSE didn’t admit its first black member until 1967. (The
first female member was admitted in 1970.)
The foreshadowing quality of baseball is detailed in the time line at the
end of this chapter. But for the investor, it is the game itself—home runs, in
particular—that bears the most watching.
Win with a Bat or Win with a Glove (Artist: Milton Bond, © 1993).
nied_c11.qxd 1/24/03 10:56 AM Page 237

238 Practical Speculation
To explain, we need to go back to the first two decades of the twentieth
century—“the dead ball era”—before the Babe gave up pitching and took up
batting in earnest. The balls were called “dead” because they did not carry long
distances no matter how hard they were hit. Spitballs and doctored balls were
permitted, favoring the pitchers. Earned run averages of 3 were the norm. The
offense was fought with bunts, slides, sacrifice flies, place hitting, and base
stealing. “Brains were as important as brawn,” wrote Ritter, “maybe more so.”
Home runs were rare. From 1901 to 1918, total home runs declined from 455 a
year to 235. In 1908, Sam Crawford led the league in home runs—with seven.
Outside the ballpark fences, the market languished. In 1918, the Dow closed at
82.20, little more than double the 40.94 at which it began life in 1896.
After the hard days of World War I, authorities eliminated spitballs and
other doctored balls, put cork in the ball to liven it up, changed the balls more
frequently, and outlawed trick pitches. The Babe started swinging from the
heels. His slugging percentage went from the .400-to-.500 level to .847 in
1920, and stayed at .600 or higher for the next 10 years. Ruth’s transformation
from pitcher to batting star serves as the starting point of the no-holds-barred
spirit of the 1920s. “I swing big, with everything I’ve got,” said Ruth. “I hit big
or I miss big.” From 1918 to 1930, home runs increased from 235 to 1,565 a
year. In the world beyond the fences, business was expanding. In 1924, after
treading water for the prior decade, the Dow had five years of unbroken gains,
rising 260 percent through the end of September 1929.
As the century progressed, home runs continued to predict and reflect
the stock market and society:
1935 to 1943: The number of home runs diminished. Bunting and sacri-
ficing again came into fashion—appropriate to the Depression-era
psychology that gripped the market.
1943 to 1952: Home runs expanded. Stars like Ted Williams came to the
fore. From 1948 to 1965, the Dow soared from 119 to 969.
1963 to 1991: Home runs diminished. A major star of the period was Lou
Brock, who stole a record 118 bases in 1974. “Brock,” wrote Ritter,
“represented a return to the old-fashioned style of baseball: bunting,
stealing, trying to out-think the opposition.” In the world outside the
ballpark, recessions and market crashes became the rule.
After major setbacks in 1966, 1969, 1973–1974, and 1977, the Dow fin-
ished 1981 at 875, or 9 percent below its 1965 close.
After a players’ strike in 1994 threatened interest in the game, a general
move toward immediate gratification came about in the area of sports and, dare
we say it, in the offices of the nation’s capital. Home runs once more began to
nied_c11.qxd 1/24/03 10:56 AM Page 238

Chapter 11 • When They Swing for the Fences, We Run for the Exits 239
climb. The market, too, slowed down a bit in 1994 when the Federal Reserve
doubled the federal funds rate; but after that it was up and away for the averages.
Table 11.1 shows the combined home run totals for the American and
National Leagues during the 1990s, alongside the Dow league’s year-end
closing levels.
Playing to the Crowd
Two questions arise: What causes the cyclical shifts in home runs? Why
should home runs foreshadow market moves?
We hypothesize that the owners of Major League baseball teams act to
anticipate the mood of the fans by adjusting the balance between offense and
defense. If hard times are ahead, they tone down the game, making the bat-
ters work harder for home runs so that the audience can feel catharsis. If the
spirit of the times is expansive, they liven up the action and let
the home run records roll. The owners can make these
changes by changing the rules in myriad ways: Balls, bats, and
gloves change; the surface and size of the fields change; the
strike zone changes; pitching rules change. These things can occur gradually,
over several years. In the meantime, the market is likely to catch up.
We see another element at work. The scientific play that dominated in
1900–1918, 1932–1946, and 1970–1977 represented the kind of attention to
detail and hard work that is apparently a precondition to success. A period of
Table 11.1 Home Runs by Year
Baseball DowYear Leagues League
1990 3,317 2633.661991 3,383 3168.831992 3,038 3301.111993 4,030 3754.091994 3,305 3834.441995 4,081 5117.121996 4,962 6448.271997 4,640 7908.251998 5,064 9181.431999 5,528 11497.122000 5,693 10786.852001 5,458 10021.502002 5,059 8341.63
nied_c11.qxd 1/24/03 10:56 AM Page 239

240 Practical Speculation
small gains leads, both in baseball and markets, to a desire for home runs. In
baseball, it led to Babe Ruth in the 1920s, and to Mark McGwire and Barry
Bonds in the 1990s. In the market, we had the Roaring Twenties, the postwar
boom of the late 1940s and 1950s, and the great bull market of 1982–2000.
After each period of scientific baseball, the market was ready for a sustained
rally. Conversely, after the end of each period of home run “hitting-from-the-
heels” baseball, the market was ready for a drop.
Before the 1990s, it was customary after a home run for the hitter to qui-
etly run around the bases with his head down so as not to embarrass the
pitcher. When he reached the plate, he might discreetly doff his hat to the fans.
As the bull market of the latter half of the 1990s rolled on, it became common
for home run hitters to indulge in a bit of trash talk, a shuffle to first base and
then a roll of the bat. Some longtime fans were appalled.
Baseball did seem to have an ability to predict the market.
But as with all important questions, a test was necessary.
Although the beginning and ending of the expansion and
contraction periods in home runs were somewhat arbitrary
(Is a one-year spike to a new high preceded by two down years a high, or a
temporary reversal?), we started with five-year highs in home runs over the
past 100 years. We then looked to see what happened in the stock market the
next year.
When home runs were not at a five-year high, the market went up 12 per-
cent the next year, on average; when they were at five-year highs, the next year’s
average move was a 2 percent gain (see Figure 11.1).
Next, we studied the relation between five-year changes in home runs
and the next five years’ performance in stocks. The correlation was −0.20,
with 20 observations, a level fairly unlikely to have occurred through chance
variations alone.
Finally, we looked at the correlation of home run changes one year and
stock market changes the next year. The correlation was −10 percent. The bot-
tom line was that every extra 10 percent increase in home runs knocked 1 per-
cent off the market the next year.
Taken together, the three relations provide confirmation that overly nu-
merous home runs presage poor stock performance.
New Century, New Game
The late 1990s differed in an important aspect from previous periods: While
the home run records kept coming, so, amazingly, did record strikeouts. Bill
nied_c11.qxd 1/24/03 10:56 AM Page 240

Chapter 11 • When They Swing for the Fences, We Run for the Exits 241
James attributes the conjunction of record strikeouts and homers to smaller bat
handles, aluminum bats, strength training, and abbreviated pitcher motions.
On the one hand, we had fundamentalist primitives who didn’t understand the
value of compound growth (10 percent for 20 years = eightfold return); and on
the other, day traders with microterm mentalities and a quest for immediate
gratification that deflected us from the hard efforts required for a proper base of
operations in the market.
In keeping with our hypothesis, the market followed suit. Huge swings
that previously might have occurred once a year became commonplace in the
first three years of the new century.
A favorite theme of ours is that the common man often provides a better
reflection of what the future holds for the market than the more sophisticated
experts and professionals at the higher levels of the feeding pyramid. As popu-
lar as basketball and football are, baseball holds a unique position in the Amer-
ican psyche because it is a game that ordinary Joes and Janes can relate to.
Baseball is the only sport where people of average height, weight, speed, and
strength can play at the highest level. The median height and weight of Amer-
ican baseball players is 5 feet 10 inches, 190 pounds—the average for all U.S.
adult males.
Figure 11.1 Home Runs and Dow Change
160.0
140.0
120.0
100.0
80.0
60.0
40.0
20.0
0.0
–20.0
–40.0
1906
–191
0
1916
–192
0
1926
–193
0
1936
–194
0
1946
–195
0
1956
–196
0
1966
–197
0
1976
–198
0
1986
–199
0
1996
–200
0
Per
cent
Cha
nge
Home Runs Percent Change
5-Year Period
Dow Percent Return
nied_c11.qxd 1/24/03 10:56 AM Page 241

242 Practical Speculation
As the late team owner Bill Veeck said, “Baseball is the only game left for
people. To play basketball now, you have to be 7 feet 6 inches. To play football,
you have to be the same width.”
It is not just that people of average physique can rise to the top in base-
ball. Baseball is geared to the future volitions and tastes of the average Joe. Be-
cause markets themselves are in many ways affected by the normal activities
of the average person, baseball provides a forecast of the market and life as
well as a reflection of current times (see Table 11.2).
From Mark Twain in the nineteenth century to Jacques Barzun in the
twenty-first century, everybody agrees that baseball reflects American society.
Paul Dickson found the thought so obvious that when he was putting together
Baseball’s Greatest Quotations, he rejected all observations along those lines.1
For Mark Twain, baseball was “the very symbol, the outward and visible ex-
pression of the drive and push and rush and struggle of the rising, tearing,
booming nineteenth century,” as he put it at an 1888 dinner at Delmonico’s
sponsored by Albert Goodwill Spalding, an early impresario of the game.
More than a century later, in 2001, Major League baseball played to some 75
million fans, more than any other sport.
Baseball has always reflected America’s sorrows and flaws along with its
good. Abner Doubleday, who would become a heroic general in the Battle of
Gettysburg, invented the game in 1839 at Cooperstown, New York. African
Americans were barred from the game, a taboo not broken until Jackie Robin-
son played for Brooklyn in 1944. A strike closed the gates in the recession year
of 1974. The World Series was postponed as the nation mourned the attack on
the World Trade Center on September 11, 2001, and the resumption of play six
days later was seen as a necessary step toward getting back to normal. News-
papers noted, for once without cynicism, that President George W. Bush
watched the first two games of that Series at Camp David with his family, and
that he was in New York for Game 3 to throw the first pitch. It was a strike, and
New Yorkers gave the president a thunderous cheer. “It means a lot that he’s
here today. It shows that this guy is a real man,” Al Meditz, 58, a mail carrier
from Rego Park, Queens, told the New York Post.After all the ribbing Bush received about his inability to speak with proper
grammar, his short work weeks, and his supposed general lack of intelligence
(he graduated in the top half of his class at Harvard Business School and re-
ceived an MBA while Vic was there), one can imagine that his pitching would
have been the object of great ridicule in any other circumstances.
The only other two presidents to attend a World Series game, Ronald Rea-
gan in 1980 and Calvin Coolidge in 1920, did so at the beginning of gigantic
bull markets.
nied_c11.qxd 1/24/03 10:56 AM Page 242

243
Table 11.2 Time Line of Baseball and Financial Markets 1792–2001
Baseball Date Markets
1792 Five securities traded
1829 380,000 shares traded
1830s Railroads dominate
1836 Trading prohibited in streets
First formal rules created 1845
First official game between twoclubs
1846
1853 Complete statement required
First league 1857
First admission fee (50 cents) 1858
First betting scandal 1865 First permanent home for NYSE
First all-pro team (salaries $1,400) 1869 All shares must be registered
Nat ’l Association of Baseball Players 1871 Specialists are created
First no-hitter 1875
First Nat ’l League home run 1876
First scandal in major leagues 1878 First telephone on the floor
First players’ union 1886 First million-share day
1896 Dow Jones average introduced byWall Street Journal
First modern World Series 1903 NYSE moves to current site
1907 Wall Street panic
1913 Federal Reserve System created
First game to draw 1 million fans 1920 Dow ends year at 71.95
“Lively ball” introduced; Babe Ruthhits 54 home runs in single seasonFirst player earns $50,000
1923
Babe Ruth hits 60 home runs 1927
First player hits 500 career home runs 1929 Crash
1932 Dow hits bottom
First All-Star game 1933 Securities Act of 1933
1934 SEC formed
(continued)
nied_c11.qxd 1/24/03 10:56 AM Page 243
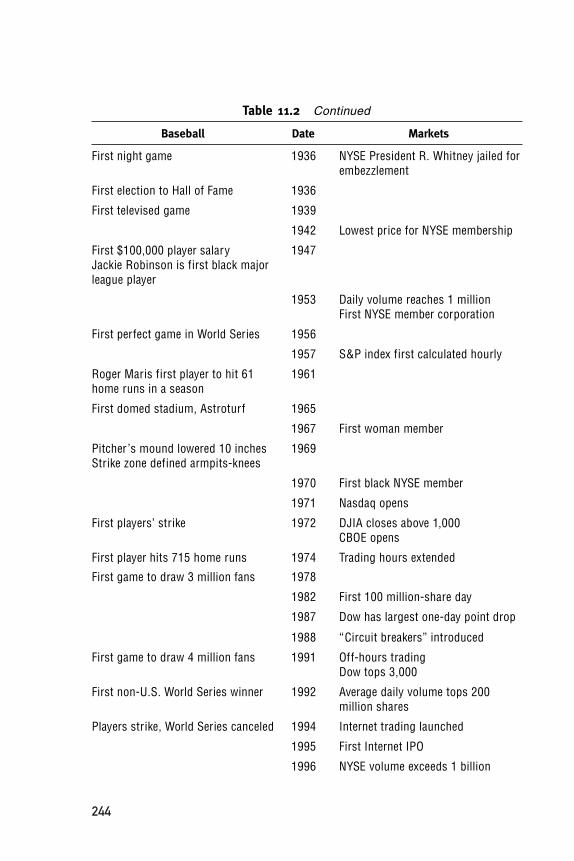
244
Table 11.2 Continued
First night game 1936 NYSE President R. Whitney jailed forembezzlement
First election to Hall of Fame 1936
First televised game 1939
1942 Lowest price for NYSE membership
First $100,000 player salaryJackie Robinson is first black majorleague player
1947
1953 Daily volume reaches 1 millionFirst NYSE member corporation
First perfect game in World Series 1956
1957 S&P index first calculated hourly
Roger Maris first player to hit 61home runs in a season
1961
First domed stadium, Astroturf 1965
1967 First woman member
Baseball Date Markets
Pitcher ’s mound lowered 10 inchesStrike zone defined armpits-knees
1969
1970 First black NYSE member
1971 Nasdaq opens
First players’ strike 1972 DJIA closes above 1,000CBOE opens
First player hits 715 home runs 1974 Trading hours extended
First game to draw 3 million fans 1978
1982 First 100 million-share day
1987 Dow has largest one-day point drop
1988 “Circuit breakers” introduced
First game to draw 4 million fans 1991 Off-hours tradingDow tops 3,000
First non-U.S. World Series winner 1992 Average daily volume tops 200million shares
Players strike, World Series canceled 1994 Internet trading launched
1995 First Internet IPO
1996 NYSE volume exceeds 1 billion
nied_c11.qxd 1/24/03 10:56 AM Page 244

Chapter 11 • When They Swing for the Fences, We Run for the Exits 245
Baseball’s freedom from the tyranny of the time clock harkens back to the
pastoral past recalled by the green field itself. The game originated in the days
when Americans began coming en masse from the farm to find jobs in the
cities. The game continues at its own pace, regardless of the demands of spon-
sors. In the shortest game, the New York Giants beat the Philadelphia Phillies
6–1 in 51 minutes on September 28, 1919. The longest game, between the
Chicago White Sox and Milwaukee on May 9, 1984, lasted 25 innings and
took eight hours and six minutes. While variations in tennis games often
range to similar multiples, the length of the matches offer no competition.
We note with admiration the average American’s delight in the amazingly
detailed record of statistics concerning every aspect of the game. When a player
hits a home run, before the batter has rounded third, fans can expect a recap of
how many similar blows have been struck, classified by inning, score, handed-
ness of pitcher and batter, and whether the event occurred at
home or away. At a 2001 Yankee playoff game co-announced by
New York Governor George Pataki, it was mentioned as a matter
of routine that a certain batter had the third highest percentage
of foul balls per pitch with two outs during playoffs of all American League play-
ers. If only market practitioners were to keep at their fingertips one-thousandth
of that kind of knowledge about the picks of their favorite analysts—returns to
be anticipated, winning streaks, balls, strikes, and so on—the market would be a
far more sensible and profitable place.
Table 11.2 Continued
Baseball Date Markets
Mark McGwire first to hit 70 homeruns in a season
1998
1999 Dow closes above 10,000
2000 First global indexDow has biggest up, biggest downdays
Barry Bonds first to hit 73 homeruns in a season
2001 NYSE volume tops 2 billionDecimalization replaces eighths
nied_c11.qxd 1/24/03 10:56 AM Page 245

nied_c11.qxd 1/24/03 10:56 AM Page 246
247
12 B O O M O R B U S T ?
That land speculation is the true cause of industrial depres-
sion is clearly evident. In each period of industrial activity land
values have steadily risen, culminating in speculation, which
carried them up in great jumps. This has been invariably fol-
lowed by a partial cessation of production, and its correlative,
a cessation of effective demand, and then has succeeded a pe-
riod of comparative stagnation, during which the equilibrium
has been again slowly established.
—Henry George, Progress and Poverty 1
Real estate, fixed and immovable, might seem an ideal alternative to a
roller-coaster stock market. Yet real estate prices are every bit as subject
to violent price swings. Real estate investment trusts (REITs)—the main way
that small investors can invest in large-scale income properties—have failed
to measure up to stocks as long-term investments. Of course, a $17 trillion
market that includes office buildings, residences of all types, farmland, ware-
houses, industrial property, and hospitals offers endless variations, niches,
and opportunities for profit; and it is impossible to quantify all the benefits of
nied_c12.qxd 1/24/03 10:55 AM Page 247

248 Practical Speculation
owning a home. The investor, however, may find that the best profits will
come from studying the patterns linking real estate and business cycles.
Begin with the big picture. At once a source of wealth, a factor in busi-
ness production, and a consumer good, real estate is the largest of any asset
class. Federal Reserve statistics show the value of U.S. commercial property
at $5 trillion and U.S. residential property at $12 trillion. This compares to
some $11 trillion in stocks and $5 trillion in corporate bonds. About 50 million
people own homes in the United States, but that is not the end of the story.
Because real estate represents about 20 percent of the assets on every corpo-
rate balance sheet, anyone who holds stocks has an interest in real estate.
Americans have a large part of their wealth in real estate, probably more than
they realize. Real estate absorbs a sizable portion of the money that people
spend—some 10 percent to 20 percent of typical business operating ex-
penses, and at least one-third of a typical family’s income. It is a factor in all
production and spending decisions.
Everything that happens takes place on real estate. Like the grinding of
tectonic plates across the earth’s surface, changes in real estate prices affect
everything above, causing earthquakes; volcanic eruptions; and continental
drift in business activity, personal wealth, and the stock market. Fortunes are
made and lost in such epochal real estate slumps as occurred in the periods
1972–1974, 1989–1990, and 1998–1999.
Several theories attempt to pinpoint the cause of real estate cycles. David
Ricardo and Henry George observed in the nineteenth century that rents and
land prices rise when business is good, absorbing the extra
profits generated. The price rise is exacerbated as speculators
jump in near the top. Eventually, business staggers under the
burden, rents and mortgage payments go unpaid, and land prices crash. But
hope springs eternal, and real estate eventually becomes cheap enough to let
entrepreneurial business plans pencil out.
Going back into history, the demise of great speculative land opera-
tions—the South Sea Company in England and the Mississippi Company
in France—created wholesale financial panics. The memoirs of the great
eighteenth-century speculator Giacomo Casanova detail how he used such
excesses for the mutual benefit of himself and his amours. In modern days,
who can forget 1980s Japan, when the few acres around the imperial palace
in Tokyo commanded a higher price than all the real estate in California? Or
the 1990s tech boom that drove Silicon Valley rents and land prices up hun-
dreds of percent? In both cases, as in so many others, disaster soon followed.
Yoon Dokko, of Korea’s Ajou University, and colleagues at University of
California Berkeley note that many explanations of real estate cycles feature
nied_c12.qxd 1/24/03 10:55 AM Page 248

Chapter 12 • Boom or Bust? 249
“the greedy developer” and “the bumbling lender.” This is because bankers
apparently like to lend as long as business conditions are good, whereas de-
velopers have a complementary tendency to borrow so long as credit flows.
The resulting oversupply brings down prices.2
Both of us have firsthand experience with the real estate cycle’s power to
turn life upside down. After first losing their stake in the stock market, Vic’s
family tried to rebuild by buying depressed properties at foreclosure sales in
the 1930s. When the investments failed to pay off, speculation became a dirty
word in the Niederhoffer family until the late 1950s, when Vic gingerly took
his first steps into buying mining properties on the American Stock Exchange.
Almost four decades later, a financial collapse in Thailand brought about by
massive overbuilding forced Vic to close his hedge fund and mortgage his
home. Nobel Prize winner Joseph Stiglitz, asked about the causes of Southeast
Asia’s market collapse in a June 2000 interview with the Progressive, went to
the heart of the problem: “The biggest problems were the misallocations of
lending to speculative real estate, and risky financing, especially borrowing
short-term debt on international markets.”3
Laurel’s father, John Kenner, a mortgage banker, had a quick eye for
value. But he lost his livelihood in the 1972–1974 REIT collapse, after refusing
to sign off on what he considered to be inflated appraisals of commercial prop-
erties. Unfortunately, most of his wealth was tied up in the company REIT.
Promoting REITs
REITs originated in 1880 as tax-advantaged vehicles for purchasing real es-
tate. The tax advantages have been removed and restored over the years, but
under current law, REITs can avoid corporate taxes if they distribute at least
90 percent of net taxable income. The main idea behind REITs is to give
small investors opportunities to invest in office buildings, warehouses, hospi-
tals, shopping centers, apartment houses, and other large properties. REITs
are thus similar to stock mutual funds, which let investors hold interests in a
greater number of stocks than the size of their stake would otherwise permit.
In addition to the tax benefits, REITs offer improved liquidity over direct
investment in real estate because investors can easily sell their shares. Dividend
returns for REITs generally vary from 6 percent to 8 percent. REITs and real es-
tate mutual funds experienced a tremendous surge in 2000–2002, when the
Nasdaq—consisting mainly of growth stocks that pay no dividends—lost three-
quarters of its value, and investors sought safety in dividend-paying stocks. As
of mid-2002, there were some 300 REITs, 190 of them publicly traded, with a
nied_c12.qxd 1/24/03 10:55 AM Page 249

250 Practical Speculation
combined market value of about $300 billion, up from $13 billion in 1992. In
addition, some 130 open-end U.S. mutual funds are devoted to real estate, with
holdings consisting of REITs, real estate operating companies, or a mixture of
the two. The largest are run by Cohen & Steers, Fidelity, and Vanguard (see
Table 12.1).
Like all dynamic fields, the REIT industry undergoes constant innovation
and turmoil. In the late 1990s, existing properties were transferred to um-
brella REITs, but these vehicles proved unpopular because they subjected in-
vestors to unrealized gains. The turn of the millennium brought master
partnerships to invest in assorted REIT mutual funds; some feared that this
development was symptomatic of a top.
Promoters seized the opportunity to capitalize on the growing popularity
of REITs. One well-publicized study after another presented REITs as ideal
components of a diversified portfolio. It was claimed that the industry had
outgrown the massive liquidations and boom-and-bust cycles of the 1970s
and 1980s, and that the problems of those days—too much debt, too little
transparency, and too many conflicts of interest involving management—had
been overcome. As discussed in this chapter, real estate cycles have existed for
centuries. It is unlikely that they have suddenly disappeared for good.
To objectively evaluate even past REIT performance is no easy task. It is
difficult to find good data on real estate and REITs. Many figures on real estate
prices are based on appraised values, not on transaction prices. Using ap-
praised values tends to smooth out variations in returns while creat-
ing spurious correlations. The difficulty is that transactions in the
same properties are relatively infrequent, and prices vary with re-
spect to property type and locality.
Survivor bias, as discussed in Chapter 3, compounds the data problems.
The data that get reported and saved tend to relate only to properties that
manage to escape bankruptcy, disuse, or drastic change. The National Asso-
ciation of Real Estate Investment Trusts (NAREIT) has data on REIT returns
Table 12.1 Morningstar Ratings
Net AssetsFund (in Billions $) Morningstar Rating
Cohen & Steers Realty 1.38 ★★★★★Vanguard REIT Index 1.33 ★★★★Fidelity Real Estate 1.26 ★★★
Source: Morningstar.com
nied_c12.qxd 1/24/03 10:55 AM Page 250

Chapter 12 • Boom or Bust? 251
and appraised values of real estate held by selected institutions going back to
1970, but apparently only companies that have continuously provided data to
NAREIT are included in the database.
An exhaustive study of REIT prices by Jun Han of CIGNA Investment
Management in Hartford, Connecticut, and Youguo Liang, a managing direc-
tor at Prudential Real Estate Investors, included data on all publicly held com-
panies that were classified as REITs during the period 1970–1993. Han and
Liang concluded that the survivorship bias of NAREIT data compared with
their own was in the range of 2 to 3 percentage points a year.4
Brokerage house reports do not help investors evaluate REITs. The three
key metrics that tend to be analyzed are:
1. Price to funds from operations.
2. Dividend yield.
3. Discount to net asset value.
These are combined by the analyst in some fuzzy way, with high values of
the first being bearish and high values of the latter two being bullish. This
number is compared with an expected growth rate, and if the comparison is
good, it generates statements like the following from a major brokerage house
in early 2002:
We estimate REITs are trading at 93 times our 2002 FFO estimates at a 5 percent
discount to net asset value, and are sporting an average dividend yield of 7. We are
forecasting a 5 percent earnings growth, with earnings rates likely to accelerate if
occupancy levels rise or interest rates continue to fall. We believe the REIT insti-
tutional and retail investor base will continue to expand.
A fourth metric that REIT analysts like to use is the spread between a
REIT’s dividend yield and bonds. During volatile times in the market, such as
the credit crunch of 1998 and the period after September 11, the spread
widens. According to Bank of America research, inordinate duration of high
spreads is indicative of future superior performance for REITs. The trick is to
differentiate a high spread that might illustrate undervaluation from a high
spread that appropriately takes increased risk into account.
REITs versus Stocks
Given all the booms and busts in real estate over the centuries, the vast diver-
gences in prosperity among sectors ranging from apartments to farmland to
warehouses, the vicissitudes of regional cycles, and the grave difficulties in
obtaining accurate price data in an industry characterized by bankruptcies,
nied_c12.qxd 1/24/03 10:55 AM Page 251

252 Practical Speculation
closings of real estate enterprises, and the tearing down of buildings—is there
anything we can say about the long-term returns from holding REITs, com-
pared with common stock?
Our studies show that, until recently, the performance of stocks and
REITs had been strongly linked, with a 50 percent correlation on an annual
basis. The relation broke down in the late 1990s. REITs tumbled as the S&P
500 doubled in 1997–1999, but gained 43 percent in 2000–2001 when the
S&P 500 declined 22 percent (see Table 12.2).
This led the REIT industry to loudly proclaim that the correlation be-
tween the two asset classes was decreasing. The implication was that institu-
tional portfolio managers must buy REITs to achieve a proper balance of risk
and reward. Such a development has been the goal of the REIT industry for
decades. One industry-sponsored study after another has tried to prove that a
diversified portfolio of REITs and stocks is better than a portfolio of stocks
alone. On May 29, 2001, the National Association of Real Estate Investment
Trusts published a study by Ibbotson Associates Inc., the dean of market re-
turn statistics, purporting to show that REITs “represent a strong source of di-
versification for a wide range of investment portfolios by increasing return
and decreasing risk.”5
Regrettably, all the careful studies of these phenomena show
very small, if any, incremental returns from such diversification.
Ronald Kaiser, a principal in the Foster City, California, real estate
advisory firm of Bailard, Biehl & Kaiser, considered this exact question.6
Using nine different academic and industry sources, he constructed a series
of real estate returns from 1919 to 1997. He concluded that real estate returns
were similar to those produced by domestic stocks over this 86-year period,
Table 12.2 Performance of REITs versus S&P 500
Morgan StanleyREIT Index S&P 500 Divergence
Year Change (%) Change (%) (Percentage Points)
2001 12.83 −13.04 25.872000 26.81 −10.14 36.951999 −4.55 19.53 24.081998 −16.90 26.67 43.571997 18.58 31.01 12.431996 35.89 20.26 15.631995 12.90 34.11 21.21
Source: Bloomberg L.P.
nied_c12.qxd 1/24/03 10:55 AM Page 252

Chapter 12 • Boom or Bust? 253
ranging between 10 percent and 11 percent a year compounded. This is as it
should be, since both asset classes are equity investments. Both the S&P 500
and REITs yield returns that both exceed inflation and significantly outper-
form corporate bonds, Treasury bonds, or direct unleveraged investment in
real estate assets. Stocks certainly have the advantage over real estate in terms
of liquidity, but real estate compensates with lessened within-year volatility,
Kaiser concluded. However, Kaiser’s own figures show that stocks return
about one percentage point a year more, compounded, than real estate. This is
consistent with the careful work of William B. Brueggeman and Jeffrey D.
Fisher, in their excellent textbook, Real Estate Finance Investments.7
Brueggeman and Fisher studied quarterly returns for REITs and other in-
vestments, including the S&P 500, from 1985 to 2000. They found that the S&P
500 produced quarterly geometric returns of 4 percent, whereas quarterly re-
turns of equity REITs were 2.6 percent. The difference of some 1.4 percent a
quarter is not so minuscule as it may seem. One hundred dollars compounded
at 4 percent comes to $189 in 15 years, whereas 2.6 percent compounded comes
to only $151. By comparison, institutional real estate holdings yielded 1.73 per-
cent quarterly, corporate bonds yielded 2.24 percent, and T-bills yielded 1.4 per-
cent. The Consumer Price Index rose 0.79 percent a quarter during this period.
(The geometric mean measures the compounded rate of returns that an investor
would have earned on $1 invested in the index during the period. Portfolio man-
agers evaluating the performance of an investment use the geometric mean,
rather than the arithmetic mean, which is a simple average.)
Because Brueggeman and Fisher used the problematic NAREIT data,
with the survivor bias discussed earlier, their estimate suffers from an upward
bias. Considering the highly superior returns of stocks over REITs, the poten-
tial for improved portfolio performance by combining REITs and stocks
seems most unlikely. Furthermore, a careful study shows that quarterly REIT
returns are correlated 60 percent with quarterly S&P 500 returns. Neverthe-
less, after making heroic assumptions using such things as arithmetic returns
instead of geometric returns, Brueggeman and Fisher concluded that some
very small diversification benefits could be achieved by investing in a combi-
nation of stocks and real estate.
Interlocking Gears: Real Estate, Business Cycles, and Stocks
Although investing in REITs is unlikely to significantly improve returns, the
speculator will find real estate a highly profitable field of study for understand-
ing stock market cycles. According to a widely respected economic theory first
nied_c12.qxd 1/24/03 10:55 AM Page 253

254 Practical Speculation
put forward by Henry George and David Ricardo in the nineteenth century,
business cycles are caused mainly by movements in real estate values.
George and Ricardo began with the observation that rents and land prices
rise when business conditions are good. Eventually, rent-seeking landlords ab-
sorb all the excess profits that businesses can make. Businesses fall behind on
rents and mortgage payments; defaults begin, and bankers call in loans. Land
prices begin declining because fewer tenants can be found to lease property at
current prices. As these developments reduce lending for other business activ-
ities, general business conditions worsen. Just at this most inauspicious time,
an abundance of new development comes on the market. Developers had bro-
ken ground on new projects back when business conditions were good, acting
on the assumption that property values would keep rising. Now that the proj-
ects are complete, there are few takers.
The net result is that rents and land values are driven down still further.
Similar patterns are observed in many other areas—venture capital and agri-
culture, to name but two. In the real estate cycle, prices eventually fall to a
level low enough to permit entrepreneurs to start profitable businesses on
these properties once again. Expansion of these new businesses spurs real es-
tate prices higher, and the cycle is ready to repeat.
This simplified model is so obvious and so elementary that it almost
seems naïve to present it, except that throughout history and across countries
the cycle George and Ricardo described seems to repeat over and over again.
Homer Hoyt was the first to study these cycles systematically. In One Hun-dred Years of Land Values in Chicago: The Relationship of the Growth of Chicago tothe Rise of Its Land Values, 1830–1933, Hoyt documented dramatic swings in the
total value of Chicago land values (see Figure 12.1).8
The most thorough and thoughtful real estate research that we
have found—that of Kaiser, Liang, Prudential, and the research firm Torto
Wheaton—confirm the economists’ hypothesis of real estate cycles.
Kaiser, for example, found tremendous boom/bust cycles in investment
property, with peaks in the early 1800s, the 1870s, the 1920s, and the late
1980s. In each case, a rapid run-up of rents, usually preceded and accompa-
nied by abnormally high general price inflation, was followed
by declining business activity and stock prices. When the
downtrend started, it precipitated liquidations, foreclosures,
and vacancies. While Kaiser’s study was of investment prop-
erty, he concluded that the underlying forces in all real estate sectors are sim-
ilar in their effect and timing.
The conventional wisdom is that gains in stocks drive up real estate prices
because people have more money to invest. It has not always worked that way.
nied_c12.qxd 1/24/03 10:55 AM Page 254

Chapter 12 • Boom or Bust? 255
Using an index of REIT prices as a proxy for real estate prices, we found that
from 1993 through 2001, REIT prices led stock market prices. The correlation
between changes in REIT prices in one quarter and the S&P change the next
quarter was an amazingly large −0.5. As we explained in Chap-
ter 8, our general formula for usefulness is that the correlation
coefficient multiplied by the number of observations should
be greater than 10. With our formula, 36 quarters and a corre-
lation coefficient of 0.5 is a highly useful 18. The correlation between the
change in stocks in one quarter and the change in REIT prices in the next
quarter, however, was close to zero.
The average quarterly gain for the S&P 500 after a quarter in which the
Bloomberg REIT Index declined, or rose less than 0.5 percent, was 7 percent.
That is more than twice the average 3 percent quarterly gain for the S&P dur-
ing the 1993–2001 period. When the REIT Index rose more than 3 percent in
a quarter, the average subsequent change in the S&P 500 was −0.5 percent.
When the change in REITs was between 0.5 percent and 3 percent, the average
change in the S&P was 1 percent.
A scatter diagram of the relation between these quarterly changes appears
in Figure 12.2. Note that the quarters after declines in real estate prices tend to
be followed by big increases in stock prices (the northwest quadrant of the
Figure 12.1 Total Value of Chicago Land Peaks and Valleys, 1833–1932.Source: Fred E. Foldvary, “Real Estate and Business Cycles: HenryGeorge’s Theory of the Trade Cycle,” paper presented at the LafayetteCollege Henry George Conference, June 13, 1991.
18330
1
2
3
4
5
6
19321926189318771861Year
Bill
ions
18561836
nied_c12.qxd 1/24/03 10:55 AM Page 255
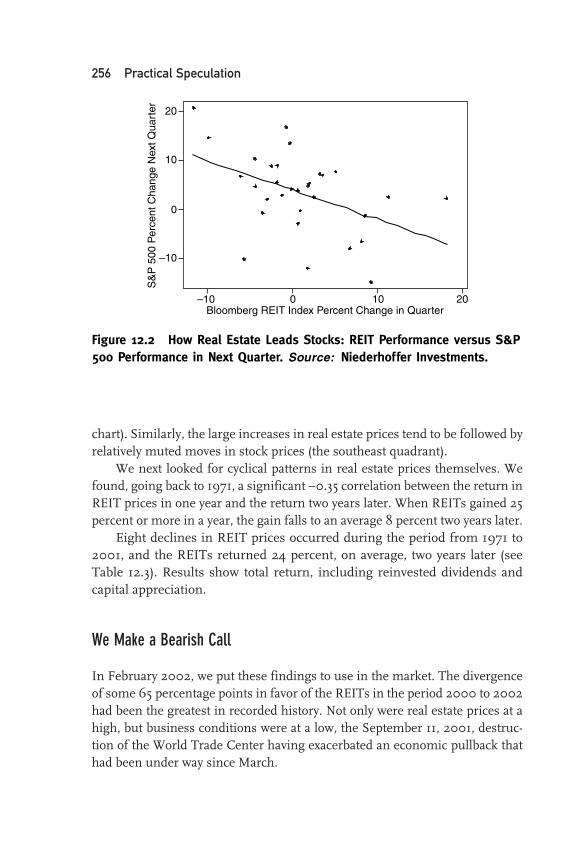
256 Practical Speculation
chart). Similarly, the large increases in real estate prices tend to be followed by
relatively muted moves in stock prices (the southeast quadrant).
We next looked for cyclical patterns in real estate prices themselves. We
found, going back to 1971, a significant −0.35 correlation between the return in
REIT prices in one year and the return two years later. When REITs gained 25
percent or more in a year, the gain falls to an average 8 percent two years later.
Eight declines in REIT prices occurred during the period from 1971 to
2001, and the REITs returned 24 percent, on average, two years later (see
Table 12.3). Results show total return, including reinvested dividends and
capital appreciation.
We Make a Bearish Call
In February 2002, we put these findings to use in the market. The divergence
of some 65 percentage points in favor of the REITs in the period 2000 to 2002
had been the greatest in recorded history. Not only were real estate prices at a
high, but business conditions were at a low, the September 11, 2001, destruc-
tion of the World Trade Center having exacerbated an economic pullback that
had been under way since March.
Figure 12.2 How Real Estate Leads Stocks: REIT Performance versus S&P500 Performance in Next Quarter. Source: Niederhoffer Investments.
–10
0
10
20
S&
P 5
00 P
erce
nt C
hang
e N
ext Q
uart
er
–10 0 10Bloomberg REIT Index Percent Change in Quarter
20
nied_c12.qxd 1/24/03 10:55 AM Page 256

257
Table 12.3 Annual REIT Returns Two Years after Decline
REITReturn Two
REIT REIT Years afterPeriod Return (%) Period Return (%) Decline (%)
Dec-01 16.0Dec-00 26.0Dec-99 −6.0 Dec-01 16.0 16.0Dec-98 −19.0 Dec-00 26.0 26.0Dec-97 19.0 Dec-99 −6.0Dec-96 36.0 Dec-98 −19.0Dec-95 18.0 Dec-97 19.0Dec-94 1.0 Dec-96 36.0Dec-93 19.0 Dec-95 18.0Dec-92 12.0 Dec-94 1.0Dec-91 36.0 Dec-93 19.0Dec-90 −17.0 Dec-92 12.0 12.0Dec-89 −2.0 Dec-91 36.0 36.0Dec-88 11.0 Dec-90 −17.0Dec-87 −11.0 Dec-89 −2.0 −2.0Dec-86 19.0 Dec-88 11.0Dec-85 6.0 Dec-87 −11.0Dec-84 15.0 Dec-86 19.0Dec-83 25.0 Dec-85 6.0Dec-82 32.0 Dec-84 15.0Dec-81 9.0 Dec-83 25.0Dec-80 28.0 Dec-82 32.0Dec-79 31.0 Dec-81 9.0Dec-78 −2.0 Dec-80 28.0 28.0Dec-77 19.0 Dec-79 31.0Dec-76 49.0 Dec-78 −2.0Dec-75 36.0 Dec-77 19.0Dec-74 −42.0 Dec-76 49.0 49.0Dec-73 −27.0 Dec-75 36.0 36.0Dec-72 11.0 Dec-74 −42.0Dec-71 Dec-73 −27.0
Dec-72 11.0Dec-71
Source: Niederhoffer Investments.
nied_c12.qxd 1/24/03 10:55 AM Page 257

258 Practical Speculation
In 2002, dividends of REITs were averaging 7 percent a year. These divi-
dends obviously looked very good compared with alternative yields of about 1.5
percent on stocks and 2 percent on Treasury bills. Advocates for REITs point to
dividends as an overriding positive for the industry. Yet this same argument
was made in 1987, when REITs underperformed the S&P 500 by some 50 per-
cent. It seemed clear to us that highly leveraged REITs would be unable to
maintain their current dividend payouts in a weak real estate market. After all,
office vacancies in 2001 had increased at the greatest rate on record and were
widely expected to be heading to heights unseen since the late 1980s—levels
that had been followed by dismal performance for REITs, bankruptcies, and
related bank failures. At year-end 2001, the national office vacancy rate was
13.1 percent, up from 6.2 percent in the third quarter of 2000. The Grub &
Ellis brokerage was projecting a 15 percent vacancy rate by the end of 2002.
Increasing vacancies are a crucial negative signal. A definitive Pricewater-
houseCoopers study indicates that rising vacancy rates are the most accurate
signals of a decline in prices. The study was based on 20 years of prices for
every major metropolitan statistical area broken down by type (i.e., office,
apartment, industrial, residential, hotel, and warehouse). Numerous aca-
demic studies backed up the conclusions of PricewaterhouseCoopers.
We saw numerous other early warning signs that REITs were headed for
a decline:
• Fuzzy accounting: A report from Green Street Advisors, the most schol-
arly and studious firm in the field, found evidence that REIT funds for
operations, the measure most investors look at, were lower in 2001 than
in 2000, but that some REITs were excluding nonrecurring charges and
write-offs from their financial statements, making results appear better
than they were.9 We feared that some REITs, especially highly leveraged
ones, would not be able to maintain their dividend payouts in a weak
real estate market.
• Popular books: A trip to the local Barnes & Noble revealed that real es-
tate was the hot new growth area in the financial publishing industry.
Investing in Real Estate,10 Rich Dad, Poor Dad,11 and J.K. Lasser’s Real Es-tate Investing12 were selling particularly well. Because of the long lead
times involved in writing and publishing, book sales tend to be a lag-
ging indicator of what is likely to make money. We were reminded of
the rash of Dow 40,000 and day-trading books that proliferated at the
millennium, just before the stock market’s debacle.
• S&P 500 membership: The arbiters of Standard & Poor’s, after inten-
sive lobbying from the real estate industry, added three REITs to the
nied_c12.qxd 1/24/03 10:55 AM Page 258

Chapter 12 • Boom or Bust? 259
S&P 500 Index in late 2001 and early 2002: Equity Office Properties,
Equity Residential Properties, and Plum Creek Timber Company. As
our colleague and CNBC Money editor Jon Markman has shown, how-
ever, stocks removed from the index typically outperform the ones that
are added.13
• Doc Greenspan: The much-venerated Fed chairman had been tooting
the horn for real estate, noting in his February 28, 2001, monetary pol-
icy report to Congress that the wealth effect from rising residential real
estate values had cushioned the economy from the violent declines in
consumer spending triggered by layoffs and the drop in the stock mar-
ket. We could not help but wonder why a wealth effect from real estate
values was more virtuous than a wealth effect from Nasdaq stocks,
which had elicited the chairman’s full firepower in 1999–2000. We
had also learned to be wary of Greenspan’s Mr. Magoo-like knack for
bad timing. His sightings of irrational exuberance in the stock market
in December 1996 at Dow 6437 and inflationary danger in the market
in 2000, well past the end of the capital spending boom that engen-
dered the Nasdaq’s rise, are only two outstanding examples.
A January 31, 2002, Wall Street Journal article noted that 2001 had
brought the sharpest jump in office vacancies ever recorded.14 On top of all
this, well-connected, highly respected firms with every reason to be as friendly
as possible to the REIT industry were beginning to lower their opinions of
real estate’s prospects. Merrill Lynch, in a December 19 research comment,
saw “muted price appreciation” in “this late-cycle sector.”
Wrath of the REIT Advocates
Despite all these warning signs, REIT shares had held up extraordinarily well.
At the end of February, the Bloomberg REIT Index was still up 17 percent
from its year-earlier level. All things considered, it seemed like a good time for
us to predict that a decline in REIT prices was imminent. Yet when we pre-
sented our findings in a series of columns for CNBC Money in February and
March 2002,15 we were vilified like never before in our career. Letters from
the REIT industry poured in for us and our bosses. Some samples of our e-
mails:
Victor, Victor, Victor . . . It was with horror that I read the piece that you and Laurel
wrote on REITs. . . . Your article belongs in the trash compactor! (Barry Vinocur,
editor-in-chief, Realty Stock Review and Property magazine)
nied_c12.qxd 1/24/03 10:55 AM Page 259

260 Practical Speculation
Your REIT article was the most poorly researched and written article on this sec-
tor in the past eight years. . . . I’m not alone in this view. I’ve spoken to ten insti-
tutional clients this morning who are all incredulous that this article saw the light
of day. (Louis W. Taylor, senior real estate analyst, Deutsche Bank Alex Brown)
Mr. Taylor added that the industry’s reaction to our article indicated our
“incredible arrogance, unprofessionalism, and cowardice,” and that we and
our editors were all a disgrace to our profession.
Those comments were typical of what we received from experts who know
infinitely more about the subject than we do. We also received a raft of critical
comments from what appeared to us to be more typical readers, such as:
It is people like you that create panic and people begin to sell. I hope your poor
judgment falls on deaf ears.
The article elicited some notice on the Motley Fool real estate message
board, where “fatuous” was a typical comment. Our credentials received con-
siderable negative scrutiny—it was noted with derision that Laurel had been an
aerospace reporter and that Vic had played squash. “This guy is as bad a colum-
nist as he was a hedge-fund operator,” one wrote. We would have added only
that most of the companies Laurel covered from 1989–1994 had been sold off,
and that the hardball squash game that Vic ruled for a decade is extinct.
Untimely Optimism
The torrent of vituperation directed at us is instructive in many ways. As
economists who study the subject invariably conclude, contractions are likeli-
est just when developers and banks are most convinced that business condi-
tions warrant expansion. Real estate decisions take a relatively long time to
reach the marketplace, and when they do, it is all too likely
that conditions will have changed dramatically. Rent rates and
demands fall at the same time. Similarly, just when investors
are most optimistic about real estate securities, the peak is near. The psycho-
logical bias at fault in these upheavals is called the “recency effect.” The last
few levels and the last few changes are remembered too vividly, to the exclu-
sion of other changes that have since faded from memory. A related problem
in decision making is the human proclivity for going along with the herd at
exactly the time it would be appropriate to stand alone.
Even those who agreed with us had bones to pick. Ron Kaiser reviewed
our work and pointed out that we omitted “the single most impressive reason
nied_c12.qxd 1/24/03 10:55 AM Page 260

Chapter 12 • Boom or Bust? 261
for being bearish: REITs usually trade at about 20 percent below net asset
value, and they are currently closer to 100 percent of NAV.”
More typical was the disagreement of William Wheaton, a principal in
the respected Torto Wheaton real estate consulting firm, source of the best
statistics of office vacancies and completions going back to 1967. In a Feb-
ruary interview, he told us he believes that the real estate markets are “really
healthy.” He predicted an upturn spurred by economic recovery in the mid-
dle of this year.
But office vacancies continued to climb in the third quarter. On Septem-
ber 19, 2002, Torto Wheaton predicted that demand would not rebound until
mid-2003.16
Jon Fosheim, cofounder of Green Street Advisors, an independent re-
search house that produced a study we had cited approvingly, also found many
areas of disagreement with us. Fosheim noted that while REITs had had two
very good years, this followed on the heels of two years of underperformance,
and that REITs had done about as well as the S&P over the past 5- and 10-year
time frames. He emphasized that while his firm had indeed noted accounting
hocus-pocus, nothing suggested that REITs were any worse in this area than
other companies. His most important quarrel with us was the contrary evi-
dence provided by “the collective opinions of thousands of investors on Main
Street who risk their capital every day buying and selling real estate . . . we
place high faith in their opinions as to how to price REITs.” Apparently Fos-
heim, whose clients include major mutual fund firms, institutional investors,
and REITs themselves, was not overly enthused by our conclusion that REITs
were headed for a sharp contraction.
We were reminded of the old Hungarian proverb that, roughly translated,
means, “The more he talks about his honesty, the more I check my change.”
This would seem to apply when industry analysts talk about correcting nega-
tive statistical information.
The Ground Shifts
Purely by coincidence, of course, and without citing us, the Wall Street Journalran an article on Monday, February 25, 2002, entitled “Commercial Real Es-
tate May Damp the Economy.”17 After reciting a litany of negatives that made
our own piece sound quite muted by comparison, whom should they trot out
to confirm the negative but Green Street Advisors. “We haven’t seen the bot-
tom,” Green Street analyst John Lutzius told the Journal. “Quite a lot of jobs
nied_c12.qxd 1/24/03 10:55 AM Page 261

262 Practical Speculation
were lost in the last quarter of 2001, and that may not be reflected yet in the
vacancy and rent statistics.”
Doubtless because of our shocking bearish views, Laurel was asked to de-
fend our position on Money Matters Radio Network. Talk show host Barry
Alexander, president of the $2.5 billion New England Advisory Group, said
right off that he had been telling people since 1997 to buy REITs. Perhaps as
a sop, the show’s detail man later told Laurel he liked what we said about the
vacancy factor. “We are located in an office park. Two years ago you would
have to circle the parking lot forever to find a parking space, or park in the
overflow lot well over a football field away. Today, you can park almost any-
where you like at any time of day. Also, the ‘space for lease’ signs are popping
up faster than the crocuses.”
We felt vindicated when REIT indexes dived two months after we ran our
initial article on February 14, 2002. Between April 12, 2002, and October 9,
2002, the Bloomberg Office REIT Index fell 24 percent.
Altogether, the developments in REITs reminded us of the remarkable
week in March 2000 when Vic received five proposals, including two from his
daughters, to fund Internet companies. We promptly predicted a crash in In-
ternet stocks, based on the law of supply and demand, in a column that turned
out to be our last for the publicly held Internet site we were then writing for.
The crash came as if on cue; thestreet.com’s Internet index, DOT, peaked on
March 10, 2000, and by mid-2002 had lost 95 percent of its value.
The near-unanimous negative sentiment that our article on REITs elicited
is all too typical of what happens at market peaks. Such virulent reactions
explain why the public consistently loses, over and over again, much more
money than it has any right to lose. While we can look at this
resistance to even a whiff of pessimism at the top as a beautiful
manifestation of the necessary order of things, whereby the
public contributes the maximum to the market’s upkeep, it was sad to see all
these forces once again coalescing to induce all too many to ruination.
nied_c12.qxd 1/24/03 10:55 AM Page 262

263
13 M A R K E TT H E R M O D Y N A M I C S
Nature’s rules rules apply for all particles and interactions.
—Gordon Kane, Supersymmetry: Unveiling the Ultimate Laws of Nature 1
Most weeks, Vic knows exactly how his youngest daughter, Kira,
spends her time. There are four hours a day when she is not at
school, eating, or sleeping. In those four hours, she has to complete an hour
of sports (usually a game of squash with Daddy), an hour of ballet, and an
hour of piano practice. She also has an hour for play, which she often spends
diving for dollars with friends in the pool.
The distribution of these pastimes can be expressed by a simple formula,
which we shall call the Kira Equation:
Sports + Ballet + Piano + Diving = 4
Occasionally, Kira requests that she be allowed to trade ballet practice for
sports, or what have you, and being an agreeable father, Vic is always
amenable. But he insists that she make up the deficit in the weeks thereafter.
nied_c13.qxd 1/24/03 10:53 AM Page 263

264 Practical Speculation
Thus, by counting how many hours Kira has spent on any three activities, Vic
can figure out how many she has spent on the other one. And by looking at
Kira’s activity record in one week, Vic can generally predict the distribution of
her activities in the weeks to come.
The Kira Equation was inspired by an ingenious example invented by the
Nobel Prize winner Richard Feynman. In Feynman’s story, a mother is hunt-
ing for wooden blocks missing from her son’s 28-piece set. She uses some
clever calculations of mass to discover all the hiding places: a little locked box,
the space under the bed, and the fish tank, where the water level was the give-
away. Feynman used the example to illustrate the law of conservation of energy,
one of two basic physical laws (the other being the law of entropy). The laws of
conservation of energy and entropy are the cornerstones of our understanding
of everything that happens in the physical world and much else in life.
But what does physics have to do with the understanding the market? It
can be as useful as it is in helping Vic guide Kira in making the most of
her time.
Market Experiments versus “Market Feel”
Many traders tell us that they base trading decisions on their
“feel” for the market. Unfortunately, we have no market feel
and are forced to compensate by using scientific research and
methods to help with our decisions. Our own trading style has
been developed over four decades of continuous use of the scientific method.
Of the many ways people have devised over the centuries to understand
humanity’s place in the cosmos, science holds a special place. In essence, sci-
ence is a process of inquiry designed to ask and answer questions about the
great principles underlying the physical world. Progress in science has led to
enormous increases in human betterment. One of the best things people can
do to improve their investing results and their lives is to become familiar
with the truth-seeking method that has permitted these achievements: gath-
ering facts, discovering regularities and patterns, forming theories, and test-
ing predictions. Odd though it may seem, given the scientific method’s
successes, the investment field has not universally embraced it. Thomas
Kuhn observed in his 1962 classic, The Structure of Scientific Revolution, that
science does not always progress smoothly. Members of the old guard tend to
resist ideas that threaten paradigms on which their livelihoods and reputa-
tions are based. Too often, a new theory’s acceptance results not from accla-
mation, but from funerals.
nied_c13.qxd 1/24/03 10:53 AM Page 264

Chapter 13 • Market Thermodynamics 265
This regrettable tendency to reject fresh insights shows up in spades
among market gurus. In science, great breakthroughs are often made by
scientists attempting to verify theories that turn out to be untrue. The first ca-
pacitor, the Leyden jar—a device that could store large amounts of electrical
charge—was invented by Pieter van Musschenbroek, a physicist and mathe-
matician in Leyden, Netherlands, as he tried to prove the fluid theory of elec-
tricity, which turned out to be a fallacy. This fruitful trial-and-error method is
seldom practiced in the investment field, however, because few propositions
are ever stated in verifiable form. Francis Bacon is credited with saying, “Truth
emerges more readily from error than from confusion.” Too much market fore-
casting is built on a framework of confusion akin to the forecasts of palm read-
ers and storefront psychics. Kuhn’s summing-up of the state of optics before
Newton is apropos: “[O]ne may well conclude that, though the field’s practi-
tioners were scientists, the net result of their activity was something less than
science.”
In sticking to the scientific method, we have attempted to follow in the
footsteps of generations of scientists who sought the spark for new ideas from
the stores of knowledge accumulated in other disciplines. Although academic
science is conventionally divided into the four major disciplines of physics,
chemistry, biology, and earth sciences, the natural world recognizes no such
boundaries. Inventions and concepts often resonate far beyond their field of
origination. The invention of the microscope, a triumph of optics, opened up
for biologists and chemists worlds of objects invisible to the naked eye. Ein-
stein’s grasp of geometry and certain invariances of right-angle triangles led to
his discovery of the theory of relativity. Such cross-pollination among disparate
fields is so frequent and important that we have collected some outstanding ex-
amples in Table 13.1.
Social sciences, too, have benefited from cross-pollination. Adam Smith,
the Newton of economics, modeled his idea of the invisible hand on a parable
by the Dutch poet Bernard de Mandeville, The Fable of the Bees; or, Private Vices,Publick Benefits. Given the accelerating pace of interaction among the sciences,
it is likely that more and more great discoveries will be made within a few gen-
erations as scientists apply rules and ideas from other fields to their own.
Entirely new disciplines can be expected to emerge. We already have seen the
sciences of optics, electricity, and magnetism merge into electrodynamics,
then combine in turn with other strands of knowledge into modern particle
physics. Is it possible to think of a surgeon in 50 years’ time who will be unfa-
miliar with genetics, electronics, and computer science?
Can investment in stocks be guided by fundamental concepts used to ex-
plain the structure and energy of matter? We think so. Experiments already are
nied_c13.qxd 1/24/03 10:53 AM Page 265

266
Table 13.1 Idea Transfers
William Harvey Blood circulationWilliam Harvey, physician to James I and Charles Iof England, discovered that the heart pumpedblood through the body and that veins containedvalves, a model drawn from the principles ofhydraulics.
1628
Alessandro Volta The electric batteryVolta theorized that electricity was created by thedifference in potentials between two dissimilarmetals after reading about the involuntarytwitching of a dissected frog’s leg when it cameinto contact with two different metals.
1800
Horace Wells AnestheticsWells, a dentist, was observing people inhalinglaughing gas at a carnival, when one man fell andinjured himself. Remarkably, he did not appear toexperience pain. Wells decided laughing gas mightbe useful in his dental practice.
1844
Louis Pasteur Left-handed and right-handed moleculesPasteur noticed that salts of racemic and tartaricacids had different effects on polarized light. Thisled to his discovery that organic compounds existin mirror image forms at the molecular level.
1848
Elihu Thompson Welding with electricityIn an experiment to demonstrate the movement ofelectricity as a spark, Thompson noticed two wireshad fused, welded together.
1876
Hilaire de Chardonnet RayonChardonnet, while developing photographic plates,spilled one of the chemicals. Wiping it up, henoticed it made silk-like strands. Within six yearshe had produced artificial silk (Rayon) fromcollodion.
1891
Wilhelm Röntgen X-raysRöntgen’s studies with cathode ray tubes led to thediscovery of X-rays.
1895
Henri Becquerel RadioactivityBecquerel discovered radioactivity whileinvestigating substances made phosphorescent byvisible light.
1896
nied_c13.qxd 1/24/03 10:53 AM Page 266

Chapter 13 • Market Thermodynamics 267
proceeding. Charles Sanford, a former president of Bankers Trust, developed a
concept he dubbed “particle finance” based on the science of the particles that
make up matter. Sanford identifies and splits the different risks embodied in a
single financial instrument to gain protection from the unpredictability of fi-
nancial events—the equivalent of chaotic phenomena in physics. A practitioner
of particle finance, instead of simply buying the collection of risks called a
bond, might choose a different risk mix. His portfolio might consist of Xamount of credit risk, Y amount of exchange risk, and so on.2
In another experiment, Charbel Tannous and Alain Fessant of the Uni-
versite de Bretagne Occidentale in Brest, Belgium, used combustion models
from high-energy physics to predict future values of stocks. The professors
observed that some stocks tend to jump suddenly after a long period of stabil-
ity, in the same way that combustion sometimes seems to occur sponta-
neously. Noting that ignition takes place when fuel concentration reaches a
certain level, the professors modified fuel combustion equations by replacing
fuel concentration with share prices of real companies.3
Money as Energy
Markets are filled with different energies and transfers. Money can be
viewed as energy, efficiently moving from person to person in free capital
markets. Like energy, money exists in many different forms: currency, land,
goods, stocks, and bonds, to name a few. Commerce transfers this wealth
around the world from person to person and country to country in a circular
Table 13.1 Continued
Alexander Fleming PenicillinHere’s an example of a cross-fertilization thatliterally drifted in. Fleming was growing a plate ofStaphylococcus bacteria when a spore of a rarePenicillium notatum mold wafted up from a labstudying fungi one floor below. When Flemingreturned from vacation two weeks later, the Staphbacteria were flourishing, except for the spot wherethe penicillin mold had taken hold.
1928
Watson, Crick,Wilkins, and Franklin
DNA double helixCombined insights from biology, physics,chemistry, and x-ray crystallography led to thediscovery of DNA’s form.
1962
nied_c13.qxd 1/24/03 10:53 AM Page 267

268 Practical Speculation
flow of goods, labor, land, and capital between households and businesses.
This simple model can be expanded to include the effects of government
and international trade. Just as potential energy exists in the world of
physics, potential wealth energy exists in the form of oil wells yet undiscov-
ered, seeds stored in farmers’ sheds, and technologies visualized in inven-
tors’ minds.
In physics, the concept of energy transfer is expressed in the first two
laws of thermodynamics.
These special laws provide the foundation for all other laws governing the
physical world. They are fundamental to understanding not just physics, but
life. In the following pages, we set forth some variations on the themes em-
bodied in these two great laws.
The First Law of Thermodynamics: Conservation of Energy
The first law of thermodynamics—conservation of energy—has nothing to do
with preserving trees, avoiding gas guzzlers, or turning off the lights when
leaving the house. In essence, the first law says that while all real-world
processes involve transformations of energy, the total amount of energy stays
constant, or is “conserved.” The first published expression of the law came in
1842, when Julius Robert Mayer, a German physician, asserted that energy
could not be destroyed, only transformed. Mayer demonstrated the equiva-
lence of heat and other forms of energy. Albert Einstein extended Mayer’s
work in the twentieth century by showing that matter and energy also are
equivalent.
Social scientists such as Herbert Spencer used the conservation concept
to develop a theory of human society. Marxists appropriated it in an attempt to
bolster the fallacious argument that economics is a zero-sum game. For pur-
poses of practical speculation, the first law provides an excellent working
model of financial markets, with numerous fruitful hypotheses and insights
into market forces.
Conservation of Energy, Variation 1: The Kira Equation
Let’s go back to Vic’s daughter, Kira, and the equation of her extracurricular
activities. We will substitute U.S. bonds for Ballet, U.S. stocks for Sports,
German bonds for Piano (in honor of Beethoven), and the U.S. dollar for
Diving.
nied_c13.qxd 1/24/03 10:53 AM Page 268

Chapter 13 • Market Thermodynamics 269
We will move from the realm of time, where Kira’s minutes add up, to that
of two-dimensional counterbalancing moves in market prices. When the Kira
Equation is applied to markets, the movements in bonds, stocks, German
bonds, and the dollar in a period sum to zero. For those who follow the market
on a day-by-day basis, the idea is somewhat intuitive: Time and time again, a
strong move in the bonds is counterbalanced by an equal and opposite move
in stocks.
Next, we separate out two elements in the equation: daily moves in bonds
and stocks over the last five years. The correlation between the two is shown
in Figure 13.1. There is a slight positive correlation between the two.
The counterbalancing holds true from week to week. As illustrated in Fig-
ure 13.2, when U.S. bonds are up more than two points in one week, then the
S&P 500 tends to go up 3.5 points in the next week.
The predictive connection between stocks and bonds illustrated by the
scatter diagrams in Figures 13.1 and 13.2 is one of the most useful regularities
that we have discovered in many hundreds of thousands of hours in studying
such interrelations. For traders, a few points a week in the S&P 500 adds up
to pretty big money over time. After all, 11 percent a year, compounded con-
tinuously over 20 years, amounts to an eightfold increase.
Figure 13.1 Correlation of Daily Moves in U.S. Bonds and U.S. Stocks,July 1994–May 2001. Source: Niederhoffer Investments.
–100
–50
0
50
Cur
rent
Dai
ly S
&P
500
Cha
nge
(poi
nts)
–3 –2 –1 0 1Current Daily Change in Bond Points
2
y = 1.7% + R2 = 0.1%
1⁄2 (x)
nied_c13.qxd 1/24/03 10:53 AM Page 269

270 Practical Speculation
Moreover, the results are highly significant from a statistical standpoint;
mean changes this far from zero are less likely than 1 in 1,000 to have been
obtained by chance variations alone.
The total amount of energy in the market is constant vis-à-vis the closed
system of bonds and stocks. It is possible to exchange between time periods,
borrowing, if you will, from the total energy, with a certain lag for repayment.
Einstein’s special theory of relativity casts further light on these borrowings
and repayments. The special theory explains that mass and energy are equiva-
lent and that energy is forever being converted to mass and then back again.
When you wind a watch, the spring’s mass increases ever so slightly as energy
is stored in it. As the spring unwinds, this barely perceptible amount of mass
is converted back to energy. The market, too, can “store” energy. The energy,
however, must always be repaid, just as Kira must make up a missed piano
practice session in subsequent weeks.
Conservation of Energy, Variation 2: Disappearing Money
Hope springs eternal for humans. Well it should, given the human capacity
to improve well-being and happiness, as evidenced by the contributions to
civilization of such giants as Leonardo da Vinci, Isaac Newton, and Thomas
Figure 13.2 Correlation of Weekly Moves in U.S. Bonds and Stocks, July1994–May 2001. Source: Niederhoffer Investments.
–100
0
100
Poi
nt C
hang
e in
Nex
t Wee
k’s
S&
P 5
00
–5 0Point Change in Current Week’s Bond Futures
5
y = 0.7% + 1.4 R2 = 0.5%
(x)
nied_c13.qxd 1/24/03 10:53 AM Page 270

Chapter 13 • Market Thermodynamics 271
Edison. The everlasting, renewable nature of hope seems to be a necessary in-
gredient to our ability to deal with the hardships and disappointments of life.
And nowhere do we see hope better exemplified than when we turn on our
television after a dismal period for stocks and find an attractive reporter re-
moving her glasses and saying, “Tech is back!”
Perhaps Intel just reported better-than-forecast earnings, prompting a
buying rush among investors. The resulting price rise in Intel makes other
stocks in the tech sector relatively cheap, and money comes in to buy these
as well. The process continues, sometimes for years, as it did in the 1990s,
when a tremendous river of money flowed into the field from savings ac-
counts, money-market funds, and foreign investors, and the Nasdaq rose
from 374 to 4069.
More important than any particular company’s earnings report in this
process is an underlying perception that technology is good, that profits
are available, and that entrepreneurship leads to a beneficial horn of plenty
that is constantly being replenished for investors, suppliers, customers, and
employees.
Ah, but always the seed of discontent. Enthusiasm has a tendency to wax
and wane. Ultimately, potential energy in the world of savings, alternative in-
vestments, or even credit card borrowings will be drawn down to the point
that there won’t be enough to continue the rise or even to sustain the rise that
has taken place. At that point, confidence is shaken and doubts that had long
seemed unrealistic suddenly assume an alarming aspect.
The events of 2000, discussed in the introduction to Part One, illustrate
this well. When the point of maximum drawdown of potential energy was
reached in early 2000, the chairman of the Federal Reserve, who had been
concerned with irrational exuberance for more than three years, chose that in-
opportune time to ratchet up the federal funds rate from 5.50 percent to 6.50
percent. The increase was accomplished in three steps. The first two increases,
of one quarter-point each, took place February 2 and March 21. The final, half-
point increase was made May 16—after the Nasdaq had already fallen 26 per-
cent from the high of 10 weeks earlier. Confronted by the powerful force of the
Fed, large investors who had recently converted to tech began selling their in-
flated holdings. New tech firms had only lately been besieged by investment
bankers seeking the privilege of underwriting their initial public offerings.
Suddenly they found it impossible to sell stock. Without capital, they could
not order equipment. Manufacturers of the equipment saw a precipitous
drop-off in orders. Tech shares fell, so the public withdrew money from
tech and put it into growth stocks. When growth stocks began to succumb,
the public bought value stocks. When the revered value investor of Omaha
nied_c13.qxd 1/24/03 10:53 AM Page 271

272 Practical Speculation
allowed in his annual letter to shareholders on February 28, 2002, that he had
“decidedly lukewarm feelings about the prospects for stocks in general over
the next decade or so,” the public began to convert any remaining sharehold-
ings into cash—and waited for the attractive TV reporter to stop furrowing her
brow and start removing her eyeglasses again.
The same sort of transfers happens constantly in the natural world. The
sun generates energy, a plant uses the energy to make sugar, a jackrabbit eats
the plant, a coyote eats the rabbit, the coyote dies, and nutrients from the car-
cass leach into the soil to become fertilizer for plants.
The important thing to know is that at any point in such stories, the quan-
tity of mass and energy is exactly what it was at the start. Any amount that
seems to have gone missing can be found somewhere.
The conservation of energy law is helpful, for example, in deflating falla-
cious news reports about the trillions of dollars that “disappeared,” “evapo-
rated,” or “vanished” in stock market declines. Money, like energy, does not
disappear; it always goes somewhere. From its peak in March 2000 to the lows
of October 2002, the U.S. stock market, as measured by the inclusive Wilshire
5000 index, lost 50 percent of its value, or $8.15 trillion, based on Wilshire As-
sociates’ formula of $1.1 billion per point. But the money did not disappear.
For every investor who bought at the top, a seller on the other side of the trade
got out at the top.
Our story about the attractive TV reporter is a qualitative tale about a sin-
gle move in a single market. Other explanations could be developed. The sto-
ries regarding the markets of other countries and other periods of U.S. history
would doubtless be different. Our model is not an exact depiction of all the
forces that affect markets. All models are necessarily simplifications of reality.
The key question for any particular model is whether it leads to fruitful pre-
dictions and insights, and then based on tests of these, whether it is possible
to develop a better model.
The amazing thing about the model that we have posited is that many of
the specific regularities embodied in it appear to be consistent with actual re-
lations that have appeared during the past 20 years.
Conservation of Energy, Variation 3: Where DoesMoney for IPOs Come From?
Assume that money available to buy stocks is fixed, and that it depends to a
significant degree on the money taken up by initial public offerings. Money to
buy new stocks must come from somewhere. A good working model is that it
nied_c13.qxd 1/24/03 10:53 AM Page 272
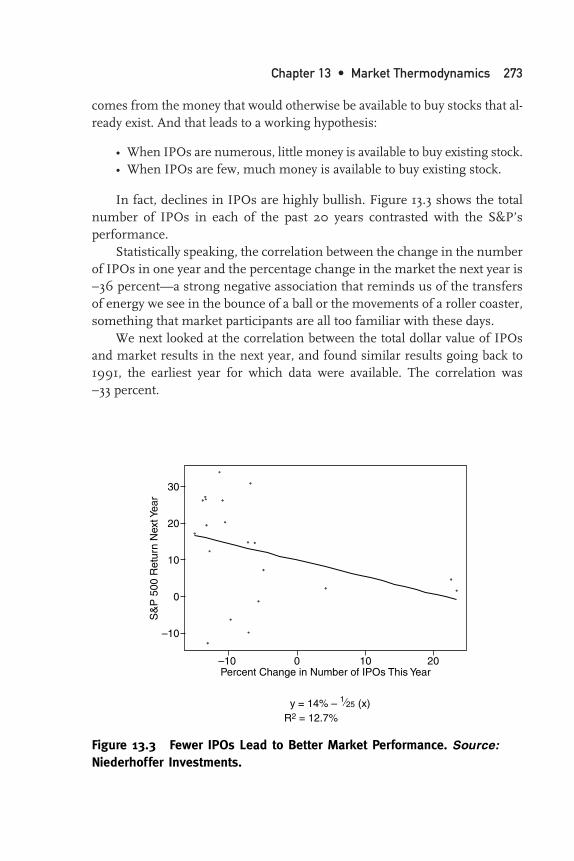
Chapter 13 • Market Thermodynamics 273
comes from the money that would otherwise be available to buy stocks that al-
ready exist. And that leads to a working hypothesis:
• When IPOs are numerous, little money is available to buy existing stock.
• When IPOs are few, much money is available to buy existing stock.
In fact, declines in IPOs are highly bullish. Figure 13.3 shows the total
number of IPOs in each of the past 20 years contrasted with the S&P’s
performance.
Statistically speaking, the correlation between the change in the number
of IPOs in one year and the percentage change in the market the next year is
−36 percent—a strong negative association that reminds us of the transfers
of energy we see in the bounce of a ball or the movements of a roller coaster,
something that market participants are all too familiar with these days.
We next looked at the correlation between the total dollar value of IPOs
and market results in the next year, and found similar results going back to
1991, the earliest year for which data were available. The correlation was
−33 percent.
Figure 13.3 Fewer IPOs Lead to Better Market Performance. Source:Niederhoffer Investments.
–10
10
0
20
30
S&
P 5
00 R
etur
n N
ext Y
ear
–10 0 10Percent Change in Number of IPOs This Year
20
y = 14% – R2 = 12.7%
(x)1⁄25
nied_c13.qxd 1/24/03 10:53 AM Page 273

274 Practical Speculation
Conservation of Energy, Variation 4: Transformations of Energy
In considering energy in nature or markets, it is helpful to think of potential
energy, on the one hand, and “working” transformations of energy, on the
other. Active forms of energy include kinetic, chemical, electric, electromag-
netic, elastic (as in a bouncing ball), nuclear, heat, and sound.
Money available to buy stocks may be thought of as a form of potential en-
ergy. When cash piles up in money-market accounts and investment in stocks
dwindles, as it did in 2001 and 2002, the situation is similar to a pendulum
pausing at the top of its arc. At that moment, the energy seems to have disap-
peared. In reality, it is there in potential form and quite likely to be converted
into movement.
When movement begins, one possible route is into equity funds. At the
beginning of 2002, the ratio of assets in equity funds relative to money mar-
ket funds was 1.5, close to a four-year low of 1.4. A high of 2.6 occurred in the
spring of 2000 just as the market was embarking on its terrible 18-month
descent.
Our study of the equity/money-market ratio indicates that the best predic-
tion for the return the next month as determined by regression analysis is 5.8
percent less 2.4 percent multiplied by the level of the ratio (see Figure 13.4).
Figure 13.4 Equity/Money-Money Ratio as a Predictor of Next Month’sS&P 500 Return. Source: Niederhoffer Investments.
–15
–5
–10
0
5
10
S&
P 5
00 R
etur
n
1.5 2.0Equity/Money Market
2.5
y = 5.8% – 2.4R2 = 2%
(x)
nied_c13.qxd 1/24/03 10:53 AM Page 274

Chapter 13 • Market Thermodynamics 275
The Second Law of Thermodynamics: Entropy
In the middle of the nineteenth century, Rudolf Clausius and William Thom-
son (Lord Kelvin) formulated the second law of thermodynamics—entropy. In
essence, the law says that whenever an energy distribution is out of equilib-
rium, a potential force exists that the world spontaneously dissipates or mini-
mizes. Clausius coined the term “entropy” to refer to the dissipated potential.
Whereas the first law explains that the total amount of energy remains con-
stant, the second law observes that the world is inherently active, always act-
ing to minimize potential (or, to say the same thing in a different way, to
maximize entropy).
The second law is easy to demonstrate empirically. Place a glass of hot
water in a cold room. Heat from the water will spontaneously dissipate into
the room until the temperatures of water and room are the same. Thus, the
potential energy of the water’s heat is minimized, and entropy is maximized.
Entropy, Variation 1: Maximization of Transfers
The stock market, too, has a way of maximizing entropy: It transfers wealth.
The percentage of NYSE stocks traded that close unchanged on an average
day is about 2 percent, much higher than would be predicted by chance. The
stock price moves in such a way that it maximizes entropy while going
nowhere. This holds true for longer periods as well. When a stock has a big
move in the beginning of a week, the best guess for the second half is exactly
the opposite.
The types of orders used by traders are comparable to different forms of
energy. Market orders can be compared to kinetic energy, while limit orders
and stops correspond to potential energy. A sharp up move triggers stop loss
orders. After the usual retracement, the market encounters less resistance on
its next rise, and is able to move up with greater ease. That is why double and
triple tops tend not to hold. The removal of limit orders maximizes the en-
tropy in the system.
To illustrate, take any ordinary piece of paper and crumple it in your
hand. As the paper crumples, energy is stored in all the creases. These resist
the force you are exerting. If you can overcome this resistance, the crumpled
ball of paper must collapse, forming more and more creases and points.
Eventually, the energy stored in the crumpled ball will be so great that you
would need to exert a huge force just to make it even slightly smaller. Thanks
to research being carried out on this phenomenon, scientists may better be
nied_c13.qxd 1/24/03 10:53 AM Page 275

276 Practical Speculation
able to understand how a blood cell’s membrane contorts to pass through the
smallest capillaries, how a car’s bumper absorbs the energy of a crash, and
how the earth’s tectonic plates collide and buckle to form a mountain range.
This phenomenon also appears in markets. Sharp downward moves in prices
require a lot of energy. When these sharp movements occur, the energy re-
quired to take the price lower is so great that prices tend to take the path of
least resistance and move up.
Entropy, Variation 2: Friction and Heat Dissipation
Friction is an obvious example of entropy in everyday life. As with any real-
world system, some of the energy in the market is not captured by the trader,
but is dissipated in the form of friction. In the market world, perhaps $15 bil-
lion a year is extracted by the infrastructure in the form of bid-asked spreads,
brokers’ commissions, and National Futures Association fees.
The profitability of the market infrastructure may be gauged by the value of
seats on major trading exchanges. The number of seats on the New York Stock
Exchange, American Stock Exchange, Chicago Mercantile Exchange, Chicago
Board Options Exchange, Chicago Board of Trade, and New York Mercantile
Exchange totals more than 8,000, with a combined value in early 2002, based
on the most recent seat sales, of $6.4 billion (see Table 13.2).
Average people who do average things are the ones who make seat own-
ership a lucrative business. If you conform to all the customs in the markets,
you will be a valued contributor.
Different traders must deal with different amounts of friction, depending
on their place in the infrastructure. Friction is minimal for a trader on the
Table 13.2 Value of Seats on Selected U.S. Exchanges
Number of Last SaleExchange Seats Price ($) Date
NYSE 1,366 2.5 million Feb. 2002 AMEX 203 (options) 300,000 Feb. 2002AMEX 661 (regular) 270,000 March 2002CBOT 1,402 (full ) 400,000 March 2002CME 625 (full voting) 800,000 Jan. 2002CME-Index and options market division 1,287 (voting) 550,000 March 2002CME-International monetary market division 813 (voting) 380,000 Feb. 2002CBOE 930 365,000 Jan. 2002NYMEX 816 875,000 Jan. 2002
Source: NYSE, National Association of Securities Dealers, Chicago Mercantile Exchange,Chicago Board of Trade, Bloomberg News.
nied_c13.qxd 1/24/03 10:53 AM Page 276

Chapter 13 • Market Thermodynamics 277
floor of an exchange and is highest for retail customers who enter trades
through a traditional brokerage firm. A trade that is profitable for floor traders
or institutional traders may be a losing proposition for retail investors. An
easy way to improve your returns in the market is to reduce trading expenses.
There are many ways to do this. Start by negotiating lower commissions, or by
finding a discount broker. High-volume day traders, who typically pay very
low commissions but nevertheless pay out 50 percent of their profits as com-
missions, should consider adjusting their trading style. High-cost invest-
ments such as load-bearing mutual funds, foreign securities that require
higher commissions, penny stocks, and structured notes are best avoided in
favor of less expensive alternatives.
Entropy, Variation 3: Sector Rotation and MaximumEntropy Production
The reader may wonder why, if the law of entropy rules the market, some sec-
tors manage to stay “hot” for long periods. A similar apparent conflict exists
in science, where physics says energy dissipates, while biology observes that
life tends to become more ordered.
The answer is that an ordered flow—a flame, for example—can be more
efficient at dissipating energy potential than a disordered flow. In the market,
hot sectors exist because they feed off potential energy in their environments.
Once the sector matures and becomes predictable, quick profits disappear
like a candle burning out.
A further everyday illustration of this principle, known as maximum en-
tropy production, is provided by a pot of boiling water. Given the law of en-
tropy, we might expect the movement of the water to be random and
unpredictable. Instead, the movement is quite orderly. When the burner is
turned on, the heated water at the bottom moves up the center of the pot to the
surface. Some water escapes as steam, and the rest cools and moves back down
to replace the hotter water rising to the surface. This orderly process efficiently
transfers the heat from the gas burner into the atmosphere, thereby maximiz-
ing entropy.
The same principle allows the persistence of heat in certain sectors of the
stock market, with happy consequences for some investors. Some mutual
funds tend to invest in industries that are showing relatively strong perfor-
mance and ride them until they lose steam. Mark Hulbert, dean of fund evalu-
ation, concluded that these “sector rotation” funds outperformed the average
mutual fund in the five years ending in 2001. We see no evidence as to
whether the superior performance of sector-switchers will continue in the
nied_c13.qxd 1/24/03 10:53 AM Page 277

278 Practical Speculation
future, or whether their success was a by-product of the market conditions pe-
culiar to the 1997–2001 period. At the end of November 2001, some $173 bil-
lion was invested in such funds, up from $92 billion in November 1997.
Assets in industry-specific funds totaled less than $100 billion in late 1997;
they peaked at $301 billion in August 2000.
We performed our own studies of sector rotation and
found that the relative rankings of at least some classifications
show negative correlation between years. From 1987 through
1998, the average annual move for a Nasdaq industry group
after a year in which it suffered a 10 percent decline was +25 percent.
In 2000, and 2001, the reversals of fortunes in the performance of the
S&P 500 Economic Groups were almost complete. The two best- and two
worst-performing groups of 2000 switched places the following year, with the
rank correlation between them −0.8 (with −1 being a perfect inversion).
This is consistent with the idea that a limited amount of energy is avail-
able for the purchase of stocks (the first law of thermodynamics), and with the
key insight of the second law of thermodynamics, or the law of entropy, that
the world acts spontaneously to release potential energy.
Entropy, Variation 4: The Law of Ever-Changing Cycles
An options-trading associate of ours, Leonard Kreicas, made some
observations on the second law—entropy—in a January 3, 2002, post
to the Spec List:
It seems generally when the investment community has figured out a sure-
fire way to make money, the system collapses due to the law of entropy. Most
commentators blame it on a random event, a 100-year flood. The market condi-
tions now are all in a consensus for a 2002 stock market recovery, which means
the bets have already been placed. What I’m expecting is a random event that sets
the balloon to go off in a entirely different direction. When a balloon full of air is
let go, it’s impossible to predict which direction it will go as the air escapes. We do
know that the process is very fast, follows a random path and increases entropy.
The same could be said for markets as they lose air.
Entropy and diversification can be considered kin. In the late 1990s, the pub-
lic had a mania with stocks. Figures showed record numbers of shareholders.
This meant people were not putting money in bonds, savings accounts, gold, etc.
They were concentrating their money in one asset class: Nasdaq stocks. The last
two years showed the consequences. Perhaps now investors will diversify their
portfolios. Put another way, entropy will increase. Mutual funds and brokers will
keep on talking up stocks, but increasing entropy predicts money will randomize
and spread out more. Maybe the euro, real estate and money markets will receive
nied_c13.qxd 1/24/03 10:53 AM Page 278

Chapter 13 • Market Thermodynamics 279
some funds as investors reduce risk. I can’t predict the eventual distribution.
However, when money rushes into one spot as it does during a bubble, eventually
it bursts in a dramatic show of entropy.
Conclusion
The first two laws of thermodynamics are not the Holy Grail. They do not ex-
plain how a system operates or what causes it to change, either in physics or in
finance. They do not account for psychic energy or productive energy—key el-
ements in markets. They apply only to closed systems. They cannot address all
the unpredictable ways in which potential energy can be converted to kinetic
energy (or waste heat). There is a basic problem in measuring potential energy.
As our friend Jack Tierney, a plainspoken Tennessee philosopher, says, “In the
realms of biology and physics, it might be possible, but in a realm with Alan
Greenspans and printing presses, you can’t.”
The laws of conservation and entropy are amazingly helpful, however, in
making predictions in a world of seemingly constant change. The usefulness
of any model is measured by the verifiability and falsifiability of its predictions.
We believe that our applications of the laws of thermodynamics will be fruitful,
although they certainly have many holes and many areas for
improvement. As always, knowledge is acquired through con-
tinuing observations, experiments, and theoretical reasoning.
The application of physics to investment has great potential.
nied_c13.qxd 1/24/03 10:53 AM Page 279

nied_c13.qxd 1/24/03 10:53 AM Page 280

281
14 P R A C T I C A L M A R K E TL E S S O N S F R O M T H E
T E N N I S C O U R T
In order to gain a win against me, you have to beat
me in the opening, the middle game, and the endgame.
—Alexander Alekhine, Chess World Champion 1927–1935, 1937–1946
The roads to victory and defeat cross the same ground in games and fi-
nancial markets. The fundamental goal in each pursuit is to win, given
the resources brought to the table, expected edge, potential variability, dura-
tion of the game, and the point at which the game ends in victory or ruin.
It is no accident that games and trading are so similar. Games were created
to mirror the crucial risk-reward decisions that we face in life, whether they re-
late to finance, marriage, jobs, education, or sports. As Paul Heyne points out
in The Economic Way of Thinking, in a quote we cannot repeat too often, “Every-
one who makes a decision in the absence of complete information about the
nied_c14.qxd 1/24/03 10:52 AM Page 281

282 Practical Speculation
future consequences of all available opportunities is a speculator. So everyone
is a speculator.”
Throughout my trading career, my experiences in competitive squash, ten-
nis, and other racquet sports have provided me with a rich source of insights. I
was undefeated for 10 years as U.S. squash champion, won a few national titles
in paddleball, and was winner or finalist in a handful of state tennis and ping-
pong tournaments. Steve “Hobo” Keeley, the holder of numerous national titles
in paddleball and racquetball, kindly refers to me as the greatest all-round rac-
quets player of all time, which may be stretching it some. I did defeat Marty
Hogan, the greatest racquetball champion, in a world series of racquet sports a
few years ago when I couldn’t move more than a few steps because of a bad hip.
True, Marty let up a bit. But here is Lesson 1: A player should never let up, in
sports or in markets.
In this chapter, we point out what investors can learn from how champi-
ons prepare for and play their game.
Before the Game
Pick Your Spots
On the court: The beauty of both sports and markets is that you can choose
when and where you want to play. If you are a tennis player, you might choose
to stay away from the relatively uncontrolled conditions of grassy courts, the
surface on which Goran Ivanisevic, who was not even seeded in the top 100,
won Wimbledon.
In the market: According to the academics, the market enjoys a 10 percent
annual upward drift, with random movements from all previous paths of
price change. For those with satisfactory long-term staying power, buy-and-
hold is therefore a winning strategy. Most people find it difficult to make
two timing decisions that both carry above-average expectations. Addition-
ally, a stake can be substantially reduced by capital gains taxes; ask any vet-
eran day trader.
Even an old dog sometimes learns new tricks, though. If I have learned
anything over the past several years, it is that opportunities resulting from
substantial event-driven declines are occurring with increasing frequency—
and conversely, there are certain times when it is best not to enter the mar-
ket tournament. Certain indicators have proved reliable in identifying such
times:
nied_c14.qxd 1/24/03 10:52 AM Page 282

Chapter 14 • Practical Market Lessons from the Tennis Court 283
• An increase in the stock-bond ratio (the number of 30-year Treasury
bonds it requires to “buy” the level of the current S&P 500 futures
contract).
• A decline in the Chicago Board Options Exchange Volatility Index
below 25.
• A 20-day high in stock futures.
Decide How Much Risk You Will Take
On the court: All great players will tell you that the thing they hate most is
when an inferior opponent plays a risky game—creating confrontation, going
for broke, going for the lines on every shot. That is the only way the better
player can lose.
In one of my early squash tournaments, I played against Sam Howe, then
U.S. champion. Sam called “one point set” at 14–14 in each of three consecu-
tive games to fray my nerves. (Sam had the option of extending the game by
three points, or letting the game be settled in the next point, “one point set.”)
I was not overly averse to risk, and won each game 15–14. What Sam did not
appreciate fully is that younger players frequently react much better to han-
dling risk. Older players are more fearful of not making it back should they
fall behind the eight ball.
Art Bisguier, a chess grandmaster who has won every conceivable U.S.
championship, tells the story of how he once made a sharp move in a game
against then-world champion Tigran Petrosian, and Petrosian asked for a draw.
Bisguier, who believed Petrosian had an edge, accepted, and then asked him
why he offered a draw. Petrosian said rivals Mikhail Tal and Paul Keres were
walking by and he was afraid that if did not accept Bisguier’s challenge, they
would consider him a coward—but if he did, he might get beaten. So he took
the middle road. That was the right thing for a world champion to do. The bot-
tom line is that when you have an edge, you should play a conservative game.
When you do not have an edge, you need to take risks.
In the market: In speculation, the house almost always has the edge. The
“house,” of course, is the operator of the casino—the Nasdaq market maker, the
NYSE specialist, the broker. That is why the speculator should go for big profits.
Only the house can grind small profits day in and day out. If your gains are lim-
ited relative to your capital, then the only constant will be the vig-
orish extracted from you in commissions and bid-asked spreads: a
sure formula for losing. That said, I do not advise crazy gambles.
My own approach to risk taking is based on statistical analysis.
nied_c14.qxd 1/24/03 10:52 AM Page 283

284 Practical Speculation
Have a Game Plan
On the court: Prepare before the game; there is no time once the play starts. I
loved it when my opponent had to take an extra few minutes in the warm-up
to practice a shot. I was always at the court two hours before I played. All good
players know that the action during a game is too fast-paced to rely on im-
provisations. Practice and plan for all possible scenarios in advance; expect
your opponent to have done the same.
In the market: Do all your studies at least two hours before the open. Run the
various scenarios that can occur unexpectedly during the trading day. Prepare
for the myriad situations that may result from a government or corporate an-
nouncement. Once a major contingency happens, there will be little time to
think before you react. While you should always be aware that plans are sub-
ject to the law of ever-changing cycles, it is important to have a certain stick-to-
it-iveness if your plan gives you an edge.
Have Sufficient Stamina
On the court: There are very few things you have complete control over in
sports, but stamina is one element that is completely in your hands. After a
match, it is also the one element you would hate to kick yourself for having let
slide. Make your opponent beat you . . . do not beat yourself.
In the market: The larger your asset base relative to the fluctuations in your
holdings, the better able you will be to take advantage of the situations when
your studies tell you that you have the edge.
Have Backup Equipment
On the court: No matter what, if you do not have the proper equipment, you are
a sure loser. Good tennis players can be observed carrying six identical racquets
to their matches, each one strung to the same tension. Strings and racquets
have a way of breaking down, and if they do, the change to unfamiliar equip-
ment can be calamitous.
One of my favorite squash victories occurred against Mike Desaulniers
during the Canadian Open in Toronto in 1975. After the game, I struck up a
conversation with Mike’s mother:
Vic: Mrs. Desaulniers, your son did very well. One little point would have
made the whole difference in the match.
nied_c14.qxd 1/24/03 10:52 AM Page 284

Chapter 14 • Practical Market Lessons from the Tennis Court 285
Mrs. D: Yes, I was very proud of him. I thought he did pretty well consid-
ering he lost his racquets yesterday and was playing with borrowed
shafts.
Vic: In that case, Mrs. D, we’ll give your boy a “but-for” victory on that one.
In the market: How many traders do you know who have confided to you that
they lost a fortune when their Internet connection went down, their broker’s
line was busy, or, worst of all, they were engaging in an activity they were un-
willing to interrupt by indelicately answering the telephone?
During the Game
You have picked your spot, you have decided how much risk to take, you have
laid plans for every possible scenario, you have enough in reserve to keep you
from going under, and you have your equipment and backup plan in order.
Now you have to play the match; and in my book, the first blow is nine-tenths of
the game.
Win the First Point
On the court: In squash, the accepted strategy used to be to save the best, most
powerful serves for the last few points of the game. My way was to hit the hard
serve for points at the start, thus getting off to a lead that my opponent could
not overcome. Doing so can lower an opponent’s self-confidence and encour-
age him to take risks to catch up.
In the market: To reduce the chances of starting out with an immediate loss,
consider using limit orders. For example, you might buy at 0.25 percent below
the bid and sell at 0.25 percent above the asked. Or buy 5 percent below the cur-
rent market price. I used to like to place my buys at 1/8 above the round number
and sell at 1/8 below, a tested method for profit when I wrote on the subject in
the 1960s with M.F.M. Osborne, the Pasteur of the field. However, fast-moving
day traders tell me that these days, this strategy is naïve, and they have ways of
making fixed-rule followers of the old school like me eat my own rules.
Maintain a Strong Base of Operations
On the court: Other things being equal, the best position in all games seems
to be the center. Being in the center minimizes the longest distance you have
nied_c14.qxd 1/24/03 10:52 AM Page 285

286 Practical Speculation
to travel to hit an opponent’s shot. I am not graceful, and when someone
watched me play for the first time I would invariably hear “That’s Niederhof-
fer?” sotto voce in the stands. But after the game, it would be, “He’s not even
sweating.”
In the market: Maintain a financial position that lets you maneuver easily
into good opportunities. Take a lesson from chess master Bobby Fischer,
whose favorite proverb was, “I never want to get in a position where I can’t
put my hand around all my pieces.” A hand can fit around 10 or 15 stocks,
and that is enough to achieve all the reasonable benefits that diversification
can provide. This does not conflict with investing in index funds, where low
costs, diversification, and the long-term forward movement of the market
work in your favor.
Do Not Create Crises
On the court: If you have the edge, do not take risks. Do not force your oppo-
nent to hit good shots. If you force him into a crisis, he may rise to the occa-
sion and come up with a winning shot. For example, if I were to hit a drop
shot, my opponent could lunge and hit a very hard shot that I might not be
able to return. The same thing holds in poker. If you are a better player than
your opponent, the last thing you want is to play him a hand where you both
have all your chips in but you have a very small edge. He just might draw the
lucky card.
In the market: Never put all your chips on one thing, no matter how good.
Failure could keep you out of the market, and there is always an edge for you
in the market if you buy and hold, derive your own method, or follow one of
ours. Once you have an edge, maintain it and accumulate steady profits.
Rome Was Not Built in a Day
On the court: Play your points one at a time. Do not go for the total win with
one shot; games are not designed that way, and trying to do so puts you too
much on the defense. Break your opponent’s game down bit by bit. First try
the forehand, then the backhand, then the net. Ultimately, you will find a
weak spot, and your chance to put him away will arise.
In the market: The mouse with one hole is quickly cornered. Do not commit
too great a percentage of your assets to one situation. A profit from stocks is
nied_c14.qxd 1/24/03 10:52 AM Page 286

Chapter 14 • Practical Market Lessons from the Tennis Court 287
good. So is a profit from mutual funds, and do not forget the friendly bond
market.
Hit Them on the Half-Volley
On the court: The best time to hit the ball is on the half-volley, when it is just
starting to bounce up from the court. The technique works because it lets you
take maximum advantage of the ball’s momentum. Your opponent is not able
to read your next move well, and has less time to recover. My squash rival,
Sharif Khan, held a plus record over me because he followed this method, even
though he often made five times as many errors as I did. Rene Lacoste, master
tennis tactician and businessman, wrote that when he hit every shot on the
half-volley, his play improved 40 points a set. Today, Andre Agassi owes much
success to such shots.
In the market: After a big down day, come right in the next
day to pick up a line of stocks. When the market starts mov-
ing up, the shorts will not have time to recover. A test we ran
in December 2001 showed that the last 30 times the stock
market dropped 2 percent or more in a day and then opened
lower, the average change from that open to the next open
was up 0.5 percent, with an average variability of 0.25 per-
cent. (But beware the ever-changing cycles. We strongly recommend that
you test any patterns mentioned in this book before acting on them.)
Come Up Front
On the court: The least-used weapon in racquet games is to go up front. At the
net, you can hit much sharper angles and force your opponent to run faster and
farther. Too many players spend 99 percent of their time perfecting ground
strokes and just 1 percent of their time on the net game. In fact, the best way for
the average player to improve is to develop a net game, as the benefits and rate
of improvement are much better there.
In the market: Train yourself to react instantaneously to opportunities.
That will give you the greatest chance of making a fast profit. But be sure
that you do not follow the herd in trying to react to a news announcement, as
the big boys, the market boys, and top predators are likely to get there ahead
of you.
nied_c14.qxd 1/24/03 10:52 AM Page 287

288 Practical Speculation
Attack on Both Sides
On the court: Create pressure on both sides. Good players often attack on one
side and then the other. By forcing the opponent to defend on both sides, you
can often move in for the finish.
In the market: An initial rise is often followed by a decline that gives way in
turn to a final rise. On the 193 occasions in 1994–2001 that S&P 500 futures
were up from close to 11 A.M. and down from 11 A.M. to 1 P.M., the expected
move from 1 P.M. to the close was 0.2 percent, with a variability of about half
as much and a batting average of .530.
Be Aware of Changing Cycles
On the court: Between games, your opponent will adjust his strategy to your
play. In tennis, if you have been staying back on the baseline after your serve,
he will expect you to keep doing that, so surprise him by coming up to the net.
(But don’t change during the middle of a game if you are winning.) Tom
Wiswell, a longtime world checkers champion, once said: “The wise player
can see the handwriting on the wall before there is any.”
In the market: After trend-following has worked for a while, be prepared to
reverse. After reversalists like me have had their day, be prepared for a major
trend. The winners in one month are the losers next month, according to a
study I made of trend-following funds versus reversal funds
during the 1990s. The average difference in performance was
4 percent.
Pick Up the Pace
On the court: At the beginning of a game, when your opponent is not yet
warmed up, slow drop shots are often effective. Near the end of the match,
however, your opponent will be faster on his feet; so make sure all your shots
are much harder and faster than at the beginning.
In the market: Reversing is usually grand at the beginning of months or years,
but beware of reversing at the end. From the end of 1989 through 2000, a rise
in S&P 500 futures over the first 11 months of the year has been followed by an
average change in December of 4 percent. If there was a loss over the first 11
months, the expected December move was just 2 percent. At the start of the
year, however, industry groups tend to reverse direction, as professionals
nied_c14.qxd 1/24/03 10:52 AM Page 288

289
“His shots were not always brilliant, but he patiently waited out long rallies . . .”
nied_c14.qxd 1/24/03 10:52 AM Page 289

290 Practical Speculation
regroup and reallocate to capture all the easy money made by the public dur-
ing the previous year.
The Endgame
On the court: Whenever I was ahead in a squash game, I liked to imagine that
the score was against me by my margin of victory. Near the end of a match, I re-
doubled my energy and never hit slow shots. The opponent is always at a do-or-
die stage at that point, and will run his hardest to catch anything without pace.
En garde: Jamie Melcher, a former Olympic fencer who now runs Balestra
Capital in Manhattan, said he became more cautious about finishing games
after losing a number of early matches. As he matured, he said, “I would fence
defensively, determined not to lose a single point, rather than trying to win
points. This shift in attitude enabled me to win those bouts almost every time.”
In the market: The idea reconciling these apparently conflicting pieces of advice
might be to avoid undue risks when you are ahead. This thought is consistent
with the idea of taking gains after a good run in the market. An extraordinarily
wise old rule says, “Never underestimate your opponent.” The market might be
considered the toughest opponent of all. It certainly has been for us.
Laurel and I followed our own advice in 2001 by taking profits on several
portfolios after short holding periods ranging from one to three months. We
bought a group of beaten-up Internet stocks in late December 2000 and sold
them about a month later after doubling our money. Before the summer crash
of 2001, we sold various groups of volatile stocks we had recommended at the
start of the year. In November 2001, we sold a portfolio of below-$5, high Value
Line-ranked stocks, for a 20 percent monthly gain. At the start of December
2001, we mopped up a 21 percent profit on a biotechnology portfolio with in-
sider buying, recommended October 25, 2001, to readers of our column.
Mopping up by taking profits may have drawbacks. As noted, most of us
find it difficult to make two timing decisions—buy and sell—that both have
above-average expectations. If academics are right about a 10 percent annual
upward drift with random movements from all previous paths of price
change, you will not be participating when you are out of the market. How-
ever, it is always wise to have a cushion while waiting for the market to offer
another chance for an edge. As my chess teacher, Art Bisguier, likes to say:
“Do to them before they do to you.” Therefore, we were delighted to accept 20
percent short-term gains, regardless of the wisdom of the academics.
nied_c14.qxd 1/24/03 10:52 AM Page 290

291
15 T H E F I N E A R T O FB A R G A I N I N G F O R
A N E D G E
The handshakes are followed by shouting, the shouting
by insults, the insults by impudence and more insults, shout-
ing, and handshakes until the business is finished.
—Joseph De La Vega, Confusion de Confusiones (describing the Amsterdambourse of 1688)1
TRADERS!
• Do you have an inordinate tendency to sell at the low of the day and buy
at the high?
• Do you find yourself behind the eight ball in many of your trades five
minutes after you get a fill?
• Do you ever wonder why the average price you pay is always higher
than the average price for the day and the average price you sell at is al-
ways lower?
nied_c15.qxd 1/24/03 10:51 AM Page 291

292 Practical Speculation
• Do you find that the trades you feel most certain of and that you have
most of your chips in are the ones that turn out to be the greatest
disasters?
• Have you ever, at the end of a day or a week, thrown up your hands in
disgust and shouted, “Damn my broker!”
If the answer is “yes” to two or more of these questions, then please read
on. You are a candidate for the Kennerhoffer School of Bargaining.
Almost everything that happens in life is a negotiation. It starts when one
person induces interest in another person. They meet and begin a process
that moves them both in the direction of the other side.
The most important thing in any negotiation is to create a sense of ur-
gency in the other side that is greater than your own. The purest example of
this would be the nineteenth-century art of cornering stocks practiced by op-
erators like Jay Gould. Quiet accumulation would be followed by
discreet tips to the press; the manipulators would unload at the top
and the public would be left with plummeting shares. Today, a
piece of information hits the market electronically; traders jockey for position
and finally reach a stopping point, a meeting of the minds.
To gain insight into negotiating, the directors of the Kennerhoffer
School of Bargaining took a train trip to the Wharton School of Business in
Philadelphia to visit Professor Richard Shell, director of the Executive Nego-
tiation Workshop. Shell described the common mistakes people make in
negotiating:
• They talk rather than listen.
• They are unclear about their goals.
• They think about minimizing risk more than maximizing opportunity.
• They assume that negotiating is inherently unethical and manipulative.
His advice:
• Always be willing to ask, respectfully, for a better price.
• Practice negotiating in everyday life.
• Learn about the hidden patterns in the negotiating process so you
can get past the caricatures associated with negotiators and apply your
intelligence.
On a practical level, he said, the first mistake in negotiating is to quote a
price first. The second is saying yes immediately. To illustrate the point,
Shell told the tale of a businessman kidnapped in Mexico. The kidnappers
nied_c15.qxd 1/24/03 10:51 AM Page 292

Chapter 15 • The Fine Art of Bargaining for an Edge 293
demanded $1 million from his family. The family agreed to pay. An exchange
was arranged, after which the kidnappers immediately rekidnapped the man
and demanded another $1 million for his release. This time, the family hired
a professional negotiator, who offered $25,000. Eventually, the two sides set-
tled at $250,000, and the businessman was freed.
“People often expect to bargain. When they do, and the other side says yes
right away, the one who quoted the initial price may feel regret,” Shell said.
“When bargaining is done well, people can be very satisfied with even a lousy
deal; if it has been set up poorly, they will feel unsatisfied even though they
did very well.”
If the other party fears being worse off if the deal does not go through,
that translates into leverage for you. The prospect of loss need not be only ma-
terial; the fear of loss in self-esteem or reputation can be equally leverage-
enhancing. In the stock market, the speculator does well to keep in mind that
the movements of a stock are designed to show attractiveness and scarcity to
potential buyers.
The day after the October 1987 crash, Shell’s late father, a retired Marine
Corps general, came home from his job as the head of the Virginia Military
Institute and called his broker. He assessed the panic selling going on and
concluded the situation was not as severe as other crises he had endured dur-
ing war and depression. He calmly placed orders. As a buy-and-hold investor,
he was rewarded with large gains as the market recovered and went on to
greater heights.
Professor Shell, while emphasizing that he is no expert on stock market
bargains, sees the keys to speculation as “having disciplined goals, defined
limits and understanding of the market, and a fearless willingness to make
commitments when others are faltering.” Not to be forgotten, he adds, is the
importance of “keeping your spouse from cutting off your access to funds.”
He hastens to add, however, that in his case the wife knows best—she is a
journalist and the former managing editor of Inc. magazine.
Shell often sees loss aversion, the irrational quirk that keeps investors
from selling their losers, come up in bargaining. A $5 bill auction illustrates
the principle. A group of people has the chance to bid for a $5 bill. The bid-
ding may start at 10 cents. When it gets to $4.99 and $5, everybody tends to
drop out except for two people; the usual closing price is $12. “Both sides are
willing to go much further than is rational because of unwillingness to give
up their investment.”
Which brings us to the first lesson at the Kennerhoffer School of
Bargaining.
nied_c15.qxd 1/24/03 10:51 AM Page 293

294 Practical Speculation
Watch Your Costs
Vic’s former partner, Steve Wisdom, uses the following technique when
buying a car. “The way to beat car dealers, I learned many years ago, is to
show up looking indigent, then fanatically beat down the purchase price
while appearing indifferent/uncomprehending of the finance angle. Dealers
will assume they can sell you the car for no margin and make it up on
the back end by putting you ‘on the chart’ (i.e., expensive financing). Then
show up the next day in normal clothes, take out your checkbook and buy
the car for cash.”
Steve’s method can be directly applied to the market. A similar technique
has been adopted successfully by George Soros, who, to hear him tell it, has
never had a successful trade in the market. When Vic used to trade for him,
Soros would bemoan his mistakes every day. At the end of each year, at their
annual tennis game, Vic would ask, “How bad was it?” Soros would sheep-
ishly smile and murmur something like, “Oh, we were up 87 percent.”
In all candor, Vic has never had a satisfactory day of trading either. If Vic
makes money on a particular day, it is never enough; he should have traded
more heavily. If he loses money, it is even more terrible because he has six
kids to support.
The point is, always let your counterparts know about your bad trades.
Perhaps they will accommodate with you with a better fill next time, just to
keep you in the game. More important, if they feel that you are in the chips,
they may not be able to resist the all-too-human tendency to endeavor to re-
lieve you of some of the overplus thereof, as they used to say in the nineteenth
century.
Someone once asked J. Paul Getty, the richest man in the world in the
1960s, why he installed a pay phone in his London home. He answered that a
businessman makes a few cents on every dollar of revenue, on average, after
paying suppliers, employees, taxes, and debt holders. If he gets in the habit of
paying 10 cents more than he receives for each item, he will quickly go out of
business. Not only will he lose everything, but a few hundred thousand em-
ployees and suppliers also will be out of work. Like most people, Getty found
it hard to behave differently in his personal life than he did in his business. So
he ran his personal affairs in a businesslike way and did not pay out an inor-
dinate amount.
The world’s richest people today—Buffett, Gates, and Soros—seem to fol-
low a similar path. If they find it useful to be economical in their activities, it
is probably good for the rest of us.
nied_c15.qxd 1/24/03 10:51 AM Page 294

Chapter 15 • The Fine Art of Bargaining for an Edge 295
In stock trading, the biggest mistake people make is paying an extra 10
cents or 25 cents out of every dollar in revenue they take in. Time after time
Vic has had some manager working for him who loses 100 percent of capital.
Invariably, the trades of such managers are highly profitable—before com-
missions and bid-asked spreads. What happens is that the market and their
own money management outmaneuver them. They take in $1, but they pay
out $1.10. If they trade often enough, that can be significant by the end of the
year, and unfortunately most people do that.
Vic has been a relatively active trader for years. During that time, he esti-
mates, he has made well over half a million trades, and has never bought or
sold at the market. He always buys at a limit a few ticks below the current bid
price and sells a few ticks above the current offer price. Try it, especially on
the electronic markets, and see if you do not start out with a better feeling.
Pick Your Time and Place
You will get a better price if the car dealer wants to meet a month-end quota or
win a prize, and is hungry for a sale. One of the most successful speculators of
our generation, Mr. P himself, often featured in the columns of our editor,
Jon Markman, has kindly shared for the benefit of our readers his patented
method of buying a Jag on the cheap. He waits until 5 P.M. on Christmas Eve.
Then he goes into the showroom:
“You must be very tired tonight.” (To initiate a query here is key.)
“No, in fact, you’re the first customer I’ve had.” (The dealer’s downfall.)
“What’s your best price on that silver model?”
“Forty-five.”
“Oh my, I’m afraid 35 is it for me. Goodbye.” (Walks toward door.)
“Just a minute. I haven’t sold one all day. It’s yours.”
“Very good. I need the keys right now. That’s the very car my wife wanted,
and she needs it tonight as a special surprise.” (Had the dealer known that in
advance, Mr. P would have had to pay the full price.)
Similar opportunities often come up in markets. The bonds have an inor-
dinate tendency to rise at the end of the month, and on days that futures ex-
pire. After all the bulls have evaporated, there is often the opportunity to
provide liquidity to the bears at the end of the day.
Our anecdotes illustrate two fundamental laws of bargaining that the aca-
demics have locked into. When a buyer and seller have room to maneuver to
complete a trade, who is going to get the better deal? Whoever is more patient
nied_c15.qxd 1/24/03 10:51 AM Page 295
296 Practical Speculation
and is willing to take more risk of the deal falling apart. By watching your costs
and waiting until the key moment, you make the other side impatient, and thus
get the edge. By downplaying your success, you show awareness of your own
fallibility and willingness to let the deal fall apart. These principles are well cov-
ered by Theodore C. Bergstrom in an upcoming article for the Journal of Eco-nomic Literature, “Economics in a Family Way,”2 available now on google.com,
as well as by such books as Bargaining Theory with Applications by Abhinay
Muthoo,3 and The Strategy of Conflict by Thomas C. Scheling.4
When we write our columns, our editors are always after us to tell readers
what stocks to buy right now. This is an error, as a close reading of the first
lesson indicates. We often feel we are in the position of King Canute, the
Viking conqueror of 1,000 years ago whose noblemen demanded that he use
his considerable powers to do something about the poor harvest. Canute ob-
jected that just because he had conquered England that did not mean he was
omnipotent, but the nobles would not listen. So he had his throne brought to
the seashore and commanded the tide to stop coming in. As waves lapped
over his feet, the nobles presumably got the point.
Even on days when we possess the wisdom and resolve of Canute, our
editors demand that we improve the harvest. We therefore came up with a
practical application of the principles of bargaining, using IBM as the exam-
ple. The advantage of choosing a bellwether like IBM is that a large number
of competing market makers are always offering quotes, with the happy re-
sult that the typical bid-asked spread is very narrow, perhaps a penny. Being
able to get in and out for 1/100 of a percent minimizes the grind of paying
excessive costs—that inevitable albatross of excessive frivolity on the cost
side alluded to earlier.
What happens when you buy at the close of a day in which IBM declines
3 percent and hold two days? It seldom occurs, but over the past decade it hap-
pened enough times to give a significant sample, both from a practical and
statistical standpoint.
In fact, a 3 percent drop in IBM occurs a little more frequently than once
a month. Table 15.1 shows the average expectation and the number of trades
you make per year by varying your filter.
The results show that you make 0.6 percent after a 3 percent drop, and 1.6
percent after a 5 percent drop. You lose about a third of the time. The variabil-
ity is highly unlikely to have occurred through chance variation alone, about 1
in 500.
Making 0.6 percent in two days in 8 to 12 months will not make you a Getty,
but it is a good start. Before too long, such trades could amount to some serious
money—at least enough to pay for your next lesson at the Kennerhoffer School
nied_c15.qxd 1/24/03 10:51 AM Page 296

Chapter 15 • The Fine Art of Bargaining for an Edge 297
of Bargaining, especially since it is free. The value of watching your costs and
picking your times is illustrated. Such trades will make you less hungry.
Keep a Doleful Mien
To the question, “How do you do?” Beethoven would often answer, “As well as a
poor musician can do.”
Norman Lebrecht, The Book of Musical Anecdotes5
Vic’s friend and mentor, Steve “Hobo” Keeley, has a technique that applies to
all situations. When buying a product, he invariably puts on a doleful expres-
sion and after looking the purveyor in the eye, sighs, “Look, we’re both God-
fearing people. How much do you need over cost on this?” Or, “What’s your
best dealer price on this?”
The important thing to remember is that you do not have to take the first
price quoted.
Duncan Coker, an investor friend of ours who has had occasion to bar-
gain with real experts—Third World merchants—says his greatest challenge
is getting his opening bid low enough.
“I often think I will insult the seller going in too low, but this is not the
case,” Coker reports. “Once when I was looking at rugs in Turkey I went in
with an opening offer half the price I was willing to pay. After many mint teas,
we settled somewhere in the middle. Later, a Turkish friend told me that the
correct opening price was one-tenth of my offer.”
Do not worry about offending the seller, or in the stocks bazaar, the mar-
ket maker. After all, even a transaction below average cost may benefit a seller
with excess inventory, as the Generation X economist N. Gregory Mankiw ob-
serves in Principles of Microeconomics.6
Information Is Valuable
Coker’s tale illustrates the truth that not everyone has all the information nec-
essary to make decisions. Information is scarce, and a cost arises in acquiring
Table 15.1 Average Profit per Trade after Big Daily Drops in IBM
IBM Trade After 3% Drop After 5% Drop
Percent change after 2 days 0.6% 1.6%Approximate number of occurrences Once a month Once a quarter
Source: Niederhoffer Investments.
nied_c15.qxd 1/24/03 10:51 AM Page 297

298 Practical Speculation
it, whether it is direct, is the subscription fee for an investment advisory ser-
vice, is the opportunity cost of taking the time to read a book like this or obtain
a few extra quotes on a car.
Bargaining received serious attention from George Stigler, who won the
Nobel Prize in Economics in 1982 for his 1961 paper on the subject.7 Stigler’s
pathbreaking theory, in a nutshell, is that consumers should seek information
up to the point that the expected marginal benefits from additional search are
equal to or less than the marginal cost. Say it costs you $100 in time and trans-
port to visit a car dealer. Compare the additional reductions you get each time
you visit a new dealer. When the average of the last two reductions is below
$100, then stop searching. Stigler also developed a formula for
estimating expected high and low prices based on the assump-
tion that prices would follow the uniform distribution of equally
divided ones to sixes that you get when you throw a single die.
Stigler’s paper set off an explosion of interest in the role of information in
economics that continued for decades. In 2001, the theory of asymmetric in-
formation gained three economists the Nobel Prize. It also gained us a 20 per-
cent profit on a group of biotech stocks that we chose because of inside buying
by corporate officers and directors. We reasoned that these insiders must have
had information that outweighed the overwhelmingly bad odds of winning
approval for their product from the FDA.
It happens that George Stigler’s son, Stephen M. Stigler, is a friend and
mentor of ours. We thought it appropriate to ask Steve whether any of his fa-
ther’s practical techniques of bargaining had helped him. He wrote that he
employed an effective strategy on his last car-buying trip by taking his wife,
son, and daughter along. “My son did the bargaining. He was ready to walk if
they didn’t come down. My wife and daughter were along to choose model
and color. I was paying, but not until my son gave the nod. The salesmen,
managers, and so on, didn’t know who to sell to. We got the car, but they were
still muttering as we left.”
Sex and Bargains Do Not Mix
One of Vic’s traders, Patrick Boyle, in his previous career as a hotelier, says he
rarely admitted to a customer that more than one room was available even if
half the hotel was empty. His first price quote was much higher than he
thought the customer would accept. “Sometimes the person would pay, and if
they wouldn’t, they were much happier when the price dropped,” Boyle says.
nied_c15.qxd 1/24/03 10:51 AM Page 298

Chapter 15 • The Fine Art of Bargaining for an Edge 299
“Often I would have customers in the exact same types of rooms, some paying
$40, some paying $400.
“The greatest mistake people could make was to come in during busy sea-
son and say, ‘Please tell me you have a room.’ That automatically tacked an
extra $75 on to their room rate. The only bigger mistake was for a young guy to
come in with his new girlfriend. He would never want to appear cheap by bar-
gaining, and that was always worth $100.”
Boyle also took advantage of the attractive properties of round numbers,
well known to stock traders. “Usually people looking for a room have a price
in mind, for example $200 per night. If you priced rooms a little above round
numbers like that you could increase profitability, because they would happily
pay $210 rather than drive around any more.”
Those lessons—the flexibility of price, the undesirability of being eager,
and the exercise of care around numbers—are all eminently applicable to buy-
ing stocks.
“It is important,” Boyle concludes,” to always be friendly. No one wants to
reduce the price for someone they dislike.”
Remember that it is a free society, and it is not shameful for people to say
at what price under the quoted one they would buy.
nied_c15.qxd 1/24/03 10:51 AM Page 299

nied_c15.qxd 1/24/03 10:51 AM Page 300

301
16 A N A M I A B L E I D I O T I NT H E B I O T E C H N O L O G Y
R E V O L U T I O N
The ability to manipulate the genetic codesof living things set off an unprecedented industrial conver-
gence: farms, doctors, drug makers, chemical processors,
computer and communications companies, energy companies
and many other commercial enterprises will be drawn into
what promises to be the largest industry in the world.
—Juan Enriques and Ray A. Goldberg, Harvard Business Review(March–April 2000)1
Vic’s 10-year-old daughter Kira talking:
“Daddy, tell me a story. About great heroes and what happens to them
today.”
“Very good. You’ve been hearing in school about the heroic exploits in
mythology: how Perseus had to cut off Medusa’s head, how Theseus killed the
nied_c16.qxd 1/24/03 10:50 AM Page 301

302 Practical Speculation
Minotaur, and how Jason sailed to capture the Golden Fleece. Jason had to
work like a demon to get it from King Aetes.”
“That’s right. First he had to build the Argo with 50 oars. Then he had to
round up Hercules and 49 other heroes to stand a chance.”
“And then, they had to overcome the water nymphs, the harpies, the
clashing islands, the fire-breathing bulls, the armed men who sprang up from
dragon’s teeth, the dragon itself, King Aetes’ pursuing army, Medea’s brother,
the sirens, the rock-throwing giant. And Jason had a broken heart from seeing
his father and mother slain on his return.”
“And what did he get for it, Daddy? Not much.”
“Yes. He ended up penniless and homeless. And one day when he re-
turned to look at the Argo once more . . .”
“The prow fell on his head and he died. Thank goodness we don’t have to
do such hard things today. When you do want to do something heroic you get
rewarded, not killed.”
“On the contrary. There is one thing even harder than Jason’s quest for the
Golden Fleece. That is for a biotech company to get a product approved by the
government. It is very sad, because biologists know more now about the effec-
tiveness of molecules and their side effects than they ever did before. They
spend a good $50 billion a year researching new ones, and they have filed
patent applications for 30,000 of them. If they win a patent, then they have to
show that the inventors are qualified, search the literature, and do some pre-
liminary studies. About 1,500 to 2,000 of these new drugs make it through that
process each year, and then they are ready to be tested on humans. At that
stage, they are called I-N-Ds, Investigative New Drugs.”
“Sounds pretty hard, sort of what Jason had to do to get to Colchis,” Kira
said.
“Good point. That’s when the Phase 1, Phase 2, and Phase 3 studies that
you’re always hearing about start.”
“How much does it cost?”
“Well, Tufts, in Boston, where your dentist went to school, has a center
for studying this. Their current estimate is that it takes 18 years and $800 mil-
lion to get one drug approved by the FDA.”
“Daddy, I have a question. If they come up with 2,000 new INDs a year to
test, how many of them reach the final destination?”
“Great question. Fewer than one in 100. About 15 or 20 each year. Not
very good odds.”
“And when they do get approved, is the Golden Fleece very valuable?”
“Oh, yes. They get 17 years without any competition from the same mol-
ecule, and the nice warm feeling that they don’t have to worry much about
nied_c16.qxd 1/24/03 10:50 AM Page 302

Chapter 16 • An Amiable Idiot in the Biotechnology Revolution 303
others going through the same journey they took, because they won’t have the
time or the money.”
I Know This Crazy Guy . . .
Roger Longman: You wouldn’t believe it, but I know this guy. Rich trader
in Connecticut. Went to Harvard, got a PhD in economics from Uni-
versity of Chicago. But he thinks the FDA should be abolished.
Drug company big: You’re killin’ me.
Longman: Yeah. He goes around saying that. He runs some kinda fringe
group. Meetings. Slogans. You know. Buzz words. “The FDA stifles
innovation.” “Big Pharma is keeping out little companies.” “Each
year the FDA’s failure to approve drugs costs 100,000 lives.” “The
FDA would never have allowed Windows to be approved if software
were under its jurisdiction.” Stuff like that.
Drug company big: People like that, nobody pays attention. Everybody
knows the FDA is there to protect people from stuff that makes ba-
bies get born with flippers instead of arms.
Longman: He talks to a bunch of business school kids over the Internet.
Wrote a book on trading that has sort of a cult following.
Drug company big: Well. Maybe he’ll convince Chile to fire its drug
regulators. What do guys like that say when you bring up thalido-
mide babies?
Longman: He came right back and said no way would the FDA approve
aspirin today, since it causes deformities too. And then he said the
FDA wouldn’t let anybody advertise that taking aspirin brings heart
disease down by 40 percent. I didn’t want to go there. Thing is, peo-
ple like him exist. They’re out there, you know what I’m saying?
The Old Phase 2
Despite irreconcilable differences on the subject of drug regulation, Roger
and Vic are good friends and have tremendous admiration for one another.
Whenever the two of them meet, Vic takes his arm. “Roger, let’s do the ami-
able idiot routine,” he says, doing a bit of soft-shoe. “Have you had occasion to
mention me in any of your talks with Big Pharma lately?”
Roger falls into step. “Oh, it’s not that, Vic,” he always says. “It’s just that
you need to realize that there’s no requirement for approvals to take 20 years.
The drug companies and regulators do it to make sure the drugs are safe.”
nied_c16.qxd 1/24/03 10:50 AM Page 303

304 Practical Speculation
It is all too typical of those totally immersed in a milieu, be it an industry,
a political culture, or a profession, to defend its norms. Roger is editor and
managing partner of Windhover Information Inc., publisher of a respected
group of magazines that are must reading for drug industry venture capital-
ists. The “drug company big” in the preceding dialogue is an actual person, a
top executive at a major pharmaceutical firm. We withhold his name in the in-
terest of diplomacy.
The Trader’s Apprentice
“Registered letter here, Vic.”
“Not another garnishing from the Infernal ones regarding that $40 dis-
pute on our 1970 returns.”
Rob, my office manager, hands me the letter. “No. It’s from that Chinese
guy you turned down for a job because you didn’t think he understood Amer-
ican markets well enough to help.”
“What does he want, reimbursement for a first-class ticket?”
“He says he read in those nineteenth-century investment books in your li-
brary that old-time speculators started out on Wall Street as apprentices. They
did menial work for free and after they’d proved themselves, they’d be given a
chance to trade. He wants to do that for you. He sent his e-mail address.”
I tap out the address on my computer monitor. “Let’s go,” I write, and
push the send button to Shi Zhang.
Shi appears at the trading room door a few days later. He calls me “Sir.”
The traders in my office, unaccustomed to such displays of deference, nick-
name him “Mr.”
For Mr.’s first project, I ask him to classify five years of monthly prices for
the 150 companies in the Russell 2000 Health Care Index according to the
level of insider trading in the preceding two months.
Shi proved himself a worthy apprentice. His biotech study and many
other contributions appear throughout this book. Moreover, several weeks
after his arrival, after Shi had racked up a 46-trade win record with his first 48
forays into the German bund market, my other traders formed a line, bowed
in unison, and called him “Master,” over his outraged protests.
The Invisible Victim
Jim Lorie, one of the original directors of the Center for Research in Securities
Prices, talking to the Friends School at Chicago 35 years ago; Vic audited the
class before their first squash match together.
nied_c16.qxd 1/24/03 10:50 AM Page 304

Chapter 16 • An Amiable Idiot in the Biotechnology Revolution 305
“Kids, there is not one economist who has ever studied the FDA who
hasn’t concluded that they’d do much better if they speeded up the approval
process. As George Stigler says, industry co-opts regulations to make sure
they are designed and operated primarily for its benefit. By driving up the cost
of pharmaceutical research and delaying drug approvals, the FDA reduces the
supply of new, effective drugs.”
“But what about safety, consumer protection, and imperfect informa-
tion?” asks a student.
“Yes, but at what price?” says Lorie. “You have to balance the costs against
the benefits. Let’s look at this diagram of what happens if the FDA allows or
rejects a drug, classified by whether it’s beneficial or harmful.
He chalks Table 16.1 on a blackboard.
“FDA officials know they’ll be punished for approving a harmful drug
(Type I error), but not for failing to let a good one go on the market (Type II
error),” Lorie says. “If a harmful drug is inadvertently allowed to go to
market, the victims are identifiable and might appear on Oprah. But if a
beneficial drug is rejected, the victims are faceless, nameless, and rarely ac-
knowledged even in the abstract. Is it any wonder, then, that the FDA places
too much emphasis on avoiding Type 1 errors and not enough on avoiding
Type 2 errors?
“Although many lives are lost because of FDA delays and failure to approve
good drugs, from the agency’s standpoint it’s much worse to let a bad drug slip
through. They always say that economists can never agree on anything. But
every economist who has studied the FDA has concluded the same thing: The
FDA needs to approve drugs faster. The economists also agree as to the reasons
for erroneous decision making at agencies like the FDA.
“You have to balance disasters like thalidomide, which by the way was
never approved in the United States, against things like aspirin and penicillin
which could never make it by the FDA at all today under the current setup,”
Lorie concludes. “The net result of all this misplaced emphasis on minimiz-
ing the Type 1 errors at the expense of the Type 2 errors is 50,000 extra deaths
a year, according to the best estimates.”
With just three minutes left before our game, Jim winds up his talk. “From
Adam Smith to Sam Peltzman—who first studied the lives lost by delays in
Table 16.1 FDA Decision Making
Drug Is Drug IsBeneficial Harmful
FDA reviewers . . . Allow the drug. Correct decision Type 1 errorReject the drug. Type 2 error Correct decision
nied_c16.qxd 1/24/03 10:50 AM Page 305

306 Practical Speculation
approval—to Milton Friedman, every economist who studies this has con-
cluded that the cures for the market’s woes are often worse than the disease.
Nowhere is this more harmful, nowhere is this more tragic, than in the case of
our current system for deciding which drugs get approved.”
Things have not improved since Lorie’s talk. I found numerous examples
of deadly FDA delays:
Septra: The FDA delayed approval of the antibacterial drug Septra for five
years, taking three years longer than European regulators. Nobel
Prize winner George Hitchings estimated that the five-year delay cost
80,000 lives.
Beta Blockers: Beta blockers regulate hypertension and heart problems.
The FDA held up approval for eight years because it believed they
caused cancer. In the meantime, according to Dr. Louis Lasagna of
Tufts University, 119,000 people died who might have been helped
by the medication.
Clozaril: Clozaril is effective in treating 30 percent to 50 percent of schizo-
phrenics who don’t respond to other medicines, according to The NewEngland Journal of Medicine. The effect was discovered in 1979, but
Clozaril was not approved in the United States until 1990. Companies
believed the FDA would reject it on the grounds that 1 percent of pa-
tients who take the drug develop a blood ailment. As a result, some
250,000 patients suffered needlessly.
Mevacor: A cholesterol-lowering drug that reduces heart disease deaths
by about 55 percent, Mevacor was available in Europe in 1989. It was
not approved in the United States until 1992. As many as 1,000 peo-
ple died from heart disease because of the FDA’s delay.
Havrix: The first vaccine to prevent hepatitis A, Havrix was available in
Europe and 40 other countries three years before being approved in
the United States.
Interleukin-2: European regulators approved Interleukin-2 in 1989 for
the treatment of kidney cancer. Three years later, it won approval for
that use in the United States. In the interim, 3,500 people died who
might have been saved.
The Trial
As I told my daughter, and as Lorie made plain, biotech companies’ quests for
the Golden Fleece are fraught with many dangers. Bringing a product to market
nied_c16.qxd 1/24/03 10:50 AM Page 306

Chapter 16 • An Amiable Idiot in the Biotechnology Revolution 307
demands a combination of research, manufacturing, scientists, doctors, con-
sultants, and government affairs people. Forbes ASAP editor Michael S. Malone
gave a firsthand report of a few crucial moments of one typical quest in a report
for ABCNEWS.com:
As it happens, two years ago for a magazine story, I followed a biotech company
as it ran the gauntlet of final FDA approval on a new heart drug. Now, in my ca-
reer as a journalist, I’ve seen new product design teams sweat and fight and break
their health trying to get a new model to market. I’ve seen CEOs with bad quar-
terly numbers get ripped to pieces by packs of howling analysts. And I once
watched a corporate chairman nearly collapse from a stroke while trying to drive a
merger vote through an angry shareholders’ meeting.
But nothing prepared me for the FDA Star Chamber. The company I was
watching had spent two years field testing their drug, then weeks preparing its
FDA presentation. Then the entire senior staff of the company moved to a hotel
near Bethesda, Maryland, set up a full communications center in a conference
room there, and spent four days running rehearsal after rehearsal, rewriting the
entire presentation a half-dozen times.
Meanwhile, back home, the company froze, knowing that its stock value and
its future sales all depended upon what happened inside the FDA chambers at the
National Institute of Health.
The hearing itself had all of the elements of a nightmare: the terrified pre-
senters, the panel of doctors on stage, each with their own prejudices and agen-
das. Eight hours of misery, until the final vote. . . .
The company gained approval by a single vote. General cheering and back-
slapping. The presenters went home to a gigantic company party—only to learn a
couple days later that one of the approving doctors had changed his mind.
The company stock collapsed, morale imploded, and the company reeled
under the shock for months. It is only now regaining its footing.2
Who would be foolish enough to buy stocks in a company subjected to
these perils? Amazingly, numerous investors are willing to share in the risks.
These hardy souls may be likened to the Dutch entrepreneurs who braved
similar odds to finance a new company in America some 350 years ago. Cer-
tainly the incentive for buying such stocks is the spectacular profit that may be
realized by those who pick the products that make biotech the likely choice for
the breakthrough industry of the twenty-first century.
Even more surprising, however, is that executives in such ventures often
take bullish positions by buying their own company’s stock. Presumably,
these purchases are engendered by something more than pure optimism that
the quest will end by capturing the prize. One such motivation must be infor-
mation. Executives have to know by the time they spend 10 years of effort and
$800 million of expense whether Big Pharma is likely to help them get
nied_c16.qxd 1/24/03 10:50 AM Page 307

308 Practical Speculation
through the final rocks. They have to know from their scientists and their doc-
tors how the treatments are going. Their well-connected consultants must
give them feedback as to how the winds are blowing with their current or for-
mer colleagues at the FDA.
Human nature being what it is, the wheels of commerce have a way of lu-
bricating the flow of information. There are meetings, studies, and letters. Con-
sultants are hired, often those who will eventually opine on the product’s
effectiveness. No matter how blind the double-blind study, somewhere along the
path a company may chance to come by some knowledge as to the likelihood of
success, however tenuous the approval process.
Profit from Asymmetry
George Akerlof, Michael Spence, and Joseph Stiglitz won the Nobel Prize in
2001 for writing about such situations. In their branch of the dismal science,
known as the economics of information, they study how much information
people demand in determining what they will buy and sell. Among their areas
of focus are situations of asymmetrical information, where the buyer and
seller have different degrees of information.
Akerlof used the example of the sale of a used car. The seller knows
whether it is good or bad, and consequently the price drops because the buyer
fears buying a lemon. Similarly, Stiglitz observed that a person buying insur-
ance knows how sick or how likely he is to avoid calamity much better than
the company selling policies.
Stiglitz, like most economists, is much more concerned about how im-
perfect and asymmetrical information can lead to violations of the competitive
model that can only, according to his lights, be fixed by government action to
correct the asymmetry. Indeed, after the September 11, 2001, attack on the
World Trade Center, Stiglitz figured prominently in urging the government
to expand its role in assuring security at airports. We will refrain here from a
discussion of the virtues of competition and innovation that would be stifled
by such interference, except to note that we would gladly pay $15 a ticket extra
to fly on a plane manned by armed guards should the government ever deign
to let airlines compete by offering additional security.
Now consider those biotech and pharmaceutical executives who, with
full knowledge of the difficulty of threading their product through the FDA
needle, are courageous enough to buy shares in their own company. Are they
doing so thinking that their product is likely to be rejected? We would hazard
they are not. Moreover, since a substantial part of their own wealth is tied up
nied_c16.qxd 1/24/03 10:50 AM Page 308
Chapter 16 • An Amiable Idiot in the Biotechnology Revolution 309
in the options and shares they already own, our guess is that they are not doing
it to throw good money after bad. The information that is revealed by their in-
sider purchases and sales contains, to us at least, as much of value as the adver-
tisement that a car is for sale or an individual’s inquiry about buying insurance.
That said, we would not use insider sales as a signal to short stocks. We
generally don’t believe in shorting individual stocks. It is too difficult for us to
overcome that 15,000 percent-a-year arithmetic updraft against the shorts
documented in Chapter 9. As far as we know or can predict, others suffer
from this same failing.
Trading on insider purchases has risks as well. Some executives might be
deceiving themselves as to their company’s true prospects. Worse still, they
might be buying shares to throw the public off the scent. An executive might
buy a minimal number of shares as a setup for a huge sale, timing the transac-
tions to take advantage of the lags in required reporting times. He might escape
disclosure altogether, as did CEO Chairman Kenneth Lay, by selling large,
equal numbers of shares as part of a “long-term” plan. On balance, however, we
have found insider buying to be a profitable signal.
The Niederhoffer-Kenner-Zhang Drug Trials
Inspired by the rather draconian requirements of the FDA, which involve
double-blind studies by accredited investigators at designated centers, we de-
cided to follow to as great an extent as possible their own standards of proof.
However, because we did not have $800 million available to perform a com-
plete double-blind study, nor did we find it appropriate to wait 18 years before
making a decision as to our financial health, we took certain shortcuts for
which we beg the indulgence of all parties.
It is common for companies submitting protocols to the FDA to compli-
ment the regulators on their acumen and fairness (need we inquire as to why
this grotesque servility seems to be so prevalent?), and we would simi-
larly compliment the regulatory agency for the high test standards that
they have set for the companies under their jurisdiction, including the
requirements that the drugs be administered in double-blind studies
on patients with no other condition besides the ones being tested, and who are
available to take the full course of treatments at locations approved and moni-
tored by FDA consultants.
Although we are firmly convinced that these stringent requirements and
others that we have doubtless left out have added immeasurably to the loss of
human life by requiring pseudoscientific results that have no relation to the
nied_c16.qxd 1/24/03 10:50 AM Page 309

310 Practical Speculation
way patients actually take medicines in the real world, we have tried to follow
the spirit of the FDA’s requirements in our own work to as great an extent as
feasible with our own financial results and proper reporting of those results to
our readers.
To test our theory that a dose of insider buying leads to healthy profits for
biotech investors, we conducted, with the assistance of Vic’s aforementioned
apprentice, Shi Zhang, a comprehensive three-stage study of all subjects en-
rolled in the Russell 2000 Health Care Index over the six years 1996–2001.
The first stage involved a Phase 1 study of the safety of such a procedure. We
looked at the performance of 50 companies in the year 2001. The results
showed that these companies displayed healthy returns in excess of 20 per-
cent, greater than the Index’s returns during that year.
Consultants who oversee our work pointed out that these results could
well have been affected by special factors relating to the 2001 cohort, and they
suggested a more complete study involving a six-year period. This led us to
roll out a comprehensive Phase 2 trial. In compliance with currently required
FDA protocols, we enrolled 1,000 healthy subjects who registered positive for
insider trading within a two-month period. We followed their health during
each of the next 12 months, as measured by their average percentage change
in price. While this was not a double-blind study, we did, in accordance with
standard procedure, compare this with a much larger control group of 1,800
subjects that were afflicted with insider sales. (Many subjects received these
dosages in separate months, and each administration of a dose of buying or
selling in a month was treated as a separate subject.)
The results for healthy and unhealthy subjects (i.e., insider buys versus
insider sales) for all six years combined appear in Table 16.2.
The results of the Phase 2 studies were highly encouraging, and yet the
variability in the results by years shows that, as for most treatments, there is
much uncertainty as to the actual outcome. Note, in the years 1998 and 1999,
the differentials of 30.2 and 39 percentage points, respectively, between re-
turns for buys and sells. Aside from these two years, the results appear rela-
tively random.
In the tradition of early investigators of medical treatments, we decided to
try the treatment ourselves on a real-time basis. The results were carried live
on CNBC Money, starting with our October 25, 2001, column, where we re-
ported the enrollment in our portfolio of 10 insider-positives. After just one
month in the study, they showed improvements in their health, as illustrated
in Table 16.3.
The 25 percent average improvement was so drastic that we immediately
closed out the companies from our portfolio and took profits.
nied_c16.qxd 1/24/03 10:50 AM Page 310

Chapter 16 • An Amiable Idiot in the Biotechnology Revolution 311
We decided to conduct a confirmatory trial in 2002 with
twice as many patients. The patients were fragile to begin with,
and it would be impossible at this point to sepa-
rate the effects of the insider dosages from the
Great Market Virus of 2002, Type “Meme.” However, we have
concluded that our first study was what they call in the trade “a false positive,”
and reluctantly pulled the plug. Our tests resulted in what is called a negative
study in the medical literature. The patients taking the medicine actually died
Table 16.2 Follow the Insiders in Biotech
Mean % Number Mean % NumberReturn for of Return for of
Year Insider Buys Buys Insider Sales Sells
2001 −3.4 80 4.9 1242000 3.1 209 −6.8 4801999 149.0 197 109.8 2781998 50.3 207 19.1 2801997 8.2 140 −5.9 2441996 30.9 15 20.1 14Weighted average percent return* 49.2 22.6
Total transactions 848 1,420
* Note the weighted average percent return cannot be calculated by simply averaging the meanannual returns.
Table 16.3 Improvements in Health
Change (%) Stock (October 25–November 21, 2001)
Corvas −0.4Dyax 64.4Genelabs −10.1Genzyme Transgenics 1.1Guilford Pharmaceuticals 15.6InKine Pharmaceutical 30.4Large Scale Biology 45.8The Medicines Co. 54.23-Dimensional Pharmaceuticals 19.9Triangle Pharmaceuticals −2.9
Average 25.1
Source: Niederhoffer Investments.
nied_c16.qxd 1/24/03 10:50 AM Page 311

312 Practical Speculation
at earlier ages than those with no treatment. Indeed, the authors of this book
enrolled in the study themselves for the purpose of science, financial health,
and this book. Suffice it to say that their financial health was injured to the
tune of 50 percent by their purchase of these stocks in 2002 (versus an ap-
proximately 30 percent decline in the biotech index itself).
Which, once again, shows the necessity of counting.
nied_c16.qxd 1/24/03 10:50 AM Page 312

313
17 E A R N I N G SI M P O S T O R S
To the tune of the Duet of the Captain and Little Buttercup in
H.M.S. Pinafore, by W.S. Gilbert and Sir Arthur Sullivan:
Things are seldom what they seemPublic’s wrong at the extremes.Prices climb on Wall Street hypeExecs sell when time is ripeVery trueSo they do.
Mergers work accounting gimmicksAnalysts are only sidekicksProfit forecasts are precutCEO has time to putt.Even so,No cash flow.
Managed earnings laid on thickInventory hides the trick.Statements obscure bottom linesAccruals shroud cash flow declinesSo they areNever at par
nied_c17.qxd 1/24/03 10:49 AM Page 313

314 Practical Speculation
Hide the debts in towns offshoreThen go out and borrow moreOption costs they don’t deductPublic is the goose they pluckSo they doIn full view
Worst of all is the write-downOfficers they all leave townPay their bonus, then go underOnly bad folks get to plunderFirst they fakeThen they take.
Big execs retire like kingsEliot Spitzer has his flingGild the earnings, steal the tillWhat is left is sure to killYes, I know,Dow will go.
Pictures of corporate executives and accountants in action in the good
old days were more likely to show them hitting a drive at an important
conference at the Greenbrier Resort than taking a perp walk before an indict-
ment for corporate fraud.
Lists of those in the Rogues Gallery were more likely to include bank rob-
bers than executives charged with crimes from such companies as Adelphia
Communications, Arthur Andersen, Enron, HomeStore, ImClone, Tyco, or
WorldCom. Security analysts, rather than Attorneys General, were more likely
to be studying financial statements. Income statements were more important
than balance sheets.
nied_c17.qxd 1/24/03 10:49 AM Page 314

Chapter 17 • Earnings Impostors 315
But in the early years of the twenty-first century, all that has changed. Ex-
ecutives are depicted as impostors. The attractive members of the opposite sex
at cocktail parties no longer surround the venture capitalist. The bullish ana-
lyst is laughed off the television set. As Gilbert tells us in Pinafore:
Highlows pass as patent leathers
Jackdaws strut as peacock feathers.
Yes, indeed, training in detecting the impost0rs is becoming more im-
portant for the investor than the study of the principles of scientific manage-
ment. The study of balance sheets has become more important than the study
of income statements. Within the balance sheet, the “cash and cash equiva-
lents” is king. You can talk, you can bicker, you can boast about the earnings,
but when profits don’t show in cash flow from operations, you’ve got to be
careful.
We found four questions to be helpful in differentiating between the real
and the distorted, and the true and the false:
1. Has the company announced a stock buyback? Buyback announce-
ments preceded highly superior performance in all periods we tested.
2. Does the company pay dividends? Giving cash back to shareholders
has been associated with superior long-term returns for at least the
past century.
3. What’s happening with inventory and accounts receivable? Decreases in
these two indicators lead to good performance. Increases are bad news.
4. Does the company pay taxes? The bottom line may be a chimera, but if
the company is so profitable that it has to bite the bullet and pay cash to
the IRS, that’s a good sign that the earnings are real.
Not all of these measures are good for all seasons. Companies with high
dividend yields have performed significantly better than companies with low
dividend yields over the very long term. But they held no advantage in the
1990s, or even in the difficult market year of 2002. Buybacks can signal that
a company is willing to back up its good intentions with cash—but some-
times, it works out best for all concerned if the company keeps the money to
invest in the business. Accounts receivable, inventory, and cash taxes paid
may be of more enduring value, particularly combined with the buyback or
dividend signals.
We discuss each of these findings in this chapter. But first, we will ex-
plain the accounting issues in a bit of detail. You don’t need a green eyeshade
to understand this stuff, and an investor who knows a cash profit from an ac-
crued profit will have a meal for a lifetime.
nied_c17.qxd 1/24/03 10:49 AM Page 315

316 Practical Speculation
Cash Money
Cash is the first item on the balance sheet. By looking at a company’s audited
statement of cash flows from one year to the next, you can tell whether cash
increased or decreased. But where did that cash from, and where was it used?
In a nutshell, cash flow from operations is designed to show the cash ef-
fects of revenues and expenses. If a business is to survive, it must in the long
run generate such cash flows. If a business constantly loses cash from its op-
erating activities, who would want to own it?
The record that keeps track of these increases and decreases is called an
account. The left side of an account is called a debit, and the right side is called
a credit. The rules for financial bookkeeping are designed so that the debits on
any transaction are equal to the credits. That is what is meant as double-entrybookkeeping.
The double-entry bookkeeping system, followed by all major companies,
is designed to reflect the fact that economic transactions have impact on two
or more than two accounts at the same time. For example, if you go out to buy
a box of cereal, your cash decreases and your stock of cereal increases. An in-
crease in an asset or expense is a debit, and an increase in a liability or rev-
enue is a credit.
The basic equation that keeps the debits and credits equal is
Assets = Liabilities + Owners’ equity
For this equation to remain in balance, all changes on the left side must
be balanced by an equal change on the right side. Also, any increase in an ac-
count on the left side must be balanced by either a decrease in an account on
the left side or an increase on the right side.
If we divide the left side of the equation into cash and noncash assets, we
get the new equation:
Cash + Noncash assets = Liabilities + Owners’ equity
Then we can see that any increase in noncash assets must be balanced by a
decrease in cash assets, or an increase in liabilities. Any decrease in noncash as-
sets must be balanced by an increase in cash, or a decrease in liabilities.
By working through the transactions that cause an account to increase or
decrease, an accountant or an educated reader can calculate the difference be-
tween the cash flows and the net income of a business. They are all summa-
rized and reported on the statement of cash flows. All public companies have
been required to report this in their annual reports to shareholders and in
SEC filings since 1987.
nied_c17.qxd 1/24/03 10:49 AM Page 316

Chapter 17 • Earnings Impostors 317
Table 17.1 shows some selected financial figures from General Electric for
the calendar years 2001 and 2000 to put this in perspective.
Bear in mind that these are just selected figures, and that we have not
queried General Electric about these items because the company refuses to
grant us an interview. Note, however, that on a sales decrease of $3.7 billion,
General Electric was able to increase net income by $949 million. This is
highly commendable. However, of this $949 million, $753 million came from
an inventory increase, and $88 million came from an accounts receivables in-
crease. Taking this $841 million away, the net increase in earnings was just
$108 million.
Accountants and analysts use that exact procedure with all asset and liability
accounts to compute the difference between cash earnings and accrual earnings.
(We emphasize that this is merely a partial picture of General Electric’s financial
statement, and that the company actually generated cash flow of $32.2 billion in
2001, up from $22.7 billion the previous year. Other items on the statement of
cash flow account for this difference, such as an increase in insurance liabilities
and reserves of $9.2 billion). While we hesitate to opine on these matters be-
cause of our lack of direct contact with GE, may we speculate that fear that such
items might be signaling that all was not well was responsible in part for the 47
percent decline that GE experienced from top to bottom in 2002?
Buybacks
Let’s turn to buybacks and dividends—the two main ways for a company to re-
turn cash to shareholders.
Nothing is inherently better about companies that pay dividends or buy
back stock. A growth company may decide to invest the cash in its business.
Table 17.1 General Electric: Selected Financial Items
Year Ended
2001 2000(in Millions) (in Millions)
Inventory 8,565 7,812Accounts receivable 9,590 9,502Sales 125,679 129,417Net income 13,684 12,735Source: Bloomberg L.P.
nied_c17.qxd 1/24/03 10:49 AM Page 317

318 Practical Speculation
When a company perceives that the rate of return in its own business is less
than shareholders could achieve on their own, it’s prudent for all concerned if
extra cash is distributed. Moreover, in an investment atmosphere that is poi-
soned by mistrust and fraud, distributions show good intentions in a way that
mere reassurances never could. A company that gives cash to stockholders
can’t waste it on ill-considered mergers, grandiose buildings, outlandish exec-
utive perks, and other hubristic activities.
As Paul Fels, a reader of our CNBC Money column observed: “You can
fake or inflate earnings, but if you pay out cash, you had to have it in the
first place.”
Share buybacks increased rapidly starting in the mid-1980s as the per-
centage of companies paying dividends dwindled. In 2000, companies spent
as much on buybacks as they did on dividends, according to an admirable
study in the August 2002 Journal of Finance by Gustavo Grullon of Rice Uni-
versity and Roni Michaely of Cornell University.
Buybacks have three major virtues:
1. Signaling. By authorizing a stock buyback, a board signals to share-
holders that it feels the stock is undervalued.
2. Better income ratios. Other things being equal, the reduced number of
shares will improve earnings per share and return on equity.
3. Flexibility. Investors can interpret the elimination or reduction of a div-
idend as extremely bad news. Because a stock buyback is a one-time
event, no embarrassment results from failing to repeat it.
The classic study on share repurchases was conducted by David Ikenberry,
a professor at Rice University; Theo Vermaelen, professor of finance at
INSEAD, a French business school; and Josef Lakonishok, a finance professor
at the University of Illinois. The study, published in the Journal of FinancialEconomics in 1995, found that companies buying back their own shares per-
form some 4 percentage points better than the averages. Studies of companies
in India, England, and Canada confirmed the professors’ findings.
At least two funds are putting the study’s findings to profitable use. David
Fried’s Buyback Letter has enjoyed one of the best ratings from Hulbert Digest,the acknowledged arbiter of newsletter performance. Professor Vermaelen’s
own buyback fund that he manages for a Belgian bank, KBC, reported a return
of 40 percent from the fund’s inception in July 1998 through April 2002.
We verified the academics’ conclusions ourselves in April 2002 by com-
piling a list of every company in the S&P 500 that had announced a buyback
since the beginning of 2000. We tracked each company’s performance over a
full year, using the close on the day after the announcement as the buy date.
nied_c17.qxd 1/24/03 10:49 AM Page 318

Chapter 17 • Earnings Impostors 319
The 224 companies we identified outperformed the S&P 500 by an average of
30 percentage points a year, a 1-in-100 million shot by chance alone.
By October 2002, we had added 15 additional companies. The advantage
dwindled to 6 percentage points—still a very respectable edge.
When we reported our findings, many readers wrote in to express concern
that companies would fail to follow through after announcing buybacks. The
worry is misplaced. A company’s buyback announcement signals that man-
agement believes the stock to be undervalued. If the stock immediately rises
based on this signal, the job has been done. We found no evidence that com-
panies that do implement buybacks perform better than those that don’t. (In-
vestors can monitor actual repurchases by watching the shares outstanding
reported in consecutive quarterly financial statements.)
Dividends
When mutual funds statements are too depressing to watch and every week
brings news of a new major accounting fraud, few things seem more reassur-
ing than dividend checks in the mail. Not only do the payouts offer a cushion
against stock declines; a company that must come up with hard cash to pay
higher dividends quarter after quarter has less latitude for accounting shenani-
gans. A dividend offers tangible proof to shareholders that they exercise at
least some control over the assets they own.
Older generations of investors knew this well. “My father-in-law (now de-
ceased) looked only at dividends for his personal support and never con-
cerned himself with the value of his portfolio,” wrote reader Patricia K.
Schwabacher. “During market downturns, he worried not at all. He just
didn’t buy a new car or a new boat at those times. He only concerned himself
with the security of the dividends. He retired at 50 and died at 90, having
lived a very nice lifestyle, with a net worth that increased 10-fold during that
period of investment.”
Regrettably, the number of companies paying dividends steadily dwin-
dled from 70 percent in the 1970s to about 20 percent in 2000. U.S. tax pol-
icy is partly to blame. Dividends are taxed at the corporate level of 20 percent,
and when they reach the investor’s pocket they are taxed again at 40 percent,
on average. If the company holds onto the money and invests the money
wisely, or buys back its own shares, investors can enjoy capital gains taxed at
only 20 percent. That’s why the retention ratio—earnings retained versus
total dividends paid—has increased from 30 percent in the 1950s to 70 per-
cent today.
nied_c17.qxd 1/24/03 10:49 AM Page 319

320 Practical Speculation
But the double tax is not the only skewed incentive confronting manage-
ment. Congress has done further mischief by permitting deductions for inter-
est but not dividends. In effect, companies are encouraged to go into debt. As
ratings agencies and investors frown on highly leveraged balance sheets, some
companies—Enron comes to mind—go to great lengths to hide their debt with
dubious or fraudulent accounting.
Moreover, executive options decrease in value along with stock prices
when a company pays dividends. The rise in executive pay over the past 50
years has been accompanied by a decline in dividends.
We wanted a fresh look at the question of whether dividends actually are
predictive of superior stock returns. As has become our wont, we began by con-
sulting that magnificent analysis of 101 years of stock market data, Triumph ofthe Optimists.
Dimson, Marsh, and Staunton, the authors of Triumph, examined the per-
formance of the 30 percent of companies with the highest dividend yields at
the beginning of each year and compared it to the performance of companies
that were in the lowest 30 percent of dividend yield. From 1900 through 2001,
companies with the highest yields returned 12.2 percent a year. Companies
with the lowest yields showed an annual total return of 10.4 percent.
A difference of 2.2 percentage points a year may not seem like much.
But over time, it becomes a gigantic differential. Over the 101 years of the
study, $1 invested in the highest-yielding companies could have come to
$4,948, while $1 invested in the lowest-yielding companies would have
grown to a mere $1,502.
The margin of superiority for high-yielders versus low-yielders, however,
has been close to zero since 1990. To determine if the regime shift had set in,
we updated the Triumph data by considering the S&P 500 companies that
showed the highest yields at year-end 2000 and year-end 2001, along with
their performance in the next year.
We found that the 10 high-yield stocks outperformed the market in 2001
with a positive return of 8 percent versus a 10 percent loss in the S&P 500 and
a 39 percent loss in the Nasdaq. But in 2002, the effect did not hold up. The
top 10 high-yield stocks were down 34 percent as of mid-October, even worse
than the 24 percent loss in the S&P 500 and exactly even with the 34 percent
loss in the Nasdaq.
The numbers were similar for the top 30 high-yielders. These stocks were
little changed in 2001 and were down 25 percent as of mid-October 2002, as
Table 17.2 shows.
The great danger in buying a stock with a high dividend yield is that divi-
dends can be cut. Ford Motor Company, Dynegy, Goodrich, Transocean, and
nied_c17.qxd 1/24/03 10:49 AM Page 320

321
Tabl
e 17
.2Ch
angi
ng C
ycle
s: P
erfo
rman
ce o
f To
p 10
Div
iden
d-Yi
eld
Stoc
ks (
2001
vs.
200
2)
Yiel
d at
Janu
ary–
Oct
ober
200
2Yi
eld
at20
01Co
mpa
nyYe
ar-E
nd 2
001
Perfor
man
ce (%
)Co
mpa
nyYe
ar-E
nd 2
000
Perfor
man
ce
Plum
Cre
ek T
imbe
r (P
CL)
10.0
5−2
7.1
Sabr
e (T
SG)
12.0
6−1
.8D
ana
(DCN
)6.
77−2
3.7
J.C.
Penn
ey (
JCP)
10.4
715
5.79
Ford
Mot
or (
F)6.
68−4
6.6
Roc
kwel
l Aut
omat
ion
(RO
K)8.
48−1
5.51
J.C.
Penn
ey (
JCP)
6.44
−45.
5D
ana
(DCN
)8.
1−3
.34
Roc
kwel
l Aut
omat
ion
(RO
K)6.
34−1
0.4
Ford
Mot
or (
F)7.
68−2
9.27
CMS
Ener
gy (
CMS)
6.08
−70.
0D
elux
e (D
LX)
7.33
116.
65Ea
stm
an K
odak
(EK
)6.
01−1
0.8
Win
n−D
ixie
Sto
res
(WIN
)7.
09−2
3.52
Amer
en (
AEE)
6−1
.8Th
omas
& B
etts
(TN
B)6.
9234
.92
RJ
Reyn
olds
Tob
acco
(R
JR)
5.86
−39.
1W
acho
via
(WB)
6.9
16.4
7Ce
nter
Poin
t Ene
rgy
(CN
P)5.
66−6
7.4
Sout
hern
Co.
(SO
)6.
631
.95
Aver
age
−34.
24Av
erag
e8.
16
Stan
dard
Stan
dard
devi
atio
n23
.59
devi
atio
n1.
77
nied_c17.qxd 1/24/03 10:49 AM Page 321

322 Practical Speculation
Qwest Communications were among the companies that suffered declines
exceeding 40 percent in 2002 after cutting or eliminating their dividends.
There is also a risk in buying a company where management is implying that
they have encountered sufficient barriers in their ability to use your capital
that they are giving it back to you.
Up with Dividends
We next looked at companies that initiate or increase dividends. The academ-
ics have concluded that dividend increases are irrelevant. In the scientific tra-
dition, we vetted their findings. Cycles are always ready to change in markets,
racing, and in life—just when they seem “sure as rain.” A preliminary study of
dividend increases in the year 2002 yielded results contrary to the academics’
findings.
We took the 120 companies in the S&P 500 that increased their dividends
in 2002, and found in mid-October a cumulative performance of −14 percent.
Twenty-two companies decreased their dividends, and their performance was
−20 percent. The difference is significant at the usual statistical levels. Com-
panies that declared new dividends beat the S&P 500, as Table 17.3 shows.
We conclude that there is no magic bullet for stocks. High-yield com-
panies seem to show superior performance over time, but that effect appar-
ently vanished in the difficult year of 2002. Companies that increase dividends
have had relatively woeful performance in the past, but in these times they
augur good performance.
Dividend Yields and the Market
We often hear from gurus of the value persuasion that stocks are too high be-
cause dividend yields are too low. Bill Gross, the reigning bond king of Pimco,
used 100-year statistics on dividend yields and dividend growth in September
2002 to argue that the Dow should be at 5000. (It was then at about 8500.)
Such an argument is so naïve that we are almost embarrassed to hear it
expressed. It leaves out the fact that companies were spending as much to
buy back shares as they paid out in dividends. It also leaves out the fact that
interest rates on the 10-year note are at the lowest levels since the 1950s.
That means stocks don’t have to yield much to be attractive, as Tables 17.4
and 17.5 illustrate.
nied_c17.qxd 1/24/03 10:49 AM Page 322

323
Tabl
e 17
.3New
Div
iden
ds a
nd S
tock
Ret
urns
*
Div
iden
dCh
ange
after
Diffe
renc
e ve
rsus
S&
P50
0Co
mpa
nyTi
cker
Dec
lare
daf
ter
12 M
onth
s (%
)af
tr 1
2 M
onth
s (%
)
Amer
isou
rceB
erge
nAB
C10
/31/
2001
1228
FedE
xFD
X5/
31/2
002
N/A
N/A
Gol
dman
Sac
hsG
S6/
24/1
999
3222
John
Han
cock
Fin
anci
al S
ervi
ces
JHF
11/1
3/20
0032
49M
eadW
estv
aco
MW
V1/
13/2
002
−17
0M
etro
polit
an L
ifeM
ET10
/24/
2000
1029
Mon
sant
oM
ON
10/1
8/20
0049
72Pe
psi B
ottli
ng
PBG
4/29
/199
97
−3Pr
inci
pal F
inan
cial
PF
G10
/25/
2002
N/A
N/A
Qw
est
Q5/
2/20
01−8
7−7
3R
J Re
ynol
ds T
obac
co H
oldi
ngs
RJR
7/28
/199
95
−2R
ockw
ell C
ollin
sCO
L7/
2/20
016
29U
nite
d Pa
rcel
Ser
vice
UPS
11/1
8/19
99−9
−9Vi
steo
nVC
7/14
/200
024
43
*Ret
urns
don
’t in
clud
e re
inve
sted
div
iden
ds.
Sour
ce:
Bloo
mbe
rg L
.P.
nied_c17.qxd 1/24/03 10:49 AM Page 323

324 Practical Speculation
We took out the pencil and paper to see what happens to
the S&P 500 when per-share dividends fall. From 1938
through September 2002, S&P 500 dividends have declined
in only six years. Table 17.6 shows what happened to the mar-
ket in the year of the decline and then in the next year.
Table 17.4 Year-End Yields for U.S. 10-Year Notes (1962–2001)
Year Yield (%) Year Yield (%) Year Yield (%)
2001 5.051 1987 8.859 1973 6.9022000 5.112 1986 7.223 1972 6.4121999 6.442 1985 8.986 1971 5.8921998 4.648 1984 11.514 1970 6.5021997 5.741 1983 11.801 1969 7.8821996 6.418 1982 10.389 1968 6.1621995 5.572 1981 13.982 1967 5.7021994 7.822 1980 12.432 1966 4.6421993 5.794 1979 10.332 1965 4.6521992 6.686 1978 9.152 1964 4.2121991 6.699 1977 7.782 1963 4.1421990 8.067 1976 6.812 1962 3.8521989 7.935 1975 7.7621988 9.137 1974 7.402
Source: Bloomberg L.P.
Table 17.5 Selected S&P 500 Year-End Dividend Yields
Year Yield (%) Year Yield (%)
2001 1.4 1990 3.72000 1.2 1980 4.51999 1.1 1970 3.41998 1.3 1960 3.31997 1.6 1950 7.21996 2.0 1940 6.31995 2.2 1935 3.51994 2.8 1900 4.31993 2.7
Source: Bloomberg L.P., S&P Security Price Index Record, The Tri-umph of the Optimists (Princeton, NJ: Princeton University Press,2002).
nied_c17.qxd 1/24/03 10:49 AM Page 324

Chapter 17 • Earnings Impostors 325
In the six years that dividends declined, the average capital gain in the
S&P 500 was 17 percent. The next year, the gain was 10 percent. Including div-
idends would add 5 percentage points to those results. The myth that stocks
can’t go up unless dividends do is clearly wrong.
Cash Indicators
In 2002, when confessions and revelations of accounting frauds filled the
newspaper pages and the air was thick with the dust of crumbling companies, a
friend who invests in Indian companies told us that wild exaggerations in fi-
nancial reporting are the rule there. The only way to tell the genuine companies
from the frauds was to find the ones that actually paid taxes.
On investigation, we found that many U.S. accounting disasters—World-
Com and Global Crossing being notable examples—had reported splendid
earnings right up to the moment they imploded. There was, however, one sign
of trouble that in retrospect seemed intriguing. Relative to the actual cash taxes
that the companies paid, both companies had reported very high annual earn-
ings before interest, taxes, depreciation, and amortization (EBIDTA) and taxes.
We wondered if the amount of taxes actually paid by a company relative to
reported earnings might provide a clue as to whether financial chicanery was
occurring behind the scenes. After all, few companies would go so far as to
pay taxes on money they never made in the first place.
The mobsters of early Las Vegas understood this. Susan Berman, in her
book, Lady Las Vegas, reports that when casino operators divided up the profits,
there would be a pile for themselves, a pile for the government, and a pile for
the mob bosses. Bugsy Siegel’s bosses knocked him off when he didn’t have a
Table 17.6 Down Years for Dividends
Next Year’sYear of Decrease Decline (%) S&P 500 Return S&P 500 Return
1938 −37 25 −51942 −16 12 191951 −6 15 121958 −3 38 81970 −1 0 111971 −2 11 16
Source: Niederhoffer Investments.
nied_c17.qxd 1/24/03 10:49 AM Page 325
326 Practical Speculation
pile for them. They figured that if they didn’t get their pile from Bugsy, he was
either mismanaging their assets or stealing from them.
Nothing is wrong in principle, or is even suspicious, about a company
reporting one income to the government and another to the public. Com-
panies have two opposing goals: reporting as little net income as possible to
the IRS—thereby limiting tax liability—and reporting as much net income
as possible to the investing public. The rules that the IRS uses to calculate a
company’s income and tax liability can differ significantly from the Gener-
ally Accepted Accounting Principles (GAAP) the SEC requires companies to
follow when calculating the income they report to the public.
A company’s taxable income may differ significantly from the income it
reports to shareholders for many legitimate reasons: the depreciation method
used, the treatment of amortizing intangibles, the way revenues are booked,
and whether and how stock options are expensed.
Tax accounting is one of the most technical, controversial, and fuzzy of all
accounting areas. One generalization we can make is that growing companies
tend to have increasing deferred tax liabilities. That’s because they are contin-
ually making capital expenditures (buying computers or trucks, for example).
Estimates of when deferred liabilities (or credits) are likely to be realized can
vary substantially under GAAP and IRS guidelines. The difference in timing
can occasionally—though not always—be material.
A back-of-the-envelope study seemed in order. Using the 30 Dow Jones
Industrial stocks, we compared the EBITDA from their income statements
to the cash taxes paid figure in their cash-flow statements. We separated the
companies into high-tax payers and low-tax payers, and compared their
stock performance. The results are shown in Tables 17.7 and 17.8.
Counterintuitively—which suggests the finding deserves closer scrutiny—
the companies that paid less tax on the same amount of income did worse
than the companies that paid more. You would expect that companies better
able to avoid, or at least put off, paying taxes would be better managed and
thus have higher performance. Our studies suggest the reverse at a statisti-
cally significant level.
To make sure our results were not due to chance, we ran the same test on
a sample group of 50 S&P 500 stocks. As Table 17.9 shows, the high-tax pay-
ers again significantly outperformed the low-tax payers.
Our studies were very preliminary. It is quite possible that during other pe-
riods and other regimes, companies paying less tax would outperform, helped
by their greater cash flow.
nied_c17.qxd 1/24/03 10:49 AM Page 326

327
Tabl
e 17
.7Hig
h-Ta
x Pa
yers
EBIT
DA,
200
1Ca
sh P
aid,
200
1Ra
tio, EB
ITDA/
(%) Re
turn
Nam
eTi
cker
(in T
hous
ands
)(in
Tho
usan
ds)
Tax
Paid
1/20
02–9
/200
2
Hew
lett
-Pac
kard
HPQ
3,20
01,
159
2.8
−37.
6Ex
xon
Mob
ilXO
M29
,000
9,85
52.
9−1
3.8
Hom
e D
epot
HD
5,70
01,
685
3.4
−45.
5Pr
octe
r &
Gam
ble
PG7,
000
1,70
14.
113
.4W
al−M
art S
tore
sW
MT
13,4
003,
196
4.2
−17.
7Bo
eing
BA6,
500
1,52
14.
34.
3Jo
hnso
n &
Joh
nson
JNJ
9,50
02,
090
4.5
−11.
8Co
ca−C
ola
KO6,
200
1,35
14.
63.
4Ph
ilip
Mor
ris
MO
18,0
003,
775
4.8
5.8
Mer
ckM
RK
11,5
002,
300
5.0
−18.
8W
alt D
isne
yD
IS4,
600
881
5.2
−32.
0M
cDon
ald’
sM
CD4,
000
774
5.2
−13.
43M
MM
M3,
300
520
6.3
3.3
Alco
aAA
3,50
054
86.
4−3
0.1
Cate
rpill
arCA
T2,
500
379
6.6
−17.
8
Aver
age
stoc
k pe
rfor
man
ce−1
3.9
Stan
dard
devi
atio
n17
.5
nied_c17.qxd 1/24/03 10:49 AM Page 327

328
Tabl
e 17
.8Lo
w-T
ax P
ayer
s
EBIT
DA,
200
1Ca
sh P
aid,
200
1Ra
tio, EB
ITDA/
(%) Re
turn
Nam
eTi
cker
(in T
hous
ands
)(in
Tho
usan
ds)
Tax
Paid
1/20
02–9
/200
2
IBM
IBM
16,1
002,
279
7.1
−43.
8In
tel
INTC
8,90
01,
208
7.4
−43.
8SB
C Co
mm
.SB
C20
,000
2,69
67.
4−3
5.0
Uni
ted
Tech
.U
TX3,
700
497
7.4
1.4
DuP
ont
DD
3,50
045
67.
7−5
.1In
tern
atio
nal P
aper
IP3,
300
333
9.9
−5.5
Mic
roso
ftM
SFT
13,0
001,
300
10.0
−30.
4Am
eric
an E
xpre
ssA
XP6,
800
545
12.5
−8.5
Gene
ral M
otor
sG
M23
,000
1,84
312
.5−1
2.3
Citig
roup
C31
,600
2,41
113
.1−3
7.7
Hone
ywel
lH
ON
1,10
079
13.9
−8.7
East
man
Kod
akEK
1,90
012
015
.80.
9Ge
nera
l Ele
ctri
cG
E27
,400
1,48
718
.4−2
4.4
AT&
TT
15,6
0080
319
.4−4
9.2
J.P.
Mor
gan
JPM
11,2
0047
923
.4−3
2.3
Aver
age
stoc
kpe
rfor
man
ce−2
2.3
Stan
dard
devi
atio
n
nied_c17.qxd 1/24/03 10:49 AM Page 328

Chapter 17 • Earnings Impostors 329
Cash Money
Balance sheets contain gold, but you have to know where to look. We found it
buried in the fourth layer from the top, after cash, marketable securities, and
accounts receivable—the inventory changes.
Is the company’s inventory up? Chances are its stock is going to fall.
Is inventory down? Likelier than not, that stock will rise.
Sounds pretty much like common sense. It’s an accounting twist as new
as the twenty-first century and as old as trade: If a company puts a high value
on a heap of inventory, earnings might be pumped up. But those microchips,
routers, and subassemblies that are valued at billions on the balance sheet
may have to be unloaded at a steep discount.
You can ignore it. But you can bet the market won’t—not when times are
tough and trust is low.
Anecdotes about companies that found their inventory building up before
precipitous declines in price are legion. For example, Nvidia Corp.’s inventory in
the year ending January 2002 increased to $214 million from its January 2001
level of $90.4 million. That’s a jump of 137 percent; sales rose only 86 percent.
Doubtless Nvidia was building up inventory in anticipation of much higher
sales in 2002. Its shares declined 89 percent in 2002 (through October 9).
Or look at Tellabs, which fell 74 percent in 2001. Its inventory at year-end
2000 had increased 131 percent, to $428 million from $186 million, from the
year-earlier level, while sales rose just 46 percent. In 2001, sales fell 35 percent.
Motorola provided an especially noteworthy example in 2000. Inventory
increased some 40 percent, to $5.2 billion from $3.7 billion, but sales only rose
14 percent, to $37.6 billion from $33.1 billion. Motorola stock’s 26 percent
Table 17.9 S&P 500 Sample Results
50 of 500
High-Tax PayersAverage performance −15.7Standard Deviation 24.9Count 25
Low-Tax PayersAverage −31.0Standard Deviation 24.6Count 25
nied_c17.qxd 1/24/03 10:49 AM Page 329

330 Practical Speculation
decline in 2001 seems somewhat muted, unless we note that in 2000, when
the market in its wisdom was perhaps already discounting this, the price
dropped 60 percent.
Companies that suffered sharp price declines in 2000 after reporting in-
ventory increases at the end of 1999 are particularly numerous. Start with
Amazon.com, where inventory jumped some 650 percent, to $221 million
from $30 million. Sales grew almost 170 percent, to $1.6 billion from $610
million, and there were probably good explanations for management’s deci-
sion to build up inventory. But the market was unforgiving, and Amazon.com
fell some 80 percent in 2000.
Table 17.10 summarizes the ending inventory versus sales change and
next year’s percentage price appreciation. It seems like plain common sense
that an inventory buildup relative to sales could be a sign of trouble. Most of
us who have been in business have been victimized by rosy estimates of the
value of inventory that can be sold only at drastically reduced prices, particu-
larly in industries where products are subject to rapid obsolescence.
Unfortunately, it’s not that simple. Many companies that report sharp in-
creases in inventory are merely responding to sharp increases in sales. Often,
they go on to show great performance in subsequent years. On the other side,
many companies that show sharp decreases in inventory in a year are respond-
ing to drastic declines in sales. Instead of being star companies with sound
earnings, they go on to dismal market performance.
As readers of our column and all other sober-minded investors know,
anecdotes prove nothing. The diversity of stocks is so great that a story can be
found to prove any generalization. To settle the issue, what’s needed is a sys-
tematic and scientific study from an investigator knowledgeable in account-
ing, statistics, and practical investment.
Fortunately, such a study has been completed by Jacob Thomas, Ernst &
Young professor of accounting and finance at New York’s Columbia Univer-
sity, and one of his former students, Huai Zhang, now a professor at the Uni-
versity of Illinois.
Table 17.10 Inventory Buildups, Stock Takedowns
Ending Inventory Inventory Sales Next Year’sCompany Year (in Millions) Change (%) Change (%) Stock Change (%)
Nvidia 2001 213.9 137 86 −84Tellabs 2000 428.3 131 46 −74Motorola 2000 5,242.0 41 14 −26Amazon.com 1999 220.6 650 169 −80
Source: Bloomberg L.P.
nied_c17.qxd 1/24/03 10:49 AM Page 330

Chapter 17 • Earnings Impostors 331
Empty Shelves, Rising Stock
In their paper, “Inventory Change and Future Returns,” Thomas and Zhang
use as their starting point the well-documented finding that a company’s stock
performance tends to suffer after a period in which accrued earnings exceed
cash earnings.1 Accrued earnings are those that are reported in the annual re-
port and the earnings statement, and they’re what the media report. The main
difference is that accrued earnings recognize revenues when a sale is legally
binding and match expenses against the revenues. Cash earnings recognize
sales and expenses in the period during which the money arrives and the ex-
penses are paid. Companies have been required since 1988 to reconcile the
difference between cash and accrued earnings on their statements of cash
flow, one of four required financial statements that every company must sub-
mit to auditors.
More and more investors and analysts are focusing on the cash flow state-
ment. Thomas, an immigrant from India, and Zhang, an immigrant from
China, have made an important contribution to financial analysis by systemat-
ically testing which items on the cash flow statement are most predictive of fu-
ture returns. After analyzing 39,315 firm years from 1970 to 1997, they
conclude: “We find that inventory changes represent the main component that
exhibits a consistent and substantial relation with future returns.”
Companies with the greatest reductions in inventory (scaled by assets)
show a greater price-plus-dividend return of 4 percentage points more than
the average for all companies. Companies with the greatest increase in inven-
tory, on the other hand, show a return 7 percentage points less than that of the
average company. The difference held in 27 of the 28 years of the study. The
usual statistical tests indicate this is a highly unusual event that could only be
explained by chance on substantially less than 1 in 1,000 occasions.
Amazingly, the returns in the next year for these chosen companies add
another 4 percent differential to the abnormal return.
Two other components of the balance sheet also have a large impact on
returns, although significantly less than does inventory: depreciation expense
(the higher the better), and change in accounts receivable (the less growth the
better). Both these items give an abnormal return differential of 4 percent for
the favorable companies versus the favorable ones.
Why do inventory changes matter so much? The professors offer three
possible explanations:
1. Demand shifts. High inventory could be a signal that demand is de-
clining and future profitability is in danger.
nied_c17.qxd 1/24/03 10:49 AM Page 331

332 Practical Speculation
2. Overproduction. For manufacturing firms, producing more than ini-
tially anticipated causes per-unit inventory costs to be lower this year,
which results in lower cost of goods sold and higher profitability.
Everything reverses in the following year when fewer units are pro-
duced to bring inventory levels back to normal.
3. Inventory misstatement. Firms may use inventories to manage earn-
ings. The cost of goods available for sale is determined by previous pe-
riod’s ending inventory and current period’s costs for producing and
purchasing inventory. At the end of the fiscal period, we have to assign
cost of goods available for sale to either cost of goods sold or the ending
balance of inventory. If you overstate the latter, cost of goods sold will
be understated and earnings will then be overstated. The following
year, inventory is written down and profits take a hit.
The professors conclude that earnings management is the likely suspect.
They do not, however, attribute the inventory effect entirely to the practice of
earnings management. “Consider the following scenario,” Thomas wrote in
an e-mail to us. “Cisco is running along on all eight cylinders, making routers
and such like. There is a sudden decline in demand, but they think they can
overcome it. Things get bad enough where they should reasonably be writing
down some of the unsold inventory, but they don’t because they’re a bit opti-
mistic. In the year after the inventory buildup, they finally admit things are
bad and take a write-down, and returns fall. Would you construe the reluc-
tance to take a write-down as earnings management? Some people would not
call that earnings management, and view it simply as reasonable optimism
about one’s prospects.”
Born in China, Zhang earned his bachelor’s degree from Beijing Univer-
sity and came to the United States for his doctorate. “I entered Columbia’s
PhD accounting program with a blind trust in accounting numbers,” Zhang
told us. “Four years later, when I got out, I had developed a healthy skepticism.
The flexibility offered by GAAP allows a company’s management to manipu-
late the company’s earnings while the investor community’s steep penalty for
not meeting analysts’ forecasts sends the management off in that direction.
My paper with Jake shows results consistent with investors being misled by
earnings management through inventory. It’s just another piece of evidence
for my view of the world: Accounting can be dirty.”
Much gold is hidden in a company’s statements of cash flow. In practice,
however, the investor is confronted by items beyond the ken of all but the
most sophisticated accountants—and even they acknowledge difficulty.
nied_c17.qxd 1/24/03 10:49 AM Page 332

Chapter 17 • Earnings Impostors 333
Thomas, acknowledged as being among the giants in the accounting field,
wrote: “Combing through the statements of cash flows and footnotes is
painful but rewarding. There is no substitute for doing it the old-fashioned
way. Unfortunately, the disclosures are often so cryptic and there’s so much
intentional distortion that most of us remain confused even after reading the
damn thing over and over.”
Compustat Confusion
The case for relying on cash earning rather than accrued earnings, with partic-
ular emphasis on inventory, would seem to be sound as a nut. But wait: the
Thomas-Zhang study was based on companies taken from Standard and
Poor’s Compustat data files. While Compustat’s files are widely used, we have
grave concerns about them because of their retrospective nature, and what we
consider their survivor bias.
MIT professor Andrew Lo, of whom the cognoscenti in this field always
speak in superlatives, pointed out that Compustat “backward-revises” its data,
posing insidious problems for researchers. With Compustat, “today’s values for
1997s IBM current assets need not be the same as last month’s values for
1997s IBM current assets,” Lo wrote us. “Compustat’s backfilling is a problem
every single month, including this month. Do the following analysis (I’ve done
it): this month, take all observations in the Compustat files for October 2001
and save it; then next month do the exact same thing for the exact same date;
now run a variable-by-variable comparison of the two supposedly identical
files—you’ll see at least 200 discrepancies, if not more. These issues don’t even
touch on the quality of the data, spottiness of the coverage, and timeliness of
the updates.”
Another potential problem is that Thomas and Zhang examined many
different balance sheet items and methods of computing them before settling
on the specific ones in the paper. This approach may yield statistical bugs re-
lated to the correlation of many balance sheet items with each other as well as
to the serial correlation in these items between consecutive years.
Thomas agreed that backfilling of Compustat data is a potential concern,
but said it hasn’t been a problem in the last decade. “As far as I know, the last
major backfill was done in the 1970s.” He added: “To me, the two big ques-
tions are (a) Why did the market not see this mispricing until it becomes very
evident in the next quarters’ reported earnings? And (b) Does the mispricing
occur even now?”
nied_c17.qxd 1/24/03 10:49 AM Page 333
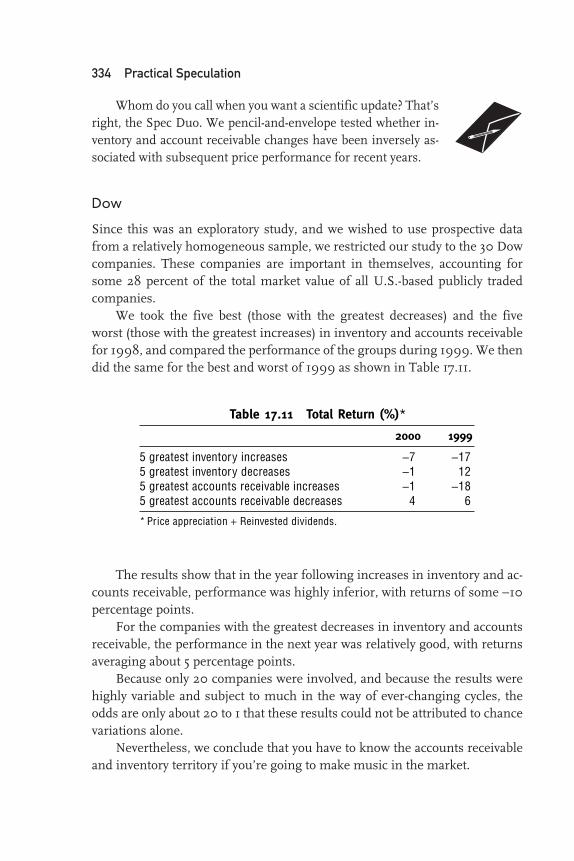
334 Practical Speculation
Whom do you call when you want a scientific update? That’s
right, the Spec Duo. We pencil-and-envelope tested whether in-
ventory and account receivable changes have been inversely as-
sociated with subsequent price performance for recent years.
Dow
Since this was an exploratory study, and we wished to use prospective data
from a relatively homogeneous sample, we restricted our study to the 30 Dow
companies. These companies are important in themselves, accounting for
some 28 percent of the total market value of all U.S.-based publicly traded
companies.
We took the five best (those with the greatest decreases) and the five
worst (those with the greatest increases) in inventory and accounts receivable
for 1998, and compared the performance of the groups during 1999. We then
did the same for the best and worst of 1999 as shown in Table 17.11.
The results show that in the year following increases in inventory and ac-
counts receivable, performance was highly inferior, with returns of some −10
percentage points.
For the companies with the greatest decreases in inventory and accounts
receivable, the performance in the next year was relatively good, with returns
averaging about 5 percentage points.
Because only 20 companies were involved, and because the results were
highly variable and subject to much in the way of ever-changing cycles, the
odds are only about 20 to 1 that these results could not be attributed to chance
variations alone.
Nevertheless, we conclude that you have to know the accounts receivable
and inventory territory if you’re going to make music in the market.
Table 17.11 Total Return (%)*
2000 1999
5 greatest inventory increases −7 −175 greatest inventory decreases −1 125 greatest accounts receivable increases −1 −185 greatest accounts receivable decreases 4 6
* Price appreciation + Reinvested dividends.
nied_c17.qxd 1/24/03 10:49 AM Page 334
Chapter 17 • Earnings Impostors 335
A Combination Tell
Rewards have never been greater for those able to discern truly su-
perior investment opportunities. Yet favorite buy signals such as
buybacks and insider buying too often turn out to be misleading in
individual cases. In the words of our favorite science fiction novel,
Invasion of the Body Snatchers, more than one company that seemed to fit our
criteria “only looked, talked, and acted” like one that really thought its stock
was a good value.
We have designed a new system to weed out imposters. We started by
considering imposters in life and nature. The story of 1890s adventurer
Louis de Rougement proved particularly inspiring. As told by Sarah Burton
in her entertaining book, Impostors: Six Kinds of Liar—True Tales of Decep-tion, de Rougement claimed to have survived 30 years in the vast Australian
outback by convincing the cannibals that he possessed supernatural powers.
Eventually, he found his way back to London and sold his tale to Wide Worldmagazine.
The very first installment of the story created a furor. De Rougement’s ac-
count of riding sea turtles was widely ridiculed. “I have caught and handled
some thousands of turtles,” wrote an Australian, “and I never yet saw one
which when afloat and when touched anywhere on its body did not sink al-
most vertically.” An admiral weighed in on de Rougement’s side: “I have con-
siderable experience of turtle-catching, and know of a midshipman who got
on a turtle and enjoyed a 10 minutes’ ride before he brought the animal to a
standstill.” In 1906, the self-proclaimed cannibal chief rode a sea turtle at the
London Hippodrome, disproving the naysayers. By then, however, investiga-
tive reporters had unmasked de Rougement as an imaginative former valet
named Louis Grin.
On reading de Rougement’s story, we realized we needed more than a
mere sea turtle test to avoid being fooled. This point was driven home when
we read about the outrageous high-stakes frauds perpetrated by innocent-
seeming plants.
European orchids not only look like bees, they smell like sexually recep-
tive female bees—all to seduce male bees into carrying pollen. A bee, after ex-
citedly crawling all over an alluring flower and attempting union, quickly
learns to distrust the fraudulent scent—but 100 other types of orchids prac-
tice similar shams.
“After visiting four or five different plants, he has learned his lesson—the
whole lot that smell in this general way are useless and he visits them no
nied_c17.qxd 1/24/03 10:49 AM Page 335

336 Practical Speculation
more,” writes David Attenborough, in The Private Life of Plants. “But by that
time, he is likely to have done what the orchids required of him.”
So it goes with investors. They are attracted by companies that buy back
their stock, or have insider buying, only to be surprised by disclosures of se-
cret debts, vaporous earnings, or magic-trick accounting for acquisitions.
After a few encounters with such impostors, investors may be
ready to give up on stocks entirely. But by then, they have made
their contributions to the market.
Some plants practice deadlier deceptions, pretending to be food for a pred-
ator and then making the predator their prey. The pitcher plants of Southeast
Asia are shaped like beakers, flagons, decanters, and champagne flutes. Using
copious amounts of nectar, they lure insects inside—and then dissolve their
trapped victims in digestive acid.
To avoid being fooled, seduced, or eaten alive by our stock selections, we
decided to require multiple signals before buying. Our evolutionary grounds
for doing so are that no life form (and hopefully, no company) would expend
the energy necessary to give off multiple false signals.
Three-Signal Monte
We settled on three signals that we feel have been particularly efficacious:
1. Buyback announcement.
2. Big decrease in inventory.
3. Big decrease in accounts receivable.
As reported earlier, companies that announced buybacks from year-end
2000 through October 3, 2002, outperformed the S&P 500 by some 6 per-
centage points. The five Dow Jones Industrial Average companies in 1998
and 1999 with the greatest inventory decreases outperformed those with
the greatest increases, with the difference averaging out to some 10 percent-
age points.
Before choosing these particular signals, we conducted many tests that
could be classified as negative studies. The buyback companies perform so
well that additional criteria are not overly helpful. For example, we found that
the percentage of shares bought back as well as insider buying within this
group did not add significantly to the returns during 2002.
Our exploratory work showed a slight edge for the 93 companies that an-
nounced buybacks in the first three quarters of 2002 and also reported the
greatest decreases in inventory and accounts receivable. Table 17.12 illustrates
this signal.
nied_c17.qxd 1/24/03 10:49 AM Page 336

Chapter 17 • Earnings Impostors 337
It might be useful to consider the returns from buying baskets of com-
panies showing each of these three signals in the future. But it will require
much study before the results will be of practical or statistical significance.
When we presented our findings in a series of columns on fundamental
analysis for CNBC Money, some readers remarked on the irony. Vic, after all,
has long traded on price interactions, not financial statements or dividend
payouts. One reader wrote: “The Speculator talking about dividends as a valu-
able investment criterion! Now I know I’m in Kansas.”
There’s a certain wisdom in that observation. By the time
Vic and his ilk are ready to study value, chances are that tech
will be back. It never hurts to know your way around a balancesheet, though. If investors agree about anything nowadays, it’s that we need
transparent, nondistorted financial statements to restore trust in Corporate
America. You would think that all executives of major companies would lean
over backward so as not to be perceived as managing earnings, for the good of
the business world as well as their own stockholders.
The time when a company could expect applause for pulling a rabbit out
of the hat to meet earnings forecasts—say, by selling one of the businesses it
had acquired over the years—would seem to be over. But apparently, some
companies don’t feel this way.
General Electric, for example, stated on Wednesday, September 25, 2002,
that it expected to meet third-quarter earnings projections. Wonderful, the mar-
ket said. General Electric shares rose 4.3 percent. The next day, it came out at a
news conference that the forecast would be met by selling a business unit,
Global eXchange Services. Disappointed investors sent General Electric down
2.3 percent. By Friday, when they figured out that General Electric had loaned
the purchase money to the buyer and had even taken back a 10 percent interest;
they were more than ready to laugh General Electric out of town. The 9 percent
loss over those two sessions took some $25 billion off the market capitalization
of the world’s most valuable company.
General Electric may have a great reason for the sale, but as the company
has refused to grant us an interview and advised us to refrain from contacting
Table 17.12 Performance of Buyback Companies Reporting LargeDecreases in Inventory and Accounts Receivable
Percentage Points over Buyback Companies S&P 500’s YTD Return (%)
10 largest inventory decreases 3 percentage points10 largest accounts receivable increases 1 percentage point
nied_c17.qxd 1/24/03 10:49 AM Page 337

338 Practical Speculation
it again, we can’t report any explanation at all. What’s clear is that General
Electric’s decision cost its shareholders dearly at a time when the need to be
beyond reproach is more than evident.
Such a reaction wasn’t exactly unprecedented. In February 2002, IBM
took a 5 percent hit after the New York Times reported that the company used
the sale of a unit to lower fourth-quarter operating expenses, instead of report-
ing the sale as a one-time gain. The demise of Enron, WorldCom, and Arthur
Andersen after the disclosure of earnings misstatements and cover-ups has
made investors skeptical even of squeaky-clean companies with cash from op-
erations soaring to the moon and no nonrecurring items of any kind.
Yet General Electric’s skill in managing earnings to meet analyst expecta-
tions has been known for years—and until recently, renowned. Carol Loomis,
writing in Fortune in August 1999, observed that after the Wall Street Journalpublished a front-page story in 1994 detailing the many ways that Welch and
his team “smoothed” General Electric’s net income, AIG, Champion Interna-
tional, and Cigna called to say, “Well, this is what companies do. Why is this a
front-page story?” (We suspect that many other companies read the article to
see how it was done.)
SEC chief Arthur Levitt declared war on managed earnings back in Sep-
tember 1998. In a dinner speech at New York University, the audience put
down their forks and started taking notes when Levitt said many executives
and auditors were playing “a game of nods and winks” to meet or beat earn-
ings projections to pump up market capitalization and increase the value of
management’s stock options. Levitt asked Corporate America and Wall Street
to stop using accounting gimmicks: no more big write-offs for restructuring
charges, future operating expenses, or “in-process research” to make future
earnings look better, no more stashing profits in “cookie jar reserves” to bring
out later, no more booking sales before delivery takes place, no more quib-
bling over how big a lie has to be before it’s “material” under Generally Ac-
cepted Accounting Principles.
The “better-than-expected earnings” game has been a long-time favorite
for corporations and their Wall Street cheering section. Come recession, come
boom, come 100-year interest-rate events, come terrorist attack, some 60 per-
cent of the S&P 500 has consistently “beat” analysts’ forecasts. Here is the dis-
tribution percentage of positive surprises for S&P 500 companies from 2000
to 2002:
Q2 2002 60.1 percent
Q1 2002 62.1 percent
Q4 2001 55.3 percent
nied_c17.qxd 1/24/03 10:49 AM Page 338

Chapter 17 • Earnings Impostors 339
Q3 2001 51.2 percent (even though country was shut down
for a fortnight)
Q2 2001 55.2 percent
Q1 2001 54.4 percent
Q4 2000 51.0 percent
Q3 2000 58.2 percent
Q2 2000 63.7 percent
Q1 2000 70.7 percent
The question is not whether they nudge and wink, but how
high they’ll take you before they drop the ball.
We wonder how many other companies have a choice now of deciding
whether to meet earnings expectations by selling a company or asset they ac-
quired long ago. Let us hope they learn from General Electric’s experience.
Otherwise, there may come a time when their own credibility is on the line.
If their response meets the new standards of evaluation, success is assured.
If not, investors will be disinclined to accept at face value any official state-
ments at all.
Similar turning points can be observed in politics. If the gap between
word and fact becomes so noticeable that even supporters cannot counte-
nance it, an office holder will soon find his power on the downtrend. In
sports, the scandal at the Winter Olympics in Salt Lake City indirectly en-
abled Sara Hughes to finally gain her well-deserved recognition. According
to sportswriter Rick Reilly, Sara Hughes had been the best in the United
States for some time. Only after the public pantsing of the judges in the
pairs skating competition were the figure skating judges able to do the right
thing and give the nod to Sara.
Unfortunately, merely vowing to change won’t work when credibility has
been damaged too badly. Between mid-July and early October 2002, more
than 50 companies pledged to treat options as an expense, responding to calls
for greater transparency in reporting operating costs. We compared the perfor-
mance of these “transparent” companies with that of the S&P 500 and found
that they actually lagged the index by 3 percentage points. The 52 companies
that took the pledge lost −9.6 percent, on average, versus −6.4 percent for the
S&P 500.
Vic’s father, Artie Niederhoffer, used to say that if a choice came up be-
tween giving people in trouble cash or advice, to always give the cash. Artie’s
wisdom carries the day here. What counts in troubled times is cash. We hope
that the indicators we wrote about in this chapter will prove of service.
nied_c17.qxd 1/24/03 10:49 AM Page 339

nied_c17.qxd 1/24/03 10:49 AM Page 340

341
18 F I N A L E
[I]t appeared to me that I should do welcome service to
all who have to rough it—whether explorers, emigrants, mis-
sionaries or soldiers—by collecting the scattered experiences
of many such persons in various circumstances, collating
them, examining into their principles, and deducing from
them what might fairly be called an “Art of Travel.”
—Francis Galton, The Art of Travel 1
We get asked four questions regularly:
1. Aren’t there any technical indicators that you use in your work?
2. Where do you find all those down-home philosophers and scientists,
who from their job descriptions seem like average Joes but who turn
out to have wild but useful ideas about the market?
3. How can you say such awful things about Alan Greenspan? Are you so
bullish that you didn’t realize there was a stock market bubble?
nied_c18.qxd 1/24/03 10:48 AM Page 341

342 Practical Speculation
4. What book do you recommend for me to continue my education after
reading this one?
We will answer each of these questions.
Technical Indicators
As mentioned in Chapter 3, there are so many different indicators that one al-
ways seems to work well in any particular time period. Thus, when we answer
this question by observing that almost all technical indicators are untested,
and that most are amorphous and unsusceptible of testing, and the results of
all of them are completely consistent with a random walk, the person who has
found the indicator to be successful in a specific period invariably responds
with disbelief.
To prevent this, we have taken another tack. Without boasting unduly,
Vic has been programming for more than 40 years and is quite capable of
testing any indicators or method. During many of those years, he was a well-
respected and potent force in the industry, and technical analysts often vis-
ited to get him to finance or test their systems. This was particularly true
when he was chief bottle washer and evaluator of scientific systems for
Soros, because if the system was a hit, there was the potential for billions to
be thrown at it.
Vic has been recording hourly prices on 15 to 20 markets on a real-time
basis by hand for the past 40 years. One of his record books, from 1965, ap-
peared in a Japanese television special on him. In Japan, defeated ronins make
pilgrimages to Mt. Fuji for guidance and sustenance; in this case, he was
shown seeking guidance from his ancient book of hourly price records.
The three universities he was fortunate enough to attend—Harvard, the
University of Chicago, and the University of California, Berkeley—were associ-
ated with a large part of the seminal research into the behavior of stock prices.
The University of Chicago, where he received his PhD, developed the database
used by almost all studies of stock market behavior, the Center for Research in
Securities Prices. Of the 12 Nobel Prizes that have been given for economics, 10
of them had some association with the University of Chicago, including the
Black-Scholes options pricing model, the Miller-Modigliani cost of capital and
dividend contributions, Aliber’s work on foreign exchange, and Lucas’ rational
expectations theory. The theory of portfolio insurance that figured so promi-
nently in the 1987 crash was developed at the University of California while he
was attending that institution.
nied_c18.qxd 1/24/03 10:48 AM Page 342

Chapter 18 • Finale 343
In addition to that, the one thing that he has been very good at doing has
been attracting smart people to his organization. Almost all of them are highly
quantitative. Richard Zeckhauser, who now is considered a leader in behavioral
finance, was Vic’s partner for 20 years. In those days, he was always willing to
apply his expertise developed from being number one in the mathematical ac-
tuaries exam in high school to the solution and scientific analysis of technical
studies. Between Vic and his highly intelligent current and former partners and
colleagues, we have the ability to implement and utilize on a practical basis any
techniques of technical analysis that may have merit.
Therefore, the fact that we are not using such a particular system would
mean that it has been seriously multiple-comparisoned here and found want-
ing, Thus, we are the last people in the world who should be asked to opine on
one of the 573 indicators.
After all of this, the conversation invariably comes to an abrupt end as the
questioner goes away saying, “ Niederhoffer, if it’s not invented there,
he’s too vain to even consider it.”
Where Do We Find All Our Experts?
Much of the value in our columns, and in this book, has come from the net we
cast to catch all the specialized niches of knowledge, technical expertise, and
insights in various fields that our readers kindly communicate to us from
around the world.
When we started writing a column on the stock market together in Janu-
ary 2000, we realized that no duo, however well informed, could know every-
thing useful about the market. The great lesson of the twentieth century is
that central economic planning creates poverty, but the combined tastes, pref-
erences, know-how, and insights of millions of people somehow direct goods
from all over the world to store shelves and tables in a beautiful celebration of
prosperity and well-being.
Because we were writing for the Internet, we decided to make full use of
our medium. Hayek’s great insight was that free markets function best be-
cause they draw on the knowledge, wisdom, and skills of the many. We put
the idea into practice by asking readers for insights, and our hopes were real-
ized beyond our wildest dreams.
It frequently happens that an expert in one field or another writes in with
a constructive suggestion as to how we can improve and pass along sharp
and valuable information to our readers. We awarded canes as prizes for
what struck us as the most outstanding contributions, in a nod to one of our
nied_c18.qxd 1/24/03 10:48 AM Page 343
344 Practical Speculation
favorite passages about the market, from Twenty-Eight Years in Wall Street,written by Henry Clews in 1887:
But few gain sufficient experience in Wall Street to command success until they
reach that period of life in which they have one foot in the grave. When this time
comes, these old veterans of the Street usually spend long intervals of repose at
their comfortable homes, and in times of panic, which recur sometimes oftener
than once a year, these old fellows will be seen in Wall Street, hobbling down on
their canes to their brokers’ offices.
Then they always buy good stocks to the extent of their bank balances, which
they have been permitted to accumulate for just such an emergency. The panic
usually rages until enough of these cash purchases of stock are made to afford a
big “rake in.” When the panic has spent its force, these old fellows, who have been
resting judiciously on their oars in expectation of the inevitable event, which usu-
ally returns with the regularity of the seasons, quickly realize, deposit their profits
with their bankers, or the overplus thereof, after purchasing more real estate that
is on the up grade, for permanent investment, and retire for another season to the
quietude of their splendid homes and the bosoms of their happy families.2
The first cane went to Brett Steenbarger, a State University of New York
psychologist who would become a dear, valued friend. On February 25, 2000,
just two weeks before the Nasdaq peaked at 5048, Dr. Brett wrote:
First, the kiss: You and Vic write one of the most lucid and thought-provoking
columns anywhere. Your musical analogies to the markets are dead-on.
Now the tell (favorite indicator):
On a speculative note, I hypothesize that there is a positive and significant corre-
lation between the beats-per-minute of popular music and price changes in the
stock market. From post-Depression blues, forties crooners, fifties/sixties rock ‘n’
roll, late sixties/early seventies psychedelia, late seventies disco, eighties New
Wave, and now the electronic dance raves (150 bpm de rigeuer), we’ve seen a
steady ramping up of acoustic adrenalin. And what are we to make of the recent
resurrection of the twenties dance sound?
In a subsequent e-mail on March 2, he added:
The market’s music is reaching a heightened tempo, at least on the Nasdaq. But
even in the clubs of Ibiza, when the pace has become frenetic at 4 a.m., they have
to shift the pace and go into “melodic trance” mode with Robert Miles. It’s that
old A-B-A structure, I guess. . . . We’ll have to see if the dancers start stumbling,
spent of their Ecstasy.
We messaged Dr. Brett to tell him we were sending him a cane, and the
next day received the following note:
nied_c18.qxd 1/24/03 10:48 AM Page 344

Chapter 18 • Finale 345
Well, it was quite a day. First your most generous e-mails re: the tells and then my
return home. I opened the garage and there, greeting me in bright colors, was a
large sign hand-drawn by my two little ones. It read: “Congratulations Cane Win-
ner!” That’s enough to melt even the most wizened trader’s heart.
We told the story in our column, noting the names of Dr. Brett’s kids.
The next e-mail melted our own hearts:
“I wish you could have been there,” wrote Dr. Brett. “I took Macrae to the com-
puter and showed him your article. When he got to the part with his name, his
eyes grew wide. ‘You mean anyone in the world who goes to this Web site can see
my name?’ he asked.
“ ‘That’s right,’ I responded.
“He turned from the computer and stared into space, his eyes still quite
wide. In a tone of absolute wonderment, he whispered, ‘I’m famous!’
“It was a priceless moment.”
One reader, Don Staricka, sent us excerpts from his forthcoming Devil’sStock Market Dictionary, a masterpiece of humor surpassing the work of Am-
brose Bierce.
* * *
Balanced Portfolio: A strategy for breaking even over the course of one’s
investment career.
Buying Opportunity: Any occasion where an equity suddenly and unex-
pectedly loses value.
Contrarian: One who bets against the winners.
Correction: A distasteful remedy for unwarranted bullishness. When the
prices of equities within a sector (or the market as a whole) move
downward simultaneously the market is said to have “corrected.”
This implies that the higher prices were “incorrect.” Contrast with
Rally.Dividend: A booby prize.
Equity: Ownership in a company through the purchase of stock. As a
shareholder one participates in the success of a company without the
obligation to attend departmental meetings, company picnics or sen-
sitivity training seminars. And there’s no job interview so you don’t
have to worry about concealing your tongue stud or borrowing a suit.
Franchise: Information culled from a company’s marketing literature
that investors interpret as evidence of competitive advantage.
Goodwill: The difference between what an equity costs and what it is ac-
tually worth.
Interest Rates: An all-purpose explanation for whatever happens.
nied_c18.qxd 1/24/03 10:48 AM Page 345

346 Practical Speculation
IPO: The lowest price at which one will be able to purchase shares in a
new company until lockup expiration or until the company’s true po-
tential is recognized.
Kondratief: According to Kondratief Wave Theory economic cycles last-
ing 50 to 60 years trump all other factors and render meaningless
our futile efforts to resist the inevitable booms and busts. This theory
explains why only now, at the beginning of the twenty-first century,
have we finally started to pull out of a catastrophic depression.
Linux: A late twentieth-century collectivist religion practiced over the In-
ternet.
Lockup Expiration: The point at which the full complement of shares
from a recent public offering hits the market. See Supply and De-mand.
Momentum Play: An investment decision informed by the theory that
what goes up must go up.
Penny Stocks: Extremely inexpensive equities that are worth substantially
less than what they cost.
Phrenology: A science that purports to identify behavioral characteristics
based upon a mapping of the lumps and depressions in a person’s
skull. Now discredited. See Technical Analysis.Portfolio: The itemization of an investor’s current blunders.
Rally: A distasteful remedy for unwarranted bearishness. When the
prices of equities within a sector (or the market as a whole) move up-
ward simultaneously, the market is said to have “rallied.” This im-
plies that the lower prices that resulted from the earlier “correction”
were “incorrect.” Contrast with Correction.Stop Loss: The point immediately below which an equity begins a sus-
tained rally.
Supply and Demand: The one true explanation for the price of any equity.
Sympathy: A manifestation of the grieving process. If an equity loses
value because of mismanagement or the announcement of an SEC
investigation, other equities in the same sector may lose value “in
sympathy.” See Buying Opportunity.Technical Analysis: A form of divination practiced by investors to predict
the behavior of the market. See Phrenology.Turnaround Play: An investment decision informed by the theory that
what goes down must go up.
Value Play: An investment decision informed by the theory that what has
been down for a long enough period of time must eventually go up.
nied_c18.qxd 1/24/03 10:48 AM Page 346

Chapter 18 • Finale 347
We began circulating the e-mails of Dr. Brett, Staricka, and other experts
who wrote in. A small feedback group formed. One of the earliest to enter the
fray was Mark M. McNabb, a blues-and-barbecue-loving finance professor at
Virginia Tech University. It was Dr. McNabb who articulated the approach
that evolved into our mantra:
The imperative to specialize in Western society has always been an effort to im-
prove one’s station in life. Walt Rostow, historian and economist, attributes much
of the success in capitalism to the early rise of productivity in agriculture, which
freed many to carry out commerce and devote themselves to other areas of knowl-
edge, especially scientific and technical knowledge.
Today, we find even the most dominant firms, such as Intel, are motivated to
acquire the knowledge of others (despite the depth of talent within their firms) in
order to progress and maintain their position in markets that are changing at a
pace unlike any time before in our history. In finance and business, specialization
requires the talents of many as new problems often materialize in unexpected
areas; a cursory look at the resumes of employees at any leading firm or invest-
ment bank, no matter how narrowly focused, will reveal a wealth of talent, knowl-
edge and abilities.
Markets today often present the investor with “information saturation” be-
yond one’s own ability to analyze. What is needed to parse through the mass of
conflicting bits is the views and experiences of many, to sort and order it into a ra-
tional framework. The challenge is that the framework is never static. It’s more
like a sandcastle washed out to sea by a torrent of new views and events every day
and rebuilt to a new form by those employing their best vision. By combining the
disparate talents of many, a consensus arises that surpasses the scope of a single
view. Through our assimilating and borrowing from past and present, rather than
rejecting the unknown on narrow ideology and training, the truth reveals itself.
As our group of corresponding speculators grew larger, a technically
savvy reader, James Cornelius Goldcamp, set up a list so that all the readers
could see each other’s messages to us and from us. The resulting correspon-
dence gave birth to numerous friendships and business relationships. We
held a SpecList party one summer so that we could meet one another face to
face. The event proved so enjoyable and fruitful that the Spec Party has be-
come a summer tradition.
We have benefited immensely from the exchange. Most of our columns
for CNBC Money contain insights, some attributed and some anonymous,
from SpecList members. Some members have written guest columns for us.
We were so glad to see Dr. Brett land a Wiley book deal and a CNBC Money
column of his own that we were able to overcome a slight feeling of having
been upstaged.
nied_c18.qxd 1/24/03 10:48 AM Page 347

348 Practical Speculation
It was Dr. Brett, in fact, who in 2002 penned the most eloquent explana-
tion of what the SpecList is all about:
The patron saint of the Speculation List is not Victor Niederhoffer, although he is
near and dear to many of us. The patron saint is Francis Galton. Galton is the fa-
ther of modern statistics and an exemplar of empiricism. He collected data on
thousands of individuals to ascertain the genetic determinants of intellectual
functioning. He did not begin from revealed truths or first principles, as would
our modern-day egalitarians. He collected data and sought to explain the patterns
he observed within the data.
The heart and soul of the SpecList is the empirical temperament. It is a desire
to discover and know. It is a celebration of the human capacity to apprehend reality
through volitional efforts. In seeking to master the markets, we participate in the
very essence of the heroic quest: the winning of a boon while struggling against
mighty forces. Those forces are many: the complexity of the markets, the perverse
nature of our own emotions, and the savvy competition. Arrayed against those are
only the human mind and its capacity to transform data into information.
By 2002, the SpecList had grown to 200 members living all over the
world, from South Africa to Slovakia to Silicon Valley. It has been through
various permutations and bifurcations. One offshoot became an informal
School for Speculators, a unique forum for quantitative work on the market.
More about Ever-Changing Cycles
One of the great purposes of the SpecList has been to keep us
abreast of the market’s ever-changing cycles. As readers of Vic’s
first book may recall, the profound principle of ever-changing
cycles was put forward by Bacon in Secrets of Professional Turf Betting, now un-
fortunately out of print. We quoted from this 1956 classic at the start of our
book, but cannot refrain from doing so again:
In actual racing, the percentage of winners does not remain constant as the pub-
lic’s play beats down the prices of horses picked by any set scheme.
Some well-to-do horsemen who sent their horses out to do their best for
probable betting prices of 3-to-1 “cooled off” as the prices sank below 5-to-2. In-
stead of trying their hardest to win, they sent the horses out to win, if they could
win easily. But the boys were told not to punish the animals, told to pull them
back out of the money in the stretch if they saw an easy winning was not possible.
The horsemen knew that this pulling back out of the money would make a
bad race show as the last outing in the past performance charts, thus putting the
public off the horse for next time.
nied_c18.qxd 1/24/03 10:48 AM Page 348
Chapter 18 • Finale 349
We thought that nobody could improve on Bacon until a reader, Martin
Knight, reformulated the principle of ever-changing cycles as a variant of
Newton’s law of cooling. Newton observed that the change in temperature of
an object is proportional to the difference between its temperature and the
surrounding air. Knight pointed out that market cycles obey Newton’s law of
cooling: the greater the regularity, the greater the difference between actual
and random results, the more flow of public money there will be to capture it.
That flow will bring the regularity back to randomness, or equilibrium, over
time just as temperature will tend to level out in a room. But new heat
sources will turn up to create new flows. The beautiful thing about Knight’s
reformulation is that it provides a quantitative estimate of the rate at which
cycles will change.
Knight, an Englishman living in California, is a humble 38-year-old master
of statistics who became interested in applying behavioral finance theory to his
own investments. He achieved a 77 percent return in 2001 and 33 percent in
2000, although he says he feels comfortable with returns less than that.
We have come across two other geniuses who discovered applications of
the principle of ever-changing cycles to markets. The first wrote the Economist’send-of-year forecast in 1986. The anonymous author treats the principle as a
variant of a game called “Cheat the Prophet.” In this game, which repeats every
decade, everybody believes that some easily expandable things (say, to name an
updated example, Web page views or energy derivatives trading) are going to be
immensely profitable. But then, in the next decade, a small movement in prices
and the competitive environment caused by these fixed beliefs sends the things
that are supposed to be eternally profitable into unsalable, abysmal deficit.
“Thus, the areas that are supposed to be immutably set on some particular
course go on to precisely the opposite one.” The Economist’s writer calls this
principle “the law of opposites,” and presciently states that knowing about this
could make readers quite rich, provided others don’t believe it.3
A few years later, Julian Simon discovered this principle independently.
His discovery arose from his attempt to find out why real commodities prices
were constantly decreasing and why predictions of commodity shortages are
always wrong. He likened the situation to looking at a tub of water and mark-
ing the water level, and then observing people putting water from the tub into
buckets and taking it away. But when the tub is examined again, the level is
higher than it was at the start. He attributes the constantly increasing water to
discoveries of improved methods of production of goods that are in shortage
and the development of substitutes. “More people and increased income
cause resources to become more scarce in the short run. Heightened scarcity
causes prices to rise. The higher prices present opportunity and prompt
nied_c18.qxd 1/24/03 10:48 AM Page 349

350 Practical Speculation
investors to search for solutions. These solutions eventually lead to prices
dropping lower than before the scarcity occurred.”4
On July 13, 2002, we received a brilliant post from the indefatigable Dr.
Brett that so eloquently summarizes the evolution of his and our own thinking
on ever-changing cycles that we reprint it in full.
Revisiting Complexity in Trading Systems
It seems to me there are three basic positions one could take regarding the stock
and equity index markets:
1. They are random/completely unpredictable—This is the stance of the Effi-
cient Market Hypothesis and leads to the conclusion that efforts to time the mar-
kets are a waste of time and that placing money in a well-diversified index of
companies over the long haul is the best way of participating in the markets’ long-
term positive risk-adjusted returns.
2. They are predictable—This is the stance of most technical analysts and de-
velopers of mechanical trading systems, who believe they can exploit recurring
patterns in the market for profit. These patterns are held to be intrinsic to the
markets, reflecting fundamental qualities of human nature (e.g., greed, fear) or
regularities in nature (e.g., Fibonacci sequences).
3. They vary in their degree of predictability—This is the stance of those who
model the markets and adjust their models to changing cycles. Predictability is it-
self viewed as a variable, with markets changing in the degree to which they can
be predicted and in the elements that comprise valid predictions.
For traders subscribing to Position #3, any trading system must exist at a min-
imum of two conceptual levels. The first order trading system consists of a set of
predictors and a hypothesized relationship between those predictors and market
outcomes. The second order system consists of a set of conditions for modifying
the parameters of the first system as cycles change.
Stated more simply, a trader who ascribes to the notion of changing cycles
needs at minimum: (a) a model to trade and (b) a process for remodeling to keep
abreast of shifts in the distribution of price changes over time.
It is, of course, possible to conceptualize a third-order trading system that
consists of meta-rules for shifting remodeling processes in response to market
conditions.
For example, a first-order technical trading model might buy the market
when the 12 period RSI moves from below 30 to above 30 and sell when the RSI
moves from above 70 to below 70. A second-order trading system would consist of
rules for using 21 versus 12 versus 8 period RSI readings for the original trading
system, perhaps as a function of market volatility and trendiness. A third-order
trading system might consist of rules for categorizing markets based upon volatil-
ity or trendiness and assigning unique remodeling rules for each category (i.e., se-
lect from 21 versus 12 versus 8 period RSI readings for a nontrending market of
nied_c18.qxd 1/24/03 10:48 AM Page 350

Chapter 18 • Finale 351
high, medium, or low volatility; shift from 30–70 trigger points to 20–80 and
10–90 crossover points for trending markets of low, medium, or high volatility).
Through the layering of conceptual levels and complexity (as Henry Carstens
has observed), the trading system gains adaptive potential. Indeed, the trader who
adheres to position #3 cannot follow a single trading system, as changing cycles
force the creation of a branching tree of trading approaches.
In spite of this, most discussions of trading systems focus on the first level of
complexity (entries/exits/stops) without consideration of how these are modified
in the face of shifting market conditions. To the extent that this second level of
complexity is missing, a trader can be expected to do well under one set of market
conditions and dismally in others—which is what we’re seeing with many traders
who made money in the late 1990s and now are having a difficult time.
A straightforward application of evolutionary thinking suggests that the
trader who develops more trading systems across levels of complexity stands a
greater chance of achieving adaptive outcomes in the markets. Dean Keith Simon-
ton makes this point in his excellent book Genius, Creativity, and Leadership. Citing
Donald Campbell, he writes:
[T]he course of cultural evolution is analogous to that of biological evolution.
The ‘cultural fitness’ of an individual creator is dependent upon his or her
ability to generate big ideas, each representing a certain permutation of
smaller ideas. The more permutations that are generated, the higher the
odds that a particular permutation will survive the winnowing process im-
posed by posterity. A less prolific creator will simply have a lower chance of
leaving intellectual progeny that will endure this selection process.
This model clearly predicts that quality is a probabilistic consequence of
quantity. . . .5
The idea that there are types of markets and trading systems best suited for
particular market types allows for a higher number of permutations than the idea
that a single set of parameters can be traded across all markets. Jean Piaget held
that the development of complexity was the hallmark of the maturing mind. It
may also be the hallmark of the maturing trader.
Here’s a July 26, 2002, post from a veteran Florida trader, James Lackey:
My father was a Boilermaker. He was a welder. As a kid I was taught not to watch
the welders arc. It will blind you.
When using a torch you can heat up metal to shape it. Or you can turn up the
heat and cut metal. I find the same with stock prices.
As the velocity of movement in a stock price increases, it cuts through prices.
A slow burn, to add heat a little at a time, just bends prices.
I have always been a tape reader. I watch the markets very closely all day. The
joke in the office is, if you stare at the screen long enough you will turn into a bad
tick. That is something my grandmother would have said.
nied_c18.qxd 1/24/03 10:48 AM Page 351

352 Practical Speculation
If enough contracts trade a certain price, the price begins to glow. It is red
hot like heated steel. Any trader older than 5 years, knows touching it can burn
him. Therefore, that price becomes untouchable, until someone turns up the heat
and cuts through that price.
It is good to know that price of hot steel exists. There is no way to see it on a
chart. As it has cooled slightly and no longer glows red. The unsuspecting trader
will come on to the price and get burned. Until the price has been cut with a torch.
By that time sparks are flying and the work is done.
However, after several minutes prices cool. Limit orders are canceled. The
energy needed to cut through that price changes with time. Is steel that is hard-
ened with previous heat harder to cut? Are stock prices that trade with more en-
ergy harder to break? Are prices forged like steel, hammered and beaten into
super strength?
Once that price is broken, it is damaged. A completely different process must
take place to repair the price. Like welding steel, after it has been repaired. A weld
is much stronger than the original piece or stock price.
Touching a red-hot price has burned me. Worse, I have been cut to pieces. By
a false belief that an old price, that was previously broken would somehow sup-
port me from a fall. Metal slivers in the behind, are very painful. . . . LACK
Gone Fishing
In the summer of 2001, we found ourselves grim over a broad worldwide de-
cline. We wanted to knock the hat off of the next broker who greeted us with a
cheery, “You’re filled at your price, sir/ma’am.” Taking our cue from Moby Dick,we realized it was high time to go fishing. We went looking for rules that hold
true in the market’s high tides as well as its low tides. Being partial to patient par-
tisans of the pastime, we invited members of the SpecList to weigh in. As always,
we were awed by the insights that poured in from all sides. We here present a few
samples of the resulting discussion of what traders can learn from fishing.
Reflections on a Lake
—John Lamberg, engineer/inventor; and Mark M McNabb, finance professor,
Virginia Tech
1. Be on the lake when the fish are feeding. Know what sectors the market
likes.
2. Don’t go fishing when the lake is packed with tourists. You probably
won’t be able to get near your favorite fishing hole, and even if you do, all
those churning propellers will scare the fish away. If everyone is playing
the same stock idea, the easy money has been made.
nied_c18.qxd 1/24/03 10:48 AM Page 352

353
How to Land Them (Artist: Hy Hintermeister, © 1937).
nied_c18.qxd 1/24/03 10:48 AM Page 353

354 Practical Speculation
3. Come prepared with well-maintained fishing equipment, an adequate
supply of bait, lures and sharp hooks, and an extra supply of patience.
Give your best ideas time to work, but don’t use margin to see them out.
4. Don’t make noise; you will scare the fish away. Fidelity never speaks;
why should you?
5. Don’t fish where there are no fish. Know the structure of the lake and the
habits of the fish you are trying to catch. Electronic fish finders can help
you locate fish, but it won’t make them bite. If no one else is buying, why
should you? Catching falling daggers can kill a dip-buyer.
6. Despite your best preparations, sometimes the fish just won’t bite. Don’t
be discouraged; go back to shore and enjoy the day, then come back an-
other time. Even the best traders are only 60 percent right. Just make the
winners big ones.
7. Sometimes you find yourself in the middle of a school of feeding fish.
Keep your hook baited and in the water. Correct equipment problems
quickly, and get the bait back in the water. When your stocks are running
up, stay with the trend.
8. When a big one takes your bait or hits the lure, set the hook firmly, keep
tension on the line at all times and play the fish until it tires. Keep the
landing net out of sight. Don’t sell winners too soon.
9. When a really big one breaks your line, take it in stride. He may still be
in the area, so always have a backup fishing outfit aboard. If a market de-
cline washes out a group, get ready when the group takes off again.
10. Know when to come back to shore, particularly when whitecaps start to
appear or there are storm clouds in the distance. If the market gets crazy,
go to cash while you figure things out.
Market Lessons I Have Learned while on a River with a Rod in Hand
—Duncan Coker, investor
Casting upstream into a fast current, mending the line, taking in slack and wait-
ing for that dramatic strike of the trout (preparation and expectations).
Finding the right fly, knowing the knots, leaders, when and how to cast and
the all-important presentation. (It is not easy to fool a fish or the markets.)
Peaceful serenity of bringing in a fish to the bank in the red dim of sunset,
only to let him go to fight another day (the reward for a long-term perspective).
Saltwater Flyfishing for Bonefish
—Duncan Coker, investor
Bonefish are incredibly “spooky.” When spooked they move at speeds up to 30mph
in a highly volatile way, making sharp turns to avoid prey or anglers (panics). The
trigger can be internal, aquatic predators or external, anglers (market shocks).
nied_c18.qxd 1/24/03 10:48 AM Page 354

Chapter 18 • Finale 355
But invariably they return to the same cycle of following the tides and can
thus be caught every now and again (market cycle).
The catching part takes practice, research and a methodical and disciplined
execution. Of course it is a lot of fun and challenging (performance).
The Message Found in a Bottle
—Devon Malori, 10 years old (Dr. Brett’s daughter)
Last night I heard my grandpa and my dad talking about the stock market. They
said something about reading about a bottle that had messages about the market.
So I went down to the beach and looked for bottles.
I didn’t find very much. But there was one interesting one. It had a piece of
paper in it. I copied the message down. It said:
“We fishermen follow the schools of fish, to maximize our
catch. A few fish (usually the weak and dying) always swim away
from the school. But every so often, the strongest leader fish break
away from the school. Wise fishermen follow the strongest lead fish
because they know that the school will soon follow.”
I don’t know what that means, but I thought I should tell you. There are let-
ters at the bottom of the page underneath the words “5-day break away from the
school.” The letters read CSCO, QCOM, LU, ORCL, T.
I hope that helps you. I’ll tell my dad about it too. Bye, bye.
(May 9, 2000)
The Hoodoo Man
—Peter Daniels, retired aerospace engineer
I’ve just finished Victor’s book, The Education of a Speculator, which I enjoyed very
much and particularly the part about the “hoodoo man.” Here is the story about
the greatest hoodoo man I ever met.
Between the ages of 8 and 10 (circa ’42 to ’44), I spent almost every sunny day
with one of the greatest men that I ever met. He was over 6 feet tall, straight as a
stick and by all accounts was over 100 years old. His name was Uncle Stone and
every sunny day during the summer he walked from somewhere in Pittsylvania
County, Virginia, across the Staunton River bridge to Campbell County in order
to fish. He dressed the same way every day in a black suit, frock-tailed coat and fe-
dora hat. He carried a cane and two bamboo fishing poles.
When I first met him, I was completely mesmerized because he could catch
more catfish than one would think was humanly possible. Some days these
strings of fish were only 3 feet long but on other days he could catch a string of
fish at least 14 feet long. I saw him hold a string of fish (in the middle of the
string) with arms extended over his head and both ends of the string touched the
nied_c18.qxd 1/24/03 10:48 AM Page 355

356 Practical Speculation
ground. He used the same equipment that everyone else used but his results were
phenomenal.
When I asked him how he was able to catch so many fish he replied that he
had “hoodooed” the fish.
After that I became obsessed with fishing because I wanted to catch a string
of catfish that would reach from my arm, extended over my head to the ground
and I wanted to learn the “secret of the hoodoo.” I started going fishing every
sunny day with Uncle Stone and it took me three summers to catch that long
string of fish.
In the meantime, I listened as Uncle Stone told me many stories about his
long, wonderful life, including the time when he had been a slave (I know this
part is hard to believe, but it’s true). But he would never tell me the secret of the
hoodoo, no matter how hard I tried to get the answer out of him.
After I caught my long string of fish, I became uninterested in fishing and
on our last day on the river bank Uncle Stone told me that he had just turned 105
years old and that he was thinking about getting married again, to a “yella gal this
time” (and he did!). He also showed me a large tumor on his right side that he
kept covered with his frocktailed coat, and he told me that it would never hurt him
because he had “hoodooed” it.
A few years later, the most interesting and upbeat person that I have ever
met died. But I know that Uncle Stone died happy because he had beaten
the stock market of life, and even George Soros hasn’t done that! A few years
later, I was walking past a black cabaret one night and stopped to listen, because
I loved their music. I’ll never forget the song that was playing that night. As I lis-
tened I heard the refrain over and over again. It was “Somebody Done
Hoodooed the Hoodoo Man,” and I said to myself, “Nobody can hoodoo a real
hoodoo man!”
Bluefish
—Peter Daniels
There is a strong similarity between the mind-set of surf fisherman and stock
traders. Here is a story about surf fishermen. The stock trader analogies are in
parenthesis.
Before Jimmy Carter was president, big schools of bluefish roamed the
Outer Banks.
These schools could be immense. Miles long and God knows how wide
they were.
I once saw a single school that stretched from Rodanthe to Nags Head, which
is roughly 20 miles.
I hated them because I just couldn’t get away from them, to catch anything
else, when I was fishing. A three- to five-pound fish almost every cast! No one
nied_c18.qxd 1/24/03 10:48 AM Page 356

Chapter 18 • Finale 357
couldn’t catch them! You didn’t dare use bait because then you’d catch two at a
time as fast as you could reel them in.
When they started to run, the word got out and surf fisherman from every-
where came here to participate in their feeding frenzy (investors moving into the bull
market). Two “Island Boys” could make thousands of dollars with a gill net and a
rowing dory just fishing from shore (old-time traders reading the tape and scoring big).
You didn’t even need a pole when the blues were “blitzing.” Tourists would just ride
down the beach and pick up beautiful gray trout, still alive and flapping, that had
beached themselves in their frenzy to escape being eaten (stock tips making money).
One day I caught a blue that was so large that for a long time, I actually thought that
I had caught a large shark which were also common near the shore at that time (gap
up big-time on good news when you are long). God how I hated those bluefish!
Well one night, I looked out of my door and thought that someone had built
a city behind my house. It was the lights of large trawl boats, fishing right in my
back yard as far as I could see in both directions. The next morning, when I got
up, I heard on the radio that Jimmy Carter (Greenspan solving the irrational exuber-
ance problem) had invited foreign commercial fisherman to fish, not within the 10-
mile limit or the 3-mile limit, but almost in the surf in my back yard. They were so
close that I could have recognized individuals for a police lineup. For days the
small boats would come out and encircle the fish with purse nets and haul them
on board. Day after day, this occurred. Jimmy Carter just gave the place away
(Greenspan raising rates).
Well, the word was out to the commercial interests both foreign and domestic.
The foreigners came and commercial fisherman came from other states and they
cleaned up the place, except for the minnows. They took the blues and the gray and
speckled trout. They decimated the red drum (it became commercially endangered)
and the flounder (tech, communication and Internet stocks all decimated).
They left the whiting and the croakers (Dow 30). When it was all over and the
trawlers left, the people complained to the U.S. Fish and Wildlife Service. But
these sweethearts said, “That ‘s because of normal ecological conditions, fish were
just in a down cycle right now. . . . We are working on it and the solution is con-
servation by limiting the catch and raising the legal size limits until the fish return
(Fed lowering the funds rate).”
For a few years, fishing on the Banks was like fishing in the Sahara desert
(stock pickers bottom fishing). Eventually, fishing improved a little but if you wanted
a fish to eat, you had to break the law because the size limits were at the extremi-
ties of the bell curve (insider trading increasing). Well, I don’t fish anymore because
I don’t want to harass fish that are mostly under the legal limit. I’m just hanging
back waiting for the big fish to return (trader waiting for a higher low and a higher
high). And I’ve been waiting for over 20 years (traders after the crash of ’29).
But what does the average surf fisherman do: Buy a bigger surf vehicle (one
or more faster computers). Install a CB radio (subscribe to a live data and news wire
sources, buy books on fundamental and technical analysis). Put a rod rack on the top
nied_c18.qxd 1/24/03 10:48 AM Page 357

358 Practical Speculation
and sides of his truck so he can carry and fish with 15 different rods at the same
time (swing and day trading with multiple entries) and all paid for with plastic (mar-
gin account).
I passed on buying the latest fishing paraphernalia, but boy did I bite on the
trading trash. I haven’t made any money to speak of since I bought it all. In the
old days I could make 15 percent to 20 percent just watching CNBC. Now I have
so much data to digest that it takes me all day and night. I’ve been waiting over 20
years for that chop on the water and great flocks of gulls, circling and diving and
picking up tidbits, to tell me that the blues have returned. When that happens, I
will know that the other big, delicious fish are back and the blues are moving in
for their part of the feast.
Frankly, I’m not sure what I’m waiting for as far as this market is concerned
but one thing is certain. Surf fisherman and traders are so much alike primarily
because of their positive expectations.
Fishing and Risk
—Patrick Boyle, trader
I don’t claim to be much of a fisherman, but most weekends in the summer I go in
hunt of stripers, bluefish, or anything stupid enough to bite my bait off the shore
of Cape Cod. The one thing I learned quickly as a novice fisherman was how im-
portant it is to set the drag on your reel right. It is probably more important than
choosing the right bait, or spot to fish, as the location of fish, or what they wish to
eat on a particular day can be pointless to forecast.
The drag on a reel is what sets the strength with which the fishing line is
held. If set too tight, the line will snap when a fish pulls hard; if too loose, you will
not pull anything in.
There are many parallels between this and life. Like a speculator deciding on
the level of risk he should take on a trade. It’s important to strike a balance, and
not hold too tightly to things, be they our beliefs and ideas or our wealth. It is also
important not to leave things too free so that you find yourself with no control. It
is important to use experience and science in order to set this balance, to give the
fishing line a jerk to see if it feels right.
How Can You Say Such Awful Things about Alan Greenspan?
Most people we talk to disagree with us strongly about our characterization of
Fed Chairman Alan Greenspan as an old-hearted, destructive villain who
caused the 2000–2001 market crash. But that is only half of the story. We
also think he was, albeit unintentionally, a part of the meme that led to the
World Trade Center attack.
nied_c18.qxd 1/24/03 10:48 AM Page 358

Chapter 18 • Finale 359
We are well aware that the “doctor” is regarded in most circles as a hero
for popping the Nasdaq bubble. Few sympathize with our complaint that his
actions amounted to an outrageously hubristic attempt to surreptitiously in-
fluence the stock market. To us, his actions were the more objectionable in
that they were made with full knowledge that the public would erupt in
protest if the intent were spelled out.
Was there excess and fraud in the Nasdaq’s rise? To be sure. Yet left to its
own devices, the market has a remarkable ability to take care of its own bub-
bles without help from central planning authorities. Many of the more out-
landish Internet shooting stars already had crashed to earth on their own.
Investors would undoubtedly have adjusted their expectations for telecommu-
nications and computer shares as the capital-spending boom that propelled
them to the heights in 1999 had its inevitable denouement.
The Fed’s intervention allowed an antimarket, antitechnology meme to
flourish. Naysayers who had been bearish throughout the 1990s suddenly had
their day. As the Internet journalist Andrew Orlowski wrote in another context:
Look into the pubs of England—for every Mark E. Smith, who channeled his hate
into creating fabulous new vistas of satire, there are ten thousand bitter men who
hate anything young or beautiful or talented, because it reminds them of their
own failure of courage.6
The result was the first recession in a decade and the worst sustained
market decline in a generation. The telecommunications equipment com-
panies that had lent money to Internet firms for purchasing their products
collapsed, creating a positive feedback loop that contributed to the poisoned
atmosphere.
And the United States suddenly found itself at war with a group of Is-
lamic fanatics seeking to abolish religious and economic freedom. This, we
suggest, was not entirely a coincidence. The link may seem outrageous. But
consider what the Mideast primitives represent themselves to be. They use
rhetoric from the Crusades of 1,000 years ago. They wish to destroy American
capitalism. They inculcate their children with an intolerant, backward creed
and a suicidal mission to destroy all Americans, civilian or military, wherever
they are found.
From the primitive perspective, it is sensible to make war on capitalist so-
ciety. People free to act in their own economic interest dare to prize liberty
above obedience to dictators. They take the indeterminate future and the open
skies over the totalitarian’s promises of economic certainty or a certain eter-
nity. The very values that primitives worry will destabilize their controlled so-
cial hierarchies are fundamental to our system.
nied_c18.qxd 1/24/03 10:48 AM Page 359

360 Practical Speculation
Today’s primitives have a long pedigree. They are part of a history that in-
cludes the Catholic Church’s resistance to the 1543 discovery by Copernicus
that the earth is not the center of the universe. The common thread is an aver-
sion to change and examination of the premises of the ruling elite. Invoking
theology and nostalgia, the primitive seeks control through regulation and
theocratic authority. Primitives are, inevitably, anticapitalist, because they
seek to maintain power and stasis. In a market society, few trends survive;
only free thinking and risk taking are rewarded. The market allocates capital
through the decisions of millions of people acting independently in their own
interest. Repressive societies, with their nationalism, tribal wars, official reli-
gion, and lumbering political ideologies, have no marketplace. Instead, such
states attempt to control the distribution of resources, manpower, ideas, and
goods. The result is a static, illiquid market; goods are allocated not by supply,
demand, and the mediating mechanism of flexible prices, but through cor-
ruption and the black market.
Primitive thinking characterizes all reactionary response to the develop-
ment of technology. As Jacques Barzun remarks in From Dawn to Decadence,primitivism is a “disaffection from science and technology” running parallel to
the development of Western culture throughout the centuries.7 In the 1990s,
the performance of the fast-moving technology companies of the Nasdaq de-
fined our understanding of risk. Tech companies typically pay no dividend and
offer little certainty, but their pursuit of new technologies made them magnets
for risk capital. Low-risk, low-return “old technology,” “defensive,” “brick-and-
mortar” companies—makers of carpets, ketchup bottles, and soda pop—suf-
fered in this young-hearted period of technological expansion. After the
Nasdaq sank, old-economy, low-return investment strategies were dusted off
and once again seized the imagination of Wall Street.
Some of today’s primitivist manifestations promise to restore a bond be-
tween humans and nature by abolishing Western technology and markets. Is-
lamic terrorism represents a new twist—a medieval mentality that parasitically
adopts Western technology, markets, and openness in order to destroy them.
The World Trade Center terrorists had e-mail, flew planes, lived in middle-class
Florida suburbs, ate pizza, frequented strip bars, and shopped at Wal-Mart.
These terrorists seemed disturbingly American, and yet despite the pattern of
middle-class consumption, they saw themselves as martyrs in a holy war
against the United States.
The premise of U.S. immigration policy has long been that the poor,
tired, and suffering, presented with the opportunity for material gain and
a decent life, will shed Old World prejudices and embrace American
nied_c18.qxd 1/24/03 10:48 AM Page 360

Chapter 18 • Finale 361
democratic culture. This is the idea behind the Latin phrase written on every
coin and every dollar bill produced by the U.S. mint: e pluribus unum, the
idea of the melting pot: out of many, one. America is founded not on sacri-
fice, but on creation.
The terrorist attack on the World Trade Center was in essence an assault
on the mechanisms that let people transcend merely local values and the so-
cial desire for certainty. It struck democracy’s central mechanism for mediat-
ing uncertainty: the market. The three words of the name were well chosen.
The world came to trade there, in the center of economic freedom. No matter
what your culture, religion, or viewpoint, you were welcome to exchange the
best products of your efforts freely with others.
Primitivists, be they suicide terrorists, enemies of scientific truth, or the
self-chosen vanguard of “the people,” always have answers for anyone willing to
listen, and weapons to point at those unwilling to listen. Yet their arguments
are drawn from yesterday’s carcass, not the emboldened dreams of tomorrow.
Their plans offer the certainty of blood and soil, birth and death, but in doing so
omit that which makes us truly human: risk, uncertainty, freedom.
And yet that is why attacks on innovation, science, and liberty are bound
to fail. You cannot kill the spirit that makes people want to better their lives
and draws millions to the United States from around the world. People real-
ize that trade, business, and freedom are better than a life spent under rigid
control exercised by the few, be they bureaucrats, mullahs, or royalty. Cre-
ativity will always trump old-hearted men who seek to keep everything as it
was in bygone days.
What Book Do You Recommend?
When asked a question like “What’s the best book?” it is customary for ex-
perts to answer flippantly. Rudolf Nureyev, asked whom he considered the
best dancer, always answered Fred Astaire. Paul Morphy was the same way in
chess; he would never play anyone an even game because that would legit-
imize the possibility that someone else could be half as great as he was. When
Vic ruled the squash courts, he always said the greatest player was Jack Barn-
aby, his coach at Harvard, who stopped playing in 1950 and couldn’t detract
from evaluation of his own play.
Previously, when asked to recommend a good investment book, Vic usu-
ally responded that Richard Wyckoff’s Magazine of Wall Street, in the early
1900s, and, before that, Hunt’s Merchant’s Magazine published in the 1870s,
nied_c18.qxd 1/24/03 10:48 AM Page 361

362 Practical Speculation
were veritable treasure troves, and that since nothing subsequent to those
monumental contributions had been at all noteworthy, it would be profitable
to go back to those sources to at least get in touch with the roots of the field.
But all that has changed. We can now recommend without reservation
Triumph of the Optimists: 101 Years of Global Investment Returns, which we
wrote about in detail in Chapter 9. This great book tabulates 101 years of
yearly returns for markets in 16 countries, with stock-by-stock returns in En-
gland and the United States. It compares these returns to Treasury bill rates,
Treasury bond rates, inflation, and currency exchange rates. Returns are bro-
ken down into dividends, equity risk premiums, and size effects.
With this as a base, the authors touch on every investment topic imaginable,
including value versus growth, small versus big, seasonality, cost of capital, cor-
relations between countries, earnings and dividend growth, benefits from diver-
sification, the relevance of valuation models, and likely returns for the future.
Beating Pods and Pessimism
Invasion of the Body Snatchers, based on a novel by Jack Finney, has long been
one of our favorite horror films. Vic saw the original 1954 production and one
of the two remakes that seemed to hit just in time for each of the next two gen-
erations. But the 2002 market crash led us to reread the book. It is great, and
aside from Triumph of the Optimists, this is the book we would recommend
most to those who wish to prosper in the current market environment. The
story is about the danger of losing hope and passively accepting the status quo.
If you succumb to conformity and stop thinking for yourself, the pod people
will get you.
The hero of the story, Miles Bennell, is a doctor in a typical small town. He
is confronted by an epidemic of apparent mass hysteria among his friends and
patients. One after the other tells him that their relatives, teachers, and friends
are not the people they seem to be. Then, strangely, they return to his office to
recant. Now they are feeling fine.
The only problem is that Miles’ intellectual friend Jack Belicec doesn’t be-
lieve it. He finds a mannequin-like body in his cellar. He lays it out on a bil-
liard table to inspect it, and invites Miles over for a look. Jack and Miles find
that the body is a blank, like an undeveloped photo, with no fingerprints. “It’s
all there,” says Jack. “It has lips: a nose, eyes, skin, and bone structure under-
neath. But there are no lines, no details, and no character. . . . It’s like a blank
face, waiting for the final finished face to be stamped upon it.”
nied_c18.qxd 1/24/03 10:48 AM Page 362

Chapter 18 • Finale 363
The one person Miles relies on, his one beacon of light on a foggy day, is
Dr. Mannie Kaufman, a respected psychiatrist in a neighboring community.
When Dr. Kaufman tells Miles that “the human mind is a strange and won-
derful thing” and that what he and Jack saw was a simple delusion, Miles is
somewhat persuaded. What gnaws at him is that Mannie is usually a bit more
cautious in giving out his opinion. The thought then occurs to Miles that per-
haps the person giving him the opinion isn’t Mannie at all, but a pod.
It turns out that Miles is right. Mannie is one of “them.”
In the new century, we wondered if a similar invasion had taken over the
markets. Only a few years ago, we were surrounded by investors full of emo-
tion, eager to drink deeply of the economic miracle that is the United States.
Now those same investors seemed drained of feeling, convinced that the mir-
acle was a hoax. They looked the same, they responded to the same names.
But they were not the same. Inspired by Miles’ example, I sought out a market
psychologist, Brett Steenbarger. With relief, I heard excitement in his voice as
he talked of crisis and opportunity. I realized that he, unlike Mannie, had not
fallen prey to the pods.
“We’re dealing with more than body snatchers,” he said. “These are mind
snatchers as well. Behind all speculative success is a positive triad of extraver-
sion, energized mood, and risk-taking. We know from research that people
who take an active interest in the world around them are more likely to expe-
rience life with vigor. They are also more likely to assume prudent risks.”
“That’s not what we’re seeing now,” he continued. “Investors are respond-
ing with the negative triad that psychiatrist Aaron Beck found among depressed
people: dampened optimism about themselves, others, and the future.”
“What could have snatched people’s minds this way?” I asked.
“It’s the hubris meme,” Dr. Steenbarger offered. “It’s the same meme
that told the Greeks that they could not fly too close to the sun, lest they meet
the fate of Icarus. What is taking investors over is not the idea of a bear mar-
ket. Those come and go. It’s the idea that they deserve a bear market.”
With that, the doctor pulled out a copy of BusinessWeek and turned to an
article titled “The Betrayed Investor.” It chronicled the dashed hopes of in-
vestors whose trust has been broken by the failures of corporate boards, bro-
kerages, and accounting firms to protect their constituencies. He pointed to
the headline beneath the article’s title: “Americans bought into the idea that
stocks could only make them richer. Then the market bubble burst—and then
came Enron.”8
“You see,” he said, “investors no longer feel deserving of rich rewards.
They feel like arrogant dupes, and they must pay the price of Icarus for their
nied_c18.qxd 1/24/03 10:48 AM Page 363
364 Practical Speculation
hubris. This is what has taken over the world. Investors dare not hope. They
are afraid they will bring an even greater calamity upon their heads.”
It was then that we realized that Finney’s book held the answer for today’s
investors. They may feel like the betrayed Miles, or like the betrayed lover. But
there is an important difference. Although dashed expectations may portend a
poor relationship, they are a favorable indication for markets. Hitting a 40-day
low point in the markets has led to an average rise of 1.5 percent the next day,
over the past six years. Market pessimism provides the very basis for market
optimism.
In Finney’s book, the situation looks desperate for Miles and his girlfriend
Becky. But they refuse to give up. “Even prisoners in maximum-security pris-
ons have escaped. We had no right to waste ourselves. We were here—with the
pods—and we had no right to waste ourselves. Even though it was hopeless.
Even though it made capture an absolute certainty, we had to use ourselves
against the pods.”
Hope—And Some Time-Tested Principles
Invasion of the Body Snatchers ends on a heroic note. Miles and Becky refused to
give up. They put up so much resistance that the pods moved to a more hos-
pitable planet. “Many had lost,” the book concludes, “but some of us who had
not been caught, trapped without a chance, had fought implacably, and a frag-
ment of a wartime speech moved through my mind: We shall fight them in thefields, and in the streets, we shall fight in the hills; we shall never surrender.”
When the bearish meme goes the way of the pod people, the world will
start looking normal again, just as it did at the end of the Body Snatchers. The
people who put all their wealth in money-market accounts paying 1 percent
expecting that stocks would go to zero will be hanging around the town plaza,
strangely listless and uncommunicative. The death rate will be higher than av-
erage for a while, and you’ll see empty storefronts where the executives were
hauled off in handcuffs and the companies went bankrupt. But all in all, as
Jack Finney summed up:
The empty houses are filling quickly—it’s a crowded county and state—and there
are new people, most of them young and with children, in town. In five years, maybe
two or three, Mill Valley will seem no different to the eye from any other small town.
And what once happened here will have faded into final unbelievability.
The empty wallets of those who recently bought stocks for the long term
will be filling steadily. The American economy is vigorous and resilient. After
nied_c18.qxd 1/24/03 10:48 AM Page 364

Chapter 18 • Finale 365
periods of disaster, the surviving companies are stronger and healthier, and
the returns from buying them are greater. New companies and divisions will
be formed that profit from great scientific discoveries. Those who invest pru-
dently can expect to pay for their education, homes, and retirement just the
way their parents did in almost all periods in the previous century.
In five years, maybe two or three, the Nasdaq below 1000 and the Dow
below 7500 will be bad memories. Those who doubted the fruits of investing
and enterprise will have faded into well-deserved obscurity.
Manhattan, NY (Artist: Michael Leu, 1990).
nied_c18.qxd 1/24/03 10:48 AM Page 365

nied_c18.qxd 1/24/03 10:48 AM Page 366

367
A F T E R W O R D
Some traders don’t take losses personally. For most, however, self-
confidence varies with the success of the last trade, as my wife Susan
once observed after years of watching traders work for me. I am not immune to
this. Since 1997, I have been trying to crawl back up the stairs, not entirely with-
out success. Occasionally, however, I stumble. Then, I think that I’m the world’s
worst. In this I follow my father, Arthur Niederhoffer. Artie had a beautiful
handball and tennis game, but whenever I would ask him to play a money or
tournament match, he’d say, “For crying out loud, no. I’m the world’s worst. Be-
sides, I can’t afford the loss of the quarter.”
Artie played football on the Brooklyn College team at the age of 16. The
team was paid heavily to play against the best teams in the nation, as they
loved to kill the Brooklyn boys. As far as I know, Brooklyn never won a game
that Artie played in. What he did get was a broken nose—12 times—and a dis-
located shoulder or two. As a result, he could never play any other game, such
as tennis or handball, that required a free-flowing swing. So there was some
truth to his talk about being the world’s worst, even though before he played
college football he was a champ at all these.
I often feel the same way. Despite the lessons I learned in 1997, I am in-
variably too early and too contratrend in my trades. Whatever the big move,
it’s still likely to get me. I am trying to improve, however, and often when I
take a drubbing, like I did in summer 1998 or summer 2002, I step back, kick
myself around, and say, like Artie: “I’m the world’s worst.”
My Uncle Howie is always vigilant not to let me succumb to defeatism,
since he always thinks of his little nephew as a winner. After reading a mes-
sage from me about my latest drubbing in the first weeks of 2003, this is what
he had to say:
nied_z01bafter.qxd 1/24/03 10:45 AM Page 367

368 Afterword
Your message intimating self-doubt is very upsetting. You have always been
supremely confident in your abilities and convictions, and with great justification.
As much as we loved your dad, we are not him. His self-deprecation was an ex-
pression of modesty, not a true belief in his inferiority. Artie knew what his abili-
ties were, and they were formidable. I know what mine are, and you know what
yours are. And, while in many ways we are not the man that Artie was, in others
we surpass him. Self-deprecation is not fitting for you or me. Realistic self-
assessment is more our style.
Artie, although growing up amid the Depression and never having any excess
money, was always very free with a buck. It was never a matter of what he could af-
ford. Unlike most people, he would tip gas station attendants with those quarters
that he “couldn’t afford to lose.” I believe his aversion to gambling (speculation for
you—calculated risking for me) had to do with the scarcity of money as well as his
not wanting to take advantage of someone else. We regard it differently.
I have no doubt of your ability to overcome any temporary setback you may
experience in life. It won’t be by chance. It will be by dint of your analysis of all
available data and knowledgeable counsel. If, like Ali in “Rumble in the Jungle,”
you have decided that it is wise to retreat for now and let the enemy punch him-
self out, like MacArthur you shall return and emerge victorious as you always do.
Your positive self-confidence will ensure that result.
I love you,
Howie
nied_z01bafter.qxd 1/24/03 10:45 AM Page 368

369
N O T E S
Introduction
1. Jack Finney, Invasion of the Body Snatchers (New York: Simon & Schuster, 1954).
2. Victor Niederhoffer, The Education of a Speculator (New York: Wiley, 1997).
3. Geraldine Fabrikant, “Trappings of Faded Richness: Sold!” New York Times (De-
cember 13, 1998).
4. Mitch Albom, Tuesdays with Morrie (New York: Doubleday, 1997).
5. Paul Heyne, The Economic Way of Thinking (Upper Saddle River, NJ: Prentice-
Hall, 1997).
6. Arthur Niederhoffer, Behind the Shield: The Police in Urban Society (Garden City,
NY: Doubleday, 1967).
7. Thomas S. Kuhn, The Structure of Scientific Revolution (Chicago: University of
Chicago Press, 1962).
8. Elroy Dimson, Paul Marsh, and Mike Staunton, Triumph of the Optimists: 101
Years of Global Investment Returns (Princeton, NJ: Princeton University Press,
2002).
9. Steve Stigler, Statistics on the Table (Cambridge, MA: Harvard University Press,
1999).
10. Robert L. Bacon, Secrets of Professional Turf Betting (New York: Amerpub, 1956).
Chapter 1
1. Guy De Maupassant, “The Horla,” Short Stories of the Tragedy and Comedy of Life,
Vol. II (New York: M. Walter Dunne, 1903).
2. Speech by U.S. Federal Reserve Chairman Alan Greenspan, “The Challenge of
Central Banking in a Democratic Society,” presented December 5, 1996, at an
nied_z02bnotes.qxd 1/24/03 10:45 AM Page 369

370 Notes
awards dinner sponsored by the American Enterprise Institute for Public Policy
Research, Bloomberg News (December 6, 1996).
3. Hal Paul, “U.S. Stock Plunge: Dow’s 554-Point Drop Halts Trading,” Bloomberg
News (October 27, 1997).
4. Jeremy J. Siegel, Stocks for the Long Run: The Definitive Guide to Financial Market
Returns and Long-Term Investment Strategies (New York: McGraw-Hill, 1998).
5. Arthur Levitt, “The Numbers Game,” delivered at the New York University Cen-
ter for Law and Business, New York (September 28, 1998).
6. Carole Loomis, “Lies, Damned Lies, and Managed Earnings,” Fortune (August 2,
1999).
7. Carole Loomis, “Mr. Buffett on the Stock Market,” Fortune (November 22, 1999).
8. Mary Buffett and David Clark, Buffettology (New York: Fireside, 2001).
9. Monique Wise, “Wall Street Bonuses Could Rise 30 percent to Record as Profits
Soar,” Bloomberg News (December 9, 1999).
10. Brian Rooney, Amy Taxin, and Sara Pepitone, “How Rich Is Bill Gates? The Ab-
surdity of Big Numbers,” Bloomberg News (December 16, 1999).
11. Albert Jay Nock, Memoirs of a Superfluous Man (Delavan, WI: Hallberg Publish-
ing, 1994).
12. Richard Dawkins, The Selfish Gene (New York: Oxford University Press, 1989).
13. Robert Shiller, Irrational Exuberance (Princeton, NJ: Princeton University Press,
2000).
14. Dan Lonkevich, “Buffett Lukewarm on Stocks, Seeks Acquisitions,” Bloomberg
News (March 9, 2002). Warren Buffett’s letter to shareholders, Berkshire Hath-
away 2001 annual report.
Chapter 2
1. Mario Puzo, The Last Don (New York: Random House, 1996).
2. Steven Sills and Ivan Alexrod, “Profit Participation in the Motion Picture Indus-
try,” Los Angeles Lawyer (April 1989).
3. Standard & Poor’s Security Price Index Record (New York: McGraw-Hill, 2001).
4. Kenneth L. Fisher and Meir Statman, “Cognitive Biases in Market Forecasts: The
Frailty of Forecasting,” Journal of Portfolio Management (Fall 2000).
5. Thornton L. O’glove, Quality of Earnings (New York: Free Press, 1987).
6. Howard Schilit, Financial Shenanigans (New York: McGraw-Hill, 2002).
7. Aswath Damodaran, The Dark Side of Valuation (Upper Saddle River, NJ: Prentice
Hall, 2001).
8. Bjorn Tuypens, “Stock Market Predictability: A Myth Unveiled,” (Unpublished,
2002).
9. Alfred McClung Lee and Elizabeth Briant, The Fine Art of Propaganda: A Study of
Father Coughlin’s Speech (New York: Harcourt, Brace and Company, 1939).
Expanded edition published 1971 by Octagon Books. Excerpts available at:
http://www.mapinc.org/propaganda/propaganda/fineart.html.
10. Gretchen Morgenson, “As It Beat Profit Forecast, IBM Said Little about Sale of a
Unit,” New York Times (February 15, 2002).
nied_z02bnotes.qxd 1/24/03 10:45 AM Page 370

Notes 371
Chapter 3
1. Robert Graves, Greek Myths (London: Penguin Books, 1981).
2. Martin S. Schwartz, Pit Bull: Lessons from Wall Street’s Champion Trader (New
York: HarperBusiness, 1999).
3. Joseph Granville, Granville’s Last Stand: Secrets of the Stock Market Revealed (New
York: Hanover House, 1994).
4. Jack Schwager, Market Wizards: Interviews with Top Traders (New York: Harper-
Business, 1993); and Jack Schwager, The New Market Wizards: Interviews with Top
Traders (New York: HarperBusiness, 1994).
5. Philip Jenks and Stephen Eckett, eds., The Global-Investor Book of Investing Rules:
Invaluable Advice from 150 Master Investors (Hampshire, England: Harriman
House, 2001).
6. Thomas Bulkowski, Trading Classic Chart Patterns (New York: Wiley, 2002).
7. Venkat R. Eleswarapu and Marc R. Reinganum, “The Predictability of Aggregate
Stock Market Returns: Evidence Based on Glamour Stocks” (Dallas, TX: Southern
Methodist University, Unpublished paper).
8. Mario Puzo, Fools Die (New York: Penguin Books, 1978).
9. Jim Albert and Jay Bennett, Curve Ball: Baseball, Statistics, and the Role of Chance
in the Game (New York: Copernicus Books, 2001).
10. Barry Nalebuff and Avinash Dixit, Thinking Strategically: The Competitive Edge in
Business, Politics, and Everyday Life (New York: Norton, 1993).
11. Elroy Dimson, Paul Marsh, and Mike Staunton, “Murphy’s Law and Market
Anomalies,” Journal of Portfolio Management, vol. 25–2 (Winter 1999).
12. Daniel Kahneman, Paul Slovic, and Amos Tversky, Judgment under Uncertainty:
Heuristics and Biases (Cambridge, England: Cambridge University Press,
1982).
13. Steven Nison, Japanese Candlestick Charting Techniques: A Contemporary Guide to
the Ancient Investment Techniques of the Far East (New York: New York Institute of
Finance, 2001).
14. Harro Von Senger, The Book of Stratagems (New York: Viking/Penguin, 1991).
15. Sandra Ward, “Barometer Readings: An Interview with Don Hays,” Barron’s
(April 2, 2001).
16. Robert Colby and Thomas Meyers, The Encyclopedia of Technical Market Indicators
(New York: Irwin, 1988).
17. Tushar Chande and Stanley Kroll, The New Technical Trader (New York: Wiley,
1994).
18. Daniel Defoe, A Journal of the Plague Year (London: Penguin Books, 1986).
19. Carol Osler, “Identifying Noise Traders: The Head-and-Shoulders Pattern in U.S.
Equities” (1998). Available from http://www.ny.frb.org/rmaghome/staff_rp/
sr42.pdf.
20. Paul Dickson, Baseball’s Greatest Quotations (New York: Harper, 1991).
21. John E. Cooke, Life of Stonewall Jackson (Richmond, VA: Ayres & Wade, 1863).
22. John Sweeney, “Music of the Markets: Victor J. Niederhoffer,” Technical Analysis
of Stocks and Commodities (April, 2000).
nied_z02bnotes.qxd 1/24/03 10:45 AM Page 371

372 Notes
23. Bill Williams, Trading Chaos: Applying Expert Techniques to Maximize Your Profits
(New York: Wiley, 1995).
24. Robert L. Park, Voodoo Science: From Foolishness to Fraud (London: Oxford Uni-
versity Press, 2000).
25. Zvi Bodie, Essentials of Investments (New York: McGraw-Hill College Division,
2001).
26. David Simon and Roy A. Wiggins, “S&P Futures Returns and Contrary Senti-
ment Indicators,” Journal of Futures Markets (May, 2001).
Chapter 4
1. Leon Festinger, H. W. Riecken, and S. Schachter, When Prophecy Fails (Min-
neapolis: University of Minnesota Press, 1956).
2. Peter Bernstein, Against the Gods: The Remarkable Story of Risk (New York: Wiley,
1998).
3. Carl I. Hovland and H. C. Kelman, “Reinstatement of the Communicator in De-
layed Measurement of Opinion Changes,” Journal of Abnormal Social Psychology,
vol. 48 (1954): 327–335.
4. Flo Conway and Jim Siegelman, Snapping (New York: Stillpoint Press, 1995).
5. Ronald W. Rogers and C. Ronald Mewborn, “Fear Appeals and Attitude
Change: Effects of a Threat’s Noxiousness, Probability of Occurrence, and the
Efficacy of the Coping Responses,” Journal of Personality and Social Psychology,
vol. 34 (1976): 56–61.
6. Michael Shermer, Why People Believe Weird Things: Pseudoscience, Superstition and
Other Confusions of Our Time (New York: Freeman, 1997).
7. William Worthington Fowler, Ten Years in Wall Street (Hartford, CT: Worthing-
ton, Dustin, 1870).
Chapter 5
1. Mark Leibovich, “A Rain God Confronts a Harsh Climate: CEO’s Optimism
Tested by Downturn,” Washington Post (April 6, 2001).
2. John F. Wasik, “Nestegg,” Modern Maturity (January/February 2002).
3. “Jennifer Lopez Is a Pain in the Butt,” National Enquirer (April 25, 2001).
4. Robert Sobel, When Giants Stumble: Classic Business Blunders and How to Avoid
Them (Upper Saddle River, NJ: Prentice Hall Press, 1985).
5. Sir Harold Nicolson, Diplomacy (Washington, DC: Georgetown University,
School of Foreign Service, Institute for the Study of Diplomacy, 1939 and 1988).
6. “Cisco Head Cautions against Silicon Valley Hubris,” InfoWorld (February 29,
2000).
7. Kathryn Kranhold, Bryan Lee, and Mitchel Benson, “Enron Rigged Power Market
in California, Documents Say,” Wall Street Journal (May 7, 2002).
8. Peter Burrows, “HP’s Carly Fiorina: The Boss,” BusinessWeek (August 2, 1999).
9. Julie Schmit, “Aggressive Chambers Powers Cisco,” USA Today (August 13,
1996).
10. Andy Reinhardt, “Meet Cisco’s Mr. Internet,” BusinessWeek (September 13, 1999).
nied_z02bnotes.qxd 1/24/03 10:45 AM Page 372

Notes 373
11. Joseph Menn, “Cisco Posts 49% Jump in Profit,” Los Angeles Times (February 9,
2000).
12. Andy Reinhardt, “The E-Biz 25,” BusinessWeek (May 2000).
13. Scott Berinato, “What Went Wrong at Cisco,” CIO Magazine (August 1, 2000).
14. “Cisco Chief Outlines Vision of the Internet of the Future,” Confederation of In-
dian Industry press release (January 17, 2001).
15. Nick Heil, “Eight Great Blunders,” Outside Magazine (February 2002).
16. Alan Lightman, Great Ideas in Physics (New York: McGraw-Hill, 2000).
17. Michael Lewis, “Self-Conscious Emotions,” Gale Encyclopedia of Childhood and
Adolescence (January 1, 1995).
18. Arthur Niederhoffer and Alexander B. Smith, “Power and Personality in the Court-
room: The Trial of the Chicago 7,” Connecticut Law Review (Winter 1970–1971).
19. James C. Collins, Good to Great: Why Some Companies Make the Leap and Others
Don’t (New York: HarperCollins, 2001).
20. “Web-Exclusive Interview: Good Questions, Great Answers,” Fast Company (Octo-
ber 2001). Available from http://www.fastcompany.com/online/51/goodtogreat
.html.
21. Jose Raul Capablanca, My Chess Career, rev. ed. (Mineola, NY: Dover Publications,
1966).
22. William J. Mitchell, “Do We Need Skyscrapers?” Scientific American (December
1997).
23. Alcoa executive’s Architectural Forum interview, cited in Judith Dupre, Skyscrap-
ers: A History of the World’s Most Famous and Important Skyscrapers (New York:
Black Dog & Leventhal, 2001).
24. Ayn Rand, The Fountainhead (New York: Penguin Books, 1971).
25. Paul Krugman, “Enron Goes Overboard,” New York Times (August 17, 2001).
26. Jeffrey Tomich, “Enron to Sell Ballpark Naming Rights for $2.1 Million,”
Bloomberg News (February 27, 2002).
27. “Stadium Jinx: What to Call Enron Field? ‘Enron Folds,’ Maybe,” Wall Street Jour-
nal (December 4, 2001).
28. James P. Cramer, ed., Almanac of Architecture and Design (Norcross, GA: Green-
way Consulting, 2002).
29. Richard Roll, “The Hubris Hypothesis of Corporate Takeovers,” Journal of Busi-
ness, vol. 59, no. 2 (1986): 197–216.
Chapter 6
1. Sidney Cottle, Roger F. Murray, and Frank E. Block, eds., Graham and Dodd’s Se-
curity Analysis, 5th ed. (New York: McGraw-Hill, 1988).
2. Janet Lowe, Benjamin Graham on Value Investing: Lessons from the Dean of Wall
Street (Chicago: Dearborn, 1994).
3. Benjamin Graham, Intelligent Investor (New York: Harper & Row, 1973).
4. M. Diamond and H. K. Sigmundson, “Sex Reassignment at Birth: Long Term Re-
view and Clinical Implications, Archives of Pediatric and Adolescent Medicine, vol.
151 (1997): 298.
nied_z02bnotes.qxd 1/24/03 10:45 AM Page 373

374 Notes
Chapter 7
1. Thomas Henry Huxley, “Science and Morals,” Essays Upon Some Controverted
Questions (London: Macmillan, 1886).
Part Two
1. David Bronstein, The Modern Chess Self-Tutor (New York: Cadogan, 1995).
Chapter 8
1. Francis Galton, “Kinship and Correlation,” North American Review 150. Quoted in
Stephen M. Stigler, The History of Statistics: The Measurement of Uncertainty before
1900 (Cambridge, MA: Harvard University Press, 1890).
2. Reed Hastie and Robin M. Dawes, Rational Choice in an Uncertain World (London:
Sage, 2001).
3. “Purdue University’s Spurious Correlations Contest, 2000 Winners” (2001).
Available from http://www.mrs.umn.edu.
4. James O’Shaughnessy, What Works on Wall Street (New York: McGraw-Hill, 1998).
Chapter 9
1. F. A. Hayek, The Fatal Conceit: The Errors of Socialism (Chicago: University of
Chicago Press, 1988).
Chapter 10
1. Gerard Piel, The Age of Science: What Scientists Learned in the Twentieth Century
(New York: Basic Books, 2001).
2. Sanford Jacobs, ed., The Quotable Investor (Guilford, CT: Lyons Press, 2001).
3. Fischer Black, “Yes, Virginia There Is Hope: Test of the Value Line Ranking Sys-
tem,” Financial Analysts Journal (September/October 1973): 10–14.
4. Mark Hulbert, The Hulbert Financial Digest (January 2001).
5. James J. Choi, “The Value Line Enigma: The Sum of Known Parts,” Journal of Fi-
nance and Quantitative Analysis, vol. 35, no. 3 (September 2000).
6. Robert S. Kaplan and Roman L. Weil, “Risk and the Value Line Contest,” Finan-
cial Analysts Journal (July/August 1973).
7. Gur Huberman and Shmuel Kandel, “Market Efficiency and Value Line’s
Record,” Journal of Business (April 1990).
8. William A. Sherden, The Fortune Sellers (New York: Wiley, 1998).
9. Will Durant and Ariel Durant, The Lessons of History (New York: Simon & Schus-
ter, 1968).
Chapter 11
1. Paul Dickson, Baseball’s Greatest Quotations (New York: Harper, 1992).
2. Larry Ritter, The Story of Baseball (New York: Beech Tree, 1999).
3. Robert Whiting, You Gotta Have Wa (New York: Vintage, 1990).
nied_z02bnotes.qxd 1/24/03 10:45 AM Page 374

Notes 375
Chapter 12
1. Henry George, Progress and Poverty (San Francisco: W. M. Hinton, 1879).
2. Yoon Dokko, “Real Estate Income and Value Cycles: A Model of Market Dynam-
ics,” Journal of Real Estate Research, vol. 18, no. 1 (1999): 1–27.
3. Lucy Komisar, “Joseph Stiglitz,” Progressive (June 2000).
4. Jun Han and Youguo Liang, “The Historical Performance of Real Estate Invest-
ment Trusts,” Journal of Real Estate Research, vol. 10, no. 3 (1995): 235–262.
5. “REITs’ Low Correlation to Other Stocks and Bonds Is Key Factor for Portfolio Di-
versification,” NAREIT press release (May 29, 2001).
6. Ronald W. Kaiser, “The Long Cycle of Real Estate,” Journal of Real Estate Research,
vol. 14, no. 3 (1997): 233–258.
7. William B. Brueggeman and Jeffrey D. Fisher, Real Estate Finance & Investments
(New York: McGraw-Hill, 2001).
8. Homer Hoyt, One Hundred Years of Land Values in Chicago: The Relationship of the
Growth of Chicago to the Rise of Its Land Values, 1830–1933 (Washington: Beard
Books, 2000).
9. Ray A. Smith, “New Report Questions Strength of REIT Results,” Wall Street Jour-
nal (December 18, 2001).
10. Gary Eldred and Andrew Mclean, Investing in Real Estate (New York: Wiley, 2001).
11. Robert Kiyosaki and Sharon Lechter, Rich Dad, Poor Dad (New York: Warner
Books, 2000).
12. Michael C. Thomsett, J. K. Lasser’s Real Estate Investing (New York: Wiley,
2002).
13. Jon Markman, “Buy What the S&P Trashes and Get Rich Quick,” CNBC Money
(December 12, 2001). Available from http://www.cnbc.com.
14. Dean Starkman, “Office Buildings Had Sharpest Vacancy Rise in 2001,” Wall
Street Journal (January 31, 2002).
15. Victor Niederhoffer and Laurel Kenner, “Sinking Real Estate Means Rising
Stocks” (February 14, 2002); “9 Reasons REITs Are about to Get Rocked” (Febru-
ary 21, 2002); “More Evidence REITs Are on the Brink” (February 28, 2002); and
“Small Business or Big, the Rules Are the Same” (March 7, 2002). CNBC Money,
Available from http://www.cnbc.com.
16. Robert Burgess, “U.S. Office Market Recovery to Be Delayed, Torto Says,”
Bloomberg News (September 19, 2002).
17. Peter Grant, “Commercial Real Estate May Damp the Economy,” Wall Street Jour-
nal (February 25, 2002).
Chapter 13
1. Gordon Kane, Supersymmetry: Unveiling the Ultimate Laws of Nature (Oxford,
England: Perseus Press, 2000).
2. David Batstone, “Debate: Charles Sanford,” Business 2.0 (October 1998). Available
from http://www.business2.com/articles/mag/0,1640,12749%7C2,FF.html.
nied_z02bnotes.qxd 1/24/03 10:45 AM Page 375

376 Notes
3. Charbel Tannous and Alain Fessant, “Combustion Models in Finance” (Decem-
ber 12, 2001). Available from http://arxiv.org/PS_cache/physics/pdf/0101/0101042
.pdf.
Chapter 15
1. Charles MacKay and Joseph De La Vega, Extraordinary Popular Delusions and the
Madness of Crowds and Confusion de Confusiones (New York: Wiley, 1995).
2. Theodore C. Bergstrom, “Economics in a Family Way,” Journal of Economic Liter-
ature (forthcoming).
3. Abhinay Muthoo, Bargaining Theory with Applications (Cambridge, England: Cam-
bridge University Press, 1999).
4. Thomas C. Scheling, The Strategy of Conflict (Cambridge, MA: Harvard University
Press, 1980).
5. Norman Lebrecht, The Book of Musical Anecdotes (New York: Free Press, 1985).
6. N. Gregory Mankiw, Principles of Microeconomics (Fort Worth, TX: Dryden, 1997).
7. George J. Stigler, “The Economics of Information,” Journal of Political Economy,
vol. 69, no. 3 (1961): 213–225.
Chapter 16
1. Juan Enriques and Ray A. Goldberg, “Transforming Life, Transforming Business:
the Life-Sciences Revolution.” Harvard Business Review (March–April 2000).
2. Michael S. Malone, “The Next Bubble: Is Bioinformatics the Next Big Boom . . .
and Bust?” ABCNEWS.com (March 13, 2001). Available from http://abcnews
.go.com/sections/business/SiliconInsider/SiliconInsider_010313.html.
Chapter 17
1. Jacob K. Thomas and Huai Zhang, “Inventory Changes and Future Returns,”
working paper, December 2001.
Chapter 18
1. Francis Galton, The Art of Travel (London: John Murray, 1883).
2. Henry Clews, Twenty-Eight Years in Wall Street (New York: J. S. Ogilvie, 1887).
3. “Heretics’ Almanac, 1986–96,” Economist (December 20, 1986).
4. Julian Simon, The Ultimate Resource 2 (Princeton, NJ: Princeton University Press,
1996).
5. Dean Keith Simonton, Genius, Creativity, and Leadership: Histriometric Inquiries
(Cambridge, MA: Harvard University Press, 1984).
6. Andrew Orlowski, “Monday Night at the Single’s Club? Apple’s Real People.
The Register (June 17, 2002). Available from http://www.theregister.co.uk
/content/35/25750.html.
7. Jacques Barzun, From Dawn to Decadence: 500 Years of Western Cultural Life, 1500
to the Present (New York: HarperCollins, 2000).
8. Marcia Vickers and Mike McNamee, “The Betrayed Investor,” BusinessWeek (Feb-
ruary 25, 2002).
nied_z02bnotes.qxd 1/24/03 10:45 AM Page 376

377
I N D E X
AARP magazine (Modern Maturity), 134Abbott Laboratories, 146, 147Abelson, Alan, 15, 36, 115–132, 178
appeal to fear in columns of, 121–122career, 119–121and the Dow (1989–2001), 131interview with, 119–121propaganda and pseudo-science in
columns of, 122–125selections from “Up and Down Wall
Street” (1990–1999), 126–129on statistics, 120why people believe, 124
Acampora, Ralph, 72Accounting:
acquisition, 56, 157, 161auditors, change of, 57double-entry bookkeeping, 316Enron practices, 66, 136, 175, 320, 338frauds, 28, 161, 325 (see also Earnings
propaganda)pooling of interest, 157practices obscuring company’s
financial health, 55–58stock options, 57timing of method switch, 57
Accounts receivable, inventory and, 57,315, 329–332, 334, 336
Acquisitions:accounting, 56, 157, 161advice from Grossman, 161–162performance and, 157, 159–160
Active Trader magazine, Internet store,75
Adelphia, 41Aether Systems, 166–167Aggregation, fallacy of, 63, 203AIG, 338Akerlof, George, 308Albert, Jim, 81Alcoa, 150Alekhine, Alexander, 281Alexander, Barry, 262Alexrod, Ivan, 45Allergan, 83Allstate, 146Amazon.com, 29, 142, 155, 330American Greetings, 83Analysts, Wall Street, 30, 67–69Anderson, T. W., 200AOL Time Warner, 146Apple Computer, 83, 164Applied Performance Strategies Inc.,
190Arms, Richard (Arms Index/TRIN),
90–92, 93, 111–113
nied_z03bindex.qxd 1/24/03 10:43 AM Page 377

378 Index
Arthur Andersen, 41, 338Asia:
markets diving in, 24, 26, 27skyscrapers, 149Thailand, 2, 7, 26, 249
Asset impairment charges, 57Asymmetric information, 298, 308–309Attenborough, David, 336Auditors, change of, 57Ax, 100
Bacon, Francis, 265Bacon, Robert L., 20, 348–349Balanced portfolio (Devil’s definition),
345Bandwagon, 62, 103, 123Bankers Trust, 28Bargaining, 18, 291–299
keeping doleful mien, 297picking time/place, 295–297value of information, 297–298watching costs, 294–295
Barnaby, Jack, 361Barron’s, 36. See also Abelson, AlanBarzun, Jacques, 360Baseball, 17, 235–245
Home Run Indicator, 236–240new century, new game, 240–242timeline, and financial markets
(1792–2001), 243–245Beachem, John, 40Bendix, 163Bennett, Jay, 81Bentley College, 108Bergstrom, Theodore C., 296Berkshire Hathaway, 34, 40, 148, 167Berman, Susan, 325–326Bernhard, Arnold, 221Bezos, Jeffrey, 29, 155Biggs, Barton, 127, 128Biomet, 146Biotechnology, 18, 301–312
drug trials (Niederhoffer-Kenner-Zhang), 309–311
examples of deadly FDA delays, 306invisible victim, 304–306memes, 35old phase 2, 303–304profit from asymmetry, 308–309trader’s apprentice, 304trial, 306–308
Bisguier, Art, 99, 283, 290Black, Fischer, 224Blair, Tony, 35, 40Bleiberg, Robert, 120Blodget, Henry, 67, 68, 69Boards of directors, celebrities on,
162–163Boastful 13 study, 142–146, 164. See also
HubrisBodie, Zvi, 105Bond, John Reginald Hartnell, 163Bonuses, 30Books, recommended, 342, 361–365
Invasion of the Body Snatchers (Finney),1, 2, 5, 13, 335, 362–365
Triumph of the Optimists (Dimson,Marsh, and Staunton), 17, 76, 77,82, 206–216, 320, 362
Boyle, Patrick, 298–299, 358Bronstein, David, 182–185Brueggeman, William B., 253Buffett, Mary, 29–30Buffett, Warren:
acquisitions, 167, 169arrogance vs. humility, and, 148–149influence of, 272memes, 29–30, 34, 37, 38, 40technical analysts invoking name of
(trend-following), 103trading costs, 294on Wright brothers, 29, 148–149
Bullish/bearish, 3Burton, Sarah, 335Bush, George W., 37–38, 41, 242Buybacks, 315, 317–319, 336, 337Buying opportunity (Devil’s definition),
345
Cabot Market Letter, 75Calpine, 83Campbell, Donald, 351Campbell, Kirsten, 68Candlesticks, 85–90Cane awards, 343–344Capitalizing costs, 56Card stacking, 62, 103, 123, 175Carstens, Henry, 351Casanova, Giacomo, 248Cash indicators, 325–326Cash money, 316–317, 329–330Cawkwell, Simon, 74
nied_z03bindex.qxd 1/24/03 10:43 AM Page 378

Index 379
Celebrity, 147–148, 162–163Celera, 35, 40–41Cendant, 83Century as time frame, 2–3, 4, 17, 206Cerent, 138CGNU, 163Chambers, John, 133, 136, 137–139Champion International, 338Chande, Tushar, 91Chart patterns, 73, 75. See also Technical
analysis“Cheat the Prophet,” 349Chicago, University of (Center for
Research in Securities Prices),205–206, 304, 342
Choi, James J., 225Chrysler, 155Chutzpa, 140–141Cigna, 338Circuit City, 83, 146, 147Cisco Systems, 58, 133, 134, 136, 137–139,
142, 164, 332Classification system. See Value Line
classification system for stocksClews, Henry, 344Clinton, Bill, 25–26, 27, 35, 37, 40CMGI Inc., 156Cohen, Abby Joseph, 67Coker, Duncan, 297, 354–355Colby, Robert, 91Collins, James C., 146–148Column, Kenner/Niederhoffer, 9–14Compaq Computer, 156Composition, fallacy of, 63Compustat, 76, 333–334Computer Associates, 66, 146Confidence vs. hubris, 140–141Conseco, 156Conservation, laws of. See Market
thermodynamicsContinental Airlines, 143, 145–146Contrarian (Devil’s definition), 345Conway, Flo, 121Cooling, law of (and principle of ever-
changing cycles), 349Core earnings, 57–58Correction (Devil’s definition), 345Correlations, 16, 187–203
avoiding fallacious conclusions,198–203
“Basinstoke,” 203
covariance, 193–196error of omission (the missing third
variable), 200–201error of randomness, 199–200fallacy of aggregation, 203fallacy of mobility, 201–202negative, 46scatter plots, 189–193spurious, 20, 203workhouse equation, 196–198
Cost(s):corporate accounting (capitalizing/
timing), 56trading, 294–295
Costco Wholesale, 146Crises, avoiding, 286Cross-pollination, 265Cults, 117, 121Curtice, Harlow Herbert, 155Cycles:
ever-changing, 20, 69, 82, 288,348–352
real estate, stocks, and, 253–256Cymbalista, Flavia, 136
Damodaran, Aswath, 58Daniels, Peter, 355–358Databases:
Compustat, 333–334first, of daily prices of U.S. stocks,
205–206Davies, Nigel, 148, 184Dawes, Robin M., 198Dawkins, Richard, 31Dean, Dizzy, 148Deception, 98–101, 335Deduction (element of scientific
method), 118Defog, Daniel, 94De La Vega, Joseph, 291Dell, 83, 143Delta Air Lines, 143DeMark, Thomas, 74de Maupassant, Guy (“The Horla”), 15,
23, 32Dennis, Richard, 102De Rougement, Louis, 335Desaulniers, Mike, 284–285Devil’s Stock Market Dictionary (Staricka),
excerpts, 345–346Dickson, Paul, 242
nied_z03bindex.qxd 1/24/03 10:43 AM Page 379

380 Index
Dimson, Elroy. See Triumph of theOptimists (Dimson, Marsh, andStaunton)
Diversification, entropy and, 278Dividends:
Devil’s definition, 345as earnings quality indicator, 315, 317,
319–325Dixit, Avinash, 81Dokko, Yoon, 248–249Double-entry bookkeeping, 316Dow:
Abelson vs. (1989–2001), 131performance study of companies on,
334Dow, Charles, 93, 102Dreman, David, 27Druckenmiller, Stanley, 35Drug stocks, 301–312Dunn, Bill, 102Durant, Will and Ariel, 231Dynegy, 320
Earnings imposters, 18, 313–339cash indicators, 325–326cash money, 316–317, 329–330Compustat confusion, 333–334Dow study, 334recognizing, 315
dividends, 315, 317, 319–325inventory and accounts receivable,
57, 315, 329–332, 334, 336stock buybacks, 315, 317–319, 336, 337system for, 335–339taxes, 315, 326–329
Earnings propaganda, 15, 43–70. See alsoPropaganda
escalation of “hide-and-seek,” 65–66false axioms about earnings, 43–44irrational ratios, 50–59practices obscuring company’s
financial health, 55–58reasons for persistence of false beliefs,
62–65ecological fallacy, 63–64fallacy of aggregation, 63fallacy of composition, 63
spotting, 55–58student questioner, 59–60techniques, 60–62testing the beliefs, 46–50
Ease of Movement indicator, 93Echostar, 142Eckett, Stephen, 74Ecological fallacy, 63–64Education of a Speculator, The
(Niederhoffer), 6, 11, 16, 36, 200,355
Egan, Bill, 49–50Einstein, Albert, 103, 140, 265, 268Eisenberg, Howie, 8Eisenstadt, Sam, 17, 170–171, 221–222,
231–233Electrolux, 146Eleswarapu, Venkat, 76Endgame (taking profits), 290Energy. See Market thermodynamicsEnriques, Juan, 301Enron:
accounting practices, 66, 136, 175,320, 338
bankruptcy/downfall, 39, 41, 66, 134,156, 363
executives’ hubris, 4, 134, 137magazine cover indicator, 155skyscraper indicator, 149stadium indicator, 155–156stock performance, 39, 83, 142
Entropy. See Market thermodynamicsEquity (Devil’s definition), 345Error of omission (the missing third
variable), 200–201Error of randomness, 199–200Escovedo, Glenn, 88, 89Exchanges, number/value of seats, 276Executive arrogance. See HubrisExperts, source of, 18, 341, 343–348
Faber, Marc, 74Fabrikant, Geraldine, 6Fallacy:
of aggregation, 63, 203of composition, 63ecological, 63–64of mobility, 201–202
Fannie Mae, 146, 147Farley, Alan, 74Farrell, Robert, 125–129, 130“Fatal conceit,” 215FDA (Federal Drug Administration)
approval process, 301–312Fear, 121–122
nied_z03bindex.qxd 1/24/03 10:43 AM Page 380

Index 381
Federal Reserve, 34, 35, 36, 359. See alsoGreenspan, Alan
Feedback, 122Fels, Paul, 318Fessant, Alain, 267Festinger, Leon, 117–118Feynman, Richard, 264Fibonacci, Leonardo Pisano, 101Fidelity, 100, 143Financial health. See Earnings
propagandaFine Art of Propaganda, The, 61–62, 102Finn, Jeremy D., 200Finney, Jack (Invasion of the Body
Snatchers), 1, 2, 5, 13, 335, 362–365Fiorina, Carly, 137Fischer, Bobby, 286Fisher, Jeffrey D., 253Fisher, Kenneth L., 52, 54Fishing, lessons from, 352–358Ford Motor Co., 320Forecasters, new, 207–215Fosheim, Jon, 261Fowler, William Worthington, 130Franchise (Devil’s definition), 345Frankl, Viktor, 42Friction and heat dissipation, 276–277Fried, David, 318Friedman, Milton, 306Fruit of the Loom, 156
Galbraith, John Kenneth, 220Galton, Francis, 187, 189, 341, 348Games. See Sports/gamesGates, Bill, 30, 294Gateway, 83, 142, 143Geico, 169Genentech, 142General Electric:
earnings comparisons, 175executive hubris, 163, 164magazine cover indicator, 155meeting earnings expectations by
selling a company (2002),337–338, 339
reporting/accounting practices,28–29, 58, 66
selected financial figures for 2001 and2000, 317
Six Sigma, 190skyscraper indicator, 154
General Motors, 156Genomes, 35, 40George, Henry, 247, 248, 254, 255Getty, J. Paul, 294Gilder, George, 215Gillette, 146, 147Gilovich, Thomas, 80, 104GlaxoSmithKline, 163Glittering generality, 62, 102–103, 123Global Crossing, 39, 41, 325Global-Investor Book of Investing Rules,
The: Invaluable Advice from 150Master Investors, 74
Global Systems funds, 6Goldberg, Ray A., 301Goldcamp, James Cornelius, 347Golden Fleece Award, 122Goldman Sachs, 28, 100Goodrich, 320Goodwill (Devil’s definition), 345Gore, Al, 40, 41Gould, Jay, 292Graham, Benjamin, 16, 44–45, 69,
165–172, 202mythical quality in personal life, 172Rea-Graham fund, 45, 169, 170,
202value investing, 166–168
Granville, Joseph, 73Greenspan, Alan, 18, 358–361
hubris, 36“irrational exuberance,” 14–15, 24–25,
26, 35, 40, 50, 259, 271, 357media and, 174–175memes and, 24, 32–34, 358–361real estate and, 259returning basketball shoes, 36World trade center attack meme,
358–361Zeckhauser on, 33
Green Street Advisors, 258, 261Groom, Winston, 45–46Gross, Bill, 322Gross, Ed, 139Grossman, Dan, 161–162Grove, Andy, 155Growth vs. value, 171, 172Grubman, Jack, 30Grubman, Richard, 66Grulon, Gustavo, 318Guaranteed Known Thing (GKT), 101
nied_z03bindex.qxd 1/24/03 10:43 AM Page 381

382 Index
Hamel, Gary, 66Han, Jun, 251Hastie, Reed, 198Hayek, Friedrich, 215, 343Hays, Don, 90Head-and-shoulders, 94, 95–97Henry, John W., 102Heyne, Paul, 12, 33, 281–282Hill, Henry, 17, 230–231Hitchings, George, 306Hochberg, Yusef, 200Hoffman, Alan, 230Hogan, Marty, 282Home Run Indicator, 236–239. See also
BaseballHoodoo Man, 355–356Hovland, Carl, 121Hoyt, Homer, 254HSBC Holdings, 163Huberman, Gur, 229Hubris, 15–16, 133–164
arrogance of power, 133–134Boastful 13, 142–146celebrity and, 147–148, 162–163chutzpa, 140–141“did you summit?,” 139–140examples, 36, 137–139executives’ telling stories analysts want
to hear, 136–137vs. humility, 146–149magazine cover indicator, 154–155meme, 363performance study, 142–147quantifying effects of, 142–146skyscraper indicator, 149–154stadium indicator, 155–156, 158
Hughes, Sara, 339Hulbert, Mark (Hulbert Digest), 224,
277–278, 318Human Genome Sciences, 142, 143Humble companies, 146, 148–149Hunt’s Merchant’s Magazine, 361–362Hussman, John, 129Huxley, Thomas Henry, 173
IBM, 66, 137–138, 153, 338Icarus, 135–136Icons, explanation of (five broad
themes), 19–20count/count/count (pencil/envelope),
19
ever-changing cycles (racehorse), 20law of ever-changing cycles (Bacon),
20propaganda (Mr. Moneybags), 19spurious correlations (pair of storks),
20untested propositions (wizard’s hat),
19Idea transfers, 266–267Idec Pharmaceuticals, 142Idenberry, David, 318“If” (Kipling), 7–8Illusion of control, 58–59Illusion of validity, 58Induction (element of scientific method),
118Information:
asymmetrical, 308–309incremental, 228value of, in bargaining, 297–298
Insider buying, 309, 310Institute of Propaganda Analysis, 61–62,
102Intel, 84, 155Interest rates (Devil’s definition), 345Internet Capital Group, 69Invasion of the Body Snatchers (Finney), 1,
2, 5, 13, 335, 362–365Inventory and accounts receivable, 57,
315, 329–332, 334, 336Investing Rules, 111Invisible hand, 168, 265IPO (initial public offering):
Devil’s definition, 346source of money for, 273–274
“Irrational exuberance,” 4, 14–15, 24–25,26, 35, 40, 50, 259, 271, 357
Isidore, Chris, 156
Jackson, Stonewall, 99Jackson, Thomas Penfield, 35, 40, 41James, Bill, 240–241Janus, 100Jenks, Philip, 74Johnson & Johnson, 83–84
Kahneman, Daniel, 84, 88, 104Kaiser, Ronald, 252–253, 254, 260–261Kandel, Shmuel, 229Kane, Gordon, 263Kant, Immanuel, 20, 199
nied_z03bindex.qxd 1/24/03 10:43 AM Page 382

Index 383
Kaplan, Robert S., 229Keech, Marian, 117Keeley, Steven “Hobo,” 282, 297Kelman, Herbert, 121Kenner, John, 249Kimberly-Clark, 146, 147Kipling, Rudyard (“If”), 7–8Kira Equation, 263–264, 269–271KKR, 162Kmart, 162Knight, Martin, 349Know Sure Thing (KST) indicator, 101Kohn, Ken, 27Kondratief (Devil’s definition), 346Koresh, David, 121Kozlowski, Dennis, 39KPMG Consulting, 143Kreicas, Leonard, 278Kroger, 146, 147Kroll, Stanley, 91Krugman, Paul, 154Kuhn, Thomas, 15, 264, 265
Lackey, James, 100, 351–352Lakonishok, Josef, 318Lamberg, John, 90, 100–101, 352–354Lambert, Johann Heinrich, 101Lambert, John, 94Lasagna, Louis, 306Lay, Kenneth, 137, 154, 164, 309Least squares regression analysis, 197,
222Lebrecht, Norman, 297Leeds, Larry, 64–65Leibovich, Mark, 138–139Lenin, 29Levitt, Arthur, 28, 338Levy, Haim, 55Lewellen, Jonathan, 82Lewinsky, Monica, 27Lewis, Michael, 141Liang, Youguo, 251, 254Lies, 173, 175–176, 338Limit orders, 275Linux (Devil’s definition), 346LitWick.com, 86Lloyds of London, 150Lo, Andrew, 333Lockheed Martin, 146Lockup expiration (Devil’s definition),
346
Loews Corporation, 37London Business School, 207, 208Longman, Roger, 303Long-Term Capital Management, 6, 28,
142Loomis, Carol, 28, 338Lorie, Jim, 304–305, 306Lowe, Janet, 168LTV, 136Lucent, 83, 134, 137, 138, 142–144, 163Lutzius, John, 261–262
Magazine cover indicator, 154–155Magic T formula, 72Malone, Michael S., 307Malzer, Ron, 198–199Mankiw, N. Gregory, 297Market experiments vs. market feel,
264–267Market Facilitation Index, 103Market makers, 100Market News-O-Matic, 176–179Market orders, 275Market Technicians Association, 72, 75Market thermodynamics, 17, 263–279
law of conservation of energy,268–274
variation 1: the Kira equation,263–264, 268–270
variation 2: disappearing money,270–272
variation 3: where does money forIPOs come from, 272–273
variation 4: transformation ofenergy, 274
law of entropy, 275–279variation 1: maximization of
transfers, 275–276variation 2: friction and heat
dissipation, 276–277variation 3: sector rotation and
maximum entropy production,277–278
market experiments vs. market feel,264–267
money as energy, 267–268Markman, Jon, 259, 295Marsh, Paul. See Triumph of the Optimists
(Dimson, Marsh, and Staunton)Marshall, Alfred, 168Martin, Alix, 208–209, 213, 214
nied_z03bindex.qxd 1/24/03 10:43 AM Page 383

384 Index
McLane, Drayton, 155McNabb, Mark M., 347, 352–354Mean reversion, 77Media/news stories, 16, 173–179
harmfulness of, 175–176headlines inducing fearfulness/
hysteria, 1–4“hide-and-seek escalation” (corporate
earnings propaganda), 65–66hubris stories, 135Market News-O-Matic example,
176–179National Enquirer, 135
Medimmune, 142Meditz, Al, 242Meeker, Mary, 30Meir, Golda, 146Melcher, Jamie, 290Memes, 14–15, 23–42
defined, 31–32examples, 31, 36, 311, 358–361timeline (1996–2002), 40–41
1996, 23–251997, 25–271998, 27–281999, 28–312000, 31–362001, 36–382002, 38–39
Mendeleyev, Dmitri Ivanovich, 217, 220Merrill Lynch, 67–69, 125, 259Mewborn, C. Ronald, 121Meyer, Julius Lothar, 217Meyers, Thomas, 91Michaely, Roni, 318Microsoft:
antitrust suit, 27, 35, 40, 41shares, 26, 27, 30, 84
Mitchell, William J., 149, 150–151Mitsuda, Shui, 88Mobility, fallacy of, 201–202Momentum pendulum, 81–82, 85Momentum play (Devil’s definition), 346Money as energy. See Market
thermodynamicsMotorola, 329–339Munger, Charlie, 38, 167Murphy, John, 74Murphy’s Law and Market Anomalies,
82Muthoo, Abhinay, 296
Nalebuff, Barry, 81Name calling, 62, 102, 123NASA (Internet traffic record), 26Nasdaq bubble, 359National Association of Real Estate
Investment Trusts (NAREIT),250–251, 252, 253
National Enquirer, 135Negative correlation, 46Negotiating. See BargainingNewbegin, John, 149Newlands, John A. R., 221New York Stock Exchange (NYSE):
baseball’s timeline and, 243–245number/value of seats, 276
Nicolson, Harold, 136Niederhoffer, Arthur, 8, 12, 15–16, 141,
339Niederhoffer, Galt, 164Niederhoffer, Katie, 166–167Niederhoffer, Kira, 17, 301–302Nison, Steve, 85, 89–90Nock, Albert Jay, 30–31Nortel, 138Novell, 83Nucor, 146, 147Number Cruncher Statistical System,
190Nvidia Corporation, 329–330
Observation (element of scientificmethod), 118
O’glove, Thornton L., 58Ogukuo Nirrus, 146Olympics scandal, 339Omega, 28Omission, error of (missing third
variable), 200–201Oracle, 164Orders, types of (and energy forms),
275Orlowski, Andrew, 359Osborne, M. F. M., 285Osborne Computer, 136O’Shaughnessy, James P., 202Osler, Carol, 95–96Outside magazine, 139
Packard Motor Car, 136Park, Robert L., 104Parker, Jerry, 102
nied_z03bindex.qxd 1/24/03 10:43 AM Page 384

Index 385
Particle finance, 267Pataki, George, 245Pathak, Bipin, 184Pearson Product Moment correlation
coefficient, 196–198Pendulum, momentum, 81–82, 85Penny stocks (Devil’s definition), 346PepsiCo, 156Periodic table of investing. See Value
Line classification system for stocksPerkinElmer, Inc., 83Peter, Laurence J., 220Philip Morris, 147Phrenology (Devil’s definition), 346Physical laws. See Market
thermodynamicsPiel, Gerard, 217Pitney Bowes, 146, 147Plain folks, 62, 103, 123Pooling of interest accounting, 157Pope, Alexander, 34Portfolio (Devil’s definition), 346Powergen plc, 163Priceline.com, 142, 144PricewaterhouseCoopers study, 258Primitivism, 359–361Princeton Review technique, 105–107Pring, Martin, 101Profits, taking, 290Propaganda. See also Earnings
propaganda:in Abelson columns, 122–125headlines and, 3–4icon (Mr. Moneybags), 19Institute of Propaganda Analysis,
61–62, 102scientific method as antidote, 4 (see
also Science/scientific method)in technical analysis, 101–105techniques (seven basic):
bandwagon, 62, 103, 123card stacking, 62, 103, 123, 175glittering generality, 62, 102–103,
123name calling, 62, 102, 123plain folks, 62, 103, 123testimonial, 62, 102, 123transfer, 62, 103
Proxmire, William, 122PSINet, 156Puzo, Mario, 43, 45, 79–80
Qlogic, 142Qualcomm, 156Quantum, 28Qwest Communications, 320–321
Rally (Devil’s definition), 346Randomness:
error of, 199–200vs. predictability (of stock market),
350Rational Software, 144Rea-Graham fund, 45, 169, 170, 202Real estate, 17, 247–262
bearish call, and response, 256–260business cycles, stocks, and, 253–256promoting REITs, 249–251REITs vs. stocks, 251–253shifting ground, 261–262tax benefits, 249untimely optimism, 260–261warning signs, 258
Recency effect, 260Regression analysis, 47, 197, 222Reinganum, Marc, 76Replicating entity. See MemesReserves/storehouse, 57Restructuring charges, 56Returns, future, 17, 205–216
controversy over, 214–215forecasters, new, 207–215second opinion, 215–216variations for improving, 208
1: a stumble, a skip, and a jump,209–211
2: lucky 5, 211–2133: limits of leverage, 213–214
Reversing, 288Ricardo, David, 248, 254Risk, 12–13, 283, 358Ritter, Larry, 236RJR Nabisco, 162, 163Robinson, Adam, 106Rogers, Ronald W., 121Roll, Richard W., 161Rooney, Brian, 30Rosenberg, Joe, 128Round numbers, 299Rubin, Robert, 37Ruff, Howard, 120Russell, Dick, 126Russia, 27, 29, 126
nied_z03bindex.qxd 1/24/03 10:43 AM Page 385

386 Index
Saad, Hany, 81, 92–93Sales activities, timing, 56Sanford, Charles, 267Savvis Communications, 156Scatter diagrams, 14, 189–193
and correlations (see Correlations)creating, 190–193enhancing, showing path of a time
series, 198examples, 47, 48, 49, 52, 54, 78, 79uses of, 46, 51, 189, 197, 198
Scharack, Frederick C., 207–208Scheling, Thomas C., 296Schilit, Howard, 58Schwabacher, Patricia K., 319Schwager, Jack, 73Schwartz, Martin “Buzzy,” 72Schwinn, 136Science/scientific method, 4, 107, 118,
205, 264–267Scott Paper, 142, 163Sears, Richard, 214–215Sector rotation, 277–278Self-correcting mechanisms, 122–123Shell, Richard, 292–293Sherden, William A., 229Shermer, Michael, 125, 130Shiller, Robert, 35, 37, 41, 50–53, 59–60Siebel Systems, 164Siegel, Jeremy, 27Siegelman, Jim, 121Signals required before buying (three-
signal monte), 336–339Silicon Investor Web site, 67Sills, Steven, 45Simon, David, 108Simon, Julian, 349–350Simonton, Dean Keith, 351Siskind, Don, 150Six Sigma, 190Skilling, Jeffrey, 4, 66Skyscraper indicator, 149–154Slovic, Paul, 84, 88Smith, Adam, 33, 168, 265Smith, Gary, 81Smithers, Andrew, 128Sobel, Robert, 136Soros, George, 6, 32, 35, 103, 294, 342,
356SpecList, 348Spence, Michael, 308
Spencer, Herbert, 268Spitzer, Eliot, 68–69, 314Sports/games:
baseball and the stock market (seeBaseball)
board games and deception, 99chess, 88, 99, 148, 181–185, 286,
361fishing, lessons from, 352–358hunting for humble executives like
sports figures examples, 146streaks, 79–81survival principle in chess, 181–185tennis (see Tennis/racquet sports,
practical market lessons from)Sprint, 66, 142, 144Stadium indicator, 155–156, 158Standard & Poor’s (S&P):
core earnings measure, 57–58S&P 500 membership, and real estate,
258–259Staricka, Don (Devil’s Stock Market
Dictionary), excerpts, 345–346Statman, Meir, 52, 54Staunton, Mike. See Triumph of the
Optimists (Dimson, Marsh, andStaunton)
Steenbarger, Brett:cane award to, 344–345children, 345, 355on ever-changing cycles, 350–351on illusion of control, 58–59on memes, 365–366on music and stock market, 344on source of market triumphs, 205on SpecList, 347–348on TRIN, 90, 111–113
Stewart, Martha, 142, 143, 162Stigler, George, 298, 305Stigler, Steve, 19, 201, 298Stiglitz, Joseph, 249, 308Stochastic calculus, 60Stock buybacks, 315, 317–319, 336, 337Stock market:
best/worst stocks of 2000, 83century as time frame, 2–3, 4, 17,
206classification system (see Value Line
classification system for stocks)disconnected facts about, 219exchange seats (number/value), 276
nied_z03bindex.qxd 1/24/03 10:43 AM Page 386

Index 387
humorous definitions (excerptsStaricka’s Devil’s Stock MarketDictionary), 345–346
last time down three years in a row, 4list of things commonly thought to
directly/inversely influence,187–188
predictability vs. randomness of, 350predictive connection, stocks and
bonds, 269–270relations known about stocks,
219–220Wall Street analysts, 30, 67–69
Stock options, 57Stop loss (Devil’s definition), 346Storehouse (relying on reserves), 57Storks, 199, 200, 201Streaks, 79–81, 85Super Bowl Indicator, 200, 237Supply and demand (Devil’s definition),
346Survival principle, 181–185Survivorship bias (value stocks), 202Swing system, 109Sympathy (Devil’s definition), 346
Taking profits, 290Tamhane, Ajit, 200Tannous, Charbel, 267Tax(es):
accounting, 326corporate taxpayers (lowest/highest),
327, 328as earnings quality indicator, 315,
326–329real estate benefits, 249
Taylor, James, 10–11Taylor, Louis W., 260Technical analysis, 15, 71–113
candlestick patterns, 85–90deception and, 98–101error of randomness, 199–200head-and-shoulders pattern, 93–97humorous definition of, 346indicators (testing/using), 341,
342–343momentum pendulum, 81–82, 85pendulum vs. streak, 85persistence of belief in, 105Princeton Review technique, 105–107propaganda aspects of, 101–105
streaks in sports, 79–81trend following, 74–79, 82–85TRIN, 90–92, 111–113VIX indicator, 107–110volume, 92–93
Tellabs, 329Tennis/racquet sports, practical market
lessons from, 17–18, 70, 281–290before the game, 282–285
deciding how much risk you willtake, 283
having backup equipment, 284–285having a game plan, 284having sufficient stamina, 284picking your spots, 282–283
during the game, 285–290attacking on both sides, 288being aware of changing cycles, 288coming up front, 287hitting them on the half-volley, 287maintaining a strong base of
operations, 285–286not creating crises, 286picking up the pace, 288–290winning the first point, 285
endgame, 290Terrorism:
1998 embassy bombings, Africa, 27,40
1998 threats by Osama bin Laden, 272000 attack on USS Cole, 412001 (9/11 attacks), 37, 38, 39, 41, 59,
150, 152, 242, 256, 308, 358–361Testimonial, 62, 102, 123Thailand, 2, 7, 26, 249Thermodynamics. See Market
thermodynamicsThomas, Jacob, 330–3333Com, 156Tice, David, 36Tierney, Jack, 279Tiger, 28Time frame (returns), century as, 2–3, 4,
17, 206Timeliness system, 223, 224, 225,
226–227, 228, 230Time’s Person of the Year awards, 155Timing, corporate:
accounting method switch, 57costs, 56sales activities, 56
nied_z03bindex.qxd 1/24/03 10:43 AM Page 387

388 Index
Tisch, Lawrence, 37Torto Wheaton, 254, 261Trading:
bargaining tips, 18, 291–299complexity in systems for, 350–351costs, 294–295lessons from fishing, 352–358lessons from tennis (see Tennis/
racquet sports, practical marketlessons from)
signals required before buying (three-signal monte), 336–339
variations for improving returns, 2081: a stumble, a skip, and a jump,
209–2112: lucky 5, 211–2133: limits of leverage, 213–214
Transfers(s):idea, 266–267maximization of, 275–276propaganda technique, 62, 103
Transocean, 320Trend following, 10, 73, 74–76, 79–81,
111, 288TRIN, 90–92, 111–113Triumph of the Optimists (Dimson,
Marsh, and Staunton), 17, 76, 77,82, 206–216, 320, 362
Turing, Alan, 16, 178Turnaround play (Devil’s definition), 346Turner, Ted, 155TurtleTrader, 102Tuypens, Bjorn, 60Tversky, Amos, 84, 88, 104TWA, 156Tyco, 39 , 41, 66
Untested propositions icon (wizard’shat), 19
Validity bias, 88Value Line classification system for
stocks, 14, 17, 217–233critics of, 229–230practical value of, 222–225subscriber’s success story, 230–231technical ranking, 225–228timeliness system, 223, 224, 225,
226–227, 228, 230
Value Line research data, 169–172Value play (Devil’s definition), 346Value stocks:
dismal performance of, 169–172vs. growth, 171, 172performance testing, 168–169survivorship bias, 202
Van, Don, 94Veeck, Bill, 242Venter, Craig, 35, 40–41Verification (element of scientific
method), 118Vermaelen, Theo, 318Vinocur, Barry, 259Volatility Index (VIX), 107–110Volume:
as proxy for volatility, 112technical analysts and, 92–93
Von Senger, Harro (The Book ofStratagems), 88–89
Walgreen, 146, 147Walker, Helen, 201Wall Street analysts, 67–69Wal-Mart Stores, 146Weil, Roman L., 229Welch, Jack, 28–29, 37, 338Wells Fargo, 146, 147Weyerhaeuser, 146Wheaton, William, 261White Mountains Insurance, 146Whitney, R., 244Wiggins, Roy A. III, 108Williams, Bill, 103Winstars, 142Wisdom, Steve, 294Wiswell, Tom, 99WorldCom, 39, 41, 83, 134, 325, 338World Trade Center attacks. See
TerrorismWyckoff, Richard, 361–362
Yahoo!, 83Young, Owen, 155
Zeckhauser, Richard, 33, 343Zhang, Huai, 330–333Zhang, Shi, 97, 304, 310Zulauf, Felix, 128
nied_z03bindex.qxd 1/24/03 10:43 AM Page 388