nicola duell & céline thévenot - oecd.org · participants in internship programme by...
TRANSCRIPT

Nicola Duell & Céline Thévenot


FACES OF JOBLESSNESS IN PORTUGAL: MAIN RESULTS AND POLICY INVENTORY© OECD 2017 5
TABLE OF CONTENTS
1. INTRODUCTION AND MOTIVATION ................................................................................................ 8
2. FACES OF JOBLESNESS IN PORTUGAL ......................................................................................... 10
2.1. Labour-market and social context ................................................................................................... 10 2.2. Target groups for activation and employment-support policies ...................................................... 11 2.3. Employment barriers: Summary of empirical results ..................................................................... 14
3. ACTIVATION AND EMPLOYMENT-SUPPORT POLICIES IN PORTUGAL:
OVERALL POLICY STANCE .............................................................................................................. 19
4. OVERCOMING EMPLOYMENT BARRIERS:
POLICY CHALLENGES AND PRIORITIES FOR SELECTED GROUPS ......................................... 40
CONCLUSIONS ........................................................................................................................................... 61
REFERENCES .............................................................................................................................................. 63
ANNEX 1: LATENT CLASS RESULTS FOR PORTUGAL ..................................................................... 66
Tables
Table 1. Risk of poverty or social exclusion ....................................................................................... 11 Table 2. Employment barrier indicators .............................................................................................. 15 Table 3. Potential targets of activation and employment-support policies .......................................... 17 Table 4. Main out-of-work benefits in Portugal: entitlement rules, amounts and duration ................. 21 Table 5. Education levels of ALMP participants ................................................................................. 35 Table 6. Participants in adult education by programme and educational level in 2015 ...................... 45 Table 7. Participants in targeted employment incentive programmes by education level in 2015 ...... 45 Table 8. Age structure of participants in ALMPs in 2015 ................................................................... 54 Table 10. Participants in internship programme by educational level in 2015 ...................................... 59 Table A1.1. Latent class estimates ........................................................................................................ 66 Table A1.2. Characterisation of the latent groups ................................................................................. 67 Table A1.3. Characterisation of the latent groups (cont.)...................................................................... 69
Figures
Figure 1. Employment rates: mild recovery from the crisis .................................................................. 10 Figure 2. Trends of population groups with potential labour market difficulties ................................. 13 Figure 3. Size and composition of the population with labour market difficulties ............................... 14 Figure 4. Employment barriers in Portugal ........................................................................................... 16 Figure 5. Number of simultaneous barriers faced by individuals ......................................................... 16 Figure 6. Share of individuals facing multiple simultaneous employment barriers .............................. 18 Figure 7. Recipients of earnings replacement benefits ......................................................................... 20

FACES OF JOBLESSNESS IN PORTUGAL: MAIN RESULTS AND POLICY INVENTORY© OECD 2017 6
Figure 8. Out-of-work benefits for working-age adults – expenditure ................................................. 20 Figure 9. Accessibility of unemployment benefits in Portugal ............................................................. 22 Figure 10. Income levels provided by cash minimum income benefits .............................................. 24 Figure 11. Work disincentives for out-of-work working-age adults ................................................... 24 Figure 12. Spending on active labour market programmes by policy area ......................................... 26 Figure 13. Reliance on Public Employment Service among recent job starters ................................. 28 Figure 14. Reliance on Public Employment Service among current registered jobseekers ................ 28 Figure 15. Participation in active labour market programmes in Portugal and in other countries ...... 29 Figure 16. Balance between different activation policy measures ...................................................... 33 Figure 17. The incidence of long-term unemployment, 2000 to Q3 2015 .......................................... 36 Figure 18. Incidence of temporary employment ................................................................................. 39 Figure 19. Strictness of employment protection legislation................................................................ 39 Figure 20. Net replacement rate for long term unemployed ............................................................... 42 Figure 21. The role of Public Employment Service in job finding and access
to lifelong learning: Group A ............................................................................................ 43 Figure 22. Low, but improving education levels in Portugal .............................................................. 44 Figure 23. Self-perceived severe long-standing limitations in usual activities
due to health problem in Portugal ...................................................................................... 47 Figure 24. Expenditure on disability benefits and paid sick leave ...................................................... 48 Figure 25. Youth not in employment, education or training (NEET) ................................................. 49 Figure 26. Twelve months of work experience bring entitlements to unemployment insurance
benefits, but the duration of benefit payments is often short for young people ................ 50 Figure 27. Accessibility of minimum-income support for young people is limited ........................... 51 Figure 28. Few young people are covered by family benefits in Portugal.......................................... 51 Figure 29. Benefit receipt and PES registration among young jobseekers ......................................... 52 Figure 30. The role of Public Employment Service in job finding and access
to lifelong learning: Group B ............................................................................................. 52 Figure 31. Early school leaving has declined but remains high .......................................................... 53 Figure 32. Incidence of temporary employment among 15-24 in Portugal ........................................ 57 Figure 33. Duration of unemployment benefits by age in Portugal .................................................... 58 Figure 34. The role of Public Employment Service in job finding and access
to lifelong learning: Group C ............................................................................................. 59
Boxes
Box 1. Population groups with potential labour market difficulties (target population) .......................... 12 Box 2. Approaches for supporting long-term unemployed support in Europe ......................................... 37 Box 3. Group A: “Prime-age long-term unemployed with low education
and scarce job opportunities” ........................................................................................................ 41 Box 4. Group B: “Long-term unemployed youth without any past work experience
and with scarce job opportunities” ............................................................................................... 49 Box 5. Approaches for vocational guidance and upskilling for low-skilled young people in Europe ..... 55 Box 6. Group C: “Youth with unstable employment, some recent work experience
and often low skills” ..................................................................................................................... 57 Box 7. Support measures for young people with unstable employment and insufficient skills:
Experiences in other EU countries ................................................................................................ 60

FACES OF JOBLESSNESS IN PORTUGAL: MAIN RESULTS AND POLICY INVENTORY© OECD 2017 7
ACKNOWLEDGEMENTS
This document was produced with the financial assistance of the European Union Programme for
Employment and Social Innovation “EaSI” (2014-2020, EC-OECD grant agreement VS/2016/0005,
DI150038). It is part of a joint project between EC and OECD (VS/2016/0005 (DI150038), Cooperation
with the OECD on Assessing Activating and Enabling Benefits and Services in the EU) covering six
countries: Estonia, Ireland, Italy, Lithuania, Portugal and Spain.
In preparation of this report, authors met staff in a number of Portuguese institutions – including the
Ministry of Labour, Solidarity and Social Security, Secretary of State of Employment, Secretary of State of
Social Security, Secretary of State of Inclusion of Persons with Disabilities, Social Security Institute (ISS),
the Public Employment Service, the national education and training agency ANQEP during a country
dialogue mission in February 2017. The lead authors extend their thanks to officials in these institutions,
particularly those in the Strategy and Planning Office (GEP) of the Ministry of Labour, Solidarity and
Social Security who organised the mission visits, and to numerous experts and researchers who provided
information and advice. Lead authors gratefully acknowledge contributions from colleagues at the OECD
(James Browne, Rodrigo Fernandez, Herwig Immervoll, Dirk Neumann and Daniele Pacifico) and
comments received from country experts and the European Commission. Herwig Immervoll coordinated
the project and the preparation of this report. All views and any errors in this report are the responsibility
of the authors. In particular, the report should not be reported as representing the official views of the
OECD, of the European Union, or of their member countries.
This project is co-funded by the European Union

8
1. INTRODUCTION AND MOTIVATION
1. Across EU and OECD countries, between 16 and 50% of working-age individuals are without
employment, and a significant share of workers are in unstable jobs, or work intermittently or fewer hours
than they would like. The factors contributing to joblessness or underemployment are varied and can relate
to individual circumstances and characteristics, to specific policy choices, or to the broader economic
context, such as a cyclical labour-market weakness. Good-quality information on the employment barriers
that people are facing is crucial for formulating strategies to overcome them, and for assessing the
effectiveness of existing policy measures aiming to strengthen labour-market outcomes.
2. The “Faces of Joblessness” project (www.oecd.org/social/faces-of-joblessness.htm), undertaken
jointly by the OECD, the European Commission and the World Bank, develops and applies a novel method
for identifying groups of people with no or weak labour-market attachment, as well as their employment
barriers. It covers selected EU and OECD countries and is organised broadly in three parts.1 A first part
presents typologies of underutilised employment potential. To do this, the analysis employs survey data
that allow considering individual work patterns over an entire year. Going beyond snapshots of people’s
labour-market status facilitates a discussion of underemployment, e.g., in the form of intermittent or
occasional work, which is attracting growing policy attention.
3. A second part assesses the incidence and severity of key barriers that may hinder stable or higher-
intensity employment for those on the margins of the labour market. The examination of barriers relies on
a series of quantitative indicators of concrete labour-market obstacles accounting for individual (e.g. skills,
work experience, health), household (care responsibilities) and labour market / institutional (labour
demand, work incentives) contexts, and providing a rich account of employment barriers and
characteristics (“faces”) of different groups. In particular, the quantitative information on employment
barriers is used to reveal groups who share similar combinations of barriers and who are therefore likely to
provide a good basis for tailoring and targeting policy interventions.
4. A third part employs this empirical information to support a policy inventory for selected groups.
Essentially, the results on employment barriers are used to examine whether existing activation and
employment-support policies are well-adapted to the barriers and characteristics that are prevalent in the
selected population groups. By discussing existing policy configurations from the perspective of the
employment barriers that people are facing, this bottom-up approach is intended to provide concrete input
into policy discussions on how to adapt employment-support measures to different groups and evolving
labour-market realities. For instance, the results can inform assessments of whether specific groups are “on
the radar” of existing activation and employment-support policies, whether existing policy configurations
are suitably customised to the needs of specific labour-market groups, and whether employment support is
accessible to those who are likely to benefit from it.
5. This Country Policy Paper for Portugal presents results and selected policy implications, drawing
on the latest wave of the EU-SILC data (2014) that was available for this project. 29% of working-age
individuals in Portugal were persistently out of work for at least 12 months, and a further 10% had low
1 . The six EU countries included in the OECD/EC project are Estonia, Ireland, Italy, Lithuania, Portugal and
Spain. References to a “6-country average” in this document refer to those six countries.

9
work intensity working less than half of the year, or reporting limited working hours or very low earnings.
The potential employment barriers that were most common among these 39% of the working-age
population were low education/skills, no recent work experience, scarce job opportunities and health
problems. Although financial disincentives and care responsibilities were less widespread overall, they
represented important barriers for some groups. A striking finding is that large shares of those with no or
weak labour-market attachment face multiple simultaneous employment barriers: 45% faced three or more
significant barriers, highlighting the need for broad and coordinated policy approaches that focus on all
relevant barriers in a holistic way.
6. Section 2 discusses the labour-market and social context in Portugal in which the Faces of
Joblessness analysis is undertaken, summarises empirical results on the incidence of employment barriers
among working-age individuals with no or weak labour-market attachment, and presents a typology of
distinct labour-market groups of shared sets of employment barriers and characteristics derived from a
comprehensive statistical segmentation analysis. Section 3 provides an overview of Portugal’s policy
stance on activation and employment-support policies drawing on a range of available data and policy
indicators. Section 4 seeks to illustrate how bottom-up information on patterns of individual employment
barriers can inform a discussion of policy priorities, effectiveness and gaps. This is done by undertaking a
selective policy inventory for three of the groups identified in the empirical part: (a) Prime-age long-term
unemployed with low education and scarce job opportunities; (b) Long-term unemployed youth without
any past work experience and with scarce job opportunities; and (c) Youth with unstable employment,
some recent work experience and often with insufficient skills. A concluding section summarises key
policy implications.

10
2. FACES OF JOBLESNESS IN PORTUGAL
7. As background for the policy inventory in Sections 3 and 4, this part provides a summary of the
incidence and patterns of employment barriers in Portugal. The summary is based on an in-depth profile
analysis of jobless individuals and those with weak labour-market attachment. Full details on the
employment barriers and the specific population groups sharing similar types of barriers are available in
the Profile Analysis Note (PAN) for Portugal, through the project website
(http://www.oecd.org/social/faces-of-joblessness.htm).
2.1. Labour-market and social context
8. The impact of the economic crisis of 2008 was particularly marked in Portugal and the recovery
started only as from 2013 onwards (see Figure 1). By 2015, the employment rate in Portugal was slightly
below the EU average, but remained well below its 2007 level. Although unemployment and long-term
unemployment have decreased since 2013, they remain high. In the near future, decreases in
unemployment are projected to be much slower than over the past two years in 2017, and unemployment
will likely remain at double digit levels, among the highest in the EU (OECD, 2017a). The rise in
unemployment in the aftermath of the economic crisis has particularly affected young people, whose
unemployment rate reached 38% in 2013. One out of six young adults aged 15-24 is neither in a job, nor in
education or training.
Figure 1. Employment rates: mild recovery from the crisis
% of the working-age population
Source: Eurostat Labour Force Statistics.
9. The low level of education of the labour force is a major challenge for the labour market and a
key reason for persistently high rates of long-term unemployment. In 2014, only 65% of the population
aged 25-34 had attained upper secondary education or higher, well below the EU average of 83%, even
though Portugal has made significant improvements in the educational attainment of its younger adult
population in recent years (OECD, 2015e).

11
10. Portugal has one of the most unequal income distributions in Europe, and both inequality and
poverty have been rising since the crisis. More recent data show a declining tendency of inequality. The
economic crisis has halted a long-term gradual decline in poverty. Children and youths were most affected
by increasing poverty since then, with a 3 percentage point rise in this age group, while poverty among
pensioners has fallen by almost 6 percentage points since 2009. The rise in unemployment and in the
number of individuals living in “low work intensity” households (mainly workless households) since the
start of the economic crisis has been one of the main contributing factors of the upsurge in poverty
(Table 1). At 28% in 2014, the proportion of individuals who are at risk of either income poverty or social
exclusion (AROPE) was also above the EU average of 25%.
Table 1. Risk of poverty or social exclusion
2014, in % of people aged 16-64
Note: (1) individuals aged 18-64; (2) individuals aged 18-59. The risk of poverty is computed using the Eurostat methodology.
Source: Eurostat (EU-SILC 2014).
2.2. Target groups for activation and employment-support policies
11. Individuals with labour market difficulties frequently move between non-employment and
different states of “precarious” employment. As a result, limiting attention to “snapshots” of non-employed
(or underemployed) individuals, such as those based on labour force surveys, may not capture the true
extent of labour-market difficulties or the need for policy intervention. To cover the potential scope of
AESPs, the Portugal PAN focuses on a target population including working-age individuals who are
“persistently” out of work as well as individuals whose labour-market attachment is “weak ”, e.g. because
they move in and out of employment. The target groups for policy intervention would then be identified
among the target population. Box 1defines each sub-group of the target population more precisely and
explains how these are identified in the EU-SILC data.2
2 . See Fernandez et al. (2016) for a discussion of the reference data and the sub-groups included in the target
population.
Portugal Estonia Ireland Italy Lithuania Spain EU28
People at risk of poverty or social exclusion 28 25 29 29 26 32 25
People at risk of poverty
All 19 20 17 20 18 23 17
Not working 32 36 31 31 35 36 31
Working 11 12 6 11 8 13 10
full-time 9 11 3 10 7 10 8
part-time 31 20 11 17 24 23 16
Households without children 16 25 15 16 18 16 15
Households with children 23 18 16 24 20 28 19
People living in households with severe material deprivation (1)
All 10 6 9 12 12 8 9
Households without children 10 7 6 10 16 6 8
Households with children 11 5 10 13 12 9 10
People living in households with very low work intensity (2)13 8 21 13 9 18 12

12
Box 1. Population groups with potential labour market difficulties (target population)
The target population in this note includes those who are persistently out-of-work, as well as those with weak labour-market attachment.
The persistently out-of-work population (long-term unemployed or inactive) includes individuals reporting no employment activity throughout the reference period. The reference period corresponds to 12 consecutive monthly observations in the income reference year (January-December of year T-1) plus one additional observation at the moment of the interview (in year T). There is no criteria qualifying the voluntary or involuntary nature of the situation on
the labour market.
The group with weak labour market attachment (or “underemployed”) refers to individuals reporting employment activity during the reference period matching any of the following three situations:
Unstable jobs: individuals working only a limited number of months throughout the reference period. The
threshold is equivalent to Eurostat’s low-work-intensity measure: Above zero but no more than 45% of potential working time in the income reference year. To reconcile information reported for the income reference period and at the moment of the interview the following individuals are also considered in this group: 1) Workers who report no work activity during the income reference period but who are working at the moment of the interview and, 2) Workers with between 45% and 50% of work activity during the income reference period who do not report any work activity in either the last month of the income reference period or at the moment of the interview.
Restricted hours: workers who spent most or all of the reference period working 20 hours or less a week.1
However, individuals working 20 hours or less who are not likely to have additional work capacity, e.g. due to ongoing education or training, are excluded.
Near-zero earnings: individuals reporting some work activity during the income reference period but negative, zero or near-zero monthly earnings (less than one third of the statutory minimum wage for 2013). In addition
to possible classification error, situations included in this group could signal potential labour market difficulties, such as underpayment and/or informal activities.
1. The 20-hours threshold is approximately in-line with the 45% “part-year” threshold that identifies the group with unstable jobs. For a 40-hours working week in a full-time job, 45% of full-time would correspond to 18 hours a week. However, in EU-SILC, the distribution of working hours in the main job shows a high degree of bunching at 10, 15, 20 and 25 hours a week. As the closest multiple of 5, a value of 20 hours was therefore chosen.
12. Figure 2 shows the size and evolution of the target population in Portugal between SILC survey
years 2008 and 2014 (SILC survey respondents report activity status and income for the previous calendar
year, so these data refer to 2007-2013). The proportion of working-age adults who were persistently
(throughout the calendar year, see Box 1) out of work and economically inactive remained broadly
constant during this six-year period. But the share of individuals who report being unemployed for all of
the year (defined as “long-term unemployed”) increased from 4% of the working-age population in 2007 to
14% in 2013.3 Underemployment contracted in 2009, before returning close to pre-crisis levels in 2014.
3 According to the Labour Force Survey data the long-term unemployment rate increased from 3.8% in 2007 to 9.3%
in 2013.

13
Figure 2 Trends of population groups with potential labour market difficulties
% of reference population, for different EU-SILC survey years
Note: See Box 1 for the definitions of the three groups.
Source: Calculations based on EU-SILC 2008-2014.
13. Following the concepts outlined in Box 1, individuals with no or weak labour market attachment
represent 39% of the working-age population in Portugal, that's to say 2.4 million people (Figure 3). Most
of them (74%, i.e. 1.8 million people) were persistently out of work throughout the reference period. The
rest (26%, i.e. 620 000 people) had weak labour market attachment with some paid employment during the
reference period. Among the 1.8 million people persistently out of work, 860 000 were unemployed,
432 000 were retired, 312 000 reported that they were engaged in domestic tasks and 90 000 (5%) reported
that they were unfit to work. Among the 620 000 people with a weak labour market attachment, 360 000
people (15%) spent most of the reference period out of work (unstable jobs) and 50 000 (2%) worked less
than 20 hours a week throughout the year. 210 000 people (9%) of the target population reported having
zero or “near-zero” earnings but worked full-time throughout the year, typically as self-employed.

14
Figure 3 Size and composition of the population with labour market difficulties Trends of population groups with potential labour market difficulties
Note: The six-country average is unweighted. See Box 1 for definitions of the different groups. The working age population refers to adults (18 to 64) excluding full-time students and those in compulsory military service.
Source: Calculations based on EU-SILC 2014.
2.3. Employment barriers: Summary of empirical results
A typology of employment barriers
14. Individuals with no or weak labour-market attachment (voluntarily or involuntarily) often face a
number of employment barriers that prevent them from fully engaging in the labour market. Although
these barriers cannot be measured directly, proxy indicators can be developed using the information
provided in survey data like the EU-SILC. Following Immervoll and Scarpetta (2012), the Profile Analysis
Note for Portugal used a series of empirical indicators for the three main categories of employment barriers
below. The label of each barrier, e.g. “lack of skills” or “high non-labour income”, refers to a specific
indicator and thresholds as described in the Profile Analysis Note.
1. Insufficient work-related capabilities, evaluated along five dimensions:
Item 1: lack of work-related skills, measured using the education level (lower secondary
education or below).
Item 2: health limitations, i.e. whether an individual reports chronic (lasting at 6 months or
longer) physical or mental limitations in daily activities.
Item 3: care responsibilities, i.e. whether an individual has a family member who requires care
and state that their reason for not working is care responsibilities, or they are the only person in
the household who can provide it.
Persistently out of work (74% of the target population)
Weak labour market attachment (26% of target population)
Unemplo-yed (36%)
Retired (18%)
Unfit to work (5%)
Domestic tasks (13%)
Other inactive
(2%)
61% 61%
12% 10%
27% 29%
Average of sixcountries PRT
Persistently out of work
Weak labour market attachment
No major difficulties
Restricted
hours (2%)
Near-zeroearnings (9%)
Unstable jobs(15%)
"Target" population
(39%)
Working age population
(100%)

15
Item 4: “low” recent work experience, if the individual did no paid work during the reference
period (i.e. was without employment for at least 12 months).
Item 5: “low” overall work experience relative to potential experience.
2. Lack of financial work incentives, evaluated along two dimensions:
Item 1: “high” earnings-replacement benefits, i.e. out-of-work benefits are high relative to the
individual's potential earnings.
Item 2: “high” non-labour income, i.e. living in a household with high levels of income that
are unrelated to own work effort.
3. Scarce job opportunities. One item only:
The risk (in a statistical sense) of remaining without a job for 12 months or longer despite
active job search and availability for work.
15. Employment barriers are significantly more common in the target population, indicating that they
are indeed reasonably well associated with employment outcomes (Table 2), which shows shares of
individuals in the target and the reference (working-age) population populations facing each of the
employment barriers. They also tend to be more common among those who have been persistently out of
work than among individuals with weak labour-market attachment. Only the ‘high levels of non-labour
income’ barrier is (slightly) less prevalent in the target population than in the reference (working-age)
population. Those with strong labour-market attachment may, for example, be more likely to have a high-
earning spouse, perhaps because of selection effects in the family formation process ("assortative mating").
Table 2. Employment barrier indicators
% of population facing different types of barrier
Note: See text for definitions and thresholds.
Source: Calculations based on EU-SILC 2014. Working-age population: all working-age adults (18 to 64) excluding full-time students and those in compulsory military service. Target population includes members of the working-age population who are out of work throughout the income reference period (those who are “persistently out of work”) and those who work for less than 45% of the reference period, or less than 20 hours per week for more of the reference period, as well as those who work full time for most of the reference period but earn less than a third of the statutory minimum wage (these are collectively referred to as individuals with “weak labour market attachment”). For more details see Box 1.
16. “Low level of education and” and “no recent work experience” are the most frequent barriers in
Portugal (73% and 74% of the target population, respectively). “Care responsibilities”, “high earnings-
replacement” and “no past experience” are the least frequent (7%, 10% and 11%). Figure 4 compares the
AllPersistently out
of work
Weak labour
market attachment
Insufficient work-related capabilities
"low" education 61 73 77 64
No past work experience 4 11 15 0
Positive but "low" relative work experience 14 27 29 19
No recent work activity 29 74 100 0
Health limitations 27 39 43 28
Care responsabilities 3 7 9 4
Lack of financial work incentives
"High" non-labour income 30 28 28 28
"High" earnings replacements 5 10 12 8
Scarce job opportunities
Scarce job opportunities 17 43 46 33
Working age
population
"Target" population

16
incidence of employment barriers in Portugal with the average among the six countries.4 The share of
individual facing different employment barriers is compared with the six countries’ average in Figure 4.
Portugal’s share of people with low education is much higher than in the other countries. The share of
people in the target population experiencing scarce job opportunities and health limitation are also above
the 6-county average. In particular, the prevalence of scarce job opportunities is a result of the weak or
absent recovery in Portugal by the time of the survey year.
Figure 4. Employment barriers in Portugal
% of target population
Note: See Annex I for definitions and thresholds. The six-country average is unweighted.
Source: Calculations based on EU-SILC 2014.
17. The employment barriers sometimes overlap. 17% of individuals in the target population face a
single employment barrier; 36% face two simultaneous barriers; and the remaining 45% face three barriers
or more (Figure 5). This is a slightly higher incidence of multiple barriers than the average based on all six
countries covered in this project.
Figure 5. Number of simultaneous barriers faced by individuals
% of target population
Note: The six-country average is unweighted.
Source: Calculations based on EU-SILC 2014.
4 . Figure 4 shows the six-country average using a coherent specification of the indicators corresponding to
the indicators used for Portugal, even where definitions of employment-barrier indicators used in country-
specific reports for the five other countries differ.
14
31
36
173
4 or more barriers
3 barriers
2 barriers
single barrier
No major barrier
13
28
32
20
6
Portugal Average of six countries

17
Identifying distinct groups for policy intervention
18. The statistical profiling analysis reported in the Profile Analysis Note
(http://www.oecd.org/social/faces-of-joblessness.htm) suggests that the population with no or weak labour
market attachment in Portugal can be separated into nine distinct groups, each with similar profiles of
employment barriers. Table A1 and A2 in the Annex 1 report employment barriers and report a range of
demographic and socio-economic characteristics (such as gender, age, poverty risks, etc.) for each group.
This information helps to attach indicative labels or “faces” to the members of the nine groups. The sizes
of these groups, along with suggested labels are reported in Table 3.
Table 3. Potential targets of activation and employment-support policies
Table 4.
Source: Calculations based on EU-SILC 2014. Group labels are based on the employment barriers with a “high” probability of occurrence within the group. See tables A1 and A2 reports the complete list of individual and household characteristics.
19. One notable inference from the descriptive statistics in Annex Tables A1.1 and A1.2 is that proxy
groupings, which are commonly referred to in the policy debate, such as “youth”, “women”, “unemployed”,
are far from homogeneous. In some cases, these proxy labels may distract attention from the specific
employment obstacles that policies seek to address as they can comprise groups with very different
combinations of employment barriers. To successfully address those barriers, suitable policy responses and
priorities may be quite different for each of them. For example, the results point to:
Three groups of women who are likely to respond to policies in different ways: the “older
women with health limitations, low education and limited work experience” (Group 1) and the
“women with low education without any past experience” (Group 7) share issues related to their
lack of skills and limited work experience with the group of “mothers with care responsibilities
and limited work experience” (Group 9). But a significant share of Group 1 faces health
limitations in addition, while a lack of work experience is common in Group 7. Childcare
responsibilities are a likely barrier for a third group of women, “mothers with care
responsibilities and limited work experience” (Group 9).
Two groups of early retirees, with different employment obstacles. The first group, “early
retirees with health limitations, low education and long employment record” (Group 4) may lack
the capability for work as a result of health problems and very low levels of education (84% have
only primary education). Members of the second group, “early retirees with weak financial work
incentives” (Group 6), lacks financial incentives to work as they receive early retirement pensions
that are high relative to what they could potentially earn in employment.
Group
numberGroup label
% of the target
population
1 Older women with health limitations, low education and limited work experience 22
2 Prime-age long-term unemployed with low education and scarce job opportunities 20
3 Underemployed workers with low education 12
4 Early retirees with health limitations, low education and long employment record 12
5Long-term unemployed youth without any past work experience and scarce job
opportunities9
6 Early retirees with weak financial work incentives 9
7 Women with low education and without any past work experience 7
8Youth with unstable employment, some recent work experience and often insufficient
skills6
9 Mothers with care responsibilities and limited work experience 3

18
Two groups of young people. The bigger one, “long-term unemployed youth without any past
work experience and scarce job opportunities” (Group 5) comprises individuals facing relatively
severe challenges. By contrast, members of the other group, “Youth with unstable employment,
some recent work experience and often insufficient skills” (Group 8), have stronger links with the
labour market, and a substantial share of them have in fact worked for part of the past year.
20. Finally, the group of “underemployed workers with low education” (Group 3) includes workers
with very low earnings despite generally working full-time throughout the reference period. They also face
only very few (and sometimes none) of the barriers to employment discussed here. Around a third of this
group report being self-employed, and for them, low reported earnings could be the result of volatile self-
employment incomes. Another possibility is that labour incomes are not or only partially declared in the
survey. This could apply to the (majority) reporting full-time employment and could be a survey
measurement problem. But it could also indicate under-reporting or non-declaration of earnings to tax or
other authorities.
21. In most groups a majority face multiple simultaneous employment barriers (Figure 6). As a
result, addressing one barrier in isolation might not be enough to boost employment levels significantly.
For instance, about 70% of the “women with low education and without any past work experience”
(Group 7) face four or more employment barriers and 30% face three simultaneous barriers (mostly low
skills, no prior work experience and scarce job opportunities). Similarly, about 75% of “long-term
unemployed youth without any past work experience and scarce job opportunities” (Group 5) have three or
more simultaneous barriers. From a policy perspective, these findings point to a need to carefully sequence
different activation and employment support measures, and to coordinate them across policy domains and
institutions.
Figure 6. Share of individuals facing multiple simultaneous employment barriers
By group, in descending order of shares facing three or more barriers, in %
Note: Group sizes are reported on the horizontal axis, see also Table 3 and Annex Tables A1, A2. Group 1: “Older women with health limitations, low education and limited work experience”, Group 2: “Prime-age long-term unemployed with low education and scarce job opportunities”, Group 3: “Underemployed workers with low education”, Group 4: “Early retirees with health limitations, low education and long employment record”, Group 5: “Long-term unemployed youth without any past work experience and scarce job opportunities”, Group 6: “Early retirees with weak financial work incentives”, Group 7: “Women with low education and without any past work experience”, Group 8: “Youth with unstable employment, some recent work experience and often insufficient skills”, Group 9: “Mothers with care responsibilities and limited work experience”.
Source: Calculations based on EU-SILC 2014.

19
3. ACTIVATION AND EMPLOYMENT-SUPPORT POLICIES IN PORTUGAL:
OVERALL POLICY STANCE
22. As a general background to the policy inventory for selected groups in Section 4, this section
provides an overview of the main income-support, activation and employment-support policies. It draws on
a range of key indicators describing out-of-work benefits, the Public Employment Services (PES) and
Active Labour Market Programmes (ALMPs), which are relevant across the groups identified above. It
also describes key labour market challenges and summarises government policy priorities and recent or
planned reforms.
3.1. Income support: Out-of-work benefits
23. Like most other OECD and EU countries, Portugal operates a range of different income-support
measures for working-age adults who have lost their job or have very low incomes. Some of these
measures can be considered as earnings replacements for individuals with no (or weak) labour market
attachment (e.g., unemployment insurance, maternity leave payments, disability benefits). Others operate
mostly as income top-ups and may be available irrespective of work status (family benefits, housing
allowances). Earnings-replacement benefits can be categorised into one of the following categories:
unemployment, social assistance (guaranteed minimum income benefits, GMI), family support, disability
and early retirement5. Figures 7 and 8 summarise recipient numbers and spending levels for each of the
main categories. Table 4 provides more detailed information on amounts, benefit durations and the main
entitlement criteria.
24. Unemployment and disability benefits are the largest categories of out-of-work benefits in
Portugal, in terms of both recipient numbers and spending levels. Following the trends in unemployment,
the share of working-age adults receiving unemployment benefits increased significantly as from 2007 and
peaked at 5.8 % of the working age population in 2013 (Figure 7). As employment started to recover, this
share dropped back to 4.9%. Disability benefits declined slightly since 2007, from 4.4% of the working age
population, to 3.8%. Early retirement benefits (anticipated old-age pensions) covered 2.5% of the working-
age population in 2014, a figure broadly stable since 2007. Social assistance, which was reformed in 2012
and became much less generous6, reached 1.4% of the working age population in 2014. Last, maternity
benefits together covered about 0.5% of the working-age population in 2014.
25. Compared with other EU countries, Portugal spent more on the “unemployment” and “disability”
branches, in terms of percentage of GDP in 2013. The large weight of the “unemployment” branch is
consistent with the unemployment peak prevailing in that year (Figure 8). “Early retirement” and “social
assistance” represent a lower share in social expenditure in Portugal than on average in the EU. The weight
of the “family” branch in overall social spending is close to the EU average.
26. Comparing expenditures and the number of recipients of different benefits indicates that benefit
amounts are comparatively larger for disability pensions and maternity/paternity benefits. By contrast,
5 . This study is focused on working-age individuals. Therefore, earning replacement benefits like old-age
pensions or survivor pensions, who are mostly targeted on retirement are and under 18 individuals are not
considered. Other earnings replacement benefits like sick leave schemes or work accident insurance
payments are not included for (a) methodological reasons and (b) because they are less linked to the labour
market situation.
6 . Part of the cuts in generosity of the Rendimento Social de Inserção (RSI) were reversed in 2016 (see
OECD, 2017a).

20
social assistance support is much less generous, especially since the reform in 2012. Recipients of social
assistance benefits have income substantially below relative poverty threshold (see below).
Figure 7 Recipients of earnings replacement benefits
Percentage of population aged 15-64
Note. The categorisation of social benefits (branches) mostly follows Eurostat ESSPROS definitions (http://ec.europa.eu/eurostat/statistics-explained/index.php/Glossary:Social_protection_benefits). Information on the programmes in each category is shown in Table 4.
Figure 8 Out-of-work benefits for working-age adults – expenditure
Social spending by social policy branch, percentage of GDP
Notes: Benefits considered in each branch, as well as programme names, entitlement criteria, and benefit durations can be found in Table 4. Country averages are unweighted.
Source: OECD SOCR and SOCX databases.

21
Table 5. Main out-of-work benefits in Portugal: entitlement rules, amounts and duration
2014 (reference year of results in Sections 1 and 2)
Source: Missoc and OECD tax-benefit policy databases.
27. Many unemployed in Portugal do not receive unemployment benefits. According to
administrative data, around half of registered unemployed get unemployment benefits. This figure is much
lower (38%, figure 8) when expressed as a "pseudo-coverage rate", i.e. the number of unemployment
benefit recipients as a share of the ILO number of unemployed (including registered and not registered
jobseekers actively looking for a job, available to work within two weeks, and who didn't work over the
past four weeks). Spending on unemployment benefits as a percentage of GDP is nevertheless higher in
Portugal than in other EU countries because of Portugal’s high unemployment rate during the period
covered in this report. In 2014, the “pseudo” coverage rate, calculated as the number of unemployment
benefit recipients divided by the number of ILO unemployed, was at 38% (Figure 9, Panel A). Eligibility
conditions, i.e., formal behavioural requirements for those with a benefit entitlement based on their past
employment, were particularly strict in Portugal, with rules calling, for instance, for a complete stop of
Soc ia l prote c tion
bra nc h
P ro gramme name
( Portuguese name )Entitle me nt c rite ria Amount Dura tion
Unemployment insurance
Subsidio de desemprego
Unemployment
assistance
Subsisidio social de
desemprego (subsisdio
inicial, subsequente)
Social assistance
Rendimento social de
inserçao
Disability pension
Pensao de Invalidez
Early retirement pension
Pensao de reforma,
pensao antecipada de
velhice
FamilyMaternity benefit
Subsidio de
parentalidade
Incapacity to work
Relative invalidity: 66.66% reduction of capacity of
normal occupation. Contributions paid or credited
for 5 years.
Absolute invalidity: 100% permanent incapacity to
carry out any working activity. Contributions paid or
credited for 3 years. The same for certain chronic
diseases.
Indefinite up to pension age.
Calculation according the general formula.
The amount is reduced through the application
of a reduction factor corresponding to 1 - global
reduction rate (obtained by multiplying 0.5% by
the number of months of antic ipation).
Certain specific cases related to age and
contribution period.Early retirement
Insured persons aged at least 55 provided that
qualifying period completed + contribution period
of 30 years.
Unemployed: from the age of 62 provided they
were 57 at the beginning of their unemployment +
have completed qualifying period.
Possible from age of 57 if contributed 22 calendar
years and aged 52 or more when becoming
unemployed.
In case of heavy or unhealthy work: as a rule, from
the age of 55 (for professions legally foreseen).
For life.
Minimum income
schemes
Extensive means- testing considering the income
of all members of the household; household assets
are also considered in the means testing;
benefic iaries cannot have assets or a car valued
aboe 25,153.20 euros (source: OECd, 2016).
conditional on partic ipation in a compulsory social
inclusion porgramme (inluding training course).
Difference (top up) between the family's SII
(social pension times the scale of equivalence,
180€ a month for a single person) and the family’s
total income.
maximum period of 12 months; it may be
renewed two months before the end of
this period if requested by the claimant
Unemployment
1 year of paid employment in the 2 years
immediately prior to the date of unemployment.
Must be involuntarily unemployed.
Must be registered as job seekers at a Centro de
Emprego [Job Centre] in their area of residence;
65% of the registered earnings for 12 months
counting from the month preceding the date of
unemployment; maximum amount of 2.5 times
the IAS (419€ since 2009)
Reduces by 10% after 180 consecutive days of
receiving benefits
Bonus of 10% for couples with children if both
partners c laim regular or assistance
unemployment benefit.
Depends on the age of the benefic iary
(<30 yo, 30- 39, 40- 49,50+) and the
number of months with registered
earnings for social security purposes
since the benefic iary's last period of
unemployment.
Less than 15 months: 150 / 180 / 210 / 270
Betwen 15 and 24 months: 210 / 330 /
360 / 480
Over 24: 330 / 420/ 540/ 540
awarded either as an initial benefit to c laimants who
have not worked long enough to c laim the main
unemployment benefit, or as an extension to those
who cease to be entitled to the main assistance
unemployment benefit (as long as they meet the
additional conditions listed below).
*
Different calculation rules depending on date of
insurance and start of pension, based on years
of contribution, reference earnings, a factor of
financial sustainability (related to the average life
expectancy evolution).
Minimum pension 30% of reference earnings but
at least between 61.86% and 90.41% of
reference Social Support Index (SSI; original
language: IAS (indexante dos apoios sociais =
€419.22)) depending on contribution period
(relative invalidity).
Absolute invalidity: The minimum amount
corresponds to minimum amount of relative
invalidity pension and an old- age pension for a
contribution career of 40 years.
28 months if on initial unemployment
social allowance, half if on subsequent
unemployment social allowance after
exhausting unemployment insurance, for
benefic iaries after April 2012.
All insured employeeds ans self- employed with 6
months affiliation
if 120 days:100% of the average daily wage,
minimum of 50% of the indexing reference of
social support (419€).
If 150 days: 80% of the average daily wage
120 or 150 consecutive days of leave,
extended by 30 days in case of shared
leave

22
benefits upon a single unjustified failure to comply with reporting requirements. In particular, the benefit
payment will be stopped in case the benefit recipient is refusing a job offer or participation in an ALMP or
is dropping-out of an ALMP, without any acceptable justification. Since the 2016 review of the law, the
benefit recipients have been receiving a warning. In case of a first non-attendance to a job centre call.
However, capacity challenges at PES, possibly coupled with a widespread recognition of the crucial role of
unemployment support in preventing severe poverty in the aftermath of the crisis, is likely to have led to
incomplete enforcement of formal eligibility requirements. The 2012 reform eased access somewhat, for
example by reducing the employment conditions that needed to be fulfilled by a worker to get the benefit
(450 to 360 days of work over the previous 24 months, see OECD, 2017a). In addition, the requirement for
bi-weekly job-search reporting was been dropped in 2016. Despite these changes, the strictness of
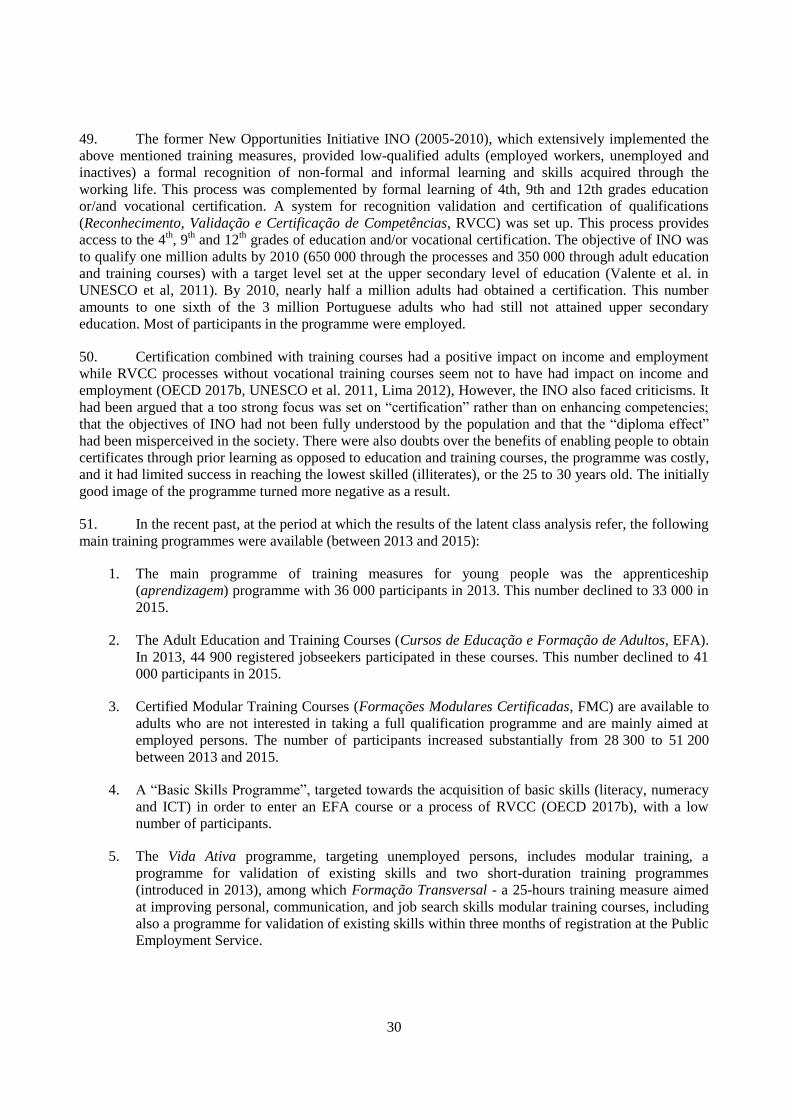
eligibility criteria remains high in international comparison in 2014 (Figure 9, Panel B).
Figure 9. Accessibility of unemployment benefits in Portugal
Panel A: Coverage (pseudo-coverage rate)
Panel B: Strictness of benefit eligibility criteria, 2014
Notes: The “strictness” sub-categories cover the following items. “Strictness of sanctions”: sanctions for voluntary unemployment, for refusing job offers (first/repeated) and for failure to participate in counselling or ALMPs (first/repeated); “Strictness of Job-search requirements and monitoring”: frequency of job-search monitoring and required documentation of job-search; “Strictness of availability requirements and suitable work criteria”: availability during ALMP participation, demands on occupational and geographical mobility, other valid reasons for refusing job offers.

23
Source: Panel A: OECD SOCR database www.oecd.org/social/recipients.htm. Panel B: Calculations using Langenbucher (2015).
28. The duration of the unemployment insurance benefit is strongly related to age in Portugal. For
older unemployed who receive unemployment benefits, entitlements are relatively generous, provided that
they have worked for at least two years before becoming unemployed. For example, unemployed with 10
months of contributions will be covered for 150 days if they are under 30 years old, and for 270 days if
they are older than 50 years. For somebody with 24 months of contribution, the respective duration will be
330 days and 540 days (Table 4). As youth unemployment picked up in Portugal during the crisis, many
young people were not entitled or out of rights. This point is discussed in more detail in Section 4.
29. An unemployment assistance scheme - Subsisidio social de desemprego - is available for a
maximum duration of 28 months (in case of first unemployment period, half of it in case of repeated
unemployment) to those who have not contributed for a sufficiently long time to be eligible for
unemployment insurance benefits, as well as for those who have exhausted insurance entitlements.
Eligibility conditions include involuntarily job loss, registration with the PES, and ability and willingness
to work as well as a means test against household assets income.7
30. As a possible complement to unemployment benefits, Portugal’s main Guaranteed Minimum
Income (GMI) benefit programme (Rendimento Social de Inserção, RSI), provides a non-contributory
monthly transfer as a top-up for eligible low-income households. The RSI employs a comprehensive means
test considering the income of all members of the household. Household assets are considered in the
means-testing, and beneficiaries cannot have financial assets or a car valued above EUR 25 000 (OECD,
2016, Arnold and Farinha, 2015). Benefits are also conditional on participation in a compulsory social
inclusion programme, which includes short training courses and return to work initiatives, as well as
requiring regular school attendance for all school-age children living in the household.
31. The income provided by cash minimum-income benefits is lower than the EU average, when
expressed in percent of median household incomes and once separate cash housing benefits (available in
many EU countries but not in Portugal) are taken into accounts (Figure 10). A single person receiving RSI
and no other incomes faces substantial poverty risk, with incomes of only around 23% of the median
household income. While work incentives can be weak for the unemployed receiving unemployment
benefits, they are much stronger for RSI recipients (Figure 11).
32. Reforms undertaken in 2010 and 2012 have modified the way that household income per person
is calculated for multi-person households. The first effect of these changes was a significant decline in the
number of beneficiaries, almost halving the 400 000 recipients of January 2010 by March 2014, including
the loss of RSI benefits for more than 50 000 children and youths (OECD, 2014). For a two adults and two
children household, the threshold level of income guaranteed by the RSI has dropped from 62% of the
poverty line in 2009 to 46% in 2013 (OECD, 2016). In 2015, some cuts in RSI amounts were reversed. In
particular, weights for dependants and children have been re-established to their original levels. Despite
these reversals, the RSI is still below its level prior to the cut (OECD, 2017).
7 . http://www.seg-social.pt/subsidio-social-de-desemprego.

24
Figure 10. Income levels provided by cash minimum income benefits
Net income value in % of median household incomes, 2014. Single adults without children.
Source: OECD tax-benefit models
Figure 11. Work disincentives for out-of-work working-age adults
Net replacement rates for unemployment benefit and social assistance recipients, 2014. Single adults without children.
Note: Net replacement rates (NRRs) show the proportion of net income in work that is maintained after a job loss. * Social assistance benefits are assumed to be available subject to relevant income conditions. For individuals receiving unemployment benefits the NRRs are averages over a 24-month unemployment spell. All figures are calculated for a prime-age worker (aged 40) with a “long” and uninterrupted employment record. Results are shown for two levels of previous earnings: the 2
nd and the 5
th decile of the full-time
earnings distribution. Where receipt of benefits is subject to activity tests (such as active job-search or being "available" for work), these requirements are assumed to be met. The results do not account for housing benefits. Any income taxes payable on unemployment benefits are determined in relation to annualised benefit values (i.e. monthly values multiplied by 12) even if the maximum benefit duration is shorter than 12 months.
Source: OECD tax-benefit models
0
10
20
30
40
50
60
70
80
90
"Median" previous earnings receiving unemployment benefits* "Low" previous earnings receiving unemployment benefits*"Median" previous earnings receiving social assistance benefits "Low" previous earnings receiving social assistance benefits

25
33. Expenditures on family benefits in Portugal are similar to country averages in the OECD and the
6 countries. In addition to maternity leave (see Table 4), paid parental leave and home-care leave
regulations foresee a shorter duration than on OECD average (24 weeks for mothers, as compared to an
OECD average of 36.4 weeks). The participation rates in formal childcare and pre-school services for 0 to
2 year-olds is above OECD average.8
34. People with a reduction in work capacities of at least two-thirds, assessed in relation to normal
work capacities in the respective occupation, are eligible for a disability benefit (see Table 4 for details).
Expenditures on incapacity benefits as a percentage of GDP, as well as the share of recipients in the
working-age population, are substantially above OECD, EU and the 6-country averages (Figures 7 and 8).
In contrast, expenditures on vocational rehabilitation measures are comparatively low (see Section 4).
35. Early retirement pensions are somewhat less frequent than on EU average. Both recipient
numbers and expenditures are now slightly higher than before the global financial crisis. During the
Financial Assistance Programme (until the end of 2014), people aged 57 and over who were long-term
unemployed could retire at a full-time pension at the age of 62 (European Commission 2015a), setting
strong incentives for early labour market exit. While the employment rate increased between 2007 and
2015 for the 55-59 age group, it fell for those aged 60-64 years (https://www.oecd.org/els/emp/older-
workers-scoreboard.xlsx).
3.2. Active labour market policies
36. Active labour market policies in Portugal are designed by the Ministry of Labour, Solidarity and
Social Security and administered by the Instituto do Emprego e Formação Profissional (IEFP, Public
Employment Service). Institutionally, IEFP is a national agency with its own budget, funded mainly by the
social security contributions, co-financing of ALMPs by the European Union through the European Social
Fund and own revenues.
37. Effective active labour market policies are instrumental in integrating jobseekers and those with
no or weak labour-market attachment into good-quality employment. Spending on active labour market
policies per unemployed in Portugal is, however, significantly lower than on EU and OECD average in
2014. Following the significant growth in unemployment between 2007 and 2014 (from 440 to 726
thousands individuals), resources allocated to active labour market policies increased from EUR 630 to 916
million (euros). As a consequence, spending per unemployed was lower in 2014 than in 2007 (Figure 12).
Resources per unemployed fell less strongly than in several other crisis-hit countries, however. By 2014,
expenditures per unemployed were above the 6-countries average, but only half of the EU-28 average.
8 . http://www.oecd.org/els/soc/PF2_1_Parental_leave_systems.pdf and
http://www.oecd.org/els/soc/PF3_2_Enrolment_childcare_preschool.pdf

26
Figure 12. Spending on active labour market programmes by policy area
Spending per ILO unemployed as % of GDP per capita, composition in 2007 and 2014
Source: Calculations based on the OECD LMP database. Unweighted country averages. The pie charts show the share of total spending as reported in the bars.
Public employment services
38. An individual claiming unemployment benefits has the possibility to register at the Public
Employment Service over a period of 90 days after he/she lost the job; for jobseekers not receiving
unemployment benefits there is no time limit. Payments of unemployment benefits are dated back to the
registration date. Thus, unemployed jobseekers have an advantage to register with the PES as soon as
possible. Nevertheless, this rule contrasts sharply with obligations to register immediately or even prior to
job loss (e.g. as soon as employer provides notification, or three months before a fixed-term contract ends
in Germany, the worker has to register with the PES). For those registering later, the 90-day rule in effect
implies an absence of job-search or activity requirements during the initial period of unemployment, when
chances for re-employment are strong.
39. At the first registration of the jobseeker at the Public Employment Service, personal data are
entered into the system (gender, age, educational level, past work experience, disability, occupation
wanted, etc.). The first registration lasts on average for 20 to 40 minutes - taking longer if the jobseeker is
registered for the first time. To support tailored activation strategies, IEFP employs a statistical profiling
tool that assesses individuals’ probability of becoming long-term unemployed based on gender, age,
educational level, past work experience, benefits claim history, region, labour market proximity, family
situation and disability. Depending on individual scores and on the career manager’s own assessment based
on the interview. jobseekers are classified into one of three groups: (i) those at risk of becoming long-term
unemployed are classified as ‘demanding intensive support’; (ii) those with a medium risk of becoming
long-term unemployed are classified as those ‘with employability deficits’; (iii) those with a low risk of
becoming long-term unemployed are classified as ‘market-ready profile’ (Perista and Baptista, 2015). The
career manager must follow-up within maximum 45 days (profile i) or 90 days (profiles ii and iii). The
career manager is responsible for the elaboration and support of the personal employment plan, as well as
for the validation or alteration of the profile the person falls under. For those jobseekers with a higher risk

27
of long-term unemployment, a more intense follow-up may be provided and personal plans could be
different. The personal employment plan will widen and have more steps and have a longer duration as the
risk of the person becoming a long-term unemployed increases. The profiling tool provides also courses of
active job search or to short-term trainings within 15 days of registration. A reassessment of the individual
profile was previously not a priority. This should now be improved.
40. In 2012, the government launched a programme for the modernisation of the Public Employment
Service (see OECD, 2017a). The measures aimed at: strengthening employability of jobseekers (referrals,
priority of young jobseekers, training programmes); modernising information systems; and improving the
coherence between passive and active labour market policies. However, spending on PES per unemployed
jobseeker in Portugal remains far lower than the EU and OECD country averages. In 2014, spending per
unemployed corresponded to less than 1% of GDP per capita in Portugal, compared to 4% of GDP per
capita on average in EU-28.
41. Further reforms of the PES have started to be implemented more recently, including in 2016
(Ordinance No. 282/2016 of October 27) to end the duty of unemployed to show-up every two weeks to
confirm continuing unemployment and job search. The previous bi-monthly show-up procedure was purely
administrative: the unemployed did not meet a counsellor but the reporting involved administrative costs
that diverted resources away from face-to-face contact and guidance for more disadvantaged groups. The
2016 law also implied a shift of the responsibility for monitoring job search activities from jobseekers
towards counsellors and the personal employment plan is now monitored, for unemployment benefit
recipients, every four months.
42. Despite recent improvements, the client-to-staff ratio remains very heavy. In 2016, each career
manager had a portfolio of 540 jobseekers and higher in some parts of the country, e.g., 683 in the North of
Portugal (OECD 2017b). This makes it difficult to implement a case management system which provides
more individualised guidance and follow-up for those who need it. Positive employment impacts may be
achieved through a reduction of client-staff ratios, resulting in more personalised services (OECD 2015e).
Experiences from other countries show that caseloads are often lower. In Estonia for example, case
managers serve between 200 and 300 cases, while case managers providing more individualised guidance
and dealing with more complex employment barriers serve 100 to 150 unemployed. In Germany, caseloads
for career managers in jobcentres (which are dealing with recipients of means-tested unemployment benefit
II recipients, who often are long-term unemployed and young jobseekers) range between 150 and 200 and
for those responsible for hard-to-place jobseekers receiving tailored support are about 75 clients per case
manager (Fertig, 2016).
43. In spite of these challenges, Labour Force Survey data indicate that the Public Employment
Service in Portugal is a relatively efficient channel for finding and using information on job vacancies.
Among those who have recently started a new job, 13% say that they found it through the PES, which is
better than the EU and 6-country averages (10% and 7%, Figure 13). However, only 42% of those
registered with the PES reported using it as a source of information on job vacancies in the previous four
weeks (Figure 14). This is low in international comparison, and could suggest that a large share of the
unemployed are not actively looking for a job, or that they do so without relying on PES services and
support. Since use of PES is relatively strong among those who have found a job, scaling up PES resources
to levels that are more in line with international standards is likely to be an efficient use of public funds.

28
Figure 13. Reliance on Public Employment Service among recent job starters
% of employees aged 25-64 who started a job during the previous 12 months, 2014
Figure 14. Reliance on Public Employment Service among current registered jobseekers
% of registered unemployed among the 25-64 population, 2014
Note: Unweighted averages. Norway and the Netherlands are excluded due to high incidence of non-response in the data (more than 30%). Data refer to 2013 for Germany.
Source: Calculations based on EU-LFS 2014
Source: Calculations based on EU-LFS 2014.
Active labour-market programmes
44. Notwithstanding the central role of the PES as a “job broker” (i.e. placement and job-search
assistance), a clear majority of total spending on active labour-market policies in EU and OECD countries
goes towards active labour market programmes (ALMPs) that seek to address specific employability
issues. Participation in such ALMPs in Portugal was below OECD and EU averages until 2013 despite
much higher unemployment, but has increased since 2014 (Figure 15). According to IEFP data, the vast
majority of participants (84%) in ALMP did not receive unemployment benefits in 2015.
45. Between 2013 and 2015, the number of ALMP participants rose markedly. The number of
unemployed covered by employment measures (such as hiring incentives and traineeship programmes)
increased from 138 800 to 203 000. At the same time, participation in training measures rose from 297 800
to 341 700 and participation in vocational rehabilitation doubled from 5 000 to 10 000 (source: IEFP).
46. The composition of ALMPs may indicate significant gaps in the support targeted to some groups
with special needs. Training activities are the biggest spending item (61% of active ALMP spending in
2014), followed by employment incentives (targeted employment subsidies, 23% of active spending).
However, spending for measures specifically directed towards disabled individuals (sheltered and
supported employment and rehabilitation measures; note that disabled may also participate in main stream
measures) and direct job creation programmes (they cover measures that create additional socially useful
jobs, in order to find employment for the long-term unemployed or persons otherwise difficult to place,
e.g. public works) or start up incentives, are small compared with other countries. The share of participants
in training as a percentage of the labour force increased significantly between 2013 and 2014 and was
higher than on the 6-country, EU and OECD averages.
0
10
20
30

29
Figure 15. Participation in active labour market programmes in Portugal and in other countries
In % of the labour force
Source: Calculations based on the OECD LMP database. Unweighted country averages.
47. Training measures have traditionally been a major focus of ALMPs and should be seen in the
context of Portugal’s huge efforts in upskilling its population (see in particular the New Opportunities
Initiative INO, which was ran from 2005 to 2010). Early school leaving has been reduced drastically.
48. In terms of ALMP on training measures resources, two main developments can be noted for over
more than a decade:
Public expenditures on apprenticeship (aprendizagem – a dual initial vocational training
programme with an average duration of 2.5 years) peaked first in 2005 and was more than halved
by 2008, when expenditures started to raise again to reach the 2005 level. The apprenticeship
class-room based courses are exclusively financed through IEFP. The practical training is
provided within the companies, which makes up 40% of the total duration of the course. The
IEFP is also paying for transportation as well as for a training grant (10% of the social support
index (IAS)) to the apprentice for participating in the programme (see also Section 4 for further
details).
The budget for Adult Education and Training (Cursos de Educação e Formação de Adultos,
EFA) was multiplied by ten between 2003 and 2010 before being cut by more than 40% in the
context of the economic adjustment programme between 2010 and 2011. These courses have
been provided to adults since 2000. They target people over the age of 18 who have not attained
the level of upper secondary education, including those with no working experience. All EFA
courses involve general and technological education. An alternative pathway to upskilling was
introduced in 2008 through VET modular courses (Formações modulares certificadas FMC)
have been introduced. They allow pursuing flexible, gradual and credit-based training by taking
individual units. They generally address people over 18 who have not completed basic or
secondary education/training. Upon successful completion of each training path, including all
modules, and the respective assessment by a technical committee, a final certificate and diploma
is issued (EQF level 2-4). The number of participants in CVET courses doubled between 2011
and 2013, as more short-term training courses were offered (Cedefop, 2014). This explains why
the number of participants in ALMPs as a percentage of the labour force increased recently.
Further, part of the continuous training is now being performed in a workplace environment.
30
49. The former New Opportunities Initiative INO (2005-2010), which extensively implemented the
above mentioned training measures, provided low-qualified adults (employed workers, unemployed and
inactives) a formal recognition of non-formal and informal learning and skills acquired through the
working life. This process was complemented by formal learning of 4th, 9th and 12th grades education
or/and vocational certification. A system for recognition validation and certification of qualifications
(Reconhecimento, Validação e Certificação de Competências, RVCC) was set up. This process provides
access to the 4th, 9
th and 12
th grades of education and/or vocational certification. The objective of INO was
to qualify one million adults by 2010 (650 000 through the processes and 350 000 through adult education
and training courses) with a target level set at the upper secondary level of education (Valente et al. in
UNESCO et al, 2011). By 2010, nearly half a million adults had obtained a certification. This number
amounts to one sixth of the 3 million Portuguese adults who had still not attained upper secondary
education. Most of participants in the programme were employed.
50. Certification combined with training courses had a positive impact on income and employment
while RVCC processes without vocational training courses seem not to have had impact on income and
employment (OECD 2017b, UNESCO et al. 2011, Lima 2012), However, the INO also faced criticisms. It
had been argued that a too strong focus was set on “certification” rather than on enhancing competencies;
that the objectives of INO had not been fully understood by the population and that the “diploma effect”
had been misperceived in the society. There were also doubts over the benefits of enabling people to obtain
certificates through prior learning as opposed to education and training courses, the programme was costly,
and it had limited success in reaching the lowest skilled (illiterates), or the 25 to 30 years old. The initially
good image of the programme turned more negative as a result.
51. In the recent past, at the period at which the results of the latent class analysis refer, the following
main training programmes were available (between 2013 and 2015):
1. The main programme of training measures for young people was the apprenticeship
(aprendizagem) programme with 36 000 participants in 2013. This number declined to 33 000 in
2015.
2. The Adult Education and Training Courses (Cursos de Educação e Formação de Adultos, EFA).
In 2013, 44 900 registered jobseekers participated in these courses. This number declined to 41
000 participants in 2015.
3. Certified Modular Training Courses (Formações Modulares Certificadas, FMC) are available to
adults who are not interested in taking a full qualification programme and are mainly aimed at
employed persons. The number of participants increased substantially from 28 300 to 51 200
between 2013 and 2015.
4. A “Basic Skills Programme”, targeted towards the acquisition of basic skills (literacy, numeracy
and ICT) in order to enter an EFA course or a process of RVCC (OECD 2017b), with a low
number of participants.
5. The Vida Ativa programme, targeting unemployed persons, includes modular training, a
programme for validation of existing skills and two short-duration training programmes
(introduced in 2013), among which Formação Transversal - a 25-hours training measure aimed
at improving personal, communication, and job search skills modular training courses, including
also a programme for validation of existing skills within three months of registration at the Public
Employment Service.

31
52. In 2015, Portugal further introduced a training subsidy for both employees and jobseekers
(Cheque Formação). For employees wishing to invest in training, this subsidises up to 50 hours training
with an amount of EUR 175 and up to 150 hours of training (OECD 2017b). Preliminary data for 2016,
indicate 11 000 participants, of whom 24% were aged 25-34, 31% were aged 35-44, 15% were aged 45-
49% and 21% were 50 years old and above (source: IEFP). The coverage of the short-term training
programmes has broadened over time in the context of the crisis. However, there may now be a need to re-
focus some of these measures on those who need them most (e.g., disadvantaged youth and the long-term
unemployed. Indeed, since 2015, a number of reforms and proposals have been made to improve the
delivery of employment services and to better target ALMPs to disadvantaged groups.
53. A new programme for the adult population was launched in April 2016 under the name of
Qualifíca, with a focus on lifelong learning. The objectives are to qualify half of the active population with
upper secondary education; achieve a 15% rate of adult participation in lifelong learning activities; and
expand the network of Qualifica centers to 300 all over the country (see also OECD 2017b). The main
pillars of Qualifica will be RVCC, long courses and short, flexible course formats. Major differences as
compared to INO are likely to be: (i) people will need to do more training as part of the RVCC process; (ii)
more professional work-related training will be offered; (iii) stronger focus on retraining elements; (iv)
screening skills needs and guidance should be improved. It is aimed to offer more specialised vocational
training by expanding RVCC and the number of courses leading to level 4 of the national qualification
framework. As stressed by OECD (2017b), the challenge is to ensure that the large scale of the programme
neither weakens the quality of the training provided, nor its ability to provide skills demanded by the
labour market.
54. Further, a new instrument for vocational guidance, a Qualifica Passport is being currently
developed by the National Agency for Qualification and Vocational Education and Training (Agência
Nacional para a Qualificação e o Ensino Profissional, ANQEP). This is an online tool, based on a
database on individualised qualification pathways. The Ministry of Education will be responsible for the
data basis and the programming. The tool is available for the employment counsellor as well as the
counsellors at the training and Qualifica Centres.
55. A few evaluation studies assessing the impact of adult education programmes on labour market
outcomes were prepared in the past. Earlier studies suggest that RVCC and EFA courses have a positive
impact on employability and wages, especially among some vulnerable groups in the labour market, such
as women and those living in low-income households. More recent evaluation seems to indicate that, with
the exception of FMC courses, adult education training courses have positive employment effects only
several years after participation. The RVCC processes have improved employability prospects but only
when workplace competencies were validated or the process of validation was linked to training through
Certified Modular Training Courses (Formações Modulares Certificadas, FMC). A positive impact of
RVCC processes on wages was found to be limited to participants who not only obtained recognition for
basic qualifications but also participated in FMC courses and to participants who obtained certifications
equivalent to upper secondary education (see for an overview of OECD 2017b).
56. Among employment incentives, the main programmes are internships (Estágios Emprego, see
Chapter 4 for details) and the hiring incentive Estímulo Emprego. The employment internship programme
Estágios Emprego was built upon the former Programme Estágios Profissionais (professional internships)
by including different supporting instruments of the Youth Initiative and lately adapted to comply with the
Youth Guarantee. The target groups of the programme Estágios Emprego include registered unemployed
and being aged between 18 and 30 years (nearly all qualification levels) or being above the age of 30 and
unemployed for over one year and graduated over the past three years, having disabilities, being single
parents, drug addicts under a recovery process, ex-prisoners, victims of domestic violence or spouse of
registered unemployed. The programme lasts for 9 months, except for some vulnerable groups it can last

32
for 12 months. When applying for the programme, companies may refer to a certain candidate of their
choice but IEFP will verify and confirm if eligibility criteria are met. Anecdotal evidence indicates this last
possibility of pre-selection of participants was widely used and may have led to significant deadweight
effects. The number of participants in this programme increased from 43 900 in 2013 to 70 500 in 2015.
57. According to IEFP monitoring data, 52% of participants were employed one month after
termination of the programme Estágios Emprego, 61% after 3 months, 66% after 6 months and 68% after 9
months. OECD (2017a), using a propensity score matching approach based on administrative data, finds
that the employment outcomes of participants in subsidised internships improves significantly faster than
those of non-participants after 6 months. It is nevertheless advisable to continuously assess the risk of
deadweight effects of these programmes and discuss with social partners how this risk can be minimised.
58. The “employment stimulus” (Estímulo Emprego) programme, launched in 2011/2012 and closed
in June 2016, provided financial support to employers hiring registered unemployed people on permanent
or fixed-term work contracts lasting for at least 6 months. The target group covered partly the same groups
as the “employment internship” programme (although with a less strong focus on young people) and is
available to some additional vulnerable groups, in particular minimum-income recipients, long-term
labour-market inactive individuals, as well as workers above 45 years of age. Among companies eligible
for hiring unemployed on this scheme were companies that had started a special recovery process under the
Insolvency and Business Recovery legal code and companies that had started proceedings under the
Business Recovery extrajudicial system. The maximum duration of the subsidy was 12 months.9
Employers recruiting under this programme are required to provide new staff members with adequate
vocational training of at least 50 hours. Allocating the financial support within this programme was subject
to a net job creation requirement. The number of participants increased from 24 500 in 2013 to 58 200 in
2015. The programme was stopped as there was evidence that participants were often not employed after
the termination of the internship programmes, with employers preferring to hire new cohorts of staff
eligible to the subsidy and circumventing the net job creation requirement.10
59. A new employment incentive programme, set up in 2017, introduces a bonus to convert
subsidised temporary to permanent contracts. This new programme targets long-term unemployed. It
involved wage subsidies for a duration of 24 months. Eligibility is linked to net job creation (over the past
12 months). The last payment of the subsidy is conditional on maintaining the worker in employment.
Government estimates indicate a budget of EUR 60 million for a total of 15 000 supported jobs.
60. Programmes for socially useful work (Contrato Emprego-Inserção and Contrato Emprego-
Inserção+) are in place since 2009. These programmes can last up to 12 months and were initially aimed at
the unemployed: with disabilities, aged 55+, who are ex-convicts, or who have been out of a job for more
than a year (i.e. the long-term unemployed). There are two types of contract: the Contrato Emprego-
Inserção is aimed at those who are in receipt of unemployment benefits; and the Contrato Emprego-
9 . Depending on the condition of the participant and on the type of contract that was offered (permanent or
fixed-term), financial support could be as follows: 80% of the social support index multiplied by the total
number of months of the fixed-term work contract, not exceeding 80% of the social support index
multiplied by 6; 110% of the social support index multiplied by 12; 100% of the social support index
multiplied by half of the total number of months of the fixed-term contract, not exceeding 6 multiplied by
the social support index.
10 . The net job creation requirement referred to the date of application of the new hire for whom a subsidy is
granted. Net job creation was achieved when the total number of workers (the existing plus the new hired
subsidised worker) was higher than the lowest average number of the workers registered in the 6 or 12
months prior to the application. This verification was done by the technician by consulting the social
security database.
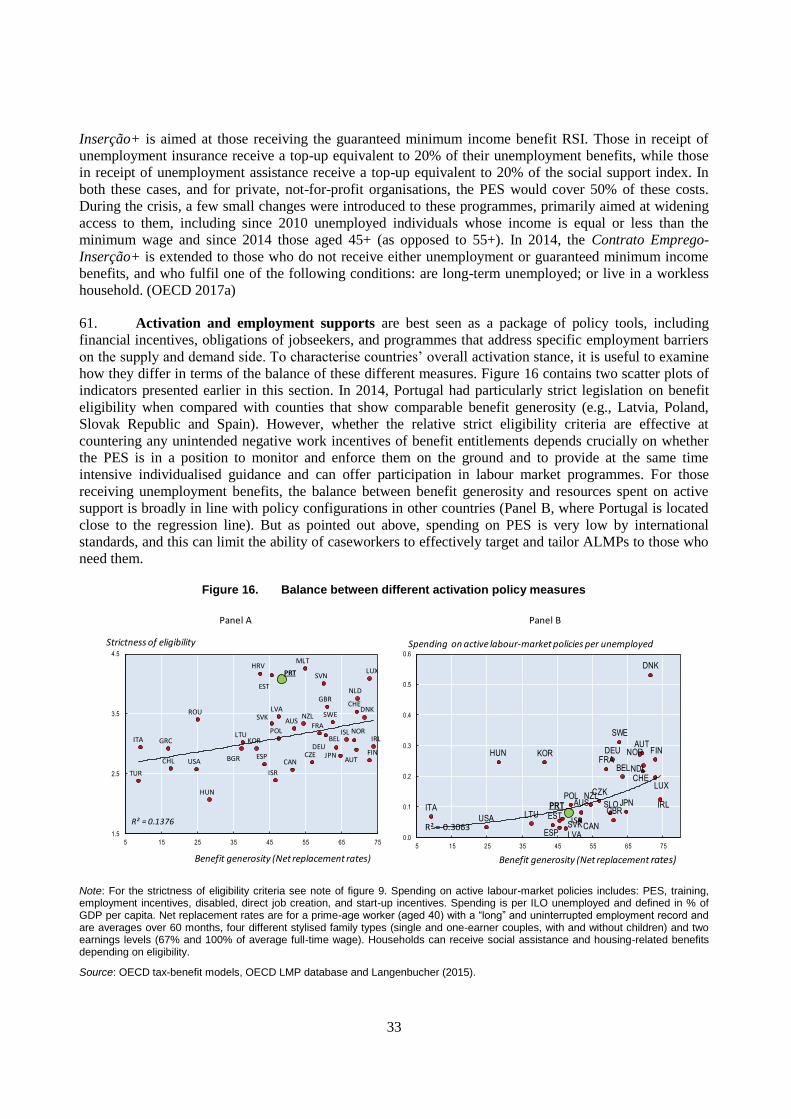
33
Inserção+ is aimed at those receiving the guaranteed minimum income benefit RSI. Those in receipt of
unemployment insurance receive a top-up equivalent to 20% of their unemployment benefits, while those
in receipt of unemployment assistance receive a top-up equivalent to 20% of the social support index. In
both these cases, and for private, not-for-profit organisations, the PES would cover 50% of these costs.
During the crisis, a few small changes were introduced to these programmes, primarily aimed at widening
access to them, including since 2010 unemployed individuals whose income is equal or less than the
minimum wage and since 2014 those aged 45+ (as opposed to 55+). In 2014, the Contrato Emprego-
Inserção+ is extended to those who do not receive either unemployment or guaranteed minimum income
benefits, and who fulfil one of the following conditions: are long-term unemployed; or live in a workless
household. (OECD 2017a)
61. Activation and employment supports are best seen as a package of policy tools, including
financial incentives, obligations of jobseekers, and programmes that address specific employment barriers
on the supply and demand side. To characterise countries’ overall activation stance, it is useful to examine
how they differ in terms of the balance of these different measures. Figure 16 contains two scatter plots of
indicators presented earlier in this section. In 2014, Portugal had particularly strict legislation on benefit
eligibility when compared with counties that show comparable benefit generosity (e.g., Latvia, Poland,
Slovak Republic and Spain). However, whether the relative strict eligibility criteria are effective at
countering any unintended negative work incentives of benefit entitlements depends crucially on whether
the PES is in a position to monitor and enforce them on the ground and to provide at the same time
intensive individualised guidance and can offer participation in labour market programmes. For those
receiving unemployment benefits, the balance between benefit generosity and resources spent on active
support is broadly in line with policy configurations in other countries (Panel B, where Portugal is located
close to the regression line). But as pointed out above, spending on PES is very low by international
standards, and this can limit the ability of caseworkers to effectively target and tailor ALMPs to those who
need them.
Figure 16. Balance between different activation policy measures
Note: For the strictness of eligibility criteria see note of figure 9. Spending on active labour-market policies includes: PES, training, employment incentives, disabled, direct job creation, and start-up incentives. Spending is per ILO unemployed and defined in % of GDP per capita. Net replacement rates are for a prime-age worker (aged 40) with a “long” and uninterrupted employment record and are averages over 60 months, four different stylised family types (single and one-earner couples, with and without children) and two earnings levels (67% and 100% of average full-time wage). Households can receive social assistance and housing-related benefits depending on eligibility.
Source: OECD tax-benefit models, OECD LMP database and Langenbucher (2015).
Panel A Panel B
AUS
AUT
BEL
BGR CANCHL
HRV
CZE
DNK
EST
FIN
FRA
DEUGRC
HUN
ISLIRL
ISR
ITA
JPN
KOR
LVA
LTU
LUX
MLT
NLD
NZL
NORPOL
PRT
ROUSVK
SVN
ESP
SWE
CHE
TUR
GBR
USA
R² = 0.1376
1.5
2.5
3.5
4.5
5 15 25 35 45 55 65 75
Strictness of eligibility
Benefit generosity (Net replacement rates)
AUS
AUT
BEL
CAN
CZK
DNK
EST
FINFRA
DEUHUN
IRL
ISR
ITAJPN
KOR
LVA
LTU
LUX
NDL
NZL
NOR
POLPRT
SVK
SLO
ESP
SWE
CHE
GBRUSA
R² = 0.30630.0
0.1
0.2
0.3
0.4
0.5
0.6
5 15 25 35 45 55 65 75
Spending on active labour-market policies per unemployed
Benefit generosity (Net replacement rates)

34
Partnerships and inter-institutional cooperation
62. Some elements of PES services are outsourced to a wide range of non-governmental
organisations (NGOs), private training institutions or public entities for vocational training and labour
market integration. For instance, for supporting adult unemployed jobseekers in their labour market
integration a network of 400 licenced Offices for Professional Insertion is in place at a municipality level.
.11
Few of these licensed Offices have some specialisations (e.g. for people with disabilities, migrants).
However, payments to these service providers are currently based neither on outcomes nor on jobseekers’
characteristics.
63. The Institute for Social Security (ISS), which is managing the minimum-income programme RSI,
is supposed to work in cooperation with IEFP and data should be exchanged between the two entities at the
municipal level. However, according to interviews with relevant local actors, local social services and the
PES, cooperation is not free of problems. Effectiveness and fluidity of information exchange appears
constrained by scarce resources at the PES. Further, the integration of information systems is not
sufficiently developed. No evaluation studies regarding the effectiveness of this cooperation were
identified (Perista and Baptista 2015). RSI recipients represented some 14% of the combined
unemployment and social assistance benefit recipient stock (see Figure 7), but only around 7% of ALMP
participants (IEFP data).
64. The project “One stop shop for employment” (Balcão Único do Emprego), currently under
development by the Ministry of Labour, Solidarity and Social security within the national programme for
simplification of public administration (SIMPLEX+), is intended as a step forward towards greater
digitalisation and co-ordination of public services (OECD, 2017b). The initiative develops online services
in order to facilitate PES/user interactions and to minimise the need to travel to the PES offices. Relevant
applications are concentrated into a single online platform where both candidates and employers can
handle relevant employment-related issues. A dedicated back-office support service staffed by technical
specialists (from different public institutions or already using a network of privileged contacts) shall be
available with full access to information coming from various databases. It is also planned to extend the
range of services and institutions represented on this platform, such as those relating to employment and
vocational training, education and qualification, social security, labour inspection, labour relations as well
as foreigners and border services are engaged.
65. The National Qualification Agency ANQEP (Agência Nacional para a Qualificação e o Ensino
Profissional), created in 2011 to improve cooperation and coordination across Employment and Education
portfolios, operates under the Ministry of Labour, Solidarity, and Social Security and the Ministry of
Education. ANQEP coordinates the different pathways leading to post-secondary vocational qualification,
including professional schools12
and technological schools.13
There seems to be a competition between
these school types. The IEFP apprenticeship scheme often commence in March / April as well as in
11 . In addition, the PES has partnerships with training institutions.
12 . Professional schools were set-up in 1999. They target low-educated youth (including early school leavers).
The training consists of a class-room based and a practical part (provided at schools). About 30 000 young
people were enrolled yearly. With the New Opportunities Initiative (2005-2010/11), vocational /
professional courses have been offered at secondary schools (at professional schools as well as within
upper secondary school.
13 . There is also the possibility to complete upper secondary and then to enrol in a technical school (“cursos
tecnologicos”) (1 to 2 years of schooling). These courses are designed in a dual way. There is a high
demand for this type of courses and employability is high. However, these courses do not seem to be very
attractive for young people. It seems that upper secondary VET has a bad reputation among young people
(mission to Portugal).

35
September / October. There is the assumption that children from poor families might be attracted by this
scheme, implying that they leave school early. For adults there is the possibility to obtain a vocational
qualification through RVCC, certified modular training (CMF) and Adult education and training courses
(EFA). These different pathways are based on a unified national catalogue of qualifications. One of the key
recommendations of OECD (2017b) is to consolidate the two VET systems into a single dual VET with
strong workplace training and perform a thorough audit of all vocational training programmes.
3.3. Policy challenges
66. This sub-section highlights groups with relatively low employment rates in Portugal, and
discusses areas where policies could be reinforced. It also summarises selected recent policy reforms
intended to increase employment among these groups.
Designing and implementing effective skills policies
67. Low education level is a challenge that is common to unemployed youth and adults. The
composition of ALMP participants varies with regard to their educational level, with lower participation
among the low-educated (Table 5).
Table 6. Education levels of ALMP participants
In 2015
Below first cycle of primary education
First cycle of primary education
Second cycle of primary
education
Third cycle of primary
education
Secondary education
Higher education
Total
Employment measures 2% 10% 10% 19% 28% 31% 100%
Training measures young people 0% 0% 1% 95% 4% 0% 100%
Training measures adults 3% 11% 15% 28% 29% 15% 100%
Vocational rehabilitation 7% 12% 20% 38% 17% 6% 100%
Source: data provided by IEFP.
68. Among OECD countries, Portugal has achieved the second highest increase in education
attainment between generations: while only 23% of those aged 55 to 64 attained at least upper secondary
education, this rate jumps to 65% among 25-34 years old (OECD, 2017b). This achievement, has,
however, not been without conflict between the younger generation who went through the usual upper
secondary vocational education and the older cohorts who went through upskilling programmes. Another
line of conflict arose between different pathways of young people to achieve upper secondary vocational
education. Finally, there remains a mismatch between the supply and demand of specific VET and higher
education courses, with skills mismatch as well as a low skills level continuing to represent major
employment barriers. Some of the adult education pathways have suffered a bad reputation due to an
assumed substitution effect of employment between generations. Nevertheless, evaluations have shown a
positive link between upskilling adults and increasing the educational level of younger generations, as the
school pathways and learning successes of children and young people are likely to depend on interest and
skills of parents.
69. The difficulties in skills governance were acknowledged by the authorities during the last decade,
resulting in numerous government initiatives, including the creation of a national agency to supervise all
adult education and vocational education and training programmes, ANQEP (Agência Nacional para a
Qualificação e o Ensino Profissional). These efforts have been reinforced in 2016, by establishing a
national system of credits in all vocational education and training courses, the Qualifica Passport (see

36
above) and the reactivation of the National Council for vocational education and training (Conselho
Nacional para a Formação Profissional) (OECD, 2017b). Nonetheless, responsibilities for both the
governance of the VET system and VET provision still span two ministries.
70. A skills anticipation system based on local skill needs is in place. Since the 1990s the Ministries
of Education and Labour carried out a series of skills anticipation studies, including sectoral studies. Up to
2006 an innovative institute, with involvement of relevant stakeholders, was tasked with skills anticipation.
It conducted about 45 studies, as well as in-depth analysis of sectors, partly based on scenario techniques.
However, the results were not fully translated into the training policies. Now there are 16 Sector Council
for qualification providing feedback and updates on skills anticipation to ANQEP. Since 2014, new efforts
are underway to undertake skills anticipation exercises at local level. For PES training, the training needs
identification has been carried out since many years at local level within the services proposal of an annual
training plan. This identification of training needs is based on the analysis of the labour market, the inputs
of territorially based partnerships and on the profile of the unemployed registered in PES.
Long-term unemployment
71. In 2015, 57% of the unemployed had been out of a job for a year or more. While this is partly a
legacy of the crisis, much of the challenge appears structural as long-term unemployment incidence was
already very high (47%) in 2007 (Figure 17). Part of the rise in long-term unemployment reflects a
composition effect, as those who have been unemployed for short periods are most likely to be exiting
unemployment as the recovery kicks in. But long-term unemployment is also self-sustaining: the longer
someone has been out of work, the harder it becomes to successfully transition back into employment. This
raises the risk of a further increase in structural unemployment – and there is some indication that this may
already have occurred in Portugal (OECD, 2017a). An additional concern is that the rise in long-term
joblessness has affected some groups more than others: at the end of 2013, two thirds of the low-skilled
unemployed had been out of a job for a year or over – which points to the importance of maintaining,
adapting, and improving skills of jobseekers.
Figure 17. The incidence of long-term unemployment, 2000 to Q3 2015
Proportion of the unemployed who have been out of a job for one year or over
Source: OECD Employment Database.
0
10
20
30
40
50
60
70
80
Other OECD Countries OECD Average Portugal

37
72. In 2015, about 72% of ALMP participants were unemployed for less than 12 months, 16% had
been unemployed for 12-23 months, and 12% were unemployed for more than 2 years. It is indeed
important that unemployed are activated at an early stage. However, the incidence of long-term
unemployment among ALMP participants in Portugal points to risks of leaving the long-term unemployed
behind.
73. Targeting of support to long-term unemployed was somewhat better for the internship
programme, the employment stimulus programme as well as the programme for socially useful work
‘Contracts Employment-Insertion’ (CEI) which are designed for long-term unemployed (see Section 3).
The long-term unemployed who are in receipt of an unemployment benefit may be integrated in the CEI.
Long-term unemployed not receiving an unemployment benefit, including RSI recipients, can take part in
the ‘Contracts Employment-Insertion+’ (CEI+) (see Section 3). However, in late November 2014 a
complaint presented by the major Portuguese trade union (CGTP-IN) claimed that the measures were being
used by public entities to replace regular jobs in the public administration (Perista and Baptista, 2015). The
Ombudsman urged the Ministry of Solidarity, Employment and Social Security to undertake an evaluation
of the measures with respect to its impact on employment. The Ministry of Labour, Solidarity and Social
Security carried out a preliminary assessment of active labour market policies. The report was presented to
the social partners.
Box 2. Approaches for supporting long-term unemployed support in Europe
The complexity of problems facing long-term unemployed may call for combining specific expertise in order to provide adequate services. Examples from international experiences are the Job Centres in Denmark, which work with teams of counsellors specialised in working with the long-term jobless and supporting either unskilled individuals or university graduates. In Austria, the PES office in Vienna has specific counsellors in charge of supporting long-term unemployed persons with a mental or physical handicap. In Bulgaria, in addition to “generalist” PES counsellors, some specialised counsellors are in charge of supporting unemployed individuals of Roma origin and encouraging inactive Roma to register with the PES. A number of further countries (e.g. France, Croatia, Germany, Austria and Denmark) have specific advisors dealing with youth unemployed, including those with long out-of-work spells (European Commission, 2014).
High rates of youth unemployment
74. In the third quarter of 2015, Portugal had the 4th highest youth unemployment rate in the OECD,
after Spain, Greece and Italy. One out of six young adults aged 15-24 is neither in a job, nor preparing for
employment, the so-called “NEETs”. They have been in the focus of activation policies for many years
(see for details Section 4).
75. In addition to its business cycle component, higher youth unemployment is also a result from
lengthy pathways from school to stable employment. Further, there are still inefficiencies in matching
supply and demand of skills. Interlocutors during the country dialogue mission reported that this seems to
be the case both at upper secondary education and training as well as at tertiary level. In addition, early
school leaving lead to a higher risk of unemployment.
76. The disproportionate increase in youth unemployment during the recession also occurred in some
other OECD countries, particularly those where – like in Portugal – there are large gaps in the scope of
employment protection legislation between temporary and permanent contracts. In those countries, youth
are often hired on temporary contracts, with little hope of moving to a permanent position. When a
recession hits, they are therefore especially likely to lose their job (OECD, 2017a). While formal
employment protection rules have been significantly reformed between 2011 and 2014, legislation remains
relatively strict by international standards for Portuguese workers on permanent contracts (see below).

38
Labour market segmentation: employers still have strong incentives to hire on temporary contracts
77. The Portuguese labour market is characterised by a high degree of segmentation. In 2015, 22% of
workers in dependent employment had a temporary contract, compared to just 11% across the OECD on
average (Figure 18). The incidence of temporary employment is higher still for certain groups, like young
people (67%). While temporary employment in itself is not necessarily bad, excessive use of such types of
contracts can have an adverse impact on labour market outcomes. In particular, workers on temporary
contracts often face a higher degree of job insecurity than employees on regular contracts, and firms may
invest less in non-regular workers, for example regarding training, which in turn may depress productivity
growth (OECD, 2014b, OECD, 2015).
78. The large share of temporary employment is consistent with the sizeable gap in employment
protection legislation between permanent and temporary contracts. Sizeable labour market reforms in
recent years have sought to reduce this gap. For example, severance pay on new permanent contracts is
now lower than on temporary contracts, and there is some evidence that this may have incentivised hiring
on permanent contracts (OECD, 2017a). Despite this, a large proportion of the employment growth
between 2013 and 2015 has been on temporary contracts and despite these reforms, Portugal’s EPL for
permanent workers remains one of the most stringent in the OECD (Figure 19). The Portuguese EPL
reforms rank among the most substantial of those implemented by OECD countries in recent years. The
evolution of the OECD indicators of EPL shows a decrease in the strictness of EPL concerning dismissals
while the strictness of temporary contracts was reduced slightly between 2008 and 2013 (OECD 2017a).
Collective dismissals are less stringent in Portugal than on OECD average. However, de facto, EPL may be
less strict, as there is a lot of anecdotal evidence that SMEs have always found ways to bypass strict EPL,
e.g. closing down some activities and setting up new entities.
79. Nevertheless, the temporary extension of the duration of fixed-term contracts as a crisis-related
measure made supported temporary contracts feasible for a larger share of workers. And downward
nominal wage rigidity in a context of low inflation suggests that temporary contracts will remain a key
source of flexibility.
80. The current government seeks to promote the stabilisation of employment pathways and to
promote permanent employment (see also a new design of hiring incentives above). Experts met during the
mission have found that segmentation has augmented between protected skilled prime-age workers on the
one hand, and unskilled and older workers as well as young people entering the labour market and informal
employment on the other. While long pathways into stable employment for young people may be more
common in countries with strict EPL, a specific feature in Portugal is that the young generation, in instable
employment conditions, has a much educational level than the more protected prime age and older
population.
81. Other policy factors also affect the employment stability of low-skilled workers, many of them
on temporary contracts. They include the level of employer taxes and social security contributions for
minimum-wage workers, which is higher than in most other OECD countries. While significant labour-cost
reductions are available for job starters and some other groups, the intended increase of the minimum wage
to EUR 600 by 2019 underlines the importance of targeting these measures effectively to avoid dis-
employment effects among low-skilled workers.
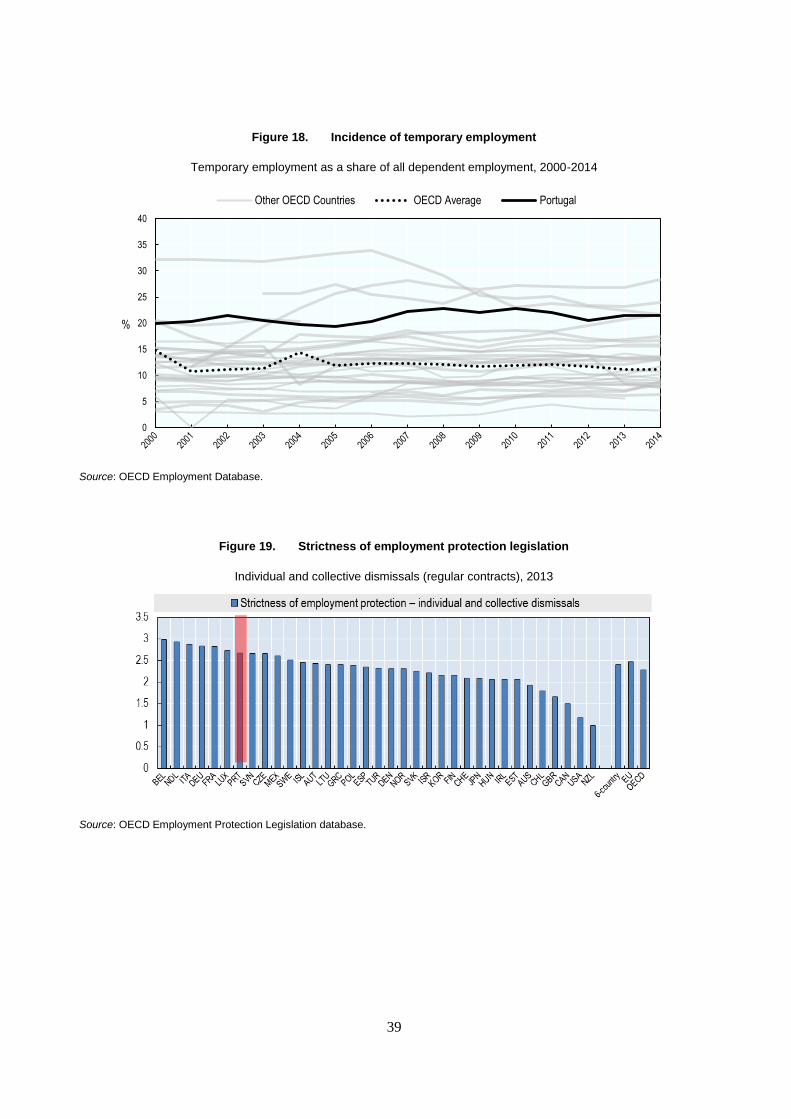
39
Figure 18. Incidence of temporary employment
Temporary employment as a share of all dependent employment, 2000-2014
Source: OECD Employment Database.
Figure 19. Strictness of employment protection legislation
Individual and collective dismissals (regular contracts), 2013
Source: OECD Employment Protection Legislation database.
0
5
10
15
20
25
30
35
40
%
Other OECD Countries OECD Average Portugal

40
4. OVERCOMING EMPLOYMENT BARRIERS:
POLICY CHALLENGES AND PRIORITIES FOR SELECTED GROUPS
82. The remainder of this paper focuses on the policy settings relevant for three of the nine groups
identified by the statistical clustering analysis and examines whether the policies are well suited for
addressing the main employment barriers that group members face. The groups selected are as follows:
Group A - “Prime-age long-term unemployed with low education and scarce job opportunities”
(20% of the target population).
Group B - “Long-term unemployed youth without any past work experience and with scarce job
opportunities” (9% of the target population).
Group C - “Youth with unstable employment, some recent work experience and often with
insufficient skills” (6% of the target population).
83. Most individuals in all of these groups are actively looking for work and their education levels
are often low. The groups differ in terms of age, past work experience and opportunities. The first group
comprises prime-age unemployed, who face a lack of job opportunities, but who benefit from past work
experience. The second and third groups include individuals who are significantly younger. Individuals in
the second group have no past work experience at all and face scarce job opportunities. Individuals in the
third group have a limited work experience, but their characteristics mean that they tend to have better job
opportunities than the other two groups, and a significant share of them have in fact worked during part of
the past year.
84. The next three sub-sections describe the main employment barriers faced by each of these three
groups and the policy settings and supports that are relevant for them. Each section begins with a box
containing a Venn diagram showing extent and degree of overlap of the main barriers characterising the
group, as well as other important individual and household characteristics that are common for the group.
Together, this information can help in attaching labels (“faces”) to groups, although labels are necessarily
arbitrary to some extent. Complementing this summary narrative, Table A1.2 in Annex 1 reports a
comprehensive list of individual and household characteristics for each of the groups.
4.1. Prime-age long-term unemployed with low education and scarce job opportunities
(Group A)
85. This group is 43 year old on average and was unemployed during most of the reference period
(2013). Only 14% of them found a job by the time of the interview while 82% were still actively looking
for work. The most common employment barrier faced by this group is an overall lack of job opportunities
which is related to the low level of work-related capabilities characterising this group. 66% have very low
education (41% have completed primary education only, and 25% have a lower secondary degree) and
their past occupation was often at “low” skills levels, typically as craft/machine operators (35%) or clerks
(30%). 23% also face health limitations. As in all EU countries except Greece, the risk of long-term
unemployment was highest among the low-skilled and lowest among the high-skilled. In 2013, the long-
term unemployment rate for 25-64 years old was 10.8% among the low-skilled, 8.7% among those with an
intermediary skills level and 5.6% among the low-skilled. The low-skilled represented two-thirds of all
long-term unemployed adults and the share of long-term unemployed among low skilled unemployed was
57% (Düll et al., 2016).

41
86. On average, members of this group face 2.4 simultaneous employment barriers (see Policy
Analysis Note and Box 3). They tend to have dependent children and half of them live in a household with
no other working adult. As a result, members of this group are often income-poor: 42% live in households
in the bottom income quintile, 41% are at risk of poverty, 42% face material deprivation, and around 20%
are severely deprived. 45% received unemployment benefits (EUR 6204/year on average) and 31% family
benefits (EUR 906/year).
Box 3. Group A: “Prime-age long-term unemployed with low education and scarce job opportunities”
Main employment barriers Selected characteristics % of the Target Pop.
43 years old (average)
Unemployed
Length of unemployment spell: 12+ months (average)
21 years of paid work (average)
10.9 years of schooling (average)
Average equivalised disposable income: EUR 6867 (2nd
quintile)
2.4 simultaneous employment obstacles (average)
Income support
87. Income support for the long-term unemployed is available for up to 540 days, but its level is
comparatively low (Figure 20).
88. Over the past years, Portugal has implemented several reforms to reduce the generosity of
unemployment insurance, in particular by reducing the cap and making it decreasing over time and
shortening its duration. Early evidence on the impact of lowering of the cap and the introduction of the
declining replacement rate, shows no statistically significant impact on exiting unemployment (OECD
2017a). The relatively generous benefits duration may have contributed to the increase in long-term
unemployment in the past, in particular for those of prime-age. Related to such concerns, the maximum
duration was shortened in 2012 from the second unemployment spell onwards. To counteract hardships,
recent reforms were also implemented to the unemployment assistance scheme. In the case of individuals
aged 40 or over, the duration of unemployment assistance was increased from the second unemployment
spell onwards.

42
Figure 20. Net replacement rate for long-term unemployed
Single person, 67% of average wage, after 5 years of unemployment
By country, 2014 In Portugal, 2007-2015, including top-ups
Source: OECD Tax-Benefits model - http://www.oecd.org/social/benefits-and-wages.htm
Public employment service
89. There are margins to facilitate closer or more regular links between jobseekers and the Public
Employment Service. According to LFS data, in 2013, about 40% of individuals resembling those in
Group A (prime-age long-term unemployed with low education and scarce job opportunities) had
contacted the PES to find work (Figure 21, Panel A). This is a figure much lower than in many other
countries. Only 4% of individuals with a profile similar to those in Group A benefitted from training – this
is somewhat higher than the EU average but well below that of the best performers (Figure 21, Panel B).
90. In 2012, the government launched a broad initiative to modernise the PES, including two
measures with considerable relevance for Group A or those at risk of becoming long-term unemployed:
1. A strengthening of activation through referrals to active labour market measures for two target
groups was at the centre of a job centre methodology called Convocatórias. The two target
groups included jobseekers aged 45 years and above as well as unemployed for six years and
longer, eligible for unemployment benefit. These groups had to meet with their caseworkers at
the Public Employment Service, while for other groups this was less systematic and may not take
place. Although, in general registered unemployed had to show-up fortnightly (this obligation has
recently been removed, see Section 3), and sanctioning rules are theoretically strict if jobseekers
reduce to take-up referrals to ALMP and job offers, implementation was weak. In the context of
implementing this method caseworkers decided after the mandatory meeting with jobseekers
from the two target groups on the basis of individual assessments, including further monitoring of
job-search efforts, to refer the unemployed to a specific ALMP, including counselling,
internships, hiring subsidies, training, or public works, or to a job interview in case good matches
were found with available vacancies. Further, individual employment plans were updated if
needed. Martins et al (2014) assessed the impact of this measure on re-employment of those
aged 44 years or less who were unemployed for six months or more, as compared with those
unemployed for less than six months. This methodology has been found to double the next-month
0
10
20
30
40
50
60
70
80
90
100
With top up With no top up
0
10
20
30
40
50
60
70
80
90
100

43
reemployment probability of those who had been unemployed for at least six months. Another
interesting result of this evaluation study is that this methodology did not negatively impact on
the reemployment probabilities of those not eligible for unemployment benefits, indicating that
no substitution with this group was taking place (Martins et al. 2014). Between 2012 and 2016,
around 70% of unemployed covered by the implementation of this methodology were younger
than 45 years (according to data provided by IEFP).
2. Other elements of the initiative include an upgraded vacancy-registration tool, disseminated via
social media, and integrated with the online vacancy database (Portal Net Emprego), in order to
strengthen the role of the PES in job broking There are also plans to co-operate more closely with
other stakeholders (temporary work agencies, private employment agencies, employer
associations, Offices for Professional Insertion – Gabinetes de Inserção Profissional) to better
capture existing job vacancies. Options for electronic registration are being improved as well,
including the possibility for the PES to upload individual action plans.
Figure 21. The role of Public Employment Service in job finding and access to lifelong learning: Group A
Share of prime-age long-term unemployed with low education, 2014
PANEL A – Contact with the Public Employment Service PANEL B - Participation to lifelong learning
Source: Calculations based on EU-LFS
Training, upskilling and second-chance education
91. In comparison to other European countries, the average skills of Portuguese citizens are still low,
despite recent improvements. 45% of the working age population have attained an upper secondary
education, the lowest rate in the EU (Figure 22). This is a well-identified policy-challenge in Portugal.
Impressive improvements in educational attainment of new generations have been achieved, but as
discussed above, the legacy of lower-educated cohorts means that education levels for the working-age
population as a whole still lag behind most OECD countries.

44
Figure 22. Low, but improving education levels in Portugal
Adult education level, % of 25-64 year-old, 2015 or as indicated
Source: Education at a glance: Educational attainment and labour-force status
92. Upskilling adults has been a central ambition of labour market policy for many years, starting in
the early 2000s and reinforced with the introduction of the New Opportunities programme in 2005 (see
Section 3). Opportunities for validating and certifying existing competences were linked to upskilling and
education measures and modular courses were tailored to different levels of education and non-formally
acquired skills. Adult Education and Training Courses (Cursos de Educação e Formação de Adultos)
sought to offer content equivalent to school grades 9 to 12. Enrolment objectives for 2010 were 42 000 at
grade 9 and 65 000 grade 12. These objectives were surpassed with actual enrolment by December 2010 at
more than 167 500 and the number of participants surpassed the objective at the two grades (UNESCO et
al. 2011). In 2015, about 28% of the 41 300 participants in the Adult Education and Training Courses were
aged 35-44, 12% were aged 45-49, and 20% were 50 and older. In 2013, the share of 25-34 years old
(31%) as well as the share of 35-44 (30%) was slightly higher. The share of 34-44 years old participants in
modular training courses (Formação Modular – Ativos empregados), which are targeted at employees and
can be regarded as a preventive measure, amounted to 31% and the 44-49 years old represented 14%.
93. Table 6 suggests that overall adult education courses are reasonably well targeted at unemployed
and workers with low education levels, with the notable exception of those with the lowest educational
level. Participants with an education level below the secondary level represent more than half of the
participants. However, data of participants by duration of unemployment shows that those who are
unemployed for less than twelve months are more likely to participate than long-term unemployed. In
summary, training measures that successfully target prime-age low-skilled and long-term unemployed
remain in relatively short supply.
0
10
20
30
40
50
60
70
80
90
100
By year (PRT) By country (2015)
Upper secondary Tertiary Below upper secondary

45
Table 7. Participants in adult education by programme and educational level in 2015
Total
number of participants
Below first cycle of primary education
First cycle of primary education
Second cycle of primary
education
Third cycle of primary education
Secondary education
Higher education
Adult education 306 031 3% 11% 15% 28% 29% 15%
Adult education and training Cursos de Educação e Formação para Adultos
41 285 4% 12% 29% 38% 15% 1%
Modular Training Formação Modular - Ativos empregados 51 241 0% 8% 12% 29% 32% 19%
Active Life Vida Ativa- Emprego Qualificado - Gestão Direta
184 167 1% 11% 13% 27% 32% 17%
Active Life Vida Ativa - Emprego Qualificado - Entidades Externas
20 476 0% 6% 10% 29% 36% 19%
Education for inclusion Formação para a Inclusão 6 719 64% 35% 1% 0% 0% 0%
Source: data provided by IEFP
Employment Incentives
94. In 2015, there were about 64 700 participants in the programme for socially useful work for the
long-term unemployed (CEI and CEI+, see Section 3). 27% of participants were aged 35 to 44 years, 17%
were aged 45 to 49 years and 33% were between 45 and 49 years old.
95. The long-term unemployed are also specifically targeted by the Reativar measure introduced in
2015 and consisting of six-month traineeships. In 2015, about 1 000 people participated, of whom 47%
were aged 35-44 years, 15% were aged 45 to 49 and 16% were 50 years old and above (for those aged 45
or above, PES co-payments to traineeship providers rise by 15%). The number of overall participants
doubled in 2016, but the programme remains small. Most participants had either secondary or higher
education (Table 7).
96. The employment stimulus programme Estímulo Emprego in place until the end of 2016, provided
financial support to employers offering registered unemployed people permanent or fixed-term work
contracts lasting at least 6 month work contracts (see Section 3). It was focused on 25-34 years old, who
represented 35% of participants in 2015. About 22% were aged 35 to 44, and 10% were 45-49 years old.
This programme was de facto better targeted at those with a lower educational level than the above
mentioned programme Reativar, as the structure of participants by educational level shows (Table 7).
Table 8. Participants in targeted employment incentive programmes by education level in 2015
Total
number of participants
Below first cycle of primary
education
First cycle of primary
education
Second cycle of primary education
Third cycle of primary education
Secondary education
Higher education
Reativar 1 087 0% 1% 3% 21% 34% 39%
Programme for socially useful work CEI / CEI+
64 744 5% 22% 18% 25% 21% 8%
Estimulo Emprego 58 163 0% 7% 10% 23% 32% 27%
Source: data provided by IEFP

46
97. In January 2017, it was replaced by the “Contrato-Emprego”. The new measure is focused on the
promotion of hiring on open-ended contracts, while restricting support for temporary contracts to specific
cases such as the long-term unemployed. Permanent contracts are also promoted through an increasing
difference in the benefits granted for each type of contract. Further, in order to reinforce the effectiveness
of the scheme, the reimbursement period of the support was extended: the last payment of the total amount
of the financial support is now made 24 months after the beginning of the open-ended contract. This is
meant to promote longer and more sustainable integrations into the labour market. To promote effective
job creation after the end of the hiring subsidy, in the case of fixed-term contracts, there is a bonus awarded
for the conversion to permanent contracts. The programme Contrato-Emprego is expected to create about
15 000 jobs in 2017, with an overall budget of EUR 57 million.14
98. For professional traineeships, an award for the transitions from traineeship contract to open-
ended contract was created, requiring the maintenance of the employment level obligation. The payment of
the conversion award is made 13 months after the open-ended contract starts. Monitoring mechanisms
were introduced, in order to prevent eventual abusive uses of the measure. Further, similar to changes
introduced in the hiring support scheme, professional traineeships are now subject to a tender period. The
ranking of applications considers the employability outcomes of prior supports granted to the applicant
employer, among other factors, as an incentive to good practices. The new scheme further values
qualification efforts of trainees, by increasing the value of the internship grant for trainees with masters and
doctorates.15
99. Hiring subsidies targeted at low-skilled workers include the Estímulo 2012 and Apoio à
Contratação via Reembolso da TSU. Both were introduced in 2012, revised in 2013, and eventually
merged into one single programme (Estímulo Emprego) in 2014. While these programmes have been
focused primarily on youth, the low-skilled and the long-term unemployed, their coverage has changed and
broadened over time.
100. Employment incentives include the reimbursement of full or parts of the employers’ social
security contributions (Apoios à Contratação via Reembolso da TSU). Regulations of the year 2013 make
this support possible for fixed-term and permanent employment, full-time or part-time, but with a
minimum length of contract of six months. Target groups are young people between 18 and 30 years,
unemployed aged 45 or above, as well as prime-aged unemployed aged between 31 and 44 years in a
vulnerable situation, e.g. due to their low educational level, being single parent or the spouse of an
unemployed. They represented 5% of all hiring incentives in 2015 (which is a significant decrease as
compared to 16% in 2016). OECD (2017a) carried out an assessment of the impact of hiring subsidies in
general in Portugal, using a propensity score matching approach on the basis of administrative data,
showing that the outcomes in terms of employment after 6 months after terminating the measure was
largely above those in the control group. The gap narrowed over time, but was still large after 24 months.
101. A differentiation of reduction rates by contract type is under discussion. The discussed reform
plans aim to render have a higher reimbursement rate for permanent contracts than for fixed-term
contracts, in order to set incentives for hiring on fixed-term contracts. Some concrete reforms are now
being proposed with reductions for young people amounting to 50% and being available for five years. The
duration would be three years for long-term unemployed, while very-long-term unemployed as well as
older workers over the age of 45 would qualify for a 100% reduction over a period of three years when
hired on a permanent contract. Further, the portability of social security contribution reductions is currently
discussed, with the aim to increase mobility between (subsidised) jobs.
14 . Portaria n.º 34/2017, de 18 de janeiro
15 . Portaria n.º 131/2017, de 7 de abril

47
Health policy
102. One quarter of Group A report poor health conditions that limit their ability to work. While the
health status of prime-age working adults is good overall, the picture is different for the out-of-work
individuals. According to Eurostat, 4% of the 45-54 year old in employment report long-standing health
limitations, while it is the case of 7.5% of the unemployed and 16% of the inactive in the same age group
(Figure 23). The Eurofound Survey on Working Conditions also concludes that 19% of the unemployed
and inactive aged 35-49 report severe health problems, against less than 4% of employees.
103. Health and work are interrelated in many ways: health problems can reduce labour market
participation and income, and conversely, bad employment conditions or unemployment can negatively
affect physical and mental health (OECD, 2016c). Expenditure data for disability benefits and paid sick
leave illustrate the substantial immediate fiscal burden related to ill-health. Combined public and
mandatory private expenditure on disability benefits and paid sick leave represented, respectively, 1.6%
and 0.6% of GDP in Portugal in 2013, compared to 1.2% and 0.8% on average across EU countries (Figure
24). This pattern with above- average spending on disability benefits and below- average sickness benefits
may suggest scope for rebalancing expenditures from disability benefits towards measures aimed at
maintaining or restoring work capacity of those with temporary health-related absences from work. The
share of budget spent on vocational rehabilitation measures are low (1.6% of budget spent by IEFP on
ALMPs in 2015). The number of participants amounted to 10 300 in 2015, including 3 000 participants in
guidance and diagnostic measures, and had more than doubled since 2013. For instance, evidence for a
number of OECD countries point to positive effects of return-to-work programmes and
flexibility/adjustments that allow those affected by sickness or disability to continue their usual activities
as much as possible and at an early stage (Waddell and Burton, 2004, OECD 2010).
104. Costly health care can discourage effective prevention, in particular among low-income groups.
In Portugal, out-of-pocket expenditures are comparatively high (27% of total health expenditure, as
opposed to 17% in the EU on average, source: OECD Health Statistics database). As a result, those with
limited incomes may be reluctant to seek treatment for health conditions when they first arise, causing
greater risks for more significant and harder-to-address problems later on.
Figure 23. Self-perceived severe long-standing limitations in usual activities due to health problem in Portugal
Population aged 45-54, 2015
Source: Eurostat

48
Figure 24 . Expenditure on disability benefits and paid sick leave
In % of GDP, 2013
Note: Public and mandatory private expenditures.
Source: OECD (2016), Health at a Glance.
105. Interlocutors during the country dialogue mission mentioned that tighter conditions for assessing
health status and eligibility for income support have recently led to a reduction of inflows into the
disability scheme, while receipt of sickness benefits remained stable during the crisis, even as employment
declined markedly. One weakness of the current system is the often weak financial incentive to go back to
work. Plans are currently underway to reform the disability scheme to allow disability pensioners to
combine disability benefits and work, similar to approaches in other countries, such as Estonia. Another
approach that is currently under discussion, is to guarantee disability benefit recipients a “right to return to
benefits” in case they start and subsequently lose a new job.
4.2. Long-term unemployed youth without any past work experience and with scarce job
opportunities (Group B)
106. The second focus group consists of young people (average age of 24 years) who had been
unemployed for most of the reference period (78%). This group is likely to face three or more
simultaneous employment obstacles, the second-highest incidence of multiple barriers among all nine
groups. A major barrier is low professional skills, reinforced by the fact that 70% do not have any work
experience. Low skills levels and low education (53%) are likely to reduce employment possibilities and
this helps to explain why all group members face scarce job opportunities.
107. All of those who were unemployed throughout the reference period were still either unemployed
or inactive at the time of interview, i.e. a few months to one year after the end of the reference period.
Among them, only 4% receive unemployment payments, which puts individuals in this group under severe
financial strain. 74% live with their parents and 68% live in a household where another adult is working,
meaning that they have access to income from sources other than benefits. Nonetheless, 70% live in
households in the poorest fifth of the population, 45% are at risk of poverty and 49% face material
deprivation. 28% are severely deprived, the highest share among all nine groups.
0.8
0.6 0.
8
1.1
1.0 1.
2
1.1
0.6
1.0 1.
2
1.1
0.1
1.1
1.2
1.6
1.4
0.9
1.7
1.3
1.8 1.
2
1.3
2.2
1.20.
1
0.4 0.
4 0.3
0.4
0.3
0.4 1.0 0.7
0.5
0.6 1.
8
0.8 0.
8 0.6 0.
8
1.4 0.7
1.2 0.7 1.3
1.3 1.
0
0.8
0
0.5
1
1.5
2
2.5
3
3.5
4
% of GDP
Disability Paid sick days

49
Box 4. Group B: “Long-term unemployed youth without any past work experience and with scarce job opportunities”
Main employment barriers Selected characteristics % of the
Target Pop.
- 24 years old (average)
- Unemployed
- Length of unemployment spell: 12+ months (average)
- No past work experience
- 11.6 years of schooling (average)
- At risk of poverty
- Average equivalised disposable income: EUR 6 081 (1st
quintile)
- 3 simultaneous employment obstacles (average)
108. Like one fifth of all 20-24 year-olds in Portugal, members of Group B are NEETs (not in
employment, education or training), a group identified as a policy priority at European level (see Figure
25).
Figure 25. Youth not in employment, education or training (NEET)
% of 20-24 year-olds, 2014
Source: OECD, Education at a glance: Transition from school to work
Income support
109. As illustrated by the low share of Group B receiving benefits, access to income support is
typically limited for Portuguese youth, both in terms of unemployment benefits and lower-tier safety nets
(guaranteed minimum income). As regards unemployment benefits, one year of contribution is necessary
to be entitled to unemployment benefits in Portugal, a requirement that is however not unusual in a
comparative context (see Figure 26). Nonetheless, with a high share of young people with no or limited
work experience, many young jobseekers are not covered by benefits or associated employment-support
measures.

50
Figure 26 Twelve months of work experience bring entitlements to unemployment insurance benefits, but the duration of benefit payments is often short for young people
Minimum employment / contribution period in months and maximum duration, in months, of unemployment insurance benefits for a 20 year-old with one year of previous employment, in 2014
Note: 20-year-olds with a contribution record of one year do not qualify for unemployment insurance benefits in Belgium, Ireland, the Slovak Republic and Turkey. Norway has a minimum earnings requirement instead of a minimum contribution period. In Luxembourg, reduced benefits are paid to school graduates without employment record after a waiting period. No maximum benefit duration applies in Chile. No unemployment insurance benefit programmes exist in Australia and New Zealand. For the United States, results are for the State of Michigan.
Source: OECD Tax-Benefit models, www.oecd.org/social/benefits-and-wages.htm.
110. Those not covered by unemployment benefits cannot necessarily fall back on support from
lower- tier safety nets. Most individuals in Group B are likely to live with their parents - the share of
NEETs living with their parents is the 3rd
highest in the OECD (OECD, 2016a). Such living arrangement
does not however guarantee those young people a sufficient income, as most of them live with an income
in the lowest income quintile. As discussed in section 3.1, eligibility to RSI involves strict conditions on
household-level incomes and assets. Moreover, young people above 16 are not entitled to family benefits,
unless they are in education, which excludes NEETs. Only 4% of young people aged 16-29 live in a
household receiving minimum-income benefits (12% if housing benefits are included), among the lowest
share in the OECD (Figures 27 and 28, and OECD, 2016a).
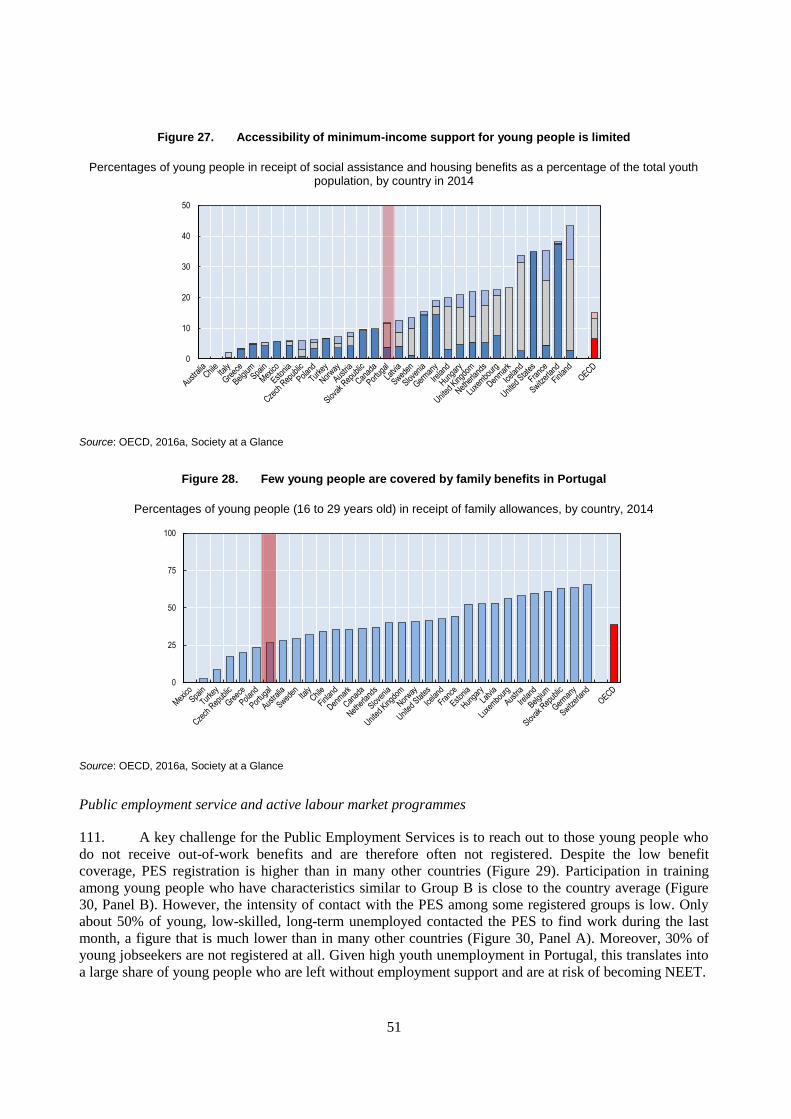
51
Figure 27. Accessibility of minimum-income support for young people is limited
Percentages of young people in receipt of social assistance and housing benefits as a percentage of the total youth population, by country in 2014
Source: OECD, 2016a, Society at a Glance
Figure 28. Few young people are covered by family benefits in Portugal
Percentages of young people (16 to 29 years old) in receipt of family allowances, by country, 2014
Source: OECD, 2016a, Society at a Glance
Public employment service and active labour market programmes
111. A key challenge for the Public Employment Services is to reach out to those young people who
do not receive out-of-work benefits and are therefore often not registered. Despite the low benefit
coverage, PES registration is higher than in many other countries (Figure 29). Participation in training
among young people who have characteristics similar to Group B is close to the country average (Figure
30, Panel B). However, the intensity of contact with the PES among some registered groups is low. Only
about 50% of young, low-skilled, long-term unemployed contacted the PES to find work during the last
month, a figure that is much lower than in many other countries (Figure 30, Panel A). Moreover, 30% of
young jobseekers are not registered at all. Given high youth unemployment in Portugal, this translates into
a large share of young people who are left without employment support and are at risk of becoming NEET.
0
10
20
30
40
50
0
25
50
75
100
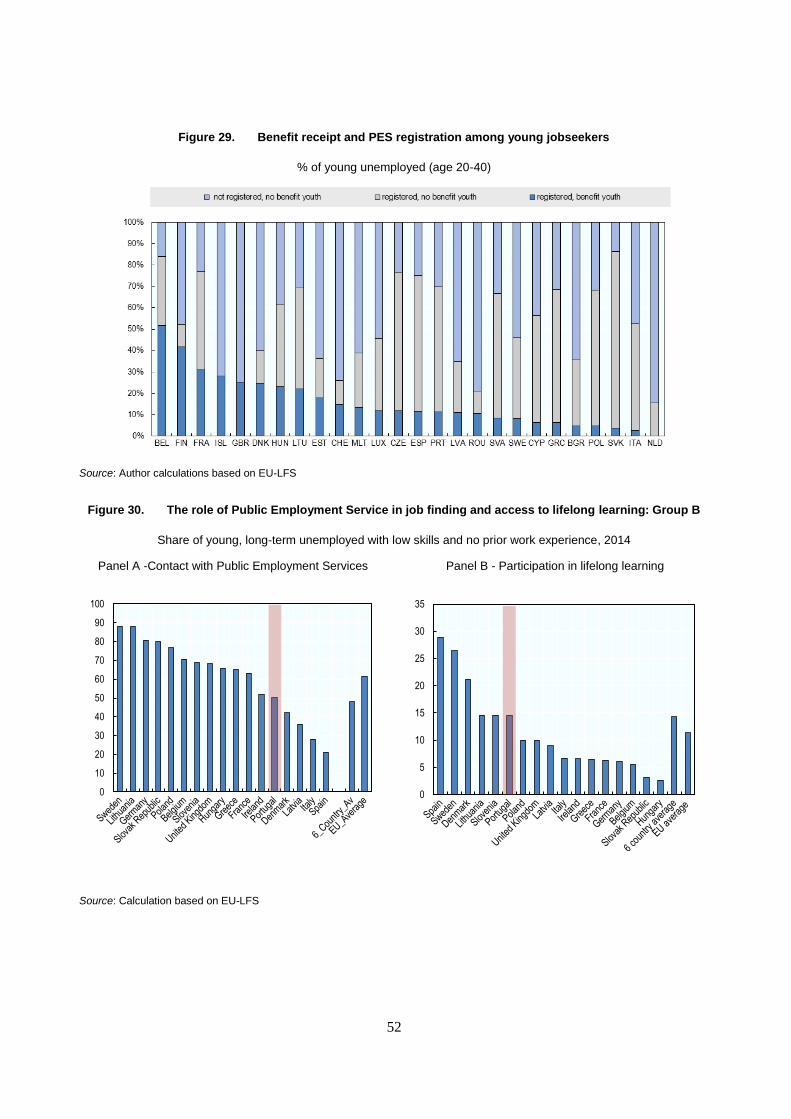
52
Figure 29. Benefit receipt and PES registration among young jobseekers
% of young unemployed (age 20-40)
Source: Author calculations based on EU-LFS
Figure 30. The role of Public Employment Service in job finding and access to lifelong learning: Group B
Share of young, long-term unemployed with low skills and no prior work experience, 2014
Panel A -Contact with Public Employment Services Panel B - Participation in lifelong learning
Source: Calculation based on EU-LFS
0
10
20
30
40
50
60
70
80
90
100
0
5
10
15
20
25
30
35

53
Policy priorities and recent or planned reforms
112. Despite the impressive progress, with a decline in early school dropouts from 43.6% in 2000 to
17.7% in 2014, early school leaving in Portugal remains among the highest in OECD countries (see Figure
31). To further reduce the number of young people who leave school without an upper-secondary
qualification, signs of disengagement should be detected at an early stage, and young people at risk of
dropping out should receive the support they need to complete their education. Portugal is implementing
policies to reduce early school dropout and increase educational attainment and qualifications of the
workforce. The Programme to Combat School Failure and Early School Leaving (Programa de Combate
ao Insucesso e Abandono Escolar, 2012) has been designed using three-pronged approach: to support
students at risk of dropping out, to reintegrate those who have dropped out, and to strengthen VET in
upper-secondary education (OECD, 2014b).
Figure 31. Early school leaving has declined but remains high
Percentages of 25 to 34 year-olds with below upper-secondary education by gender in OECD countries, 2014
Source: OECD calculations based on the EU-LFS and national labour force surveys, OECD National Educational Attainment Classification
113. In the 2015 PISA evaluation, student performance was above the OECD average in science and
reading, and slightly below average in mathematics and reading (OECD, 2017b). However, equity
indicators are not favourable. Although, the parent’s social background is less determining the success at
school than a decade ago, its impact on the pupil’s results is still above OECD average16
. Comprehensive
reforms in the past have sought to address issues of both quality and equity in education, notably by
expanding compulsory education to 12 years starting at age 6 (OECD, 2015). Portugal further needs to
strive towards improving the training for teachers, to improve the quality of education, especially in
schools with higher shares of children from disadvantaged households, and to continue progress on
tackling school drop-outs.
114. As the main VET programme, the “aprendizagem” scheme has been in place for over 30 years. It
is inspired by the German and the French models leading to level-4 qualifications of the national
qualification framework. The target groups are young people aged between 15 and 24 years, with 9th-grade
schooling level. The class-room based courses have a duration between 2 800 and 3 700 hours
16 . http://www.oecd.org/pisa/pisa-2015-portugal.htm.
0
10
20
30
40
50
60
70
Women Men

54
(approximately two and a half years) distributed over four training components: socio-cultural, scientific,
technological and practical. The practical training developed within the companies lasts between 1 100 and
1 500 hours (40% of the total duration of the course).
115. The apprenticeship scheme also has the role of a second chance education. This is important as
there are only very few dedicated “second chance” schools. The number of participants in the
apprenticeship scheme has declined recently, amounting to 36 000 in 2013, and 30 000 in 2016. About
38% of participants were younger than 20 years, 53% were between 20 and 24 years old and 10% were 25
to 34 years old. 90% were registered with the IEFP for less than 12 months. Given that participants are
relatively old for their educational level, it can be assumed that many of them have gained some work
experience, although it is not known how many of participants had been long-term unemployed.
Monitoring data show that, in 2015, 16% of participants were employed 1 month after the termination of
the measure, 27% after 3 months, 37% after 6 months and 42% after 9 months.
Table 9. Age structure of participants in ALMPs in 2015
Below 20 20-24 24-34
2013 5% 16% 26%
2015 4% 17% 27%
2016 (*) 6% 19% 26% (*) provisional
Source: data provided by IEFP
116. The programmes for socially useful work CEI and CEI+ are designed for long-term unemployed.
However, young people participate little in this measure (4% of the 51 200 participants in 2015 ware aged
between 20 and 24 and 17% were young adults aged 25-34 years).
117. At the end of 2013, Portugal adopted a Youth Guarantee, Garantia Jovem, resulting of the
implementation of the European recommendation, and built on the earlier Impulso Jovem programme.
Garantia Jovem aims to intervene early and prevent youth at the margins of the labour market from falling
into inactivity. This program ensures that all young people under 30 get a good quality, concrete offer
(either a job, apprenticeship, traineeship or continued education) within four months of leaving education
or becoming unemployed. It builds on four pillars: internships (Estágios Emprego), hiring incentives
(Apoios à Contratação), vocational training (Formação Profissional) and entrepreneurship support
(Empreendedorismo).
118. More specifically, the Youth Guarantee measures include the following tools:
Estágios Emprego: internships for unemployed youth
Vocational training measures, including Aprendizagem
Programme of traineeships in Public Administration (PEPAC) and Programme of traineeships in
Local Administration (PEPAL)
INOV- Contacto – Traineeships abroad
Hiring Incentives (Estímulo Emprego)
COOP Jovem: supporting the creation of co-operatives through direct financial support to each
worker aged between 18 and 30 years, and who have completed the first cycle of basic education.

55
Development of a national microcredit programme which provides technical support and training
of the entrepreneur during the first years of operation, giving priority to individuals aged between
16 and 29 and who have been registered as unemployed for at least four months.
Investment support, including a component to facilitate access to finance for small- and medium-
sized enterprises.
119. The programme Emprego Jovem Ativo introduced in September 2014 is a six-month work
experience/group apprenticeship programme which involves a co-ordinator, a highly-skilled unemployed
youth (with a university degree) as well as 2-3 low-skilled unemployed youths (who have not completed
basic education). Participants need to be aged between 18 and 29 and registered with the Public
Employment Service. For low-skilled youth, the programme provides an opportunity to acquire a range of
professional as well as soft skills. However, this remains a small-size programme, covering only about 600
participants in 2015.
Box 5. Approaches for vocational guidance and upskilling for low-skilled young people in Europe
Countries with a well-established dual training system have implemented PES financed pre-vocational measures for low-skilled young people, e.g. Austria, Germany and Switzerland. These measures include vocational guidance and orientation, acquisition of basic skills and key competences, workplace related experience and basic vocational skills. One example is the pre-apprenticeship scheme Entrance Qualification (EQ) Programme in Germany links a flexible contract form (internship) with a duration of 6 to 12 months to a preparatory phase with the aim to engage in training. It targets young people who could not find an apprenticeship training place. The scope of the programme now also includes young people with learning difficulties and socially disadvantaged young people. At the end of the period the company may establish a certificate proving the acquired skills. In 2012, 21 810 young people participated at EQ (Dietrich 2014). In addition, the Federal Government initiated the “assisted training” scheme. This scheme combines career entry support and introductory training by involving educational institutions in order help youth with difficulties in completing vocational education or in finding an apprenticeship placement (http://www.bibb.de/de/1301.php).
The Austrian Spacelab project, which has been established by the Austrian PES, offers services that require various levels of commitment from young people, according to how far they are from the labour market. Spacelab is a modular programme for different levels of personal commitment, to stabilise participants, develop their skills, provide practical occupational guidance, draw up personalised career development plans and eventually integrate them into the labour market. Research to date shows that those who attend the training for more than three months increase their employment prospects (European Commission 2014).
A good example for providing life skills is Youth Workshops in Finland that have been set up for the integration of hard-to-place jobless young people. A workshop is a community in which work, training and guidance services are used to improve an individual’s life-management skills and readiness to seek education and employment. The workshops are mostly run by the municipalities, but also by different kinds of NGOs. The most important buyers of this service are the Public Employment Services, the social welfare agencies and the disability insurance. Programmes showed positive results (Düll et al., 2009). The average duration of the training period is 3 to 6 months. It currently involves 14 200 young people.
In Denmark, services for young unemployed persons without university qualifications are handled by a special youth job centre. In Austria, the AMS Vienna has an office dedicated to the young unemployed (AMS Jugendliche), who receive support from specially trained “youth counsellors.” In France, the work of youth advisors took place as part of a “reinforced support” programme. In addition, from 2011 to 2014, the employment centre implemented a reinforced support plan for 50,000 young people (initial target) with a low-to-medium level of educational achievement and recurrent problems in accessing sustainable employment. On average, the beneficiaries had been registered as unemployed for 14 months over the last three years. The reinforced support included six months of individual coaching by in-house counsellors (including weekly contact and in-work follow-up support). Since 2011, 59 000 young people have been given support through this programme. An evaluation following the first year of implementation (based on 28 500 participants) showed good post-programme results, with 65% of participants in employment after finishing the programme, and 6% in education and training (Düll et al., 2016).

56
Box 5(cont.) Approaches for vocational guidance and upskilling for low-skilled young people in other European countries (cont.)
In Ireland street-counsellors, in the UK so called gang advisors are hired to seek cooperation with young people (European Commission/Hall et al. 2015). In order to earn the trust of youth, the counsellors need to have good knowledge of the local area, and the local situation of youth. Based on the experiences in the UK, counsellors need very specific skills and competences: to be a patient listener, to empathise, to be encouraging, and to have excellent communication skills. Austria has a special outreach programme for immigrant youth. The success of the programme lies in the cooperation of youth and migrant organisations and in the engagement with the local community by visiting and organising events for youth and their parents in mosques, cultural centers, and youth clubs (Düll, Kettner, Vogler-Ludwig, 2011).
The example of the Swedish Unga In programme, co-funded by European Social Fund and municipalities, is a motivational project for NEETs aged 16–24 that confronts marginalised young people on their own turf and encourages them to take up work or training. Participants in the project are hired as “ambassadors” to recruit new participants, going to public meeting places and approaching young people with information about the possibilities for them within Unga in. All “ambassadors” have themselves experienced what it is like to be excluded from society and can use their own experiences when they meet and talk with the young people (HoPES, 2013).
4.3. Youth with unstable employment, some recent work experience and often low skills (Group C)
120. Individuals in this group are mainly young (average age 26) and unemployed with an average
unemployment spell of 10 months. 64% were unemployed during the reference period and 28% found a
job by the time of the interview while the rest were still seeking employment. All group members have
worked in the past (5 years on average) but for 58% of them this work experience is low relative to their
age. Within this group, 51% face also scarce job opportunities as a result of the high youth unemployment
rate in Portugal, and this may explain why many (30%) are still actively seeking employment at the time of
the interview. Low education represents a barrier to re-employment for 43% of group members.17
121. 77% live in households with other working members, typically their parents, and 34% in
households with high levels of income from other sources, such as parents or partner’s earnings, which
could weaken financial incentives to undertake paid work. The group has the second highest equivalent
disposable income of all the groups (EUR 7 914/year on average) and the second lowest number of
simultaneous barriers (2 on average).
17 . The probability of re-employment in this group is strongly related to the education level. Among those who
found a job by the time of the SILC interview 70% have a secondary degree or an upper-secondary degree
(36% and 34%, respectively).

57
Box 6. Group C: “Youth with unstable employment, some recent work experience and often low skills”
122. Compared to Group B, individuals in Group C have acquired some work experience. They face
better outcomes than those in Group B, as most of them were reemployed less than one year later.
Individuals in this group mainly face challenges raised by the weak labour demand. More precisely, their
unemployment spells might be linked to the large share of temporary contracts among this age group
(Figure 32). Previous sections have already highlighted the share of temporary contracts in Portugal, but it
is particularly an issue for young people, as Portugal has the 4th highest share of 15-24 people in temporary
employment in Europe.
Figure 32. Incidence of temporary employment among 15-24 in Portugal
15-24, % of those in dependent employment
Source: EU-LFS
Main employment barriers Most frequent characteristics % of the
Target Pop.
- 26 years old (average)
- Unemployed
- Length of unemployment spell: 10 months (average) - 5 Years of paid work experience (average)
- 13 years of schooling (average)
- Average equivalised disposable income: EUR 7 914 (2nd
quintile)
2 simultaneous employment obstacles (average)

58
Income support
123. Compared to other young people described in Group B, individuals in Group C have acquired
some work experience. As a result, they are more likely to be entitled to unemployment benefits than
individuals in Group B. However, the duration of unemployment benefits in Portugal is lower for young
people than for other age groups (see Table 5 in section 3.1 and Figure 33). As a result, young unemployed
people who contributed enough to be entitled to unemployment benefits are covered for a much shorter
duration than their older peers. For example, a 45 year-old person with 15 to 24 months of contribution is
entitled for a duration of 360 days, while its counter peers aged less than 30 will be entitled for 210 days.
Figure 33 Duration of unemployment benefits by age in Portugal
in months, comparison of old and new regime (2012 reform)
Note: 1. Unemployment insurance (subsídio de desemprego) and unemployment assistance (subsídio social de desemprego subsequente).
2. ''New'' concerns the regime since the 15 March 2012 reform (Decree-Law 64/2012).
Source: OECD, 2012, Economic Survey Portugal
Public employment service and active labour market programmes
124. Effective active labour market policies are instrumental for individuals in Group C to maintain
or improve their skill level during unemployment spells. Good connexions with the public employment
services are also crucial to ensure smooth transitions and good matching on the labour market. According
to labour force survey (LFS) data, about 40% of prime-age long-term unemployed with low education and
scarce job opportunities contacted PES to find work, a figure much lower than in many other countries
(Figure 34). The share of individuals with a profile similar to Group C (20-30, low educated, with some
work experience) having participated to a training over the past year is higher in Portugal than in many
countries, but it remains very limited (around 5%).
0
10
20
30
40
50
60
old new old new old new old new
Age 25 Age 35 Age 45 Age 55
Unemployment insurance Unemployment assistance

59
Figure 34. The role of Public Employment Service in job finding and access to lifelong learning: Group C
in % of young people unemployed with unstable employment, some recent work experience and low skills, 2014
Share those who contacted PES office to find work Participation of in Lifelong learning
Source: Calculation based on EU-LFS
125. Individuals in Group C are covered by the same type of Youth Guarantee Garantia Jovem
measures as those described in the previous section. In particular, the internship programme (Estágios
Emprego) is adapted to their profile. Its objective is to promote the professional integration of the most
disadvantaged unemployed people as well as to ease the school to work transition. The target group are
young people aged 18-30 years, unemployed with disabilities, single parents, drug addicts under
recovering process as well as some other highly disadvantaged groups. The programme lasts for 9 months.
It can also last for 12 months for those who belong to highly disadvantaged groups.
126. Monitoring data indicate that one month after participation to Estágios Emprego 52% were in
employment, after 3 months 61%, after 6 months 66% and after 9 months 68% were in employment. Thus,
quite likely roughly half of participants stayed with the same employer. According to anecdotal evidence,
companies make largely use of this instrument when they employ university graduates in large companies
and it is assumed that deadweight losses are high. The structure of participants by educational level
indicates that this measure is not well targeted to the most disadvantaged groups (Table 9).
Table 10. Participants in internship programme by educational level in 2015
Total number of
participants
Below first cycle of primary
education
First cycle of primary
education
Second cycle of primary
education
Third cycle of primary education
Secondary education
Higher education
Internship (estagio emprego)
70482 0% 0% 0% 10% 32% 58%
Source: data provided by IEFP
0
5
10
15
20
25
30

60
Box 7. Support measures for young people with unstable employment and insufficient skills: Experiences in other EU countries
Many PES are using social media sites such as Facebook, Twitter and LinkedIn to better connect with young people. Some PES indicate that they use such social media sites primarily to provide information on their overall services and interventions for youth. Other PES examples include blogs on apprenticeship (France) and e-learning modules on use of social media for job search (Netherlands). PES in Sweden reported a presence on Facebook, YouTube, and Instagram, along with group chats and webinars for jobseekers on various topics, e.g. how to write your CV, how to prepare for a job interview and how to use your social network to find a job (Leigh Doyle 2015). In Belgium, the PES VDAB launched a competition for IT-students to develop smartphone-applications that make use of our data in a way that is both appealing to young people and useful in their search for a job (HoPES, 2013).
The PES can cooperate with employers and training organisations and organise job fairs at the premises of training institutions. In Germany, PES have established several mobile career information centres (BiZ-Mobil) driving to different training institutions and job fairs (European Network of Public Employment Services, 2015). Aiding the empowerment of young people may also fall under these services (inspiring practices can for instance be found in the Netherlands and Spain, Eurofound 2015).
The Estonian PES uses job clubs and job search workshops to deliver a tailored, individual approach to young people. The job clubs provide specialised guidance to young people who are looking for work. Each session includes young people who have similar backgrounds or experiences or are a similar age and are used to motivate the young people by sharing and discussing their experiences. Workshop topics depend on the group characteristics as some groups may focus on confidence building activities whilst others may focus on CV writing and interview techniques. The workshops take place at local PES offices, schools or youth centres are led by career guidance specialists from an external provider. (European Commission 2014)
In France, the ‘jobs for the future’ programme supports labour market participation of young people with lower levels of education, from disadvantaged areas, or with disabilities. It uses subsidised contracts for 3 years (both in profit and non-profit sectors; eventually, many are in the public sector), complemented by provision of mandatory training (formal- qualifying- and non-formal) and counselling (Farvaque, 2014)
A strategy for paving the way to smoother school-to-work transitions is to top-up school-based (vocational) education and training by work experience, in particular in those countries where there is no well-established dual vocational training system. The learning components vary and reach from work life skills, work experience to concrete vocational skills. Note that in a number of European countries short internships with this aim are already embedded in the school curricula or as an element of higher education curricula.

61
CONCLUSIONS
127. This report has used a novel method for identifying, analysing and visualising the most common
employment barrier profiles characterising the Portuguese population with potential labour market
difficulties. The underlying premise is that out-of-work individuals, either unemployed or labour-market
inactive, and workers with weak labour market attachment face a number of possible employment
obstacles, and each of them may call for different policy responses. The success of activation and
employment-support policies, and of social protection measures more generally, is expected to hinge on
effective strategies to target and tailor policy interventions to these barriers and to individual
circumstances.
128. The segmentation method used in this report has identified nine different combinations
(“groups”) of employment barriers that characterise the Portuguese population of “joblessness”. Results
show that “short-hand” groupings that are often referred to in the policy debate, such as “youth”, “women”,
“unemployed”, are far from homogeneous, and may distract attention from the specific employment
obstacles that policies seek to address. For example, the data analysis reveals three groups of women who
are likely to respond to policies in different ways because of various profiles in terms of age, education,
health and family conditions; two groups of early retirees, with different employment obstacles (health and
education or financial incentives); two groups of young people, sharing low education and scarce job
opportunities as obstacles to employment, but differing upon their past work experience.
129. The main employment barriers in Portugal relate to skills and scarce job opportunities, resulting
in a number of key policy challenges:
Upskilling the adult labour force, reducing early school leaving, improving skills governance
and reducing skills mismatches remain challenges despite decisive policy initiatives and progress
achieved in the past. For instance, the skills governance system would benefit from continuing
efforts towards better anticipating skills needs at the local or regional level.
Reducing youth unemployment and smoothing school-to-work transitions in a way that
allows young people to build on the education and training they received. Providing better
vocational guidance and developing secondary vocational education are among the priorities in
this respect.
Addressing long-term unemployment resulting from scarce job opportunities. While long-term
unemployment is partly a legacy of the crisis, this challenge is also structural, resulting from the
combination of economic restructuring, weak economic dynamics, skills mismatch and a
negative impact of long unemployment periods on a person’s employability. In addition, labour
market segmentation makes the transition from unstable to stable jobs difficult.
Effective targeting of employment services and ALMPs to those who most need them. Making
employment support measures accessible and tailored to jobseeker needs and circumstances
requires further strengthening the institutional capacity of the Public Employment Services
(IEFP), in particular by increasing resources for profiling, guidance and individual follow-up.
Inter-institutional cooperation at local and national levels between social services, the social
security institute as well as employment services needs to be tightened in order to facilitate
integrated service provision for people with multiple employment barriers. In addition, greater
use of evidence and systematic evaluations of ALMPs would make employment support more
effective and provide better value for money.

62
130. This Country Policy Paper conducted a detailed policy inventorty tailored to employment barriers
and circumstances of three of the nine groups identified in this project. The three groups, listed below,
represent some 35% of the population with no or weak labour market attachment. Portugal operates a range
of policy measures aimed at addressing employment barriers they face, but there are also remaining
challenges and gaps meaning that existing activation and employment support may not be accessible or
effective:
A. Prime-age long-term unemployed with low education and scarce job opportunities. Efforts
have been dedicated to upskill the population in Portugal since more than a decade, in particular
with the New Opportunities Initiative (INO) followed by continued (although reduced after the
peak in 2009/2010 before the INO programme was stopped) spending in adult education and
training, focusing on short-term courses. Recent measures, such as the programme Qualifica,
launched in 2016, will contribute to upskill the working age population. However, gaps persist, in
particular, access to training remains salient in Portugal for the very-low educated, and this group
could benefit of more targeted training measures. A pre-requirement to ensure the success of such
kind of programme is to activate the links of this group with the Public Employment Service
(IEFP). Job incentives, such as Estagios Emprego, the former Estimulo Emprego or the new
Contrato Emprego (in place since January 2017) could, on the other side, contribute to compensate
scarce job opportunities. Demand-oriented measures may help to address the lack of opportunities
in this group, in particular by refocusing hiring subsidies on low skilled. Considering health issues
- faced by one quarter of this group - linking different kind of measures and actors could be
instrumental. This would refer for example to relying on the network of occupational doctors,
offering re-skilling options to those suffering from health problems, promoting occupational
mobility, supporting employers to adapt workplaces, increasing incentives to work also for those
receiving disability benefits.
B. Long-term unemployed youth without any past work experience and with scarce job
opportunities. Individuals in this group live on very limited resources, with high rates of poverty
and material deprivation. A major employment barrier is the lack of professional skills, reinforced
by the lack of work experience. At the end of 2013, Portugal adopted a Youth Guarantee, Garantia
Jovem, ensuring that all young people under 30 get a good quality, concrete offer (either a job,
apprenticeship, traineeship or continued education) within four months after leaving education or
becoming unemployed through internships (Estágios Emprego), hiring incentives (Apoios à
Contratação), vocational training (Formação Profissional) and entrepreneurship support
(Empreendedorismo). Portugal is also implementing policies to reduce early school dropout and
increase educational attainment and qualifications of the workforce. However, reducing school
drop- outs remains a major challenge. Individuals in this second group are entitled little or no
income support. A combination of both income support and activation measures would be required
to safeguard decent living standards and improve employability among this group. Strengthening
employability and activation could be supported by further developing second-chance schools,
better coordinating the apprenticeship system with other upper secondary education programmes,
while maintaining dual-VET offers, implementing a modularised dual-VET system for
disadvantaged young people, improving vocational guidance and putting in place hiring/wage-
subsidies targeted to this group.
C. Young people with unstable employment, some recent work experience and often low skills. Individuals in this group are more likely to be entitled to unemployment benefits than Group B but
for those covered, unemployment-benefits are short. Group C also benefits from the Youth
Guarantee Garantia Jovem measures, in particular, the internship programme Estágios Emprego.
However, the measure is only weakly targeted to the most disadvantaged groups and arguably
delivevrs limited value for money. Policy priorities include making unemployment benefits and the
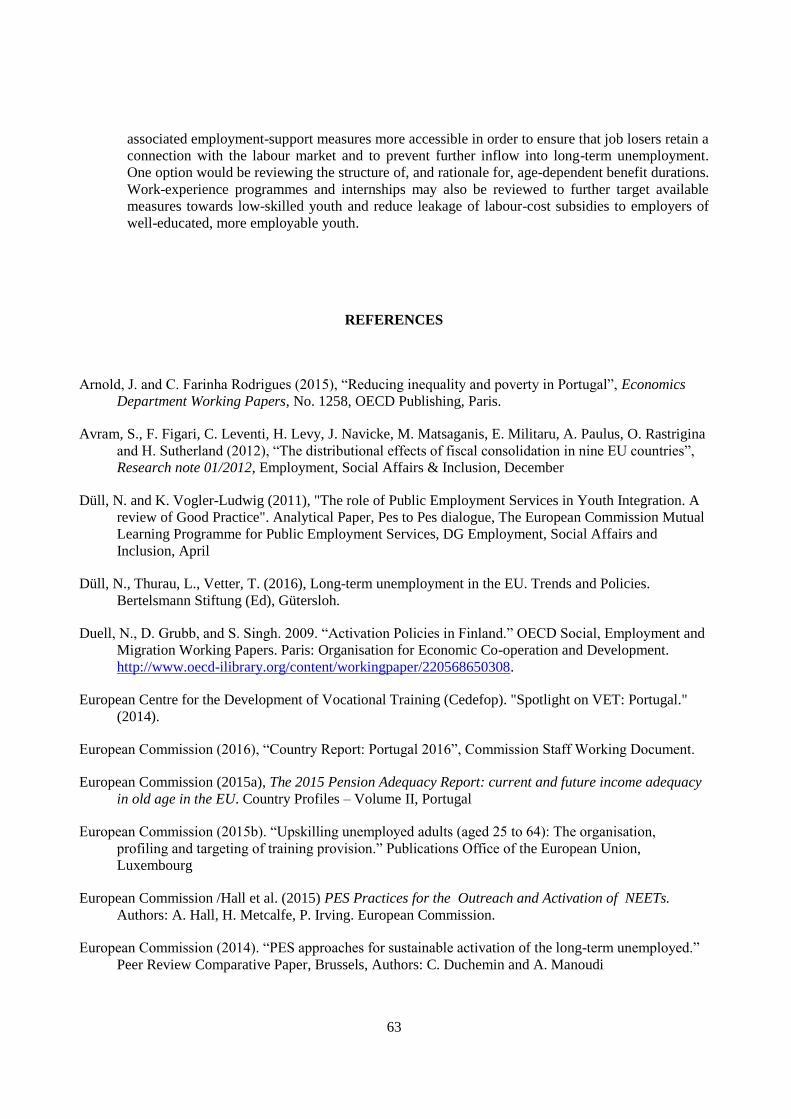
63
associated employment-support measures more accessible in order to ensure that job losers retain a
connection with the labour market and to prevent further inflow into long-term unemployment.
One option would be reviewing the structure of, and rationale for, age-dependent benefit durations.
Work-experience programmes and internships may also be reviewed to further target available
measures towards low-skilled youth and reduce leakage of labour-cost subsidies to employers of
well-educated, more employable youth.
REFERENCES
Arnold, J. and C. Farinha Rodrigues (2015), “Reducing inequality and poverty in Portugal”, Economics
Department Working Papers, No. 1258, OECD Publishing, Paris.
Avram, S., F. Figari, C. Leventi, H. Levy, J. Navicke, M. Matsaganis, E. Militaru, A. Paulus, O. Rastrigina
and H. Sutherland (2012), “The distributional effects of fiscal consolidation in nine EU countries”,
Research note 01/2012, Employment, Social Affairs & Inclusion, December
Düll, N. and K. Vogler-Ludwig (2011), "The role of Public Employment Services in Youth Integration. A
review of Good Practice". Analytical Paper, Pes to Pes dialogue, The European Commission Mutual
Learning Programme for Public Employment Services, DG Employment, Social Affairs and
Inclusion, April
Düll, N., Thurau, L., Vetter, T. (2016), Long-term unemployment in the EU. Trends and Policies.
Bertelsmann Stiftung (Ed), Gütersloh.
Duell, N., D. Grubb, and S. Singh. 2009. “Activation Policies in Finland.” OECD Social, Employment and
Migration Working Papers. Paris: Organisation for Economic Co-operation and Development.
http://www.oecd-ilibrary.org/content/workingpaper/220568650308.
European Centre for the Development of Vocational Training (Cedefop). "Spotlight on VET: Portugal."
(2014).
European Commission (2016), “Country Report: Portugal 2016”, Commission Staff Working Document.
European Commission (2015a), The 2015 Pension Adequacy Report: current and future income adequacy
in old age in the EU. Country Profiles – Volume II, Portugal
European Commission (2015b). “Upskilling unemployed adults (aged 25 to 64): The organisation,
profiling and targeting of training provision.” Publications Office of the European Union,
Luxembourg
European Commission /Hall et al. (2015) PES Practices for the Outreach and Activation of NEETs.
Authors: A. Hall, H. Metcalfe, P. Irving. European Commission.
European Commission (2014). “PES approaches for sustainable activation of the long-term unemployed.”
Peer Review Comparative Paper, Brussels, Authors: C. Duchemin and A. Manoudi

64
European Network of Public Employment Services (2015), PES practices for the outreach and activation of
NEETs.
Fertig, M. (2016), “Networking and coaching to success? The new German approach to long-term
unemployed”, Peer Review on “Approaches to integrate long-term unemployed persons”, Mutual
Learning Programme Host Country Discussion, Paper Berlin, Germany, 13-14 2016.
Farvaque, Nicolas (2016), “The French Youth Guarantee: experiencing a new approach to help young
vulnerable people to gain autonomy”. European Commission, Mutual Learning Programme, Host
country paper, Peer Review on ‘Youth Guarantee’ Paris (France), 7 – 8 April 2016.
Farvaque, Nicolas (2014), “The implementation of the Emplois d’Avenir in France: the role of local actors
Peer Review on ‘Emplois d’avenir’ – ‘jobs with a future’ scheme’“; Mutual Learning Programme
Host Country Discussion Paper, Paris (France), 10–11 February 2014
Fernandez , R., H. Immervoll, D. Pacifico and C. Thévenot (2016) “Faces of Joblessness. Characterising
Employment Barriers to Inform Policy”. SEM Working Paper.
Heads of Public Employment Services (HoPES) (2013): HoPES Assessment Report on PES capacities to
implement the Youth Guarantee. A response from the European network of Heads of Public
Employment Services (HoPES) to calls for action agreed at the Berlin Conference on Youth
Employment on 3rd July 2013. ‘HoPES Catalogue of Measures for the implementation of the Youth
Guarantee, A response of the European network of Heads of Public Employment Services (HoPES)
to call for action agreed at the Berlin conference on Youth Employment on 3rd July, 2013’,
published November 2013
Immervoll, H., and Scarpetta, S. (2012). Activation and employment support policies in OECD countries.
An overview of current approaches. IZA Journal of Labor Policy, 1(1), 1-20.
Leigh Doyle, Sue (2015), Report on PES Implementation of the Youth Guarantee, European Network of
Public Employment Services, July, 2015
Lima, F. (co-ord.) (2012), Os Processos de Reconhecimento, Validação e Certificação de Competências e o
Desempenho no Mercado de Trabalho, Centro de Estudos de Gestão, Instituto Superior Técnico.
Martins, P.S. and S. Pessoa e Costa (2014), “Reemployment and substitution effects from increased
activation: Evidence from times of crisis”, IZA Discussion Paper Series, No. 8600.
OECD (2017a), Labour Market Reforms in Portugal 2011-2015 – A preliminary Assessment, OECD
Publishing, Paris.
OECD (2017b), Economic Surveys: Portugal, OECD Publishing, Paris.
OECD (2016a), Society at a Glance 2016: OECD Social Indicators, OECD Publishing, Paris.
http://dx.doi.org/10.1787/9789264261488-en.
OECD (2016b), Getting Skills Right: Assessing and Anticipating Changing Skill Needs, OECD Publishing,
Paris. DOI: http://dx.doi.org/10.1787/9789264252073-en
OECD/EU (2016c), Health at a Glance: Europe 2016: State of Health in the EU Cycle, OECD Publishing,
Paris. DOI: http://dx.doi.org/10.1787/9789264265592-en

65
OECD (2015a), Activation policies for more inclusive labour markets, OECD Publishing, Paris.
OECD (2015c), Education at a glance: OECD Indicators, OECD Publishing, Paris.
OECD (2015d), Immigration Outlook 2015, OECD Publishing, Paris.
OECD (2014a), OECD Economic Surveys: Portugal, OECD Publishing, Paris.
http://dx.doi.org/10.1787/eco_surveys-prt-2014-en.
OECD (2014b), Education Policy Outlook: Portugal,
www.oecd.org/edu/EDUCATION%20POLICY%20OUTLOOK_PORTUGAL_EN.pdf.
OECD (2012), Economic Surveys: Portugal, OECD Publishing, Paris.
OECD (2010), Sickness, Disability and Work: Breaking the Barriers: A Synthesis of Findings across
OECD Countries, OECD Publishing, Paris. DOI: http://dx.doi.org/10.1787/9789264088856-en
Perista, P. and I. Baptista (2015), “ESPN Thematic Report on integrated services for the long-term
unemployed. Portugal”, European Social Policy Network (ESPN), European Commission.
UNESCO, MENON Network CEPCEP – Centro de Estudos dos Povos e Culturas de Expressão Portuguesa (2011),
Accreditation of prior learning as a lever for lifelong learning: lessons learnt from the New
Opportunities Initiative, Portugal.
Waddell, G. and A. Burton (2004), “Concepts of Rehabilitation for the Management of Common Health
Problems”, TSO, London.

66
ANNEX 1: LATENT CLASS RESULTS FOR PORTUGAL
131. Using the 2014 SILC data for Portugal, the segmentation algorithm outlined in Annex 2 leads to
a model with 9 groups. Table A1.1 shows the estimated parameters, i.e. the share of individuals facing the
employment barriers in each latent group and the related group size in the target population (first row).
Groups are ordered by size; colour shadings are used to highlight barriers with higher (dark blue) and
lower (light blue) frequencies in each group.
Table A1.1. Latent class estimates
Percentage of individuals with selected characteristics, by group
Note: Section 3 describes the indicators and applicable thresholds. Group sizes refer to the target population as defined in Section 1. Colour shadings identify categories with high (dark blue) and lower (light blue) frequencies. Complementary categories (e.g. “high” skills) are omitted. Additional information on model selection and model specification is provided in Annex 2.
Source: Authors’ calculations based on EU-SILC 2014
Group 1 Group 2 Group 3 Group 4 Group 5 Group 6 Group 7 Group 8 Group 9Target
Pop
Group Size (Target population=100) 22 20 12 12 9 9 7 6 3 100
"Low" education 93 66 61 100 53 50 99 43 53 73
No past work experience 0 0 0 0 70 0 69 0 0 11
Positive but "low" relative work experience 58 20.3 6 0 29 1 16 58 72 27
No recent work activity 94 72 7 80 100 96 100 17 100 74
Health limitations 66 23 25 63 17 41 53 13 1 39
Care responsabilities 8 5 3 4 5 2 13 4 66 7
"High" non-labour income 27 20.0 29 23 31 41 28 34 34 28
"High" earnings replacements 3 11 5 5 0 70 2 0 5 10
Scarce job opportunities 2 99 1 14 100 1 100 51 35 43
Core
indicators

67
Table A1.2. Characterisation of the latent groups
Percentage of individuals with selected characteristics, by group
Group 1 Group 2 Group 3 Group 4 Group 5 Group 6 Group 7 Group 8 Group 9Target
Pop
Number of individuals (% of the Target population) 22 20 12 12 9 9 7 6 3 100
Number of individuals (frequency, in thousands) 518 484 293 279 212 205 173 136 71 2372
Unstable jobs 3 28 33 7 1 3 0 62 0 15
Restricted working hours 3 0 23 5 0 0 0 10 0 5
No better job opportunities .. .. 73 .. .. .. .. 81 .. 68
Housework or care responsabilities .. .. 7 .. .. .. .. 0 .. 7
Other reasons .. .. 20 .. .. .. .. 18 .. 25
Zero or near-zero earnings 3 2 56 12 0 1 0 24 0 11
Women* 78 42 52 45 47 39 80 46 99 56
Youth 0 6 5 0 85 0 8 84 18 15
Prime age 53 85 83 7 15 10 65 16 81 50
Old-age 47 9 13 93 0 90 27 0 0 34
Age (average) 55 43 46 60 24 61 49 26 38 49
Employed FT 1 0 7 2 0 0 0 5 0 2
Employed PT 3 0 19 4 0 0 0 12 0 4
Self-employed FT 2 0 38 8 0 1 0 9 0 7Self-employed PT 1 0 9 2 0 1 0 2 0 2Unemployed 22 99 15 25 78 10 38 64 67 46
Retired 26 0 3 44 0 80 0 0 1 18
Unfit to work/disable 12 0 1 4 6 3 15 0 0 5
Housework 32 0 2 7 7 2 44 2 30 13
Other inactive 3 0 4 2 8 3 2 6 1 3Employed 6 14 86 17 0 3 0 61 0 20
Unemployed 21 85 7 23 77 9 38 36 66 40
Inactive 73 2 7 61 23 88 62 3 34 40
Length of unemployment spell†
12+ 12+ 12 12+ 12+ .. 12+ 10 12+ 12.1
Actively seeking a job at the time of the interview 6 82 .. 14 76 .. 37 30 44 67
Age groups*
Main activity
during the
reference
period
Activity at
the time of
interview
Reason for
restricted
hours (% of)

68
Table A1.2. Characterisation of the latent groups (cont.)
Percentage of individuals with selected characteristics, by group
Note: Results based on weighted observations. Colour shadings identify categories with high (darker) frequencies. The average number of simultaneous barriers per individual is computed for the core indicators in table A1.1 with the exception of recent work experience. Income quintiles refer to the entire population. Poverty risks and material deprivation are calculated with the Eurostat methodology. “Length of unemployment spell” only covers reference period: unemployment spells that started before the start of the reference period are left-censored at the start of the reference period. Unemployment duration is calculated as an average of durations top-coded at 12 months
* The variable enters as an additional indicator in the latent class model. See Annex 2 for details.
† average across observations with strictly positive values.
Source: Authors’ calculations based on EU-SILC 2014.
Group 1 Group 2 Group 3 Group 4 Group 5 Group 6 Group 7 Group 8 Group 9Target
Pop
Number of individuals (%) 22 20 12 12 9 9 7 6 3 100
Primary 76 41 42 84 28 35 81 18 36 54
Lower secondary 16 25 19 16 26 15 17 25 17 20
Upper secondary 5 21 21 0 32 23 1 33 34 16
Tertiary 2 13 17 0 15 27 0 24 13 11
Years of education 7.6 10.9 11.1 7.0 11.6 12.2 6.6 13.0 11.4 9.8
No work-related skills 0 0 0 0 70 0 68 0 0 11
Elementar occupations 30 14 22 17 4 4 9 20 26 18
Craft and machine operators 32 35 16 42 6 19 10 18 16 25
Clerk and sales 31 30 29 29 14 24 11 38 37 27
Technicians et al. 3 10 6 6 3 17 1 6 6 6
Professionals 2 7 12 0 2 25 0 13 11 7
Managers 3 4 13 6 0 10 0 5 4 5
Years of paid work experience†
22 21 26 41 4 37 19 5 10 24
Severe health limitations 20 5 6 16 3 8 17 3 0 10
Migrant 5 9 11 3 9 5 5 8 12 7
Equivalent disposable income (€/year - average) 7097 6867 6949 7760 6081 15741 5854 7914 6538 7705
Bottom quintile 36 42 43 29 46 6 49 33 42 36
Second quintile 25 21 20 24 23 8 23 26 20 22
Third quintile 18 17 13 21 16 12 15 17 21 17
Fourth quintile 13 12 12 17 9 23 9 11 11 13
Top quintile 8 8 12 9 6 51 5 13 6 12
AROPE (eurostat methodology) 35 41 41 29 45 6 48 32 41 36
No material deptivation 63 59 72 66 51 89 52 67 59 64
Deprived 18 22 17 19 21 7 27 17 25 19
Severe 19 20 11 15 28 4 21 16 17 17
Sickness and disability recipients (%), 23 3 8 17 4 17 18 2 3 12
they receive, in average†
4250 .. 4372 4833 .. 9737 3340 .. .. 4872
Unemployment benefits recipients (%), 5 45 10 16 4 7 8 12 13 16
they receive, in average†
4564 6204 5529 5163 .. .. .. .. .. 5773
Social Assistance recipients (%), 6 9 3 3 14 1 13 5 11 7
they receive, in average†
2198 2397 .. .. 3124 .. .. .. .. 2552
Housing Benefits recipients (%), 5 7 9 4 7 7 4 6 12 6
they receive, in average†
154 157 194 .. .. .. .. .. .. 174
Family-related benefits recipients (%), 17 31 23 8 31 3 30 22 54 22
they receive, in average†
928 906 1074 .. 1174 .. 944 837 1115 982
Old-age Benefits recipients (%), 21 1 3 40 0 75 1 0 0 16
they receive, in average†
5465 .. .. 6288 .. 19271 .. .. .. 11227
Single 6 7 3 10 1 10 3 1 1 6
Couple without children 34 20 22 45 12 46 25 15 10 28
Couple with children 16 33 33 5 12 8 20 13 57 21
2+ adults without children 29 21 23 31 38 28 29 46 11 28
2+ adults with children 13 14 16 8 36 7 22 22 18 16
Lone parents 2 4 2 1 1 2 2 1 4 2
Have children* 15 36 29 8 30 5 23 21 66 23
Number of children†
1.7 1.4 1.5 .. 1.8 .. 1.7 1.4 1.6 1.5
Age of the youngest child†
6 6 5 .. 4 .. 5 5 4 5
Live in rural area* 32 25 27 31 23 20 38 27 26 28
Household with other working household members 51 55 68 47 68 42 54 77 77 57
Number of simultaneous barriers 2.6 2.4 1.3 2.1 3.0 2.1 3.8 2.0 2.7 2.4
Position in
the income
distribution
Material
deprivation
(Eurostat)
Benefits -
Recipiens
and
average
amounts
(€/year)
Household
type
Level of
education
(ISCED)
Work-
related
skills
(ISCO)

69
Table A1.3. Characterisation of the latent groups (cont.)
Coefficient of variations, by group
Note: Indices calculated for to the “continuous” variables shown in Table A1.2. See notes of Table A1.2 for more information on the sub-samples these indices refer to. Indices based on less than 30 observations are omitted. Source: Authors’ calculations based on EU-SILC 2014.
Group 1 Group 2 Group 3 Group 4 Group 5 Group 6 Group 7 Group 8 Group 9
Target
populatio
n
Age 0.2 0.2 0.2 0.1 0.3 0.1 0.2 0.3 0.2 0.3
Length of the unemployment spell 1.9 0.2 2.1 1.7 0.5 2.9 1.3 0.7 0.7 1.1
Years of education 0.4 0.4 0.4 0.4 0.4 0.4 0.5 0.3 0.4 0.5
Years of paid work experience 0.6 0.5 0.5 0.2 1.2 0.2 0.6 1.3 0.8 0.6
Equivalent disposable income 0.7 0.8 0.8 0.7 0.7 0.6 0.7 0.8 0.6 0.8
Sickness and disability 0.7 0.9 0.9 0.6 0.4 0.7 0.5 0.7 0.8 0.8
Unemployment benefits 0.4 0.9 0.6 0.5 0.4 1.3 0.4 0.6 0.3 0.9
Social assistance 0.7 0.6 0.6 0.7 0.9 0.7 0.7 0.4 0.6 0.7
Housing benefits 2.0 1.6 2.8 1.7 1.8 2.2 0.8 2.0 1.5 2.1
Family-related benefits 0.9 0.9 1.1 1.1 0.9 1.0 0.9 1.0 0.8 0.9
Old-age benefits 0.7 1.1 0.7 0.6 0.4 0.6 0.6 0.6 0.7 0.9
Number of children (12 years or less) 0.7 0.5 0.4 0.7 0.6 0.5 0.5 0.5 0.5 0.6
Age of the youngest child 0.7 0.6 0.7 0.7 0.9 0.7 0.8 0.8 1.0 0.7
Number of simultaneous barriers 0.4 0.4 0.4 0.4 0.3 0.4 0.2 0.4 0.4 0.4
Benefits