nick linacre, forest carbon, markets and communities, terra
TRANSCRIPT

Trends in Voluntary and
Compliance REDD+ Emission
MarketsDr. Nicholas Linacre
September 18, 2014
Regional Climate Change Program REDD+ Finance Workshop,
Antigua, Guatemala

Outline
• The “Market”
– Range of actions affecting demand
– Market overview
– Voluntary markets
– Funds
– Compliance markets
• Supply and Demand Characteristics
• What about the future?
REDD+ Finance 2

REDD+ Finance
Lots of activity, lots of options, but we still need to do more

Global GHG Markets
4
“The Market”
Compliance
Cap and Trade
Taxes
Intensity Targets
Baseline and Credit
Funds
Bilateral
Multilateral
Voluntary Markets
VCS
Other misc.
Proprietary
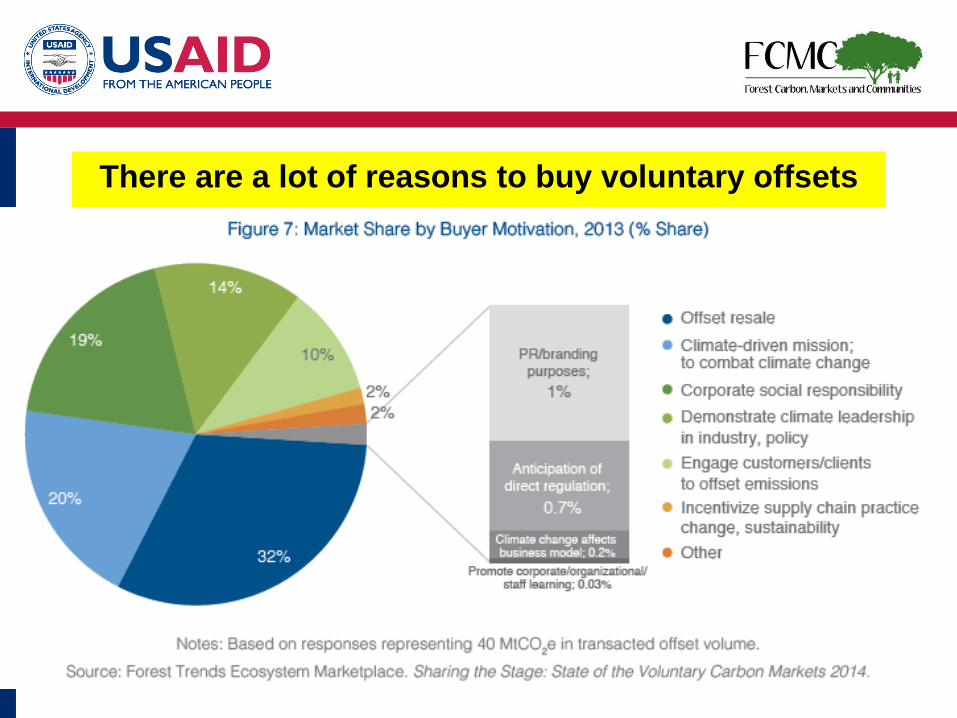
There are a lot of reasons to buy voluntary offsets
February 27, 2014 Forests and Climate Change 5
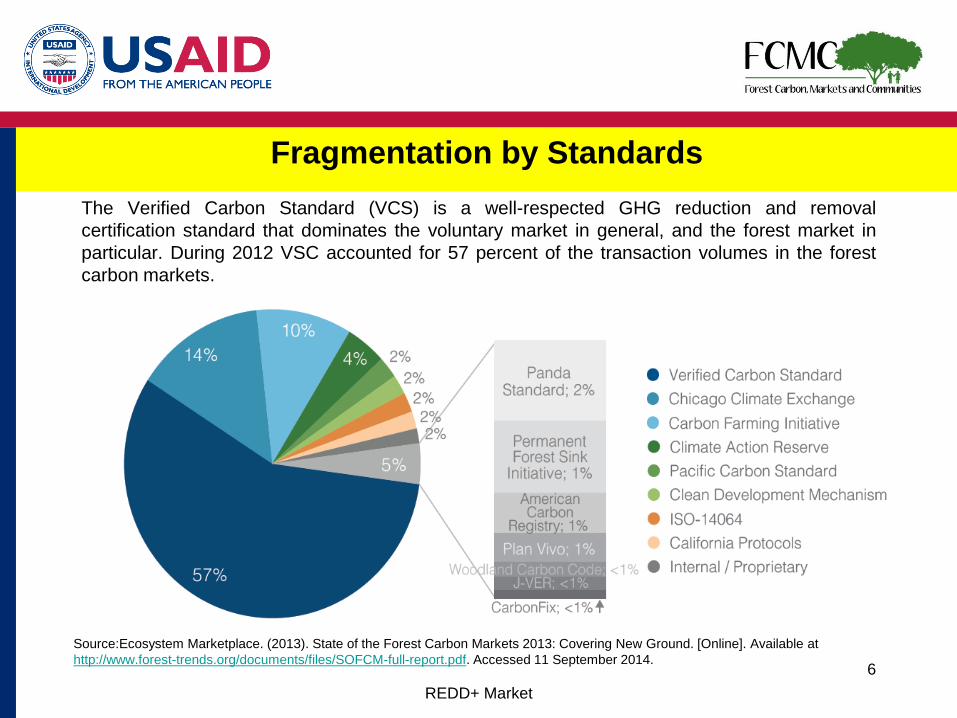
Fragmentation by Standards
The Verified Carbon Standard (VCS) is a well-respected GHG reduction and removal
certification standard that dominates the voluntary market in general, and the forest market in
particular. During 2012 VSC accounted for 57 percent of the transaction volumes in the forest
carbon markets.
REDD+ Market
6
Source:Ecosystem Marketplace. (2013). State of the Forest Carbon Markets 2013: Covering New Ground. [Online]. Available at
http://www.forest-trends.org/documents/files/SOFCM-full-report.pdf. Accessed 11 September 2014.
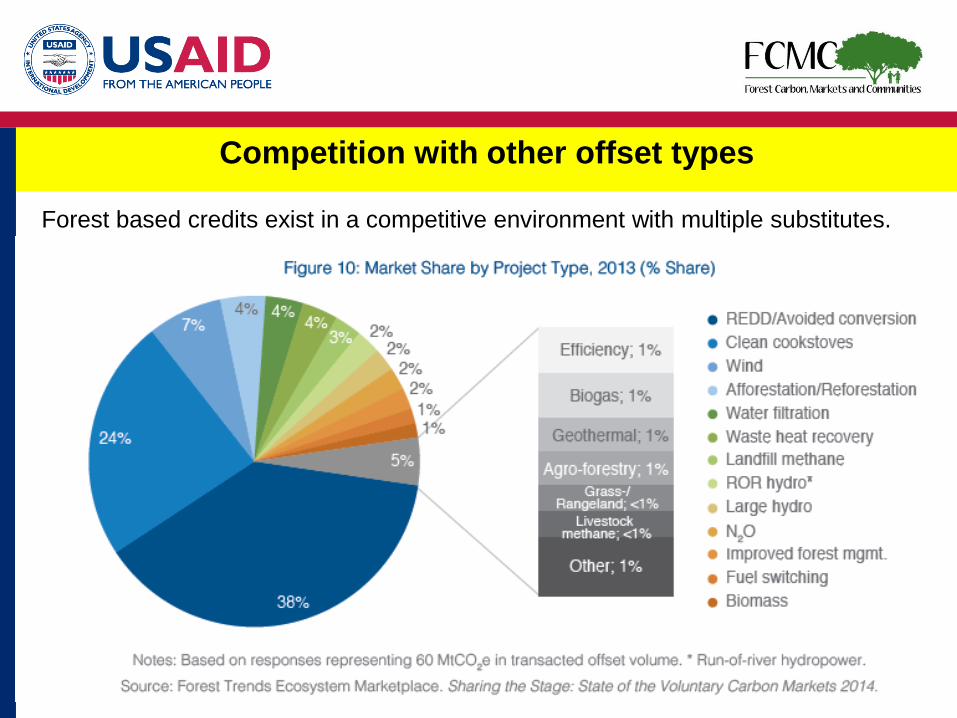
Competition with other offset types
REDD+ Finance 7
Forest based credits exist in a competitive environment with multiple substitutes.

Buyers preferentially purchase REDD+ credits if the price is right
• Transaction volumes more than doubled to
22.6 MtCO2e, while the market value also
increased by 35% to $94 million. Even
excluding KfW and Acre state’s sizable
agreement for performance-based payments.
REDD was the most popular project type.
• During 2012-13 many forest carbon project
developers conceded to buyer demands and
dropped their previously above-average prices.
Hence growth came at a (lower) price, with
suppliers reporting an average REDD offset
price of $4.2/tCO2e (down from $7.4/tCO2e)
which would have been even less ($3.5/tCO2e)
had it not been buoyed by Acre’s sizable
transaction, approximated at $5/tCO2e.
• Market currently oversupplied
REDD+ Finance 8

Global GHG Markets
REDD+ Finance 9
“The Market”
Compliance
Cap and Trade
Taxes
Intensity Targets
Baseline and Credit
Funds
Bilateral
Multilateral
Voluntary Markets
VCS
Other misc.
Proprietary

Global GHG Markets
Funds
Bilateral
Norway–International
Climate and Forest Initiative
Germany–REM
Japan–JCM
Multilateral (Climate Investment Funds)
BioCF
FCPF
BioCF: Has capital of about $207 million after
expenses. The fund operates at the jurisdiction-scale–
i.e. within a landscape-wide area that is governed by a
single political jurisdiction.
FCPC-C: Has capital of $350 million after expenses The
fund is designed to close in 2020.
Japan’s JCM is a Non-tradable credit mechanism. So
far there is no credit investment or purchase strategy.
Up to 539 million tCO2e international offsets between
2013 and 2020 (World Bank estimate).
In May 2010, Norway pledged $1 billion to support
Indonesia’s efforts to reduce emissions from
deforestation and degradation of forests and peat lands.
Indonesia has not adhered to its announced moratorium
on forest clearing, and the country will be unable to
meet its emissions reduction target.
The REDD Early Movers (REM) fund supports pioneers
in the REDD+ sector–countries who are taking risks and
acting independently towards mitigating climate change
through preserving their forests. Fund value $42.5
million before expenses.

Uncertain Status Quo Demand Outlook : Japan & Norway
11

Global GHG Markets
12
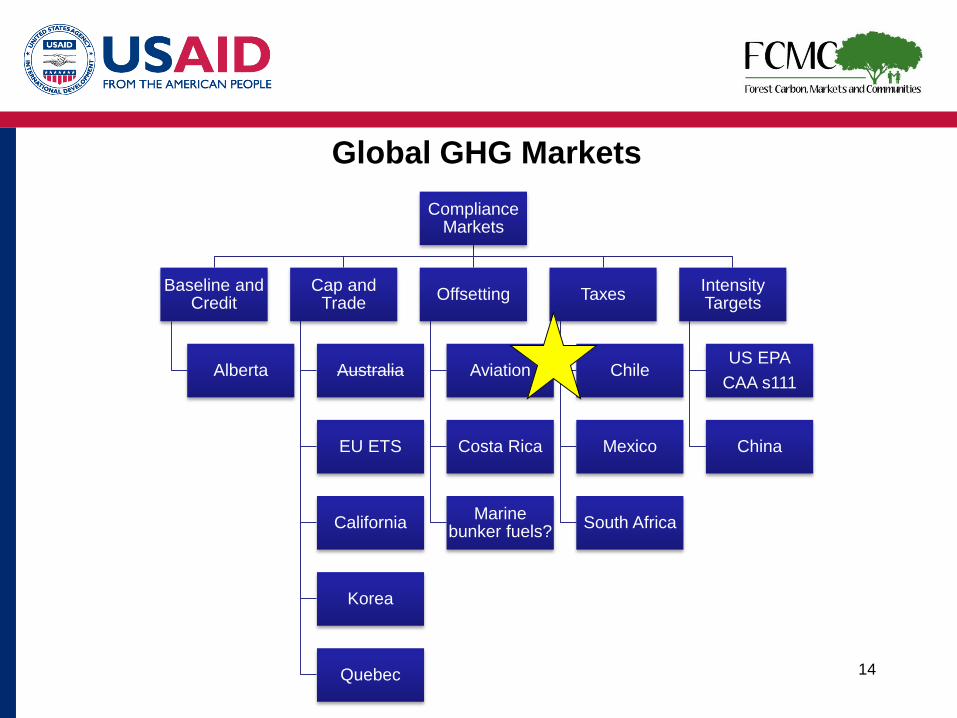
Compliance Markets
Baseline and Credit
Alberta
Cap and Trade
Australia
EU ETS
California
Korea
Quebec
Offsetting
Aviation
Costa Rica
Marine bunker fuels?
Taxes
Mexico
Chile
South Africa
Intensity Targets
US EPA
CAA s111
China
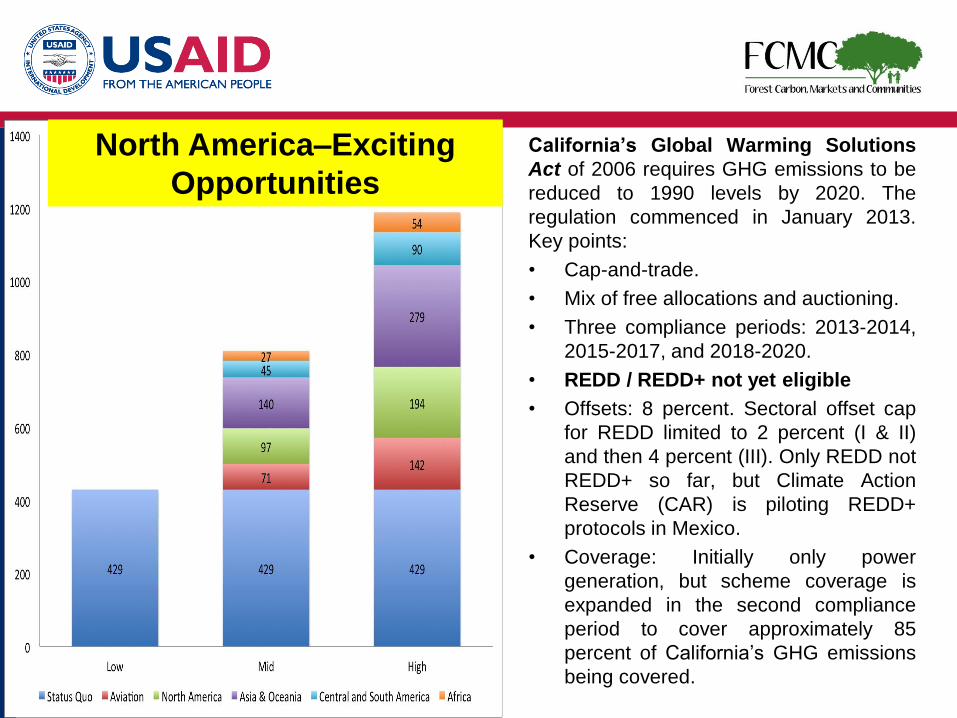
California’s Global Warming Solutions
Act of 2006 requires GHG emissions to be
reduced to 1990 levels by 2020. The
regulation commenced in January 2013.
Key points:
• Cap-and-trade.
• Mix of free allocations and auctioning.
• Three compliance periods: 2013-2014,
2015-2017, and 2018-2020.
• REDD / REDD+ not yet eligible
• Offsets: 8 percent. Sectoral offset cap
for REDD limited to 2 percent (I & II)
and then 4 percent (III). Only REDD not
REDD+ so far, but Climate Action
Reserve (CAR) is piloting REDD+
protocols in Mexico.
• Coverage: Initially only power
generation, but scheme coverage is
expanded in the second compliance
period to cover approximately 85
percent of California’s GHG emissions
being covered.
North America–Exciting
Opportunities
Global GHG Markets
14
Compliance Markets
Baseline and Credit
Alberta
Cap and Trade
Australia
EU ETS
California
Korea
Quebec
Offsetting
Aviation
Costa Rica
Marine bunker fuels?
Taxes
Chile
Mexico
South Africa
Intensity Targets
US EPA
CAA s111
China

Aviation–Real possibilities for REDD+
REDD+ Markets 15
• In 2010, the 37th Session of the International Civil Aviation Organization
(ICAO) Assembly adopted an aspirational carbon neutrality goal of keeping
the global net carbon emissions from international aviation from 2020 at the
same level.
• During 2013 the International Air Transport Association (IATA) 69th AGM
overwhelmingly endorsed a resolution on implementing a carbon neutral
growth strategy from 2020.
• Proposed approach is to offset emissions from 2020 onwards (2020 being
the base year.
• Demand for REDD+ is uncertain.

Global GHG Markets
16
Compliance Markets
Baseline and Credit
Alberta
Cap and Trade
Australia
EU ETS
California
Korea
Quebec
Offsetting
Aviation
Costa Rica
Marine bunker fuels?
Taxes
Chile
Mexico
South Africa
Intensity Targets
US EPA
CAA s111
China
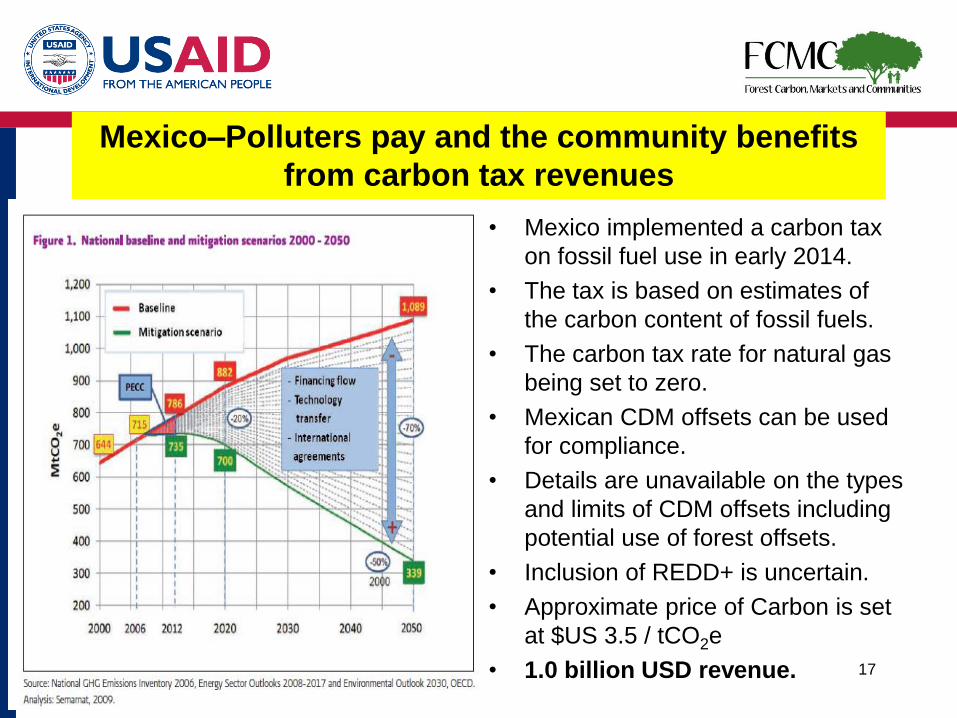
Mexico–Polluters pay and the community benefits
from carbon tax revenues
• Mexico implemented a carbon tax
on fossil fuel use in early 2014.
• The tax is based on estimates of
the carbon content of fossil fuels.
• The carbon tax rate for natural gas
being set to zero.
• Mexican CDM offsets can be used
for compliance.
• Details are unavailable on the types
and limits of CDM offsets including
potential use of forest offsets.
• Inclusion of REDD+ is uncertain.
• Approximate price of Carbon is set
at $US 3.5 / tCO2e
• 1.0 billion USD revenue. 17

REDD+ Markets 18
Global GHG Markets
19
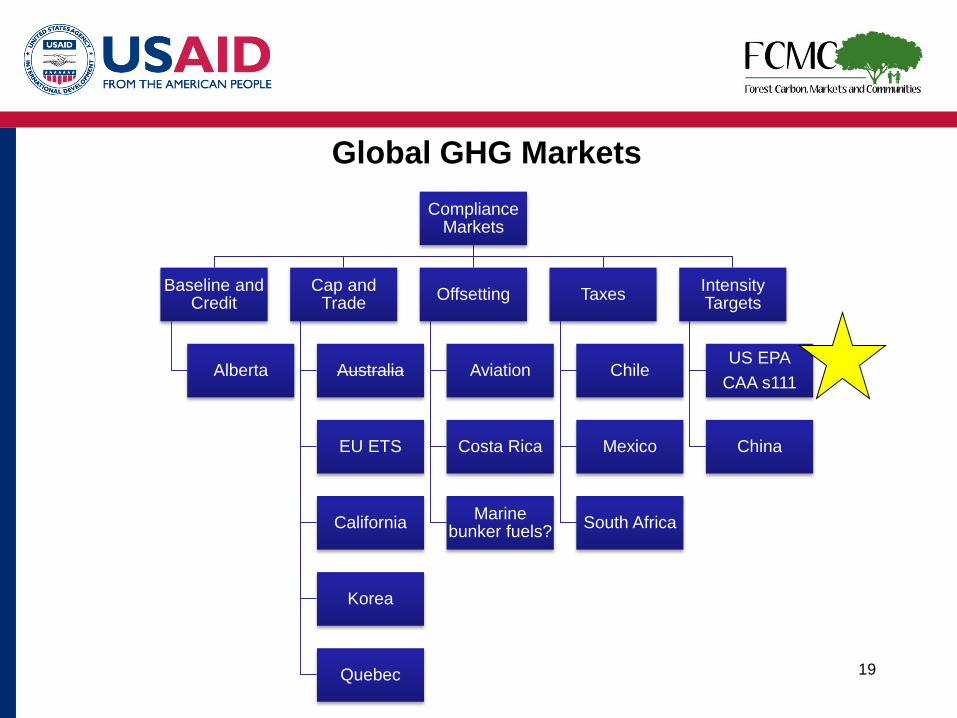
Compliance Markets
Baseline and Credit
Alberta
Cap and Trade
Australia
EU ETS
California
Korea
Quebec
Offsetting
Aviation
Costa Rica
Marine bunker fuels?
Taxes
Chile
Mexico
South Africa
Intensity Targets
US EPA
CAA s111
China
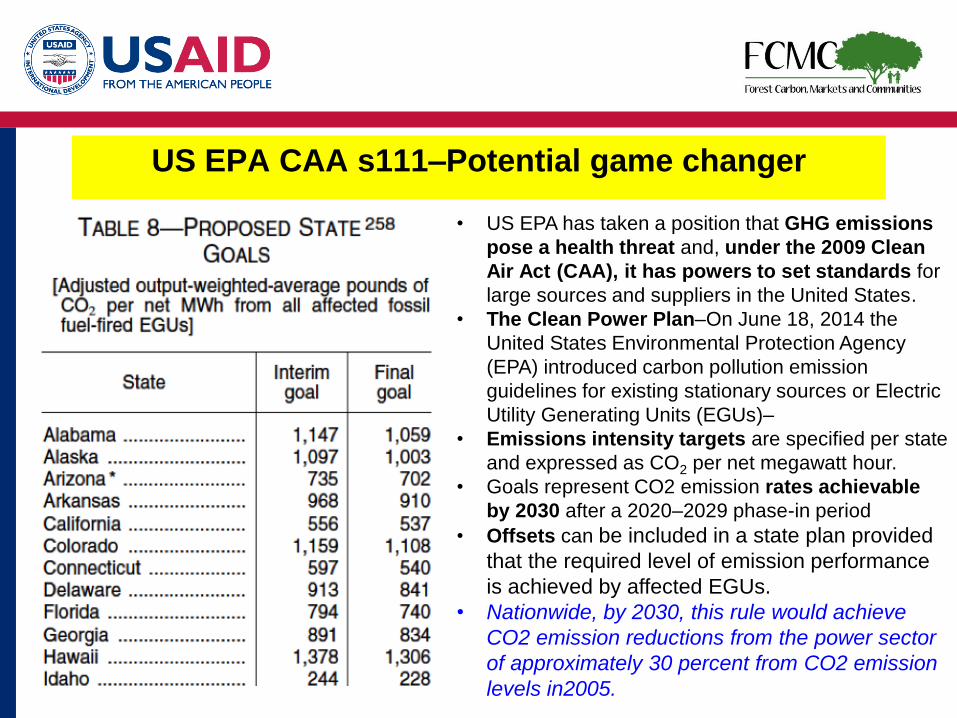
US EPA CAA s111–Potential game changer
• US EPA has taken a position that GHG emissions
pose a health threat and, under the 2009 Clean
Air Act (CAA), it has powers to set standards for
large sources and suppliers in the United States.
• The Clean Power Plan–On June 18, 2014 the
United States Environmental Protection Agency
(EPA) introduced carbon pollution emission
guidelines for existing stationary sources or Electric
Utility Generating Units (EGUs)–
• Emissions intensity targets are specified per state
and expressed as CO2 per net megawatt hour.
• Goals represent CO2 emission rates achievable
by 2030 after a 2020–2029 phase-in period
• Offsets can be included in a state plan provided
that the required level of emission performance
is achieved by affected EGUs.
• Nationwide, by 2030, this rule would achieve
CO2 emission reductions from the power sector
of approximately 30 percent from CO2 emission
levels in2005.
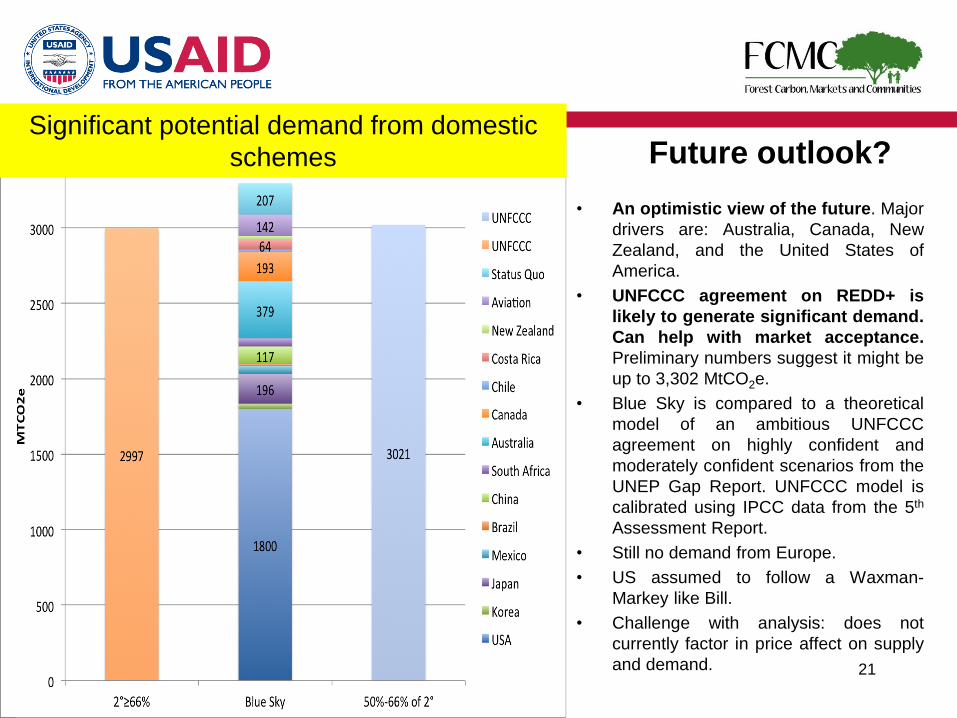
Future outlook?
• An optimistic view of the future. Major
drivers are: Australia, Canada, New
Zealand, and the United States of
America.
• UNFCCC agreement on REDD+ is
likely to generate significant demand.
Can help with market acceptance.
Preliminary numbers suggest it might be
up to 3,302 MtCO2e.
• Blue Sky is compared to a theoretical
model of an ambitious UNFCCC
agreement on highly confident and
moderately confident scenarios from the
UNEP Gap Report. UNFCCC model is
calibrated using IPCC data from the 5th
Assessment Report.
• Still no demand from Europe.
• US assumed to follow a Waxman-
Markey like Bill.
• Challenge with analysis: does not
currently factor in price affect on supply
and demand.REDD+ Finance 21
Significant potential demand from domestic
schemes

Supply and Demand
• Supply and demand can be characterized by
jurisdictional, legal, policy, regulatory, and
methodological fragmentation.
Fragmentation is now more apparent on the
demand side then the supply side.
• Supply of REDD+ credits compete with
other offset types, which may be
advantaged by factors such as sectoral caps
(e.g. California) or out right bans (e.g. EU
ETS).
• Market is currently over supplied and
demand growth is dependent on uncertain
future compliance actions.
• There is a need for clearer commitments to
stimulating demand. Such as through the
inclusion of REDD+ in any future UNFCCC
agreement.
REDD+ Finance 22
Supply
Market design
DemandDomestic schemes and aviation are
the demand drivers, but it is very
important to have REDD+ in the
UNFCCC agreement because this is
a precondition for acceptance in
domestic schemes and aviation.