nicholson ross extraction method
DESCRIPTION
Full 2 port extraction using Nicholson ross methodTRANSCRIPT

3'7IEEE TRANSSACTIONS ON INSTRUMENTATION AND MEASUREMENT, VOL. IM-19, No. 4. NOVENIBER 1970
Measurement of the Intrinsic Properties ofMaterials by Time-Domain TechniquesA. M. NICOLSON, MEMBER, IEEE, AND G. F. ROSS, SENIOR MEMBER, IEEE
Abstract-In this paper a method is presented for determiningthe complex permittivity and permeability of linear materials in thefrequency domain by a single time-domain measurement; typically,the frequency band extends from VHF through X band. The tech-nique described involves placing an unknown sample in a microwaveTEM-mode fixture and exciting the sample with a subnanosecondbaseband pulse. The fixture is used to facilitate the measurementof the forward- and back-scattered energy, s21(t) and s,l(t), respec-tively. It is shown in this paper that the forward- and back-scat-tered time-domain "signatures" are uniquely related to the intrinsicproperties of the materials, namely, e* and A*. By appropriatelyinterpreting s21(t) and sl1(t), one is able to determine the real andimaginary parts of e and u as a function of frequency. Experimentalresults are presented describing several familiar materials.
INTRODUCTION
r HIS PAPER describes a new method for obtainingthe complex permittivity and permeability of linearmaterials over a broad range of microwave fre-
quencies. Traditionally, such measurements have beenmade at fixed frequencies in the frequency domain usingslotted-line and impedance-bridge configurations [1].Recently, a technique was described [2] for the measure-ment of scattering parameters of a broad-band microwavecomponent by obtaining the reflected and transmittedtransient responses of the component to an incidentsubnanosecond risetime pulse and then performing discreteFourier transforms on the three waveforms. It was pointedout that while the frequency resolution obtainable by thismethod could not approach that achievable with narrow-band frequency-domain methods, bandwidths of up totwo or even three decades could be spanned with a singletransient measurement, and the technique was thus bestsuited to components whose properties changed relativelyslowly with frequency. An excellent application of thiscapability has proved to be that of materials measure-ments; a system has been developed that spans the range0.4-10 GHz with 0.4-GHz resolution and yields thecomplex permittivity and permeability of materials overthis range from one pair of transient response measure-ments. A description of this system is given, and themanner in which its frequency range and accuracy mightbe further improved is indicated.
Manuscript received June 4, 1970. This work was supported inpart by the Air Force Avionics Laboratory Director's Fund, Wright-Patterson Air Force Base, Ohio.The authors are with the Sperry Rand Research Center, Sudbury,
Mass.
BASIC PRINCIPLE
Consider an annular disk of material with permeability= MOLR, permittivity E = EOeR and thickness d, installed
in a coaxial air-filled line with characteristic impedance Z0as shown in Fig. 1(a). Within the region 0 < x < d theline will assume a new characteristic impedance Z =
/HR/ER Z0, where /R and ER may be complex. If d wereinfinite, then the reflection coefficient of a wave incidenton the interface from the air-filled line would be givensimply by
zr--zo VM/R/e-1tz+zo VgR/ER + I
(1)
For finite d, the transmission coefficient between facesA and B of the slab may be written
z = exp -j V7ud = exp [ -j(w/c) \gqRER d]. (2)
The scattering coefficients S21 and S,j of the slab may beobtained from the flow graph, Fig. l(b), namely,
S21(w) = vB _ (1+ r)(1 - r)z _ ( -r2)ZVin 1 - rz2 1- rz
= VA (1 _ z2)rS1(WVie -1 -Pr2Z2
(3)
(4)
Writing the sums and differences of the scattering coeffi-cients as
V1 = S21 + Si
V2 = S21 -S1(S)and if
X 1 - VIV2
then it can be shown that r may be obtained from thescattering coefficients, since
r = x4±/x2- I (6)and the appropriate sign is chosen so that rF < 1. Also,
vI - rz = 1- r1 - V1P
Now from (1) we define
AeR (1 + r 2
_R =I - r
= C,
(7)
(8)

IEEE TRANSACTIONS ON INSTRUMENTATION AND MEASUREMENT, NOVEMBER 1970
FdAZo A/r//,/2 Zo
(a)vi.4-) (l+r)z B(I-f) V.
I'r -r'rz -z
VA (I -F)
(b)Fig. 1. (a) A coaxial line with annular disk of material to be
measured inserted. (b) Signal flow graph for (a).
and from (2) we define
ARER in (z)} - C2 (9)
Then,
(10)
IC,
Complex permeability and permittivity are thus obtainedfrom measurement of the transmission and reflectionscattering coefficients of a slab of the material.
TIME-DOMAIN MEASUREMENT
The above description discussed the use of measure-ments of S21 and Si, in the frequency domain, but we areconcerned in this paper with the derivation of S21 and Sllfrom a time-domain measurement. Measurement of thescattering parameters of microwave networks over broadbandwidths by taking the Fourier transform of thetransient response to a subnanosecond pulse has beendescribed previously [2]. Such a method has the advantagesof speed and simplicity of the RF part of the measurementsystem when compared with conventional bridge orslotted-line methods, and in addition can eliminate themismatch error due to multiple reflections. A computer-controlled broad-band sampling oscilloscope scans anddigitizes the transient responses of the microwave sample,and then performs the Fourier transform and subsequentcomputation to obtain MR and 6R.The configuration used for the measurements is shown
in Fig. 2. The pulse from the pulse generator typically hasa risetime of less than 100 ps. It propagates down thecoaxial delay line, through the feedthrough sampling headof the oscilloscope, and is incident on the sample ofmaterial in the test sample holder. The pulse is partiallyreflected and partially transmitted through the sample.The transmitted pulse reflects from a short circuit, returnsup the line, and passes again through the sample on itsway to the oscilloscope sampling head. We shall show thatthese waveforms yield S (co) and S', (co). The delay-linelengths are chosen sufficiently long so that at the samplinghead the incident, reflected, and doubly-transmitted
C A B DPulse qenerator Samotng head 2 \ / i
Sarmiple Short CiTCUOtFig. 2. Time-domain measurement system.
transient-voltage waveforms do not overlap. Considera-tion of the lengths shown in Fig. 2 will show that thereflected and transmitted waveforms each have a "time-window" over which they may be measured uncontami-nated by other reflections of 21/c seconds.The measurement procedure is as follows. With a
short-circuiting metallic plug installed in the coaxial linesuch that its reflecting face is exactly at position A, thewaveform v80l(t - to) is measured over the appropriatetime window, where to = AC/c. Assuming a perfect shortcircuit, v,,1(t - to) = -vin,(t - to). With no material inthe line, the region d being air filled, the waveformVC2(t- to- 2t` - 2r) is now measured over an appro-priate, somewhat later time window, where to = BDIcand r = d/c. Again, assuming a perfect short circuit at D,V9C2(t to - 2to - 2T) = -Vinc(t - to - 2to - 2r). Thesample is now installed in the line, with its face again at A,and two measurements are made. Over exactly the sametime window as for v,,l, we measure the reflected wavevA(t- to) = vi,(t - to)*sij(t), where * denotes convolu-tion, s1i(t) 4 S11(w), and 3Y denotes the Fourier transform.Over exactly the same time window as for v8,2, we measurevB(t - to - 2to)*s12(t), where s12(t) 4 S12(co) and theconvolution occurs because of the passage of the trans-mitted waveform vE (t) again through the sample. NowVB (t - to - 2 to) = vi (t - to - 2 to)*S21 (t).Each of the four measured waveforms is digitized and
read into a laboratory computer, and a discrete Fouriertransform is performed. By taking the ratios of theappropriate pairs of these transforms, we then obtain
-IVA(t - to) FiV.1(t - to) * s,l(t)IVscl(t to) fvinc(t - to)
and
5VB(t - to -2i) * s12(t)-inc(t to - 2to - 2r)
ftinc(t - to - 2i0) * S21(t) * S12(t)exp -j2rVin(t- to - 2o)
-S21(W) * S12(0)) exp j2wr.
Assuming the sample to be reciprocal, S21(M) = S12(W).The phase factor in the second expression requires only aknowledge of the sample thickness d. Thus the ratios ofthe reflected spectra and the transmitted spectra, withthe latter multiplied by exp -j2wr, yield S,,(w) andS,2 (), respectively. Note that even if the delay lines arenot lossless, the transient responses are normalized toeffective incident pulses that have traversed the samelengths of line, and no error results.
378

NICHOLSON AND ROSS: INTRINSIC PROPERTIES OF MATERIALS BY TIME-DOMAIN TECHNIQUES
FREQUENCY (GHz)
1.o
05Ae_ Io~~~~~~~~~~~~~~~~~~~~~~
05 I LER 12 -R
(a)FREQUENCY (GHz)
OJ .0 lO.0
FREQUENCY (GHz)
Fig. 3. Typical amplitude spectra for a dielectric with E'R = 15.
DISCUSSION OF ERRORS
In approximating the continuous Fourier transform bya discrete Fourier transform, errors arise due to truncationand aliasing [2], [3]. These have been discussed previouslyand may be reduced by appropriate choice of both theequivalent time interval T between the digitized samplesand the total number N of digitized samples. For theresults presented here, T = 9.77 ps and N = 256, givinga time window of 2.5 ns and a fold-over frequency of51 GHz, which resulted in truncation and aliasing errors
becoming small compared with other sources of error.
A major source of error is the relatively low spectralintensity available from subnanosecond risetime pulsegenerators. The amplitude of the pulse incident on thesample that was used in this study was about 120 mV,with 30 ps risetime. The amplitude spectrum of this pulse,which was long compared to the 2.5-ns window and henceis effectively step-like, is shown in Fig. 3 along with thereflected and doubly transmitted amplitude spectra froma typical dielectric sample. Also shown in the figure is themeasured rms noise level in the spectrum; when appro-
priate steps are taken to remove errors due to driftvoltages in the measured waveforms, as will be describedlater, the oscilloscope amplifier noise spectrum is approxi-mately white, and to this noise is added random errors
due to quantization and roundoff in the Fourier transformcomputation. Because of the l/f spectrum of the incidentstep-like waveform, the signal/noise ratios of reflected
(b)Fig. 4. Errors in eR and uR caused by timing shift of 1 ps in measure-
ment of (a) Si, and (b) S'21.
Amplitude
Ci T,2 T3 Equivalent time
Fig. 5. Principle of three-point scanning of a sampling-oscilloscopewaveform.
and transmitted spectra fall rapidly as frequency increases,and calculated values for 6,R and 1uR become less accurate.Another source of error is small timing shifts between
the windows used to measure the reflected waveform froma sample, for example, and that from the short circuitthat provides its corresponding effective incident waveform(VA (t - to) and v8l(t - to) above). If one window isdisplaced by an amount At relative to the other, then theratio of Fourier transforms, and hence S, (c), will bemultiplied by an error exp jw At. As an example, errors
in ER and lrR for two samples 0.1 inch thick of dielectricconstants eI = 2.0 and 12.0, respectively, were calculated,assuming that an error of only At = 1 ps had occurred inS11 and 82 when these were measured. The errors as a
function of frequency are shown in Fig. 4. It can be seen
that for the higher dielectric constant, even such a small
,a
CL
-i
cr
RMS noise level
379
.1
6 -i2,R.1
-, l-,
IEEE TRANSACTIONS ON INSTRUMENTATION AND MEASUREMENT, NOVEMBER 1970
Power V
a Sample of materialTo computer VR
(a)
fr- V,-A
2 4 6 8 I0
TIME (units of I/c )(b)
Fig. 7. Sample
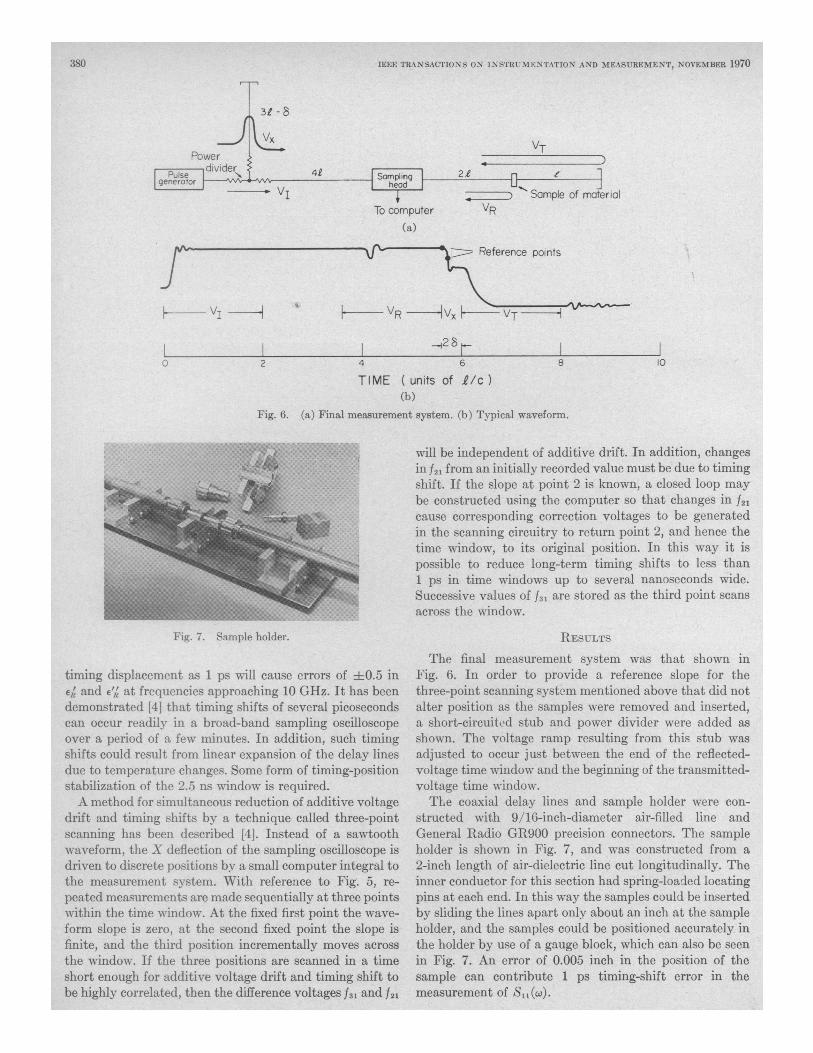
Fig. 6. (a) Final measurement system. (b) Typical waveform.
will be independent of additive drift. In addition, changes| i |g in f21 from an initially recorded value must be due to timing
shift. If the slope at point 2 is known, a closed loop may
be constructed using the computer so that changes in f1ncause corresponding correction voltages to be generatedin the scanning circuitry to return point 2, and hence the
time window, to its original position. In this way it is
possible to reduce long-term timing shifts to less than1 ps in time windows up to several nanoseconds wide.Successive values of f31 are stored as the third point scans
across the window.
holder. RESULTS
timing displacement as 1 ps will cause errors of d0.5 ineR and e'R at frequencies approaching 10 GHz. It has beendemonstrated [4] that timing shifts of several picosecondscan occur readily in a broad-band sampling oscilloscopeover a period of a few minutes. In addition, such timingshifts could result from linear expansion of the delay linesdue to temperature changes. Some form of timing-positionstabilization of the 2.5 ns window is required.A method for simultaneous reduction of additive voltage
drift and timing shifts by a technique called three-pointscanning has been described [4]. Instead of a sawtoothwaveform, the X deflection of the sampling oscilloscope isdriven to discrete positions by a small computer integral tothe measurement system. With reference to Fig. 5, re-
peated measurements are made sequentially at three pointswithin the time window. At the fixed first point the wave-
form slope is zero, at the second fixed point the slope isfinite, and the third position incrementally moves across
the window. If the three positions are scanned in a timeshort enough for additive voltage drift and timing shift tobe highly correlated, then the difference voltages f,i and 21l
The final measurement system was that shown inFig. 6. In order to provide a reference slope for thethree-point scanning system mentioned above that did notalter position as the samples were removed and inserted,a short-circuited stub and power divider were added as
shown. The voltage ramp resulting from this stub was
adjusted to occur just between the end of the reflected-voltage time window and the beginning of the transmitted-voltage time window.The coaxial delay lines and sample holder were con-
structed with 9/16-inch-diameter air-filled line andGeneral Radio GR900 precision connectors. The sampleholder is shown in Fig. 7, and was constructed from a
2-inch length of air-dielectric line cut longitudinally. Theinner conductor for this section had spring-loaded locatingpins at each end. In this way the samples could be insertedby sliding the lines apart only about an inch at the sampleholder, and the samples could be positioned accurately inthe holder by use of a gauge block, which can also be seen
in Fig. 7. An error of 0.005 inch in the position of thesample can contribute 1 ps timing-shift error in themeasurement of S1,(w).
L0
r
380
.i3-A
Reference points
1. VR V. VT

NICHOLSON AND ROSS: INTRINSIC PROPERTIES OF MATERIALS BY TIME-DOMAIN TECHNIQUES
3
'0.5 L1.5
0 I I
0.50.5
0~~~~~~~~~0coLR
C). .0 t.
FREQUENCY (GHz)
Fig. 8. 1R and ER for Teflon, 0.25 inch thick.
-I leas at: .Hz I I
5/ , t4
0.51.5_
sI .0 00
0.1 1.0 10.0
FREQUENCY (GHz)
Fig. 9. MR and ER for dielectric with e'R = 15, 0.05 inch thick.
Some filtering that reduces noise occurs between thesampling oscilloscope amplifier output and the analog-digital converter in the computer. In addition, furthernoise reduction is obtained by recording and averagingfour 256-point scans of each waveform. Since each set offour scans occupied about 7 minutes, after the initialreference waveforms had been acquired each samplerequired about 15 minutes to measure. Subsequent 256-point fast Fourier transforms and other computationsoccupy about another 5-10 minutes for each sample.
Typical results are shown in Figs. 8-12. A sampleof Teflon 0.25 inch thick was measured -on separateoccasions, and the reproducibility of the results may beseen in Fig. 8 for the frequency range 0.4-9.6 GHz,Also shown is a mesaurement on the same sample at
0
2a-
FREQUENCY (GHz)1.0 100
Fig. 10. MR and eR for wood (maple), 0.25 inch thick.
FREQUENCY (GHZ)
1.0
*--Meas at NIHZ
100.
VON HIFPEL
s $ c,, t . s . 0.@ .,.n
sLR
__ **-4
II* a t.cli
Fig. 11. AR and ER for nylon, 0.25 inch thick.
FREQUENCY (GHz)
30.1 1.0 1020* VON HIPPEL
Meas. at MHz _
ELR
0
102F -Fig. 12. MR and eR for Plexiglas, 0.25 inch thick.
_
ER
~~~~~~~~~~~- .'*yR
- n v, I
381
y
k

IEEE TRANSACTIONS ON INSTRUMENTATION AND MEASUREMENT, VOL. IM-19, NO. 4, NOVEMBER 1970
1 MHz in a parallel-plate capacitance bridge and thevalues quoted by von Hippel [1]. Reproducibility iswithin ±-0.1 over the range of frequencies for ER, E'A,4 and AlKMeasurements on two samples of a dielectric material
with E. r 15, 0.05 inch thick, are shown in Fig. 9, againcompared with 1-MHz measurements. Reproducibilityis now about ±0.5 over the range of frequencies, dif-ferences in EI and c'A being somewhat greater than thosefor AR and All. An example of a lossy material is shownin Fig. 10 for a maple-wood sample; the increased valueof E"t is seen clearly. Measurements on nylon and Plexiglasare shown in Figs. 11 and 12, again compared with 1-MHzvalues and those quoted by von Hippel.
CONCLJUSIONS
A method has been demonstrated for measurementof the complex permeability and permittivity of materialsover broad frequency ranges from their time-domaintransient response. Repeatability is within ±0.1 for
permeabilities and permittivities of around 2-3, thebound increasing to perhaps ±0.5 for permittivitiesof 12-15. Further work on this technique might con-centrate on the use of longer delay lines to increase theavailable time windows, and hence increase frequencyresolution. Some compromise is necessary, since theattenuation due to skin effect in longer lines will reducethe higher frequency components of the incident pulse.Improved pulse-generator design to produce greaterspectral intensity at frequencies near 10 GHz couldalso offer significant improvement.
REFERENCES[1] A. R. von Hippel, Ed., Dielectric Materials and Applications.
New York: Wiley, 1961.[2] A. M. Nicolson, "Broad-band microwave transmission charac-
teristics from a single measurement of the transient response,"IEEE Trans. Instrum. Meas., vol. IM-17, pp. 395-402, December1968.
[3] G. D. Bergland, "A guided tour of the fast Fourier transform,"IEEE Spectrum, vol. 6, pp. 41-52, July 1969.
[4] A. M. Nicolson, "Wideband system function analyzer employingtime to frequency domain translation," presented at WESCON,San Francisco, Calif., August 1969.
Generation of Reference Waveforms
by Uniform Lossy Transmission LinesW. D. McCAA, JR., MEMBER, IEEE, AND NORRIS S. NAHMAN, SENIOR MEMBER, IEEE
Abstract-This paper describes a method for generating frac-tional nanosecond pulsed waveforms of known shape thereby pro-viding an a priori means for establishing reference waveform gen-erators or standards to be used in pulsed measurements and otherapplications. The method employs the band-limiting properties of alossy uniform transmission line to produce a known waveform andgenerator impedance. A theory for generator characterization andapplication is presented that defines a given generator in terms oftime-domain or frequency-domain functions. A new term calledthe "available" waveform is defined. Rms error is employed as theerror criteria.An example of generator design is given that employs planar skin-
effect loss and provides an output response having 0.2 percent rmserror over the interval 0 < t < 600 ps referred to the inherent stepresponse of the waveshaping line. The input transition generator isassumed to be a 30-ps unit ramp generator. Also, an applicationexample is given that employs a reference waveform generator toevaluate a sampling oscilloscope. The reference waveform gen-erator uses a Debye dielectric lossy transmission line. The rms
Manuscript received June 25, 1970.The authors are with the Electromagnetics Division, National
Bureau of Standards, Boulder, Colo. 80302.
error of the oscilloscope time-domain response is determined as afunction of time.
INTRODUCTION
T HE objectives of this paper are to present thetheory for the generation of reference waveformsusing uniform lossy transmission lines and to
provide some examples of generators and applications.The paper is organized into four sections: generatorcharacterization, intrinsic loss waveforms, generatordesign, and reference-waveform application.
I. GENERATOR CHARACTERIZATION
In theoretical time-domain studies the ideal-unitstep generator or the ideal-unit impulse generator iscommonly used as a driving source. However, in experi-mental work either of these ideal generators is necessarilyreplaced by a physically realizable one, i.e., a transitiongenerator or an impulsive generator.
382