nhmrc 2008 final report - air quality in and around traffic tunnels
DESCRIPTION
An important Australian document which explores the health risks perceived to likely adversely impact humans in and around around road tunnels. This document captures the essence of health professionals concerns about the impact of vehicle emissions on health. This document reinforces the importance of proper design and operation of road tunnels and the importance of regulating vehicle emissions.TRANSCRIPT

Air Quality in and Around Traffic TunnelsFinal RepoRt 2008
W O R K I N G T O B U I L D A H E A L T H Y A U S T R A L I A

Systematic Literature Review
Air QuAlity in And Around trAffic tunnels
FinaL RepoRt
national Health and Medical research council
With support from
the Australian Government department of Health and Ageing

© Commonwealth of Australia 2008
Paper-based publications
This work is copyright. Apart from any use as permitted under the Copyright Act 1968, no part may be reproduced by any process without prior written permission from the Commonwealth available from the Attorney General’s Department. Requests and inquiries concerning reproduction and rights should be addressed to the Commonwealth
Copyright Administration, Attorney General’s Department, Robert Garran Offices, National Circuit, Canberra, ACT, 2600 or posted at: http://www.ag.gov.au/cca
ISBN print 1864963573
© Commonwealth of Australia 2008
electronic documents
This work is copyright. You may download, display, print and reproduce this material in unaltered form only (retaining this notice) for your personal, non-commercial use or use within your organisation. Apart from any use as permitted under the Copyright Act 1968, all other rights are reserved. Requests for further authorisation should be directed to the Commonwealth Copyright Administration, Attorney General’s Department, Robert Garran Offices,
National Circuit, Canberra, ACT, 2600 or posted at: http://www.ag.gov.au/cca
ISBN online 1864964510
Systematic Literature Review to Address Air Quality in and around Traffic Tunnels
Authors: Ian Longley and Francesca Kelly
Prepared for: Commonwealth of Australia, as represented by the National Health and Medical Research Council
With funding from the Department of Health and Ageing
June 2007
National Institute of Water and Atmospheric Research Ltd 69 Khyber Pass Road, Newmarket, Auckland PO Box 109695, Auckland, New Zealand
Phone +64–9-375 2050, Fax +64–9-375 2051
http://www.niwa.co.nz

aiR QUaLitY in anD aRoUnD tRaFFiC tUnneLS
acknowledgments | iii
Acknowledgments
The National Health and Medical Research Council (NHMRC) would like to thank the people listed below for their contribution to this report and the Australian Government Department of Health and Ageing for funding the project.
NHMRC Air Quality in and around Traffic Tunnels Working Committee
Professor Michael R Moore (Chair) Director, National Research Centre for Environment and Toxicology University of Queensland
Associate Professor Bin Jalaludin Faculty of Medicine University of New South Wales
Professor Lidia Morawska School of Physical and Chemical Sciences Queensland University of Technology
Dr Krassi Rumchev Environmental Health Curtin University of Technology
Mr Robin Seeley Air Quality Section Department of the Environment and Water Resources
Professor Gail Williams International Health Division University of Queensland
Observers: Mr Jack Dempsey Office of Health Protection Department of Health and Ageing
Dr Lyn Denison Principal Scientist—Air Quality Environment Protection Authority Victoria
Mr Andrew Mattes New South Wales Department of Environment and Conservation
NHMRC Office Ms Cathy Mitchell (Project Manager) Ms Nicole Craig (Senior Project Officer)
NHMRC Air Quality in and around Traffic Tunnels Workshop ParticipantsDr Adrian BarnettDr Tom BeerDr Dean BertolattiDr Martin BicevskisMs Christine CowieMr Michael CrowleyMr Mark Curran Mr Jack DempseyMr Bruce Dowdell Mr Guy EdgarMr Len FerrariMr Randall FletcherMs Toni HannellyMr David Harper Dr Kerry Holmes Mr Gary Humphrey Assoc Prof Ray Kearney Dr Bruce Kennedy Dr Graeme LorimerMs Vikki LynchMr Nathan MajorMs Cathy MitchellMr John MunroMr Russell MurrayDr Tim O’MearaDr Tina RunnionDr Vicky SheppeardDr Michael StaffMr Kelvyn SteerDr David Wainwright
Further contributions and assistance were provided by:Li-Chun Hu (Environ Medical Services Ltd, Auckland)Gustavo Olivares (NIWA Ltd, Auckland)
Production by Biotext Pty Ltd, Canberra
aiR QUaLitY in anD aRoUnD tRaFFiC tUnneLS
Contents | v
contents
AcknowledGMents iii
AbbreviAtions And AcronyMs xi
Precis xiii
executive suMMAry xv
1 rePort bAckGround And structure 1
2 roAd tunnels And Air QuAlity—An introduction 3
2.1 Road tunnels around the world 3
2.2 Air quality, controversy and national approaches 4
3 Air QuAlity witHin roAd tunnels—PrinciPles And dAtA sources 7
3.1 Factors affecting air-quality in tunnels 73.1.1 Overview of vehicle emissions in tunnels 73.1.2 Tunnel ventilation design 73.1.3 The ‘piston effect’ and the operation of longitudinal ventilation 103.1.4 Variation in concentrations along tunnel length 113.1.5 Air filtration and treatment 123.1.6 Maximum pollutant criteria 12
3.2 In-tunnel air quality—description of key datasets 143.2.1 How and when tunnel air quality is measured 143.2.2 Data availability and criteria for selection 143.2.3 Söderledstunnel, Stockholm 163.2.4 Hong Kong mobile datasets 163.2.5 Shing Mun and Tseung Kwan O tunnels, Hong Kong (HKPU study) 173.2.6 M5 East tunnel, Sydney 17
3.3 Data quality, interpretation and intercomparison 183.3.1 Multiple variables and variability 183.3.2 Exposure and fixed-point measurements 183.3.3 Continuous and noncontinuous data 183.3.4 Operation of ventilation 19

aiR QUaLitY in anD aRoUnD tRaFFiC tUnneLS
vi | Contents
4 review of in-tunnel Air QuAlity 21
4.1 Air climate of road tunnels 21
4.2 CO and PM—general traffic-related air pollutants 224.2.1 CO and PM as indicators of traffic related air pollution 224.2.2 Sources and control of CO emissions 224.2.3 Sources and control of PM emissions 224.2.4 Relationship of CO and PM with external ambient air quality 234.2.5 Diurnal cycles of CO and PM 234.2.6 Seasonal cycles of CO 244.2.7 Influence of tunnel length on CO 254.2.8 Transect studies 254.2.9 Influence of traffic density on CO 264.2.10 Influence of traffic fleet composition on CO and PM 264.2.11 Influence of road gradients on emissions 284.2.12 Link between traffic speed and emissions of CO and PM 294.2.13 Relationship between mean and maximum concentrations 294.2.14 Influence of number of lanes 294.2.15 Overview of mean concentrations of CO and PM 30
4.3 Oxides of nitrogen and ozone 334.3.1 Sources and emission control of NO
2 33
4.3.2 Effect of ventilation on nitrogen chemistry 344.3.3 Observations of NO2 in a simple urban tunnel 344.3.4 Detailed observations of nitrogen chemistry from two long tunnels 354.3.5 Observations of NO and NO2 in the more complex M5 East tunnel 364.3.6 Detailed observations of nitrogen chemistry from a long naturally ventilated tunnel 374.3.7 NO2:NOx ratio and the influence of tunnel length on mean concentrations 384.3.8 Diurnal cycles 404.3.9 Overview of mean concentrations 41
4.4 Particulate matter—special considerations 424.4.1 Resuspension and vehicle wear products 424.4.2 Fine and ultrafine particles 434.4.3 Laboratory studies on the interaction of fuel sulfur content, driving cycle and engine technology on particulate emissions 434.4.4 Total particle number emissions and concentrations 444.4.5 Elemental carbon and organic carbon 454.4.6 Aerosol transformation 464.4.7 Polycyclic aromatic hydrocarbons 50
4.5 Other pollutants 534.5.1 Sulfur dioxide 534.5.2 Lead 534.5.3 Benzene and toluene 534.5.4 Formaldehyde 554.5.5 Bioaerosols 56

aiR QUaLitY in anD aRoUnD tRaFFiC tUnneLS
Contents | vii
4.6 In-vehicle exposure of tunnel users 574.6.1 Penetration of gaseous pollutants into a vehicle during a tunnel transit 574.6.2 Exposure times 594.6.3 Exposure to particulate pollutants in road tunnels 604.6.4 Relating in-tunnel concentrations to tunnel user exposure 61
4.7 Congestion in road tunnels 624.7.1 Effect of congestion on emissions 624.7.2 Effect of congestion on dispersion processes 634.7.3 Effects of congestion on average concentrations 634.7.4 Congestion—summary of impacts 64
4.8 Long-term emission reductions 64
4.9 General assessment of in-tunnel air quality climates 664.9.1 Carbon monoxide 664.9.2 Nitrogen dioxide 674.9.3 Particulate matter 674.9.4 Scenario summary 67
5 Air QuAlity neAr roAd tunnels 69
5.1 Principles and processes determining air quality near tunnels 69
5.2 Release of polluted air into the environment 69
5.3 Tunnel portals 705.3.1 Portals—modelling and monitoring 705.3.2 Review of monitoring studies in the vicinity of tunnel portals 71
5.4 Challenges in assessing air quality in urban districts containing road tunnels 72
5.5 Review of studies in urban districts containing road tunnels 755.5.1 Vålerenga, Svartdals and Ekeberg tunnels, Oslo 755.5.2 City Link tunnels, Melbourne 775.5.3 Sodra Lanken tunnel, Stockholm 805.5.4 M5 East tunnel, Sydney 805.5.5 North–South Bypass tunnel, Brisbane 835.5.6 Eastlink tunnel, Melbourne 83
5.6 Particulate matter including ultrafine particles 84
5.7 Impacts on indoor air quality near road tunnels 85

aiR QUaLitY in anD aRoUnD tRaFFiC tUnneLS
viii | Contents
6 iMPActs of roAd tunnel Air PollutAnts on HuMAn HeAltH 87
6.1 Types of exposure from tunnels and relevance for health 87
6.2 Adverse health effects associated with air pollution 876.2.1 Australasian studies 89
6.3 Human health risk assessment guidelines 89
6.4 Studies related to specific tunnels 896.4.1 The Sydney M5 East tunnel 896.4.2 Brisbane North–South Bypass tunnel 91
6.5 Studies of experimental exposures intended to represent tunnels 91
6.6 Health effects near road tunnels 93
6.7 Studies on health outcomes and community traffic exposure 94
6.8 Studies on cellular and biomarker experiments related to traffic exhaust 95
6.9 Health effects associated with specific pollutants 966.9.1 Carbon monoxide 966.9.2 Nitrogen dioxide 976.9.3 Particulate matter 976.9.4 Diesel exhaust 976.9.5 Ultrafine particles 986.9.6 Sulfur dioxide 986.9.7 Ozone 986.9.8 Lead 996.9.9 Benzene 996.9.10 Formaldehyde 100
6.10 Conclusions 1006.10.1 Limitations of residential exposure information 1006.10.2 Likelihood of health effects 100
6.11 Recommendations for health monitoring 1016.11.1 Residential exposure 1016.11.2 Monitoring for outcomes among tunnel users 101
aiR QUaLitY in anD aRoUnD tRaFFiC tUnneLS
Contents | ix
7 Air QuAlity And HeAltH risk MAnAGeMent 103
7.1 Tunnel ventilation design and operation 1037.1.1 In-tunnel concentration limit values for health protection 1037.1.2 Designing for the worst case 1047.1.3 Sensitivity to traffic data, HDVs and choice of emission factors 1057.1.4 Ventilation control and tunnel closure—theory and issues 1057.1.5 Ventilation control and tunnel closure—practice 1067.1.6 In-tunnel monitoring 1067.1.7 Environmental approval, conditions and licencing 108
7.2 Visibility criteria and management of particulate matter in tunnels 1087.2.1 In-tunnel visibility guidelines 1087.2.2 Estimating particle concentrations from visibility monitors 1097.2.3 The use of visibility or aerosol monitors in ventilation control 1107.2.4 Tunnel filtration by electrostatic precipitation 111
7.3 Managing exposure to oxides of nitrogen 1127.3.1 Monitoring oxides of nitrogen 1127.3.2 Modelling NO2 for ventilation control 112
7.4 Traffic and emission control 113
7.5 Advice to tunnel users 114
7.6 Protecting ambient air quality 1147.6.1 Technical objectives 1147.6.2 Tunnel-related ambient monitoring 1157.6.3 Assessment of background 1157.6.4 Model selection, operation and validation 1167.6.5 Modelling of stack emissions 1167.6.6 Portal versus stack emissions—design 1177.6.7 Portal versus stack emissions—operation 1177.6.8 Risk management guidelines 118

aiR QUaLitY in anD aRoUnD tRaFFiC tUnneLS
x | Contents
8 concludinG discussion And recoMMendAtions 119
8.1 Emission reductions are the key to managing air quality 119
8.2 In-tunnel air quality 1208.2.1 Nitrogen dioxide in tunnels 1208.2.2 Particles in tunnels 1208.2.3 Emission factors 1218.2.4 Experimental studies on tunnel users 1228.2.5 Setting exposure limits for tunnel users 1228.2.6 Recommendations 123
8.3 External air quality 1248.3.1 Air quality management in Australia 1248.3.2 Assessing impacts on health in the community 1268.3.3 Identifying tunnel-originated air 1278.3.4 Sub-hour impacts, odour and anxiety 1278.3.5 Stacks and portals 1288.3.6 Portal zones 1288.3.7 Recommendations 129
APPendix A Search strategy 131
APPendix b Road tunnels in Australia 135
APPendix c Details of the non-Australian tunnels referred to in this report 137
APPendix d Melbourne City Link tunnels 139
APPendix e Fixed-point measurement campaigns inside road tunnels referred to in this report 151
APPendix f Studies identified but not included in the report 155
APPendix G Air Quality in and around Traffic Tunnels Workshop 157
GlossAry 165
references 169

aiR QUaLitY in anD aRoUnD tRaFFiC tUnneLS
abbreviations and acronyms | xi
AbbreviAtions And Acronyms
AAQ ambient air quality
ADR Australian Design Rule
AADT annual average daily traffic
AER air-exchange rate
amu atomic mass unit
AQM air quality management
ATOFMS aerosol time-of-flight mass spectrometer
CETU French Centre for Tunnel Studies
CI confidence interval
CO2 carbon dioxide
CO carbon monoxide
COHb carboxyhaemoglobin
DEC Department of Environment and Conservation
DOAS differential optical absorption spectroscopy
EC elemental carbon
EPA Environmental Protection Authority
ESP electrostatic precipitator
FEV1 forced expiratory volume in the first second
GISc geographic information science
HDV heavy-duty vehicle
HiVol high volatility index
IARC International Agency for Research on Cancer
ISC3 industrial source complex model
LDV light-duty vehicle
MCL Melbourne City Link
NEPM national environment protection measure
NHMRC National Health and Medical Research Council
NICNAS National Industrial Chemicals Notification and Assessment Scheme
NIWA National Institute of Water and Atmospheric Research (New Zealand)
nm nanometre
NMVOC nonmethane volatile organic compound
NO nitrogen monoxide or nitric oxide

aiR QUaLitY in anD aRoUnD tRaFFiC tUnneLS
xii | abbreviations and acronyms
NO2 nitrogen dioxide
NOx oxides of nitrogen
NPRA Norwegian Public Roads Administration
NSW New South Wales
OC organic carbon
1-OHP 1-hydroxypyrene
OR odds ratio
O3 ozone
PAH polycyclic aromatic hydrocarbon
PIARC Permanent International Association of Road Congresses
pPAH particle-bound polycyclic aromatic hydrocarbon
ppb parts per billion
ppm parts per million
PM particulate matter
PM2.5
particles of less than 2.5 μm
PM10 particles of less than 10 μm
PM25 particles of less than 25 μm
RH relative humidity
RR relative risk
RTA road traffic authority
R2 coefficient of determination
SEPP State Environmental Protection Policy
SESPU South Eastern Sydney Public Health Unit
SF6 sulfur hexafluoride
SO2 sulfur dioxide
TAPM the air pollution model
TEOM tapered element oscillating microbalance
TLO Translink Operations
t,t-MA t,t-muconicacid
USA United States of America
VOC volatile organic compound
WHO World Health Organization

aiR QUaLitY in anD aRoUnD tRaFFiC tUnneLS
precis | xiii
Precis
This literature review of air-quality in and around road tunnels evalutes the factors associated with the development of poor air-quality in tunnels. The most effective way to manage this pollution is to deal with it at source through control of vehicle emissions. Solutions will include adopting new automotive engineering and fuels, implementing existing regulatory processes and controlling congestion. Guideline values or health-based exposure limits should be developed for the priority pollutants—including particulates and nitrogen dioxide—based on transit times through tunnels, and realistic estimates of total trip and daily exposure. Guideline values for fine and ultrafine particles should be considered but this would require a review of the current evidence for the health impacts and possibly further research. Future plans for tunnel design should move away from standards based on carbon monoxide levels and exposures alone, to standards based on carbon monoxide, nitrogen dioxide and particulate matter. These revised standards should take into account the fact that all components interact in determining the safety of in-tunnel conditions and the comfort of users. There is evidence that airborne pollutants in tunnels will affect the health of users of these tunnels. The evidence for health effects on people living close to tunnel portals or stacks is more equivocal. Nevertheless, good practice has long been to limit, as far as possible, exposure around tunnel portals and stacks; this practice should be continued and, where possible, reinforced.

aiR QUaLitY in anD aRoUnD tRaFFiC tUnneLS
executive summary | xv
executive summAry
This report contains a literature review of air quality in and around road tunnels. A draft version formed the basis of discussion at a workshop hosted by the National Health and Medical Research Council (NHMRC) on 15 May 2007. This final version has been revised to incorporate, where possible, discussions and opinions recorded at that workshop. This report is intended to protect the health of tunnel users and those living or working near portals or ventilation stacks by informing the development of evidence-based approaches to the management of air quality in and around road tunnels in Australia.
The key findings of the review are summarised below:
The most effective long-term measure for reducing health risks associated with road tunnels •
is to adopt vehicles fitted with technologies and/or fuels that reduce emissions. This measure should be continued and accelerated, and should be coupled with regular testing of emissions from the current vehicle fleet to ensure that engines operate efficiently and cause minimal pollution. Because emissions from heavy duty vehicles, particularly those that are poorly maintained, are much higher than those from passenger vehicles, dealing with heavy duty vehicles should be a priority in implementing the above measures.
Adoption of new fuel technologies that move away from the use of fossil fuels should be •
encouraged. Examples of these are the use of hydrogen, biofuels and electricity, the adoption of which could be promoted by tax breaks and other incentives.
The most serious risks and the greatest technical management challenges occur in congested •
conditions. Traffic management plans should be adopted to minimise or eliminate congestion within the tunnel. However, this approach needs to be balanced against the potential for greater health risks if traffic diversion leads to severe congestion or inappropriate use of surface roads in residential areas.
Adverse health effects can arise as a result of short-term exposure to traffic pollutants. One •
possible effect includes aggravation of asthma, either immediately or over subsequent hours. Accrued effects from repeated tunnel use might include small increases in lifetime risk of cancer, and potential for increased bronchitic events or respiratory infection. Current tunnel management procedures are unlikely to adequately protect users from these risks.
Development of an exposure limit for nitrogen dioxide (NO•2), set in the context of co-
exposure with particulate matter (PM), and numerous other toxins and irritants from road vehicle emissions, is justified. We therefore recommended it as a precautionary interim measure appropriate to average tunnel transit times.
The public health and air-quality research described in this report will be useful in developing •
an NO2 exposure limit for tunnel users.
Emissions from road tunnels are generally indistinguishable from emissions from road traffic •
in general. The effects of subsets of PM are expected to be low but should be considered for investigation.
Every tunnel is different, and its effect on health has to be judged accordingly. The concentrations of air pollutants that occur within road tunnels, and the consequent emissions from stacks and portals into the external atmosphere, are highly variable. They depend on factors that determine vehicle emissions (traffic volume, speed, fleet composition, road gradient, fuel quality and tunnel length) and the rate of dilution (governed by the tunnel’s ventilation system, and by traffic volume and speed). Health-based exposure limits are used to set limits for in-tunnel pollution. In most tunnels, there is a feedback system so that high concentrations of pollutants trigger either an increase in ventilation or traffic management measures aimed at reducing total vehicle emissions inside the tunnel. Globally, the most widely adopted in-tunnel exposure limit is that for carbon monoxide (CO), based on the World Health Organization (WHO) guidelines (WHO 2000). Carbon monoxide is the only traffic-dominated air pollutant for which WHO guidelines exist for exposure durations relevant for tunnel transit (typically ~2 minutes; rarely more than 30 minutes). A visibility limit is also applied in most tunnels for safety purposes.

aiR QUaLitY in anD aRoUnD tRaFFiC tUnneLS
xvi | executive summary
The lack of guidelines for other pollutants does not mean that they do not pose a health risk to tunnel users. This review found evidence suggesting that short-term exposure to NO2, PM and diesel exhaust particles (and the combination of these) in particular pose risks to health. We have not converted this exposure into a quantifiable risk or exposure limit because of scientific uncertainties about exposures of less than one hour and the role of interaction between pollutants. However, studies in tunnels have observed concentrations of PM and NO2 that give rise to concern. One example of this is the 2002–03 study in the M5 East tunnel in Sydney, where average in-tunnel levels were 600 μg m-3 for PM
10 and 180 parts per billion (ppb) for NO2.
Long-term mean concentrations of PM10 above 100 μg m–3and NO2 above 100 ppb appear to be
common, and maximum short-term concentrations are typically double the mean. In tunnels with low airflow, high levels of NO2 could arise while CO is within limits because of the nonlinear nature of atmospheric nitrogen chemistry. This is unlikely to occur in urban Australian tunnels, but it remains a possibility, and those involved in the air-quality aspects of tunnel design and operation need to be aware of it.
Improvements in vehicle technology have led to major reductions in emissions of CO and volatile organic compounds per vehicle around the world. Reductions in emissions of PM and nitrogen monoxide (NO)—from which most NO2 is indirectly formed—have also occurred, but lag behind CO reductions by perhaps a decade. Nitrogen chemistry in tunnels is nonlinear, and the proportion of direct emission of NO
2 rather than of NO is rising. Taken together, these factors
mean that reducing emissions of oxides of nitrogen (NOx) may not lead to proportional reductions in NOx concentrations. The ratio of NO2 to CO in tunnel air is therefore rising; a fact that is recognised around the world and has led many bodies to consider or to implement NO2 exposure limits, in addition to the current CO limits.
The literature suggests that emissions may cause short-term health effects for tunnel users in busy traffic, and may also cause health effects in residential neighbourhoods around tunnels. Characteristics of the air within a tunnel most likely to affect users are levels of particulates—including coarse, fine and ultrafine particles—and NOx.
At least three areas still have major uncertainties:
differentiating the toxic effects of individual pollutant compounds or components found in •
tunnel air from the effects of the mixture
additive effects of these co-pollutants that may increase or decrease health impacts•
the effects of short-term peaks (of < 1 hour) and repeated exposure•
Understanding the toxicity of fine and ultrafine particles is a major research priority around the world. There is general agreement that ultrafine particles possess significant toxicity, but exposure limits have yet to be defined. Particle concentration levels in clean environments without concomitant human activity are usually of the order of a few hundred particles per cubic centimetre. In urban environments, background particle number concentrations range from a few thousand to about 2 × 10⁴ particles/cm3. Particle concentrations can be much higher near roads, often exceeding 105 particles/cm3, and are likely to be orders of magnitude greater than this in tunnel environments. More crucially, the review found some studies suggesting that emissions and concentrations of particle numbers may be increasing. The effect of congestion on processes involving ultrafine particles (and NO
2) and their resulting concentrations are generally unknown;
however studies have found potentially harmful interactions between particulates and NO2 in relatively high concentrations.
Despite gaps in our understanding of the health effects of particles in tunnel air, including the crucial issues of dose duration and repetition, WHO has established guideline values for PM10 and PM2.5. The guidelines values are 50 μg m–3 24-hour mean and 20 μg m–3 annual mean for PM10, and 25 μg m–3 24-hour mean and 10 μg m–3 annual mean for PM2.5 (WHO 2006). Relatively more is known about exposure to NO2.
Until such time as there is evidence of the effects of particles, or traffic exhaust as a whole, it would be desirable to develop precautionary exposure limits for NO2 and PM. Combining such limits with

aiR QUaLitY in anD aRoUnD tRaFFiC tUnneLS
executive summary | xvii
existing limits for CO would provide the best means in the near future for protecting tunnel users from the effects of road vehicle emissions.
In setting precautionary exposure limits, the interaction with additional pollutants must be carefully considered. The development of such a limit would benefit from a program of research that includes focused exposure assessment and health studies of tunnel users. The research needs to consider the relationship between tunnel air quality monitoring, vehicle air exchange rates and exposure magnitude and duration. It needs to use methods that combine monitoring and modelling (which require improved data on nitrogen emission and chemistry in tunnels) to predict and control in-tunnel NO
2 and particulate levels. Setting a limit of between 70 and 1000 μg m–3
for PM would be in line with limits used in Europe, and would therefore bring Australia into line with Europe.
Modelling and monitoring studies generally agree that the impacts of emission from road tunnel portals and stacks on their surrounding communities are mostly indistinguishable from impacts from all other sources (principally surface traffic emissions, domestic and industrial emissions, and background contributions, including natural sources). Monitoring and modelling have inherent flaws, so results should be interpreted with caution. In many cases, urban road tunnels redistribute impacts. For example, in the case of portal rather than stack emissions, air quality is typically improved in areas where surface traffic has been removed and congestion relieved, and slightly worsened in the immediate vicinity of the portals (within ~200 m). Outside of this small portal zone, monitoring suggests that, where ambient air quality standards have been breached in communities containing road tunnels, the cause of the breach could not be attributed to tunnel emissions. That is, the breach would probably have still occurred in the absence of the tunnel, although this conclusion depends on the detailed siting of the monitors.
Current dispersion models have some acknowledged weaknesses in their ability to accurately assess dispersion from stacks and portals, especially in urban areas with relief (ie the differences in elevation and slope between the higher and lower parts of the land surface of a given area). Nevertheless, supporting activities such as complex numerical modelling, physical modelling and alongside monitoring can help to validate dispersion modelling or identify locations where further monitoring is required. Also, new and improved models are continually in development. If tunnel emissions are shown to lead to significant localised impacts on an exposed population, then external monitoring should feed back into tunnel ventilation control systems to ensure that tunnel emissions do not directly increase population exposure. No clear evidence exists to show that monitoring such as that carried out to assess compliance with air-quality goals, especially for PM
10,
can reliably predict the size, nature and course of adverse health impacts.
The methods used to monitor air quality may not be the most appropriate in terms of the measured quantities being representative of health risk. The commonly employed approaches are biased towards compliance with national environment protection measures (NEPMs), even though the NEPM explicitly does not apply to localised impacts such as emissions from road tunnel stacks. Current approaches may under-represent the impacts on health of ultrafine particles and the effects associated with the short-term experience of odour. Assessing whether these impacts are significant is not a simple matter, but deserves investigation.
People who live near to tunnels or their stacks may be at risk if the presence of the tunnel alters the ongoing quality of the neighbourhood ambient air. Risks to cardiorespiratory health might arise if people are exposed to contaminated air from tunnel emissions. Important indicators for this risk are levels of NO
2 and particulates. Of particular concern is an association between
impaired lung development in children and emissions from traffic. Particulates from tunnels and volatile compounds including benzene may produce an increased lifetime risk for cancer. However, the major challenge for any long-term health study of air quality is the differentiation of the effects of the tunnel from traffic in the community in general.

aiR QUaLitY in anD aRoUnD tRaFFiC tUnneLS
Report background and structure | 1
1 rePort bAckground And structure
This report was commissioned by the National Health and Medical Research Council (NHMRC) in response to a request for health advice from the Australian Government Minister for Health and Ageing. The Minister had been informed that high-level exposures to motor vehicle exhaust may occur in and around traffic tunnels. In response, the Minister asked that, as a minimum, the impact of the following pollutants be examined: nitrogen dioxide (NO
2), carbon monoxide (CO),
photochemical oxidants (as ozone [O3]), sulfur dioxide (SO2), lead and particulate matter (PM). He
also specified that the advice should, if possible, establish maximum acceptable exposure levels for the identified pollutants.
As a result, New Zealand’s National Institute of Water and Atmospheric Research (NIWA) was contracted to perform two phases of work related to air quality in and around traffic tunnels:
Phase 1• —To undertake a systematic literature review of the health impact of a specified range of air pollutants within and around traffic tunnels. The task was to:– review the pollutants NO
2, CO, photochemical oxidants (as O
3), SO
2, lead and PM (eg PM
10;
that is, particles of < 10 μm)– analyse the above literature and practices– recommend appropriate evidence-based actions in the format of a report– present the findings at a national workshop to be hosted by the NHMRC
Phase 2• —To analyse the findings from the first phase and make recommendations for an evidence-based approach for effective management of air quality in and around road traffic tunnels in Australia.
This report contains the results of the literature review and a record of summary comments made by attendees at the workshop. It also presents an integration of analysis of the review, the workshop and subsequent submissions from workshop attendees.
The health impacts of air quality associated with a road tunnel are distributed between two population groups on two different timescales:
tunnel users, who are exposed to high concentrations of pollutants for a short duration•
those living and working near the tunnel, who are exposed to low concentrations for a long •
duration; this group of people can also be exposed to high concentrations of short duration when subject to groundstrike
The air quality near a tunnel is influenced by a component related to the rate of emissions from the tunnel openings, which are either portals, stacks or both. The emission rate depends on the concentration of pollutants within the tunnel (to which the tunnel users are exposed). In-tunnel concentrations and tunnel emissions into the open atmosphere both depend on the rate of emission from vehicles into the tunnel volume and the rate at which that volume is ventilated. Vehicle emissions are generally similar from day to day, but vary over the course of the day and on longer timescales due to changes in traffic demand, fuel quality and vehicle technology. Ventilation rates are largely set at the design stage, but can be altered if powered ventilation systems are installed.
This report follows that chain in reverse; that is, from the initial design of the ventilation system to the resulting air quality and then to the impacts of that air quality on human health. The report is based on a systematic review of published data from numerous tunnels around the world, which confirmed that numerous factors influence road tunnel air quality. The report is structured as follows:
Chapter 2 discusses the types of road tunnel that have been built globally, and the reasons for •
their construction. It also looks at controversies about road tunnels that have arisen over the past decade in Australia and outlines the purpose of the review.

aiR QUaLitY in anD aRoUnD tRaFFiC tUnneLS
2 | Report background and structure
Chapter 3 looks at the principles and data sources used in studying air quality within road •
tunnels. Selected data from the review are used to illustrate each of the factors that determine road tunnel air quality, and to highlight the main issues about data quality, compatibility and intercomparability.
Chapters 4 and 5 present the full range of data and the generalised air quality scenarios •
developed for within tunnels (Chapter 4) and for within their surrounding neighbourhoods (Chapter 5).
Chapter 6 reviews observed and estimated effects on human health. These include observed •
impacts in and near actual tunnels, plus impacts related to the inhalation of pollutants described in the air quality scenarios. The chapter considers the impacts on both types of affected populations (those in and those near tunnels), focusing in particular on the different timescales of exposure.
Chapter 7 discusses options for management of road tunnel air quality and associated health •
risk as currently or previously adopted or published around the world. This chapter also provides brief comments on the considered effectiveness of different approaches.
Chapter 8 provides a concluding discussion and recommendations. •
The document also includes a glossary of technical terms and a set of appendixes giving details of the search strategy used in the review, details of various road tunnels in Australia and overseas referred to in the report, fixed-point measurement campaigns referred to in the report, studies identified but not included in the report, a summary of the discussions at the workshop on the literature review findings and a list of the references used in the report.
aiR QUaLitY in anD aRoUnD tRaFFiC tUnneLS
Road tunnels and air quality – an intnroduction | 3
2 roAd tunnels And Air quAlity—An introduction
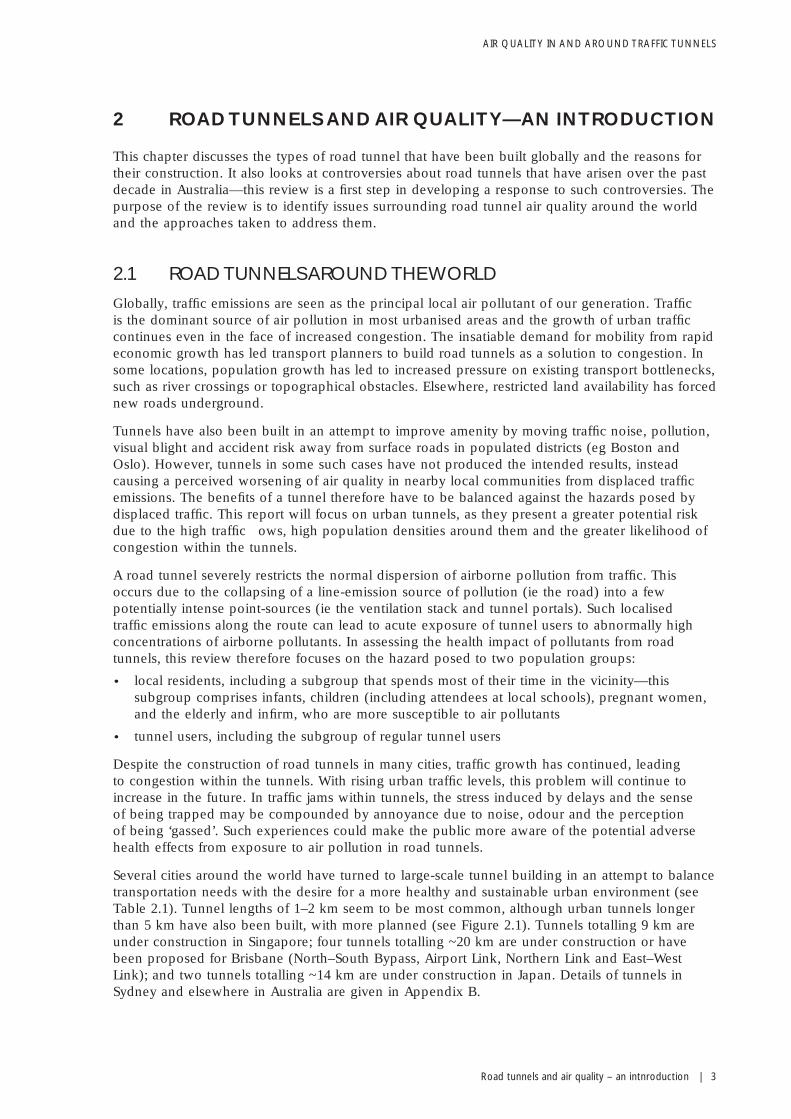
This chapter discusses the types of road tunnel that have been built globally and the reasons for their construction. It also looks at controversies about road tunnels that have arisen over the past decade in Australia—this review is a first step in developing a response to such controversies. The purpose of the review is to identify issues surrounding road tunnel air quality around the world and the approaches taken to address them.
2.1 roAd tunnels Around tHe world
Globally, traffic emissions are seen as the principal local air pollutant of our generation. Traffic is the dominant source of air pollution in most urbanised areas and the growth of urban traffic continues even in the face of increased congestion. The insatiable demand for mobility from rapid economic growth has led transport planners to build road tunnels as a solution to congestion. In some locations, population growth has led to increased pressure on existing transport bottlenecks, such as river crossings or topographical obstacles. Elsewhere, restricted land availability has forced new roads underground.
Tunnels have also been built in an attempt to improve amenity by moving traffic noise, pollution, visual blight and accident risk away from surface roads in populated districts (eg Boston and Oslo). However, tunnels in some such cases have not produced the intended results, instead causing a perceived worsening of air quality in nearby local communities from displaced traffic emissions. The benefits of a tunnel therefore have to be balanced against the hazards posed by displaced traffic. This report will focus on urban tunnels, as they present a greater potential risk due to the high traffic flows, high population densities around them and the greater likelihood of congestion within the tunnels.
A road tunnel severely restricts the normal dispersion of airborne pollution from traffic. This occurs due to the collapsing of a line-emission source of pollution (ie the road) into a few potentially intense point-sources (ie the ventilation stack and tunnel portals). Such localised traffic emissions along the route can lead to acute exposure of tunnel users to abnormally high concentrations of airborne pollutants. In assessing the health impact of pollutants from road tunnels, this review therefore focuses on the hazard posed to two population groups:
local residents, including a subgroup that spends most of their time in the vicinity—this •
subgroup comprises infants, children (including attendees at local schools), pregnant women, and the elderly and infirm, who are more susceptible to air pollutants
tunnel users, including the subgroup of regular tunnel users •
Despite the construction of road tunnels in many cities, traffic growth has continued, leading to congestion within the tunnels. With rising urban traffic levels, this problem will continue to increase in the future. In traffic jams within tunnels, the stress induced by delays and the sense of being trapped may be compounded by annoyance due to noise, odour and the perception of being ‘gassed’. Such experiences could make the public more aware of the potential adverse health effects from exposure to air pollution in road tunnels.
Several cities around the world have turned to large-scale tunnel building in an attempt to balance transportation needs with the desire for a more healthy and sustainable urban environment (see Table 2.1). Tunnel lengths of 1–2 km seem to be most common, although urban tunnels longer than 5 km have also been built, with more planned (see Figure 2.1). Tunnels totalling 9 km are under construction in Singapore; four tunnels totalling ~20 km are under construction or have been proposed for Brisbane (North–South Bypass, Airport Link, Northern Link and East–West Link); and two tunnels totalling ~14 km are under construction in Japan. Details of tunnels in Sydney and elsewhere in Australia are given in Appendix B.

aiR QUaLitY in anD aRoUnD tRaFFiC tUnneLS
4 | Road tunnels and air quality – an introduction
fiGure 2.1 A distribution of the number of urban tunnels (> 0.5 km long) as a function of length from a survey of 55 road tunnels around the world
0%
10%
20%
30%
40%
50%
0.5 to 1 1 to 2 2 to 3 3 to 4 4 +
Tunnel length / km
tAble 2.1 Approximate length of new urban road tunnels opened between 1989 and 2007
country, region or city tunnel length (km)
Dublin 4.5
Hong Kong 17
Japan:
Chubu 55
Kanto 13
Kyushu-okinawa 12
Kinki 14
Shikoku 06
tohoku 10
Lyon 06
Melbourne 05
Sydney 14
oslo 09
2.2 Air QuAlity, controversy And nAtionAl APProAcHes
The reviewers have been struck by the difference in attitudes around the world toward road tunnels and the relative lack of controversy outside Australia. For example, Hong Kong has more than 20 km of road tunnels—necessitated by its combination of high population density, mountainous terrain and island and harbour topography—yet the review found no evidence of community controversy surrounding these tunnels. As discussed in later chapters, the focus of Hong Kong literature on tunnels has been on the exposure of tunnel users and the determination of emission factors appropriate for the Hong Kong fleet, fuel and driving conditions.

aiR QUaLitY in anD aRoUnD tRaFFiC tUnneLS
Road tunnels and air quality – an intnroduction | 5
Tunnels in the United States are generally in much less urbanised areas and much of the research here has focused on determining real-world emission factors. The conversion of Boston’s Central Artery freeway from elevated roadway to tunnel in 2003 was the first major urban road tunnel in the United States. The principal issues of concern have been the effect on traffic flow and the opportunities for urban redevelopment created by the removal of the freeway from the surface.
By contrast, the focus of interest in Scandinavia has been the potential for improving the environment by reducing and diverting traffic impacts, with recent tunnel projects receiving approval from the public. A major element of research in Scandinavia has been the emission, nature and control of PM in tunnels, which is of significance due to the wide use of studded tyres (the interaction of such tyres with the road surface produces higher levels of PM).
Controversies about tunnels have arisen in Australia from a combination of technical and political issues. Admittedly, the M5 East tunnel in Sydney is particularly long (4 km) for a tunnel fully embedded in an urban area. However, although there is no evidence that the tunnel exposed people to CO levels above World Health Organization (WHO) guidelines, it has persistently attracted significant community concern, leading to design and operational changes in subsequent tunnels (Manins 2007). Much has been learned from this experience and the large number of new tunnel constructions around the world.

aiR QUaLitY in anD aRoUnD tRaFFiC tUnneLS
air quality within road tunnels – principles and data sources | 7
3 Air quAlity within roAd tunnels—PrinciPles And dAtA sources
This chapter looks first at the factors that affect air quality in tunnels; that is, vehicle emissions, ventilation design, the ‘piston effect’ (related to traffic volume, speed, fleet mix and tunnel dimensions), concentrations of pollutants, and air filtration and treatment. It also discusses the criteria used to set maximum concentrations of pollutants.
Section 3.2 describes the main datasets used in this review, and Section 3.3 discusses the quality of the data and the main methods used to interpret it and compare different datasets.
3.1 fActors AffectinG Air-QuAlity in tunnels
3.1.1 oveRvieW oF veHiCLe eMiSSionS in tUnneLS
From an air-quality point of view, a road tunnel can be viewed as a chamber where traffic emissions from a section of road—which would normally be dispersed into the atmosphere along the length of that section of the road—are concentrated before being released at one or a few points. Compared to a surface road, the air quality as experienced by road users is relatively poor; also, the effect on local residents is redistributed, so that contaminated air is more concentrated near the points where tunnel air is released into the atmosphere.
Air pollutants emitted from road vehicles are normally dispersed rapidly from the road by wind and turbulence effects (although this may not apply to canyons between tall buildings). The interior of a road tunnel is generally sheltered from the wind and the effects of any turbulence will be limited by the supply of fresh air available to dilute the polluted air. In a given time, a certain mass of pollutants will be emitted into the tunnel air depending on:
the number of vehicles in the tunnel•
the intensity and characteristics of vehicle emissions.•
The emissions per vehicle are highly variable and depend upon a range of factors. These include vehicle age, speed, size, fuel type, engine specifications, engine temperature, road gradient and factors that are hard to quantify, such as state of vehicle maintenance and driving style. Studies show that emissions will be higher for an older vehicle fleet, a higher proportion of heavy-duty vehicles (HDVs), vehicles climbing uphill and congested conditions.
3.1.2 tUnneL ventiLation DeSign
The concentration of air pollutants in a tunnel and in the emissions from the tunnel openings will depend on the rate of ventilation. This rate will vary within a range that is unique for each tunnel, as determined by its design. Three basic design options for tunnel ventilation are as follows (each type is discussed below):
passive ventilation•
longitudinal ventilation•
transverse ventilation (including semitransverse).•
Passive ventilation
Vehicles moving through a tunnel induce their own airflow in the same direction. This phenomenon is known as the ‘piston effect’ and it is the basis of passive ventilation. Passive ventilation requires no additional installations in the tunnel, making this the lowest cost option. The piston effect is only effective if all the traffic is proceeding in the same direction, and this is one of many reasons why most road tunnels have two tubes, one for each direction of travel.

aiR QUaLitY in anD aRoUnD tRaFFiC tUnneLS
8 | air quality within road tunnels – principles and data sources
In addition to this, two-tube tunnels provide increased safety in the event of fire and reduced risk of head-on collisions. The inevitable consequence is that contaminated air is transported to both tunnel exits, creating two emission point sources within the tunnel’s surrounding community, although there are options to avoid this, as described below.
longitudinal ventilation
Longitudinal ventilation refers to installations in which the piston effect is boosted by fans increasing the ventilation rate (see Figure 3.1). The word ‘longitudinal’ refers to the general direction of diluting airflow along the tunnel’s length. This arrangement represents both a capital cost and an operational cost that need to be justified. Longitudinal ventilation is commonly adopted in tunnels over a few 100 m and can sometimes be justified in terms of emergency smoke removal. Operational costs can be reduced by not running the fans when unassisted or passive ventilation is sufficient to maintain air quality.
transverse and semitransverse ventilation
Transverse ventilation is produced by a system that delivers fresh air and removes contaminated air at points along the full length of the tunnel (Figure 3.1). Normally, fresh air enters via the roof and contaminated air leaves through the floor—hence the use of the word ‘transverse’ to describe the direction of airflow across the bore of the tunnel and perpendicular to vehicle motion. Tunnels with such a ‘fully-transverse’ system are uncommon, although examples include the Lion Rock tunnel (Hong Kong), Plabutsch tunnel (Graz), Central Artery and Ted Williams tunnels (Boston), Caldecott tunnel (Oakland) and the Tauerntunnel (near Salzburg).
The semitransverse ventilation system is more prevalent. This system is based on either the provision of fresh air (the more common option) or the removal of contaminated air only. Air enters or exits the tunnel at a separate opening—the stack (or stacks)—as well as the tunnel portals, and the system can be designed so that no air leaves via the tunnel portals. Such a system demands a much larger capital investment due to the extra ventilation shafts and equipment. According to one estimate, ventilation represents 30% of the total costs of a semitransverse tunnel compared to 5–10% for a longitudinal tunnel (CETU 2003). Electrical power consumption for major tunnels can be in the order of megawatts per kilometre (Jacques and Possoz 1996). The environmental gains in ventilating tunnels should ideally be balanced against the environmental costs in terms of energy consumption.
fiGure 3.1 illustration of the airflow in longitudinal, transverse and semitransverse ventilation systems
Semitransverse ventilation system
Transverse ventilation system
Longitudinal ventilation system
Fresh air Vitiated air Source: CETU (2003)

aiR QUaLitY in anD aRoUnD tRaFFiC tUnneLS
air quality within road tunnels – principles and data sources | 9
choice of system and examples of different systems
The selection of ventilation system is a complex engineering process but, in broad terms, more complex systems have been applied to longer tunnels. According to the French Centre for Tunnel Studies (CETU), longitudinal systems are generally used where recurring congestion is not expected and transverse systems where congestion is expected (CETU 2003). However, it should be noted that the CETU report deals exclusively with incident or accident situations and does not address measures necessary to ensure air quality in normal operations. Recommended maximum tunnel lengths taken from the literature for each system are shown in Table 3.1.
tAble 3.1 recommended tunnel length limits, by ventilation type
tunnel length (m)
passive < 300 ma, b
Longitudinal (unidirectional only for urban or high-traffic tunnels)
< 600 ma
<500 mb
any length with mass extractionb
Recommended for unidirectional nonurban tunnels > 500 mb
Semitransverse < 1000 ma
< 1500 mc
transverse > 1500 ma
a el-Fadel and Hashisho (2001)b CetU (2003); the tunnel lengths quoted relate to smoke control during a fire incident, and do not consider air quality in
normal operational conditions.c Miclea et al (2007)
Longitudinal systems have been installed in long, busy urban tunnels recently. Examples include the M5 East (Sydney), Cross City (Sydney), Tate’s Cairn (Hong Kong) and Shing Mun (Hong Kong) tunnels, all of which are over 2 km long and have opened since 1990. Use of longitudinal systems has been made possible by the progressive reduction over time in vehicle emissions, and the use of mass-extraction ventilation systems and ventilation stacks. Nevertheless, the ventilation system in the M5 East tunnel has been the subject of major criticism.
High levels of pollutant emissions from the portals of long, busy tunnels may not be acceptable if the portals are in residential areas. In such cases, fans can direct most of the tunnel air through a separate ventilation stack at an elevated height rather than out of the portals at ground level.
The tunnels in Sydney provide several examples of ventilation layout. The 1.7 km Eastern Distributor tunnel is a longitudinal tunnel that normally relies on direct portal emission. In extreme conditions (eg high congestion, tunnel blockage and emergency) tunnel air can be vented via two ventilation stacks. The M5 East tunnel, however, is 4 km long and has portals in residential areas. In this case, portal emissions were considered undesirable and so an initial design was drawn up in which normal operation would involve the use of three ventilation stacks. Local community objections to the stacks led to a redesign involving a 1 km ventilation tunnel transporting polluted air to a ventilation stack in an industrial area about 1 km north of the tunnel.
The final design, as built, is illustrated in Figure 3.2. Air follows a circuit driven by fans and assisted by the piston effect of traffic. In normal operation, fresh air is drawn into both tubes at an intake at Duff Street, Arncliffe, and air is also drawn inwards at all of the portals. Near the ends of each tube, air is directed from one tube to the other in cross-over tubes. This cross-over flow is controlled by fans with variable speeds that also control the inward or outward flow of air at the portals. The contaminated air is removed into the ventilation tunnel approximately at the midpoint of the tunnel length. At times, contrary to the conditions of approval, the flows have been adjusted so that vitiated air can be released through the exit portals (discussed further in Chapter 7).

aiR QUaLitY in anD aRoUnD tRaFFiC tUnneLS
10 | air quality within road tunnels – principles and data sources
fiGure 3.2 ventilation system of the M5 east tunnel, sydney
3.1.3 tHe ‘piSton eFFeCt’ anD tHe opeRation oF LongitUDinaL ventiLation
The size of the piston effect on airflow induced by vehicles in the tunnel is a complex function of traffic volume, speed, fleet mix and tunnel dimensions. It is, however, limited and its effect is diminished in longer tunnels by increased pressure losses, including those due to friction. When combined with the need for emergency smoke removal, most tunnels over a few hundred metres have some form of forced ventilation installed. However, in the case of longitudinal ventilation systems, although fans have been installed, they do not necessarily operate all the time. Some tunnels operate the fans, increase the number of working fans, or increase the speed of the fans either at fixed periods (eg at peak traffic periods) or when monitored CO or haze levels exceed some predetermined value. However, in a number of busy urban tunnels, fans are apparently rarely or never used (eg the Söderledstunnel, Gubrist, Kaisermuhlen and Lundby tunnels). Such tunnels, although classified as longitudinally ventilated tunnels, are in fact operating as naturally ventilated tunnels. Measurement of the piston effect airflow in five naturally ventilated busy urban tunnels (including some with inactive longitudinal ventilation) with traffic speeds generally above 60 km h–1 showed mean air velocities in the range of 3.7–6 m s–1 (see Table 3.2).

aiR QUaLitY in anD aRoUnD tRaFFiC tUnneLS
air quality within road tunnels – principles and data sources | 11
tAble 3.2 observed air velocities in a selection of urban tunnels due to the ‘piston effect’ of vehicles
tunnellength (m)
daily (vehicles/ tube)
vehicle speed limit (km h–1) ventilation
Air velocity (m s–1) reference
gubrist, Zurich
3 268 22 500 100 Longitudinal (inactive)
2.7–9.0 Stemmler et al (2005)
Shing Mun, Hong Kong
2 600 27 000 65 Longitudinal (active morning peak only)
3.5–5.4 HKpU (2005)
Söderleds, Stockholm
1 500 32 000 60 Longitudinal (inactive)
2–6 gidhagen et al (2003)
thiais, paris 600 60 inactive 1.5–2.7 touaty and Bonsang (2000)
tseung Kwan o, Hong Kong
900 34 000 70 Longitudinal 2.8–4.7 HKpU (2005)
Sulfur hexafluoride (SF6) tracer release experiments in the Gubristtunnel, Zurich (Staehelin et al
1995) revealed air residence times in the tunnel of 360 seconds when the average wind speed was 8.5 m s–1. The abrupt arrival and disappearance of SF
6 at the receptors indicated that the air in the
tunnel travels as fairly well-defined discrete parcels.
The review found little data to explain how external winds influence the in-tunnel wind speed. However, one experimental study found that a strong external wind blowing against the tunnel flow reduced the wind speed in that tunnel to just 1 m s–1 (De Fré et al 1994). The CETU recommends that air velocity be limited to a maximum of 8 m s–1 in a bidirectional tunnel and 10 m s–1 in a unidirectional tunnel because in the case of a fire it is unsafe for winds to be any faster. When a tunnel design has to meet a fixed upper concentration limit, this effectively puts a limit on the tunnel length, unless multiple opportunities for air exchange (other than portals or a single stack) are introduced to the design. In the case of low traffic in the tunnel, a minimum airflow should be included in the design to cope with the transient effects of gross polluting vehicles or tunnel road blockage.
3.1.4 vaRiation in ConCentRationS aLong tUnneL LengtH
concentration variations with longitudinal ventilation
The concentration of any traffic-related pollutant at any point in a longitudinally or passively ventilated unidirectional tunnel depends on the cumulative emissions from the tunnel entry up to that point. In other words, the concentration increases with distance along the tunnel. In the simplest notional case of a passively ventilated tunnel with evenly distributed emissions, no entrainment of fresh air and no pollutant removal mechanisms, the concentration of CO, NO
x and PM will increase
linearly with depth into the tunnel (Chang and Rudy 1990, CETU 2003). Entrainment and removal (such as deposition) will cause concentrations to level off near either end. Transect studies, which take continuous measurements of pollutant concentrations from a normal vehicle moving through the tunnel (SEHA 1994, 1995; SESPHU 2003), confirm this general picture (see Chapter 4 for more details). Repeated measurements made at 100 m and 1000 m into the 1500 m-long Söderledstunnel in Stockholm consistently showed large concentration increases at 1000 m compared to 100 m. When the urban background concentration was subtracted, the ratio of concentrations at 1000 m to those at 100 m was approximately 6 for NO
x and CO in winter 1993 and 3.5 in summer 1994 (SEHA
1994, 1995). The average concentration during transit of this tunnel is similar to the concentration at one-third to one-half depth, which in this case can be approximated by the mean of the 100 m and 1000 m values. Tunnel ventilation design is more complex than suggested here, making it difficult to predict performance or draw conclusions about pollutant distribution and exposure.

aiR QUaLitY in anD aRoUnD tRaFFiC tUnneLS
12 | air quality within road tunnels – principles and data sources
variation in concentrations with semitransverse and transverse ventilation
In theory, the pollutant concentrations in a semitransverse tunnel should increase initially and then level off as the accumulation of emissions is countered by dilution by the fresh air injected along the tunnel length (Chang and Rudy 1990). However, limited data are available to verify this theory. A study of the Lion Rock tunnel in Hong Kong, which has fully transverse ventilation and a high traffic flow of ~95 000 vehicles per day, found that concentrations of CO were up to 100% higher in the first 50 m of the tunnel compared to the rest, where concentrations were approximately constant (Chow and Chan 2003).
3.1.5 aiR FiLtRation anD tReatMent
Filtration or other treatment of tunnel air is not widely used to remove or reduce pollutants. Electrostatic precipitation for the removal of particulates has been applied widely in Japan and Spain. Norway, where road dust emission from studded tyre use is a major cause of reduced visibility, is the only other country with significant use of electrostatic precipitation, albeit irregular. Major incentives for adopting filtration technology are the cost reduction in ventilating the tunnels and the reduction in greenhouse gas emissions. To improve local air quality along the Calle 30 ring route in Madrid, which is being extensively upgraded with 55 km of tunnels, filtration will be included for all tunnel stacks. The stacks will be filtered for particles and most will also incorporate gas treatment for NO
2.
None of the data in Phase 1 of this review considers the use of electrostatic precipitation as there are no good quality studies available, and we have no new data to present beyond that reported by Child and Associates (2004). Since the technology to reduce NO
2 in tunnel air is at an early
stage of development and adoption, it will not feature in Phase 1 of this review.
3.1.6 MaxiMUM poLLUtant CRiteRia
The criteria for acceptable in-tunnel air quality have been shaped by two factors:
evidence of adverse effects on human health from short-duration exposure to traffic-related •
air pollutants
reduction of visibility in tunnels. •
For business reasons, tunnel builders and operators will naturally aim to minimise the significant costs involved in providing active ventilation. As a result, systems are designed, built and operated to provide only sufficient ventilation to maintain acceptable air quality in the tunnel at minimum cost.
WHO has issued guidelines on acceptable levels of key air pollutants, based on research into their effects on human health. The guidelines released in 2000 (WHO 2000) cover a range of air pollutants, including benzene, CO, formaldehyde, lead, NO
2, O
3, PM, SO
2 and toluene. Although
the 2000 guidelines were specifically formulated for Europe, their worldwide use as a standard reference led to WHO publishing a global update in 2005 (WHO 2005). The 2005 guidelines apply to different durations of exposure except for SO
2 and CO, which relate to short-duration
exposures in road tunnels.
Sulfur dioxide emissions are largely related to sulfur content in fossil fuels, which has recently been reduced in petrol and diesel fuel for road vehicles, with the advent of stringent fuel quality standards. However, high-sulfur lubricant additives can negate the marginal benefits of low sulfur in petrol and diesel, especially in the role sulfur plays in the formation of ultrafine particles. The choice of a SO
2-based limit for managing air pollutant levels in tunnels is unsuitable due to the
existence of other sources of SO2, its relative solubility and reactivity. Carbon monoxide, however,
is strongly related to traffic emissions, and is relatively resistant to physical or chemical change during the timescales of its atmospheric residence in a road tunnel. However, there are concerns as to whether a CO-based limit is appropriate because of recent emissions reductions in CO

aiR QUaLitY in anD aRoUnD tRaFFiC tUnneLS
air quality within road tunnels – principles and data sources | 13
from vehicles (PIARC 2000). This review advises that the chemicals discussed here be considered as a group, and their levels in the environment be considered in addition to each other. This is discussed further in Chapter 7.
The WHO guidelines state that concentrations of CO (see Table 3.3) averaged over a 15 minute period should not exceed 100 mg m–3 (or 90 parts per million [ppm]), and that the exposure at this level should not persist beyond 15 minutes. WHO has set an additional exposure level guideline of 60 mg m–3 (50 ppm) for 30 minutes (WHO 2000) so that the level of carboxyhaemoglobin (COHb) in the blood should not exceed 2.5%. This guideline has been used as the basis of most tunnel-ventilation designs, perhaps because the length of most tunnels is such that the exposure duration is much less than 15 minutes. For example, travelling at 60 km h–1 through a 4 km tunnel would take four minutes. In such cases, a higher level of CO may be allowed in the tunnel. Also, the averaging time permits a higher concentration in a short section of the tunnel (generally the maximum is near the exit, as discussed below).
A baseline exposure value has been set by various other regulatory or consultative bodies. For example, the French Ministry of Health has effectively adapted the 30 minute WHO guideline in its ruling that CO concentrations in French tunnels should not exceed 50 ppm at any point in normal operation, or 150 ppm in emergency situations (CETU 2003). The Norwegian Public Roads Administration (NPRA) has decreed that CO concentrations should not exceed 200 ppm at the tunnel end and 100 ppm at its midlength (NPRA 2004). The United States Envirnmental Protection Authority provides four limit values as listed in Table 3.4.
tAble 3.3 world Health organization guidelines for ambient air quality (carbon monoxide)
concentration exposed averaging time
100 mg m–3 (90 ppm) 15 minutes
60 mg m–3 (50 ppm) 30 minutes
Source: WHO (2000)
tAble 3.4 united states environmental Protection Authority guidelines for in-tunnel air quality (carbon monoxide)
concentration exposed averaging time
120 ppm peak rush hour traffic < 15 minutes
65 ppm 15–30 minutes
45 ppm 30–45 minutes
35 ppm 45–60 minutes
The second factor for setting acceptable in-tunnel air quality is the reduction of visibility due to airborne particles in tunnels, which can have indirect effects on health, such as increasing driver stress and making driving more hazardous. Particulates causing a loss of visibility also have a direct effect on human health, but their effects over such short durations are not known with sufficient confidence to support a health-based guideline. The WHO guidelines for PM cover exposure durations of 24 hours and one year only, and are strictly applicable only to general ambient concentrations. A typical visibility criterion is that recommended by the Permanent International Association of Road Congresses (PIARC) of 0.005 m–1 in normal use and 0.009 m–1 in emergencies (see Chapter 7 for more details).

aiR QUaLitY in anD aRoUnD tRaFFiC tUnneLS
14 | air quality within road tunnels – principles and data sources
3.2 in-tunnel Air QuAlity—descriPtion of key dAtAsets
3.2.1 HoW anD WHen tUnneL aiR QUaLitY iS MeaSUReD
There are very few publicly available datasets of air-quality measurements in road tunnels. The measurements that have been made generally fall into three groups:
CO or visibility monitors operated by, or on behalf of, the tunnel operators as part of the •
ventilation management system—data from these measurement are generally not made publicly available; in this review only one such dataset has been accessed (Cross City tunnel, Sydney).
Air-quality assessment research, typically undertaken by, or on behalf of, councils or •
government agencies—data of this type are rare; although raw data are typically recorded at hourly resolution, published data are restricted to long-term means and descriptive statistics.
Research projects, generally for the purposes of establishing real-world vehicle emission •
factors in a nondispersive environment—such data are more readily available, but the published data tend to be biased to reporting emission factors rather than in-tunnel air quality; furthermore, these kinds of projects are usually of short duration (a few months at best, a few hours in some cases).
3.2.2 Data avaiLaBiLitY anD CRiteRia FoR SeLeCtion
The air quality and emission datasets considered in this review are listed in Appendix E; other literature identified but deemed unsuitable for inclusion in this review is listed in Appendix F. The following questions were considered in deciding which papers and datasets to include:
What is the extent of data content (pollutants, resolution, duration, supporting concurrent data)?•
Are dates and times of measurement given?•
Was the measurement location specified sufficiently?•
What is the duration and temporal representativeness of the data?•
What is the time resolution of the data?•
Does it include relevant physical tunnel data (eg length, bore)?•
Does it include description of ventilation and filtration regime?•
Does it include traffic data (volume, fleet composition, speed, occurrence of congestion and •
variability in each)?
How recent are the data?•
Is the publication peer-reviewed?•
Are measurements made using standard or referenced methods?•
Does the study contain two or more of concurrent in-tunnel, tunnel vicinity and background •
concentrations?
Does the study report direct traffic emissions (NO•x, CO, PM
10), especially multiple pollutants or
indirect pollutants (NO2, O
3, SO
2)?
Does the study report the response of concentrations to changes in traffic flow?•
Based on the above criteria, seven datasets were chosen to assess the air quality in tunnels (see list in Table 3.5). Much of the content of Chapter 4 is based on these seven datasets; the most important ones are introduced in the following paragraphs.

aiR QUaLitY in anD aRoUnD tRaFFiC tUnneLS
air quality within road tunnels – principles and data sources | 15
tAbl
e 3.
5 su
mm
ary
of m
ain
data
sets
rev
iew
ed in
thi
s re
port
tunn
elR
efer
ence
Stud
y ty
peSt
udy
year
Dur
atio
n
tunn
el
leng
th
(m)
vent
ilatio
n ty
pe
typi
cal
daily
tra
ffic
flow
Rep
orte
d po
lluta
nts
air
flow
m
easu
red?
Back
grou
nd
mea
sure
d?
Cal
deco
tt,
Cal
iforn
iaKi
rchs
tett
er e
t al
(1
999)
Fixe
d, p
m19
974
days
1100
L15
0 00
0C
o, C
o2,
no
x, pM
2.5,
BC, o
C, s
ulph
ate,
pa
rtic
le n
umbe
rsN
oPa
rtly
alle
n et
al (
2001
)19
974
days
Co
, Co
2, m
etha
ne, n
MH
C, H
nC
3, n
H3,
pM1.
9N
oPa
rtly
gro
ss e
t al
(20
00)
1997
4 da
ysSi
ngle
par
ticle
com
posit
ion
by a
toFM
SN
oPa
rtly
gel
ler
et a
l (20
05)
2004
4 da
ysC
o, C
o2,
pM10
, eC
, oC
, sul
phat
e, n
itrat
e,
part
icle
num
bers
no
Gub
risttu
nnel
, Z
urich
Wei
ngar
tner
et a
l (1
997)
Fixe
d,
24 h
our
1993
7 da
ys32
68L
45 0
00PM
3, pa
rticl
e siz
e di
strib
utio
n, pP
AH, B
CYe
sN
o
Stae
helin
et a
ll (1
995)
, 199
8)20
0227
day
sVO
CsN
oEn
tranc
e
Stem
mle
r et a
l (2
005)
Hoy
ange
r, N
orw
ayIn
dreh
us (
2001
)Fi
xed,
24
hou
r19
9420
day
s (9
4)75
00L
Low
CO, N
O2
Yes
No
Vass
botn
(20
01)
1995
25 d
ays
(95)
Klar
atun
nel,
Stoc
khol
mW
este
rlund
and
Jo
hans
son
(199
7)Fi
xed,
24
hou
r19
91-
2006
2 m
onth
s ea
ch y
ear
900
LP40
000
CO, N
O2,
NO
xN
oN
o
M5,
Eas
t, Sy
dney
SESP
HU
(20
03)
Tran
sect
2002
94 tr
ips
4000
L82
000
CO, C
O2,
PM2.
5, N
O2,
benz
ene,
tolu
ene
No
Part
ly
M5
East
, Sy
dney
Hol
mes
Air
Scie
nce
(200
5)Tr
anse
ct
and
fixed
, 24
hou
r
2004
160
trip
s, 39
day
s40
00L
90 0
00N
O, N
O2
No
No
Shin
g M
un a
nd
Tseu
ng K
wan
OH
ong
Kong
HKP
U (
2005
)Fi
xed,
24
hou
r20
0320
048
mon
ths
2600
900
LP55
000
68 0
00CO
, NO
2, N
Ox,
SO2,
PM2.
5, VO
C, N
MH
C, c
arbo
nyls
No
Road
side
Sode
rleds
tunn
el,
Stoc
khol
mSe
e Ta
ble
3.6
Fixe
d,
24 h
our
1995
-19
99M
inim
um
2 m
onth
s15
00L
72 0
00CO
, NO
2, N
Ox,
PM3,
VOC
, par
ticle
siz
e di
strib
utio
nsYe
sYe
s
ato
MFS
= a
eros
ol t
ime
of fl
ight
mas
s sp
ectr
omet
er; B
C =
bla
ck c
arbo
n; C
o =
car
bon
mon
oxid
e; C
o2
= c
arbo
n di
oxid
e; e
C =
ele
men
tal c
arbo
n; H
no
3 =
nitr
ic a
cid;
L =
long
itudi
nal,
Lp =
long
itudi
nal o
pera
tiona
l at
peak
tim
es, n
H3
= a
mm
onia
; no
= n
itrog
en m
onox
ide;
no
2 =
nitr
ogen
dio
xide
; no
x =
oxi
des
of n
itrog
en; n
MH
C =
non
met
hane
hyd
roca
rbon
; pM
1.9
= p
artic
les
of le
ss t
han
1.9
μm; p
M2.
5 =
par
ticle
s of
less
tha
n 2.
5 μm
; pM
3 =
par
ticle
s of
less
tha
n 3
μm;p
M10
= p
artic
les
of le
ss t
han
10 μ
m; p
paH
= p
artic
le-b
ound
pol
ycyc
lic a
rom
atic
hy
droc
arbo
n; S
o2
= s
ulfu
r di
oxid
e; v
oC
= v
olat
ile o
rgan
ic c
ompo
und

aiR QUaLitY in anD aRoUnD tRaFFiC tUnneLS
16 | air quality within road tunnels – principles and data sources
3.2.3 SöDeRLeDStUnneL, StoCKHoLM
The Söderledstunnel is a busy inner-urban road tunnel in central Stockholm. It is 1.5 km long, consists of two unidirectional tubes of two lanes each, has a speed limit of 80 km h–1 and carries approximately 72 000 vehicles per day. It is longitudinally ventilated, although the fans seem to be rarely (if ever) used. According to Gidhagen et al (2003) HDVs make up ~8% of the traffic flow in the daytime, and this proportion increases at night. However, this may have now reduced with the opening of the Sodra Lanken tunnel in 2004, which was intended to remove heavy goods traffic from central Stockholm.
The tunnel has been the site of several studies, representing in total what appears to be one of the world’s largest road tunnel datasets. Most studies have reused the same measurement sites (at 100 m and 1000 m depth in the northbound tube), and the earliest measurements go as far back as November 1993. The published reports on this tunnel used in this review are listed in Table 3.6.
tAble 3.6 Published papers on air quality measurements in the söderledstunnel, stockholm, included in this review
Author Period of data duration of study Measured pollutant species
SeHa (1994) nov–Dec 1993 7 weeks Co, no2, nox, pM10 (including transects of Co, no2, nox)
SeHa (1995) aug–Sep 1994 5 weeks Co, no2, nox, pM10 (including transects of Co, no2, nox)
Johannson et al (1996) Winter 1995–06 3 months Co, no2, nox
Johansson et al (1997) Winter 1995–06 3 months organic compounds
Kristensson et al (2004) Winter 1998–09 2 months pM10, particle number size distribution, nox, Co
gidhagen et al (2003) Winter 1999 15 days particle number size distribution
Co = carbon monoxide; no2 = nitrogen dioxide; nox = oxides of nitrogen; pM10 = particles of less than 10 μm
3.2.4 Hong Kong MoBiLe DataSetS
Many of the observations and conclusions in this report are based on four studies conducted in Hong Kong. Hong Kong presents an ideal location for tunnel study due to its dense network of tunnels with high traffic loads. A measured transect—a continuous measurement of pollutant concentrations made from a normal vehicle moving through the tunnel—is necessarily a random snapshot. The quality and representativeness of such data depend upon the appropriate selection of high-resolution and fast-response instrumentation, appropriate inlet design, and avoiding sampling sources related to the vehicle interior or bias due to sampling of the experimental vehicles own emissions. It also depends upon making repeated trips to build up a representative average or range of results. Key aspects of the Hong Kong studies are summarised in Table 3.7.

aiR QUaLitY in anD aRoUnD tRaFFiC tUnneLS
air quality within road tunnels – principles and data sources | 17
tAble 3.7 details of the Hong kong-based transect studies included in this review
study and year tunnels Platform PollutantsNumber of passes notes
Chan et al (2002) Winter 1998-99
Lion RockCross Harboureastern HarbourCheung tsingtai Lam
1988 toyota diesel van, sampled at 1.5m
Co 106668
in-cabin also, peak and official peak daytime periods
Chow and Chan (2003)Summer 1999
11 tunnels Car Co 22 peak and off-peak daytime periods
Mui and Shek (2005)Summer 2003
Lion RockCross Harbour
Buses ~half air conditioned
Co, pMa 121 Results for each tunnel presented as one, in-cabin also
Yao et al (2005)Sep 2004 and May 2005
tai Lamtate’s Caim
‘Mobile platform’ no, no2, nox, o3, Co
126 10am – 4pm
Yao et al (2007)June 2002 – aug 2003
tseung Kwan oWestern Harboureastern Harbour
‘Mobile platform’ particle size distributions, no2
62 10am – 4pm3 tunnels averaged
Co = carbon monoxide; no = nitrogen monoxide; no2 = nitrogen dioxide; nox = oxides of nitrogen; o3 = ozone; pM = particulate mattera pM measured using simple optical technique that is not directly equivalent to US epa approved techniques.
3.2.5 SHing MUn anD tSeUng KWan o tUnneLS, Hong Kong (HKpU StUDY)
Tunnel-based emission factor studies usually involve measurements over a few days or in some cases a few weeks. In many studies, measurements have been conducted during daytime hours only; as a result, the data represent a ‘snapshot’ rather than a long-term average.
An exception is the study by the Hong Kong Polytechnic University (2005), in which a range of substances (including CO, CO
2, SO
2, NO
x, ammonia, volatile organic compounds [VOCs],
polycyclic aromatic hydrocarbons [PAHs], carbonyls, PM2.5
and their elemental composition) were measured over four months in summer 2003 and four months in winter 2003–04. Measurements were made at 12 locations around Hong Kong, including within both tubes of the 2.6 km Shing Mun tunnel and in the northbound tube of the 900 m Tseung Kwan O tunnel. Measurements from the Shing Mun tunnel are of particular interest because they were made simultaneously in both tubes (north and south). This tunnel links two urbanised areas of the New Territories by passing through intervening mountains. It is composed of two sections, with measurements made in the longer section (~1.6 km long). The traffic fleet characteristics in both tubes are similar, with total flow through the tunnel of ~55 000, but in the experimental section there is an uphill gradient of approximately 1% in the south tube.
3.2.6 M5 east tunnel, sydney
The M5 East tunnel in Sydney is especially long for an urban tunnel (4 km), carries a heavy traffic load (~100 000 vehicles per day) on two lanes per tube, and is subject to frequent congestion. It has been one of the most controversial road tunnels in terms of air quality. Poor visibility has also been reported—for example, in the submissions to the New South Wales (NSW) parliamentary inquiry (NSW Parliament 2002). These factors make this tunnel one of primary interest in this review. Fortunately, a substantial volume of monitoring data exists. This report has made use of both transect measurements through the tunnel, as well as external measurements near the portals (see Section 5.3) and in the residential neighbourhoods near the ventilation stack (see Section 5.4).

aiR QUaLitY in anD aRoUnD tRaFFiC tUnneLS
18 | air quality within road tunnels – principles and data sources
The review includes two key studies of the M5 East tunnel (SESPHU 2003 and Holmes Air Sciences 2005), which are of relatively high quality due to the large number of repeated trips and coverage of a range of traffic conditions. The study by the South Eastern Sydney Public Health Unit and the NSW Department of Health (SESPHU 2003) included 63 trips in the eastbound tube and 31 in the westbound tube, while the Holmes Air Sciences (2005) study included 80 trips each. In these studies, a wide range of pollutants were measured in the vehicle cabin but the particular usefulness of the earlier SESPHU dataset is the simultaneous measurement of external concentrations of CO and NO
2, including three vehicle-ventilation options (windows open,
windows closed airconditioning off, windows closed airconditioning on). The second study compared measurements of NO and NO
2 outside the vehicle cabin with those from a fixed point
in the tunnel. This allowed a comparison between pollutant levels measured at a fixed point in a tunnel and the levels to which tunnel users are actually exposed.
3.3 dAtA QuAlity, interPretAtion And intercoMPArison
3.3.1 MULtipLe vaRiaBLeS anD vaRiaBiLitY
As Chapter 4 makes clear, multiple variables influence road tunnel air quality. This makes it impossible to directly compare concentrations of air pollutants recorded in one tunnel with another without considering the differences between the tunnels. A lack of detailed data has prevented this review from systematically analysing and disaggregating these multiple influences. The lack of data also prevents a confident assessment of the degree of random variability within each relationship.
Nevertheless, rather than just presenting a range of observed concentrations without explanation, this report provides information that can be determined about each influencing factor and some generic in-tunnel air quality scenarios based on observed data.
Table 3.5 presents some of the variables that influence air quality in the key datasets that form the backbone of this review. Fuller details of the important reported variables and physical tunnel parameters for all of the referenced datasets are provided in Appendix C.
3.3.2 expoSURe anD FixeD-point MeaSUReMentS
The best type of measurement for assessing the exposure of tunnel users to pollutants is a continuous measurement made from a vehicle moving through the tunnel. However, such measurements tend to be brief and subject to many random influences. More representative data can be obtained from multiple journeys through the same tunnel. Such studies are reviewed in Chapter 4.
Transect studies are relatively rare compared to fixed-point studies. As noted above, concentrations can vary between points in a tunnel, especially in natural or longitudinal ventilation arrangements. There is no consensus as to how deep into a tunnel measurements should be made, the depth of sampling usually being determined by logistical practicalities. Hence, measurements made at different depths cannot be directly compared, especially when comparing one tunnel with another.
3.3.3 ContinUoUS anD nonContinUoUS Data
Some studies provide continuously recorded data, 24 hours a day for seven days a week, and therefore represent the average of both high and low emission periods. However, other datasets are restricted to certain times of the day—generally ‘daytime’ hours or peak traffic periods. Some datasets cover weekdays only, with weekends sampled separately or not at all. Many of the emission factor studies involve very short sampling periods (ie a few hours). Thus, mean values reported for daylight hours only cannot be directly compared with 24-hour means. Studies
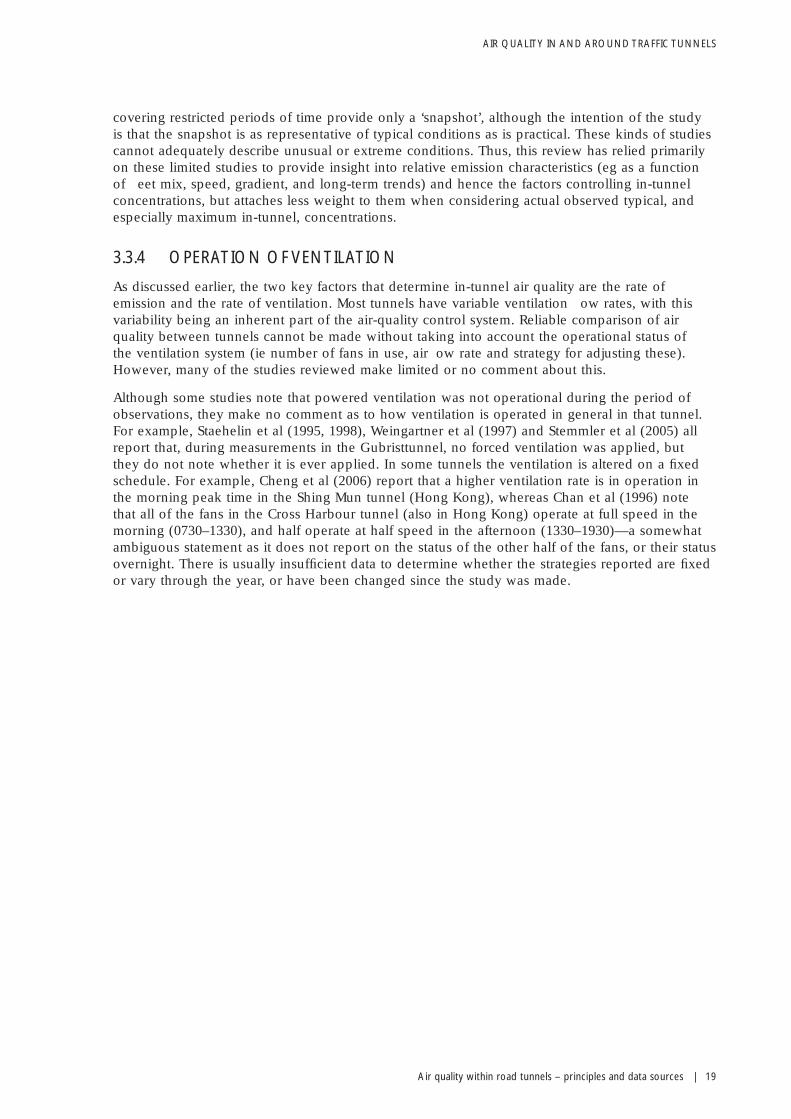
aiR QUaLitY in anD aRoUnD tRaFFiC tUnneLS
air quality within road tunnels – principles and data sources | 19
covering restricted periods of time provide only a ‘snapshot’, although the intention of the study is that the snapshot is as representative of typical conditions as is practical. These kinds of studies cannot adequately describe unusual or extreme conditions. Thus, this review has relied primarily on these limited studies to provide insight into relative emission characteristics (eg as a function of fleet mix, speed, gradient, and long-term trends) and hence the factors controlling in-tunnel concentrations, but attaches less weight to them when considering actual observed typical, and especially maximum in-tunnel, concentrations.
3.3.4 opeRation oF ventiLation
As discussed earlier, the two key factors that determine in-tunnel air quality are the rate of emission and the rate of ventilation. Most tunnels have variable ventilation flow rates, with this variability being an inherent part of the air-quality control system. Reliable comparison of air quality between tunnels cannot be made without taking into account the operational status of the ventilation system (ie number of fans in use, airflow rate and strategy for adjusting these). However, many of the studies reviewed make limited or no comment about this.
Although some studies note that powered ventilation was not operational during the period of observations, they make no comment as to how ventilation is operated in general in that tunnel. For example, Staehelin et al (1995, 1998), Weingartner et al (1997) and Stemmler et al (2005) all report that, during measurements in the Gubristtunnel, no forced ventilation was applied, but they do not note whether it is ever applied. In some tunnels the ventilation is altered on a fixed schedule. For example, Cheng et al (2006) report that a higher ventilation rate is in operation in the morning peak time in the Shing Mun tunnel (Hong Kong), whereas Chan et al (1996) note that all of the fans in the Cross Harbour tunnel (also in Hong Kong) operate at full speed in the morning (0730–1330), and half operate at half speed in the afternoon (1330–1930)—a somewhat ambiguous statement as it does not report on the status of the other half of the fans, or their status overnight. There is usually insufficient data to determine whether the strategies reported are fixed or vary through the year, or have been changed since the study was made.

aiR QUaLitY in anD aRoUnD tRaFFiC tUnneLS
Review of in-tunnel air quality | 21
4 review of in-tunnel Air quAlity
This chapter reviews the data on in-tunnel air quality. It looks first at air climate in tunnels (Section 4.1), then at the main air pollutants found in tunnels:
CO and PM, which are used as indicators of traffic-related air pollution (Section 4.2) •
(issues specific to PM pollutants are discussed in Section 4.4)
oxides of nitrogen and O• 3 (Section 4.3).
Section 4.5 discusses data on the other important pollutants that affect tunnel air quality—SO2,
lead, benzene, toluene, formaldehye and bioaerosols.
Data on in-vehicle exposure of tunnel users is outlined in Section 4.6, and on the effects of traffic congestion in Section 4.7. This chapter also considers the evidence for how emissions could be reduced in the long term (Section 4.8). Finally, the chapter presents notional ‘typical’ and ‘high’ in-tunnel air quality climate scenarios, which are then used as the basis of the health assessment described in Chapter 6 (Section 4.9).
4.1 Air cliMAte of roAd tunnels
Although temperature is routinely monitored in many tunnels, published data have been difficult to find. The air in tunnels with heavy traffic is warmer than the ambient air due to the heat from exhaust plumes and warm engines. For example, Pierson et al (1996) found that air temperatures in the Fort McHenry tunnel (Baltimore, USA) were on average 4.7ºC higher than outside the tunnel. Their study reported a mean temperature difference of +2ºC in the Tuscacora tunnel (Pennsylvania, USA). In a 19-day study of the Kaisermuhlen tunnel (Vienna), Lashober et al (2004) found that in-tunnel temperatures ranged from 14ºC to 30ºC when the ambient temperature outside the tunnel varied between 13ºC and 19ºC. Cheng et al (2006) reported temperatures of 16.3–31.1ºC in the Shing Mun tunnel (Hong Kong) over 16 days in winter 2003–04, but their study did not include external temperatures. During the summer of 2003, temperatures of 29–38.1ºC were recorded in nonairconditioned buses with open windows in the Cross Harbour and Lion Rock tunnels (Hong Kong), while the ambient temperature range was 28–32ºC (Mui and Shek 2005).
The 11-tunnel study of Chow and Chan (2003) led to the development of a linear parameterisation relating the temperature difference between inside and outside the tunnels (?T) and the maximum CO concentration within each tunnel (with CO presumably acting as a surrogate for vehicle heat emissions):
COmax
(ppm) = 10.8 ?T + 4.6
Indrehus and Vassbotn (2001) reported that in the low-emission, low-airflow, 7.5-km long Hoyanger tunnel in Norway, the in-tunnel temperature was influenced by the thermal inertia such that tunnel air in winter was warmer than ambient air and vice versa in summer. A similar seasonal temperature pattern was observed in the Bomlafjord undersea tunnel in Norway (Indrehus and Aralt 2005). One-week averages from four measurement points in the tunnel and one outside were monitored for six weeks between winter 2001–02 and summer 2002. For any given week the variation in temperature along the tunnel was low. Slightly higher mean temperatures were recorded at the deeper measurement points, with the difference between the highest and lowest mean temperatures varying from 1.1 to 2.2ºC. The in-tunnel mean temperature for each week was always higher than the mean external temperature. The difference was approximately 4–5ºC in winter, but only 0–1.5ºC in summer.
Published data on in-tunnel relative humidity (RH) are even fewer than those on temperature. According to Pierson et al (1996) RH in the Fort McHenry tunnel was higher than in the ambient background and marginally higher in the Tuscacora tunnel. In the bus transect of Mui and Shek (2005) RH ranged from 43.2% to 90.2% at a time when ambient RH ranged 70% to 85%. Based on a week’s campaign in the Gubristtunnel in Zurich, Weingartner et al (1997) reported that RH did not exceed 85%. This finding was cited to explain that adsorption of water onto freshly emitted

aiR QUaLitY in anD aRoUnD tRaFFiC tUnneLS
22 | Review of in-tunnel air quality
exhaust particles would not have occurred during the campaign. Indrehus and Aralt’s (2005) study of the Bomlafjord undersea tunnel recorded low variability in RH through the tunnel’s length in winter but a larger variation in summer. In winter the average in-tunnel RH was approximately 20% lower than outside the tunnel (ie ~60% compared to ~80% outside the tunnel). This difference reduced to zero in summer. Although tunnels are assumed to be damp places, evidence of an accompanying increase in humidity is not compelling.
4.2 co And PM—GenerAl trAffic-relAted Air PollutAnts
4.2.1 Co anD pM aS inDiCatoRS oF tRaFFiC ReLateD aiR poLLUtion
The air pollutant CO is widely used in atmospheric science as an indicator of traffic emissions and dispersion processes. The reasons for this choice are that the major source of CO in the urban atmosphere is traffic exhaust and it has a low reactivity in the relevant timescales. Following its emission, CO does not react chemically (unlike NO) or combine physically or otherwise transform its nature (as some elements of PM do). Therefore, measured concentrations of CO represent dispersion processes only. It is also a useful pollutant to study because a substantial body of knowledge is available on the short-term effects of CO inhalation on timescales of hours to minutes.
PM is a label given to a myriad of substances in the atmosphere composed of potentially thousands of chemical compounds suspended in the air in a solid, liquid or multiphase state. Guidelines exists for PM
10 and PM
2.5 (nominally the mass concentration in air of PM smaller than
10 μm and 2.5 μm, respectively), and this is the simplest and most common way of measuring the quantity of PM in the air. When considered as a single pollutant, PM has significant similarities with CO, in that traffic is one of its major sources and it is a major pollutant in road tunnels. Although PM behaves differently from CO immediately following emission (due to processes such as deposition, coagulation, condensation and resuspension), there are sufficient similarities for CO and PM to be considered together. The ways in which PM differs from CO, which are crucial for health impact assessment, are covered in Section 4.4.
4.2.2 SoURCeS anD ContRoL oF Co eMiSSionS
The main source of CO is petrol-powered cars, generated as a byproduct of incomplete combustion. Improvements in engine design allowed the introduction in 1992 of the Euro I standard in Europe (and equivalent standards in the United States, Japan and elsewhere), which set stringent emission limits for new vehicles. CO emissions have fallen rapidly since then as the proportion of vehicles on the road meeting this standard (and subsequent tougher standards) increased. As result, urban concentrations of CO have fallen to a point where it is barely relevant in many countries. It is only a significant ambient pollutant close to busy traffic (< 100 m). As CO emissions continue to fall rapidly, observational data quickly get out of date and consequently CO concentrations discussed below tend to be higher than actual current levels. However, CO concentrations in traffic tunnels will be orders of magnitude greater than elsewhere in the road network and therefore continue to pose a serious risk to health.
4.2.3 SoURCeS anD ContRoL oF pM eMiSSionS
The sources and emission control of PM are covered briefly here. The health effects of airborne particles are determined by their chemical composition and physical characteristics, which are discussed more fully in Section 4.4.
In the context of a road tunnel, there are two main components of PM—tailpipe emissions and resuspension of dust from the road surface. The tailpipe emissions are dominated by black carbon (soot) and organic compounds derived from complete or partial burning of fuel and droplets of lubricating oils (Fraser et al 1998, Kirchtetter et al 1999). Emissions of PM from trucks tend to be much higher than from smaller vehicles. For example, a 1977 study of the Caldecott tunnel

aiR QUaLitY in anD aRoUnD tRaFFiC tUnneLS
Review of in-tunnel air quality | 23
near Oakland (USA) found that heavy-duty diesel trucks emitted 24 times more particulate mass per unit mass of fuel burned than light-duty vehicles (LDVs) (Kirchtetter et al 1999). A repeat experiment in 2004 reported that the ratio had reduced from 24 to 17. The ratio of elemental to organic carbon (OC) is also higher for HDVs. For example, Kirchtetter et al (1999) estimated elemental carbon (EC) represented 51% of PM
2.5 emissions for HDVs and 33% for LDVs. This is
significant where visibility is used as a criterion for ventilation design or control, because emission of ‘dark’ particulates (ie EC) is strongly dominated by the number and emission quality of heavy duty vehicles (HDVs) using the tunnel. The significance of soot emissions by HDVs is explored later in this section.
Particles from tailpipes are generally smaller than 1 μm (submicron or ‘fine’). Road dusts include local mineral dust, soils, and brake and tyre wear products. They tend to be larger than 1 μm (supermicron or ‘coarse’). Coarse particles can be abundant close to fast-moving heavy traffic, especially trucks. Their toxicity is traditionally believed to be relatively low, although this notion has recently been challenged (see Hetland et al 2004, Schins et al 2004, Yeatts et al 2007).
Some of the particle mass can be indirectly attributed to vehicle emissions due to the reaction of gaseous ammonia emitted from vehicles in the tunnel with nitric acid in the background air to form particulate ammonium nitrate (Fraser et al 1998). Aerosol sulfate has also been identified in tunnels at concentrations above background level and associated with direct emission from HDVs (Allen et al 2001). The rate of this emission will be partly dependent upon the level of sulfur in the fuel used.
PM2.5
excludes all particles larger than 2.5 μm (ie many coarse particles). It is more representative of tailpipe emissions but can still be influenced by road dust. Many countries have, or plan to, introduce PM
2.5 regulations alongside PM
10. In terms of mass, size-segregated measurements made
in road tunnels show that the majority of the particle mass is generally associated with particles between 0.05 and 1.0 μm, with a mass peak around 0.1–0.2 μm (Allen et al 2001).
As with CO, efforts have been made to reduce PM10 emissions from vehicles but progress has been slower than for CO. No viable method for reducing road dust resuspension has been brought into everyday use.
4.2.4 ReLationSHip oF Co anD pM WitH exteRnaL aMBient aiR QUaLitY
Urban concentrations of CO have fallen to a point where ambient concentrations are one or even two orders of magnitude below the WHO ambient one-hour guideline of 30 ppm (~25 ppm, the average ambient concentration). In many countries 0.2–0.5 ppm may be taken as typical urban background concentrations, and CO is generally only considered to be a significant pollutant close to busy traffic (< 100 m). Concentrations in tunnels, as discussed below, are generally well above 1 ppm and consequently will be little affected by ambient CO concentrations.
PM10, in cities, in general comes from both anthropogenic and natural sources. Annual mean PM
10
concentrations in cities (but away from major roads or other sources) tend to be 20–40 μg m–3 in Europe and up to 80 μg m–3 in Latin America. Values for Australian cities are approximately 14–21 μg m–3. Thus, a substantial proportion of the concentration of PM
10 in tunnels could have a
nontunnel origin. The concentrations reported below have not compensated for this background contribution.
4.2.5 DiURnaL CYCLeS oF Co anD pM
Wherever diurnally averaged CO and PM data in tunnels have been presented, a clear pattern exists that represents the diurnal cycle in traffic flow. For example, measurements in the Söderledstunnel, Stockholm in the winters of 1995–06 (Johansson et al 1996) and 1998–99 (Kristensson et al 2004) indicate clear diurnal cycles in CO with a strong morning peak and a lesser evening peak. The size of the morning peak was larger at a site deeper into the tunnel.

aiR QUaLitY in anD aRoUnD tRaFFiC tUnneLS
24 | Review of in-tunnel air quality
A similar diurnal cycle was observed in ultrafine particles in the size range 47–55 nm in the winters of 1998 (Gidhagen et al 2003) and 1999 (Kristensson et al 2004).
Diurnal cycles are clearly evident in the stack emissions of the M5 East, where the ventilation system operates at its effective maximum (about 900 m3 sec–1) during all daylight hours. The stack emissions show clear morning and afternoon peaks, often 1000μg m–3 in the morning and 1200 μg m–3 in the afternoon, and the efflux temperature varies between 34ºC and 37°C in summer (February) and 23°C and 28°C in winter (August). The peculiar design of the tunnel means that the stack concentration is always less than at least one location inside the tunnel, and that pollution profiles along the tunnel are not linear and do not begin at ambient levels at the tunnel entry.
The 1998–99 studies in Hong Kong indicated that average CO concentrations at traffic peak periods were typically and consistently 50% higher than at off-peak daytime periods (see Figure 4.1).
fiGure 4.1 relationship between average carbon monoxide concentration at traffic peaks and at off-peak daytime hours from the Hong kong 1988–89 transect studies
00
35
y = 1.4997x -0.6787R2 = 0.9275
30
25
20
15
10
5
5 10 15 20 25
Ave
rage
CO
con
cent
ratio
n du
ring
pea
k ho
urs
(ppm
)
Average CO concentration during nonpeak hours (ppm)
Source: Chan et al (2002), Chow and Chan (2003)
Similar diurnal cycles, generally representing diurnal cycles in traffic flow have been observed in the Shing Mun tunnel in Hong Kong (HKPU 2005).
4.2.6 SeaSonaL CYCLeS oF Co
The long-term data from the Cross City tunnel, Sydney1 show no clear seasonal influence on in-tunnel CO concentrations, although this will partly be due to the very low concentrations arising from the tunnel’s under-use compared to design. Small seasonal differences between summer and winter were found in long-term mean concentrations of CO in the Shing Mun and Tseung Kwan O tunnels in Hong Kong (HKPU 2005), but no consistent pattern was observed.
1 http://www.iata.org/ps/publications/

aiR QUaLitY in anD aRoUnD tRaFFiC tUnneLS
Review of in-tunnel air quality | 25
4.2.7 inFLUenCe oF tUnneL LengtH on Co
In theory, for a constant airflow, the mean concentrations in longitudinally ventilated tunnels should be roughly proportional to the tunnel length. In semitransverse tunnels the relationship is nonlinear, with the increase in concentration being proportionally less than the increase in length. In practice, tunnels of different length cannot be directly compared due to differences in their designed and operational ventilation flow rate and traffic flow.
4.2.8 tRanSeCt StUDieS
Hong kong
Five tunnels in Hong Kong were surveyed from a moving vehicle in winter 1998–99 during daytime hours (Chan et al 2002). Concentrations of CO in three tunnels in central areas (Cross Harbour, Lion Rock and Eastern Harbour) ranged from 7.6 to 8.5 ppm at peak hour and from 5.6 to 7.6 ppm at nonpeak hour. The average CO levels in two rural or new town vehicle tunnels (Tai Lam and Cheung Tsing) were 2.9–3.0 ppm and 2.3–2.6 ppm at peak and nonpeak hour, respectively. The report authors cited the main cause of the concentration variation to be the higher traffic volume in the more fully urban tunnels.
Two of the tunnels surveyed by Chan et al (2002) (Lion Rock and Cross Harbour) were also surveyed in buses by Mui and Shek (2005) at off-peak daytime periods in summer 2003. Mean concentrations of CO measured out of a bus window were reported for both tunnels combined, but were of a similar magnitude to those reported by Chan et al (2002), ie 2–13 ppm, with a mean of 6.5 ppm.
Similar measurements were made in the same tunnels in the summer, roughly six months after the winter 1999 studies, by Chow and Chan (2003). In every case but one (Eastern Harbour tunnel), the CO concentrations measured were more than double those measured in the winter (and in summer 2003, see above), a surprising result that demands scrutiny. A genuine large seasonal variation seems unlikely and at odds with other observations noted above. It is highly unlikely that this change was due to changes in traffic flow. Possible reasons for the apparent seasonal difference include differences in instrumentation, although they were calibrated before each sampling in both studies. The winter measurements by online gas analyser were confirmed by offline analysis of Tedlar bag samples. A possible reason for the larger concentrations recorded in summer 1999 is the positioning of the sampler inlet.
M5 east, sydney
Transects were made to measure CO from the roof of a station wagon on 32 consecutive days from 30 October 2002 (SESPHU 2003). On each day three trips were made—eastbound in the morning and in both directions in the afternoon. Mean concentrations for each trip were presented. There was considerable variation between trips with concentrations ranging from 5.3 to 38.7 ppm. Morning concentrations were lower than afternoon (means of 17.2 and 23.2 ppm, respectively), but direction of travel had much less influence.
These values are generally higher than those observed in Hong Kong, especially in the Cross City tunnel, also in Sydney. This may be accounted for by the following observations:
The M5 East tunnel is exceptionally busy, carrying around 100 000 vehicles per day.•
The proportion of HDVs is relatively low (~7% as reported in SESPHU 2003), which is •
particularly relevant because one large diesel-fuelled truck can produce as much particle pollution as approximately 20 cars.
Congestion is significant. For a 4 km tunnel with a speed limit of 90 km h• –1, a transit time of 2.7 minutes could be expected. During the 32 mobile transits conducted in 2002 (SESPHU 2003), mean journey times of just under five minutes were noted on the eastbound tube and 10 minutes on the westbound, corresponding to average speeds of approximately 50 and 24 km h–1, respectively. CO emissions increased per kilometre in congested conditions due to repeated bursts of acceleration and deceleration, and emission increased at lower speeds especially for cars and diesel-fuelled trucks.

aiR QUaLitY in anD aRoUnD tRaFFiC tUnneLS
26 | Review of in-tunnel air quality
4.2.9 inFLUenCe oF tRaFFiC DenSitY on Co
If all other variables are held constant, the concentration at a fixed point (and the mean along the tunnel length) will be proportional to the traffic density in a longitudinally ventilated tunnel. In a semitransverse tunnel, however, the effect is nonlinear, with the increase in concentrations being proportionally less than the increase in emissions by a factor that increases with tunnel length. Comparing tunnels is difficult, however, because of the multiplicity of influencing variables.
The Hong Kong studies of Chow and Chan in the summer of 1999 (Chow and Chan 2003) covered 11 tunnels and allows a limited comparison between tunnels in the same city at the same time. The analysis is limited as there were still a number of variables between the tunnels. The tunnels covered three types of ventilation (longitudinal, semitransverse and fully transverse), a range of traffic flows (annual average daily traffic or AADT of 43 000–119 000 vehicles), varying fleet splits (eg cars comprising 34–57% of the fleet), and two of the tunnels having three lanes per bore whereas the rest have two. Average CO concentrations in nonpeak periods could not be clearly related to any one of these factors alone, but average CO concentrations in peak periods (0800–0930) were positively related to annual average daily traffic (AADT) for each tunnel. The relationship between maximum CO concentrations and AADT at both peak and nonpeak times was stronger. In general, concentrations in Hong Kong’s busiest tunnels (Cross Harbour, AADT = 119 000, and Lion Rock, AADT = 92 000) were higher than in other tunnels.
4.2.10 inFLUenCe oF tRaFFiC FLeet CoMpoSition on Co anD pM
CO emissions are dominated by petrol vehicles, whereas PM10 emissions are more strongly related
to diesel-powered heavy duty vehicles, and hence the concentrations in any given tunnel are dependent upon the relative composition of the vehicle fleet using the tunnel. This fleet split may not necessarily relate to the general fleet split in the city or district in which the tunnel is situated, especially if the tunnel is part of a strategic route and carries long-distance, perhaps international traffic, or links major industrial areas, ports or airports. For instance, a study of emission factors (Gertler and Pierson 1996) in the Cassiar tunnel in Vancouver and the Caldecott tunnel in California found that although both are on regional highways, the Cassiar tunnel carries a newer vehicle fleet compared to Vancouver in general, whereas the fleet in the Caldecott tunnel is principally made of local commuting vehicles.
The influence of fleet composition on emissions can be seen by comparing the results of two studies of the Caldecott tunnel in California. This tunnel has two eastbound tubes, one for the use of LDVs only (although occasionally HDVs use it by mistake or in defiance of the exclusion). Kirchtetter et al (1999) measured emissions over three hours on four days in one bore and then measured emissions from the other bore (ie same regime but different hours, based on peak times for HDVs) in summer 1997. A similar campaign in November 1997 was reported by Allen et al (2001). Both studies found much higher concentrations of fine PM in bore 1 (which permits all vehicles) than in bore 2 (LDVs only), despite the much higher total traffic in bore 2. The opposite pattern was found for CO, with higher concentrations in the LDV-only bore 2 (as summarised in Tables 4.1 and 4.2). These measurements were repeated in 2004 revealing a similar relationship but significantly reduced concentrations.

aiR QUaLitY in anD aRoUnD tRaFFiC tUnneLS
Review of in-tunnel air quality | 27
tAble 4.1 comparison of co and PM2.5 concentrations in the two bores of the caldecott tunnel Bore 1 Bore2
bore 1 bore 2
total LDv count 8948 16388
total HDv count 392 55
Mean Co (ppm) 18.7 27.2
Mean pM2.5 (μg m–3) 132.5 54.7
Background pM2.5 (μg m–3) 13.7 16.9
Co = carbon monoxide; HDv = heavy-duty vehicle; LDv = light-duty vehicle; pM2.5 = particles of less than 2.5 μm
Source: Kirchtetter et al (1999)
tAble 4.2 comparison of co and PM1.9 concentrations in the two bores of the caldecott tunnel
bore 1 bore 2
total LDv count 11635 25087
total HDv count 778 61
Mean Co (ppm) 18.3 25.9
Mean pM1.9 (μg m–3) 102 32
Background pM1.9 (μg m–3) 7.1 (average)
Co = carbon monoxide; HDv = heavy-duty vehicle; LDv = light-duty vehicle; pM2.5 = particles of less than 2.5 μm
Source: Allen et al (2001)
Several studies have calculated the total carbon emission in a tunnel from measurements of CO, CO
2 and nonmethane volatile organic compounds (NMVOCs). If the total carbon emission
attributed to diesel vehicles is calculated, it can be plotted against each individual component, such as CO emission, as in the example in Figure 4.2 below (from a study in the Washburn tunnel, Houston [McGaughey et al 2004]). This shows clearly the effect of diesel traffic on CO concentrations in a tunnel.
fiGure 4.2 carbon monoxide emission factors versus diesel contribution to total carbon emissions in the washburn tunnel
90
80
70
60
50
40
30
20
10
0% 5% 25%20%15%10%
y = 151 x + 88 R2 = 0.58
CO Emissions
% of carbon from dieselsSource: McGaughey et al (2004)
emis
sion
inde
x (g
per
kg
c in
fuel
)

aiR QUaLitY in anD aRoUnD tRaFFiC tUnneLS
28 | Review of in-tunnel air quality
An extended analysis of the 11-tunnel Hong Kong study (Chow and Chan 2003) found negative correlations between all CO concentrations normalised by AADT and the fraction of HDVs, as may be expected due to the dominance of petrol cars in terms of CO emission. This is further illus-trated by comparison of the Tate’s Cairn and Tai Lam tunnels in Hong Kong (see Table 4.3). Both tunnels are approximately the same length (3900 m). The traffic flow in the Tate’s Cairn tunnel is 50% higher than the Tai Lam, but the mean CO concentration in the Tate’s Cairn tunnel was 3.5 times higher than the Tai Lam at both peak and off-peak periods. The key difference between these two tunnels is the fleet composition, related to the tunnel destinations. The Tai Lam tunnel is principally used to connect Hong Kong with mainland China and 19% of the traffic is made up of HDVs. The Tate’s Cairn tunnel links central Hong Kong with outlying suburbs and carries only 6% HDVs and presumably more LDVs. The larger proportion of petrol vehicles in the Tate’s Cairn tunnel is proposed as the principal reason for its much higher CO concentrations.
A further potential influence on vehicle emissions is the quality of fuel, including its sulfur content. It has been suggested that much of the southbound traffic in the Tai Lam tunnel was fuelled in mainland China, where fuel can be of a lower quality (eg diesel with < 2000 ppm sulfur, compared to < 50 ppm in Hong Kong). This is explored in more detail in Section 4.4.
tAble 4.3 factors influencing carbon monoxide concentrations in two similar tunnels in Hong kong
tate’s cairn tunnel tai lam tunnel
Length 3900 m 3900 m
ventilation Longitudinal Semitransverse
annual average daily traffic 67 000 45 000
Cars per day 38 000 21 000
HDvs per day 4 000 8 600
average off-peak Co (ppm) 21 6
average peak Co (ppm) 28 8
Co = carbon monoxide; HDv = heavy goods vehicle
Source: transect studies by Chow and Chan (2003)
4.2.11 inFLUenCe oF RoaD gRaDientS on eMiSSionS
The influence of gradient can be considered by comparing fixed-point measurements made in both tubes of the same tunnel if they have a consistent gradient. Such measurements (11 one-hour samples in June 1992) of gaseous pollutants were made in both bores of the Fort McHenry tunnel (Baltimore, USA) in 1992. The reported emission factors in the uphill tube (gradients from 0 to +3.6%, average 3.3%) were approximately double those in the downhill tube (0 to –3.76%, average –1.8%). Emission factors were slightly higher for HDVs compared to LDVs, but nonmethane hydrocarbons are almost double in HDVs as compared to LDVs. However, Sagebiel et al (1996) made the following comments warning about this interpretation of the Fort McHenry tunnel measurements:
The per cent uncertainties in the uphill section are much greater than in the downhill, due to the difficulty in the hydrocarbon measurements. The uphill measurement required that we subtract the mid-tunnel concentration (already a high value) from the exit portal concentration (also a high value), taking into account dilution from the supply air. In some low traffic runs the concentration at mid-tunnel was actually greater than at the exit portal, the latter having been diluted by the supply air. This condition caused greater uncertainty in the uphill measurements.
Longer-term measurements over four months, including particulate and gaseous measurements, were made in two tubes in winter 2003 in the Shing Mun tunnel (HKPU 2005). There is a 1% gradient so that the south tube is uphill and the north tube is downhill. The ratios of emission

aiR QUaLitY in anD aRoUnD tRaFFiC tUnneLS
Review of in-tunnel air quality | 29
factors for the uphill and downhill tubes were approximately 2 for PM2.5
, 1.6 for CO, 2.5 for NOx
and 3.2 for SO2. Mean concentrations of CO were 4.31 mg m–3 (3.7 ppm) in the south tube and
2.42 mg m–3 (2.1 ppm) in the north tube. Similarly, mean concentrations for PM2.5
were 288.5 μg m–3 in the south tube and 151.3 μg m–3 in the north tube.
The effect of road gradient on emission factors for NOx in Europe was calculated and compared
from three tunnels: Lundby (Gothenburg, Sweden), Plabutsch (Graz, Austria) and Gubrist (Zurich, Switzerland)) by Colberg et al (2005). The gradients were –2.7% and +0.6% (Lundby), –1.0% (Plabutsch) and +1.3% (Gubrist). In general the emission factors increased with gradient, but as with the American studies the influence was stronger for HDVs.
4.2.12 LinK BetWeen tRaFFiC SpeeD anD eMiSSionS oF Co anD pM
Vehicle emission factors (mass of pollutant emitted per kilometre driven) depend on vehicle speed. The dependence varies between vehicles, but extensive research has derived generic relationships between speed, vehicle and engine type for the key pollutants.
The relationship between speed and CO emissions can be broadly characterised by large increases at lower speeds. For example, a reduction in speed from 80 km h–1 to 40 km h–1 for a typically mixed fleet of petrol and diesel-powered vehicles, light and heavy-duty vehicles, could lead to an increase in per kilometre CO emission of one third (based on the UK National Emissions Database (2004 data).
Actual measurements of the dependence of PM emissions on speed were carried out in the Sepulveda tunnel in Los Angeles in 1996 (Gillies et al 2001), with average vehicle speeds during a sampling period being captured with a radar gun. A wide range in average speeds was observed from 30 to 81 km h–1. Data were split between those sampling periods in which the average speed was less than 64 km h–1 and those in which it was greater. PM
10 emissions per kilometre were 20%
higher in the low speed class compared to the high speed. PM10 emissions per km at an average
speed of 42.6 km h–1 were 70% higher than at 72.6 km h–1. PM2.5
emissions were unchanged.
Further details of the influence of speed on emissions of particulates from individual test vehicles are provided in Section 4.4.
4.2.13 ReLationSHip BetWeen Mean anD MaxiMUM ConCentRationS
Each average concentration reported from a transect study is the average of the multiple drives through each tunnel. In the study by Chow and Chan (2003), 22 individual transects were carried out for 11 tunnels. The ratio of the maximum CO concentration of all these drives to the average for each tunnel was high for the very busy Cross Harbour tunnel (2.4 in nonpeak periods and 2.9 during peak traffic flow). Excluding this result, the ratio for the other 10 tunnels varied from 1 to 2 (average 1.5 nonpeak and 1.4 peak). However, it should be noted that 24-hour averages obscure the high pollution during peak periods when health impacts are more likely to be experienced.
4.2.14 inFLUenCe oF nUMBeR oF LaneS
The number of lanes a tunnel has may influence in-tunnel concentrations, but in a way that is complex and difficult to assess. Most road tunnels have two lanes per bore (as indicated in Appendixes B and C) but a few have three, and a smaller number have more. Table 4.4 shows the distribution of tunnels by lane from a survey of 94 unidirectional tunnels more than 500 m long in France, Holland, the United Kingdom, California, Japan and Norway (OECD and PIARC 1998). It is clear that tunnels with extra lanes carry extra traffic, which implies higher total emissions. However, it can be argued that three lanes permit traffic to move faster, where as two lanes carrying the same volume causes the traffic to move slower, increasing pollution. Such is the case in the M5 East tunnel, a two-lane tunnel that carries in excess of 100 000 vehicles per day.
2 http://www.naei.org.uk

aiR QUaLitY in anD aRoUnD tRaFFiC tUnneLS
30 | Review of in-tunnel air quality
tAble 4.4 survey of 94 international tunnels as a function of the number of lanes
number of lanes number of tunnels Median daily traffic flow
2 60 25 000
3 21 63 000
4 9 152 000
Compensating for extra emissions, however, is the larger cross-sectional area and hence volume in which emissions can be diluted. We do not have sufficient data on cross-sectional areas to be able to quantify this effect. However, the extra diluting capacity of a tunnel with more than two lanes is also heavily dependent upon the airflow in the tunnel. Because of the complex balance between piston effect, pressure loss due to the curves, obstacles and gradients in the tunnel, and the operation of forced ventilation, it is not easy to isolate the effect of the number of lanes. This aspect of tunnel design requires further and careful investigation. Tunnel cross-section design can be influenced by factors such as cost and difficulty of disposing of soil, where excavation is required. This would appear to represent an exceptionally short-sighted view, considering the long-term implications for the cost and efficiency of ventilation.
4.2.15 oveRvieW oF Mean ConCentRationS oF Co anD pM
The key mean concentrations of CO for road tunnels reported in the literature are shown in Figures 4.3 and 4.4. These are plotted together, but it must be reiterated that the data cannot be intercompared in any simple way. These data are presented here only to provide an overview of the range of reported concentrations. The lowest is 2.1 ppm (Shing Mun tunnel) and the highest is 23.2 ppm (M5 East tunnel). The highest concentrations reported for single transects were 62 ppm for the Cross Harbour tunnel and 52 ppm for the Lion Rock tunnel (Chow and Chan 2003); note that there is serious concern about this dataset as it reports concentrations typically double the values reported by other studies in the same tunnels. However, it can be seen that all of these values are below the WHO 15-minute guideline of 90 ppm, as should be the case as these tunnels have ventilation systems designed specifically to keep CO concentrations below this level.
fiGure 4.3 Average off-peak daytime carbon monoxide concentrations measured from transect studies
0
10
20
30
40
50
60
Lion R
ock
Cross
Harbou
r
Easte
rn H
arbou
r
Cheun
g Tsin
g
Tai L
am
Tai L
am
Easte
rn H
arbou
r
Airpor
t
Shing
Mun
Cheun
g Tsin
g
Wes
tern H
arbou
r
Cross
Harbou
r
Tseu
ng W
an O
Aberd
een
Lion R
ock
Tate
Cairns
M5 East
am ea
st
M5 East
pm w
est
M5 East
pm ea
st
CO
/ p
pm
WHO 30 minute Guideline
Source: Grey from Chan et al (2002), black from Chow and Chan (2003), white from SESPHU (2003)

aiR QUaLitY in anD aRoUnD tRaFFiC tUnneLS
Review of in-tunnel air quality | 31
fiGure 4.4 Average 24-hour carbon monoxide concentrations measured from long- or medium-term fixed-point studies
0
10
20
30
40
50
60
Sode
rleds
wint
er 93
Sode
rleds
summer
94
Sode
rleds
wint
er 99
Klarat
unne
l N 96
Klarat
unne
l S 96
Craeyb
eckx
91
Shing
Mun
S 03
Tseu
ng W
an O
03
Shing
Mun
N 04
Shing
Mun
S 04
Tseu
ng W
an O
04
Hoyan
ger 9
4
Hoyan
ger 9
5
CO
/ pp
m
WHO 30 minute GuidelineWHO 30 minute Guideline
Source: De Fré et al 1994, SEHA 1995, Westerlund and Johansson 1997, HKPU 2005, Indrehus and Aralt 2005
Data on PM10 concentrations in road tunnels appear to be scarce. Figure 4.5 below summarises the mean concentrations identified in the literature. The high values for the Oslo tunnels are because these measurements were made at exit portals, and therefore are closer to the maximum than the mean concentration in the tunnel. Also, they will be strongly influenced by the use of studded tyres which cause excess road dust emission. The values for PM2.5 are illustrated in Figure 4.6. It appears that values of PM2.5 generally fall between 100 and 300 μg m–3. The Gubristtunnel measurements were made at the end of the tunnel in 1993 and we should expect current-day average concentrations in this tunnel to be lower due to reductions in emissions per vehicle. Where HDVs are not present (as in the case of Caldecott Bore 2) concentrations can be less than half this range. In the M5 East tunnel, due to the peculiar design of the ventilation system, which recycles vitiated air from one tunnel to the other, the mean PM
10 level westbound is approximately half the stack
figure and eastbound is two-thirds of the stack figure (1000 μg m–3 PM10 at the stack represents a trip average of 500 μg m–3 westbound and 650 μg m–3 eastbound). The high values for transect studies will be discussed further below. The guidelines for PM10 and PM2.5 relate to annual and 24-hour exposure and are therefore not relevant.

aiR QUaLitY in anD aRoUnD tRaFFiC tUnneLS
32 | Review of in-tunnel air quality
fiGure 4.5 Mean PM10 concentrations in a range of tunnels
241172172
1004
248
55
245
12868 37 16
258
423
0
200
400
600
800
1000
1200
Valere
nga s
outh
Valere
nga n
orth
Ekeb
erg e
ast
Ekeb
erg w
est
Bryn
south
west
Bryn
north
east
Storo
north
Storo
north
Storo
south
Tuho
bic
Kaise
rmuh
len
Van N
uys
Caldec
ott B
ore 1
Caldec
ott B
ore 2
Sepu
lveda
Cross
Harbou
r, Lion
Roc
k
Tunnel
Mea
n PM
10 c
once
ntra
tion
(g
m-3)
55
248
1004
Black = tunnel portals in oslo; grey = fixed point, 24 hour ; hatched = fixed point, daytime only; white = transect (bus, windows open)
Source: Fraser et al 1998, Gillies et al 2001, Tonnesen 2001, Lashober et al 2004, Beslic et al 2005, Geller et al 2005, Mui and Shek 2005
fiGure 4.6 Mean PM2.5 concentrations in a range of tunnels
202
388
300
194 196
278
105
164
116133
55
102
32
0
50
100
150
200
250
300
350
400
450
Gubris
t
M5 east
(Main
line)
Shing
Mun
south
Shing
Mun
north
Tseu
ng W
an O
Shing
Mun
south
Shing
Mun
north
Tseu
ng W
an O
Söde
rleds
Caldec
ott B
ore 1
Caldec
ott B
ore 2
Caldec
ott B
ore 1
Caldec
ott B
ore 2
Tunnel
Mea
n PM
2.5 c
once
ntra
tion
(g
m-3)
Black = tunnel portals; grey = fixed point, 24 hour ; hatched = fixed point, daytime only; white = transect (windows open)
Source: Johansson et al 1996, Weingarter et al 1997, Kirchstetter et al 1999, Allen et al 2001, SEPSHU 2003, HKPU 2005, Cheng et al 2006
PM can be measured by different methods which may yield different results. The M5 East value (388) in Figure 4.6 was measured using a Dustrak monitor. Dustrak monitors, when not gravimetrically calibrated, have been found to over read PM
10 levels by a factor of 2.2 (Heal et al
2000). Calibration against gravimetric methods suggests the figure would be ~200 μg m–3.

aiR QUaLitY in anD aRoUnD tRaFFiC tUnneLS
Review of in-tunnel air quality | 33
4.3 oxides of nitroGen And ozone
4.3.1 SoURCeS anD eMiSSion ContRoL oF no2
NO and NO2 (together considered as NO
x) are derived from combination of the two major
components of air (N and O) in the high temperatures of internal combustion engines. Most NOx is
emitted as NO, which then indirectly forms NO2 through reaction with O3 on a timescale of seconds:
NO + O3 → NO
2 + O
2
NO can also be oxidised to NO2 through the free radical-catalysed oxidation of VOCs:
NO + XO2 → NO
2 + X
O
These indirect links between emission of NO and concentrations of NO2 are crucial because the
formation of most of the NO2 from vehicle exhausts requires an oxidant—either O
3 or free radicals
in the presence of VOCs. Ozone entering a tunnel will be rapidly depleted. There is no shortage of VOCs in vehicle exhaust, but free radicals are largely produced by photochemical mechanisms and have a very short atmospheric lifetime. Thus, they are unlikely to be entrained very deeply into a tunnel, or generated photochemically within the tunnel. Alternative mechanisms exist, but the presence and activity of free radicals in road tunnels is unknown. The consequence is that the level of NO
2 in a tunnel is limited by the availability of oxidants from the outside air. Tunnel
length and ventilation scheme become the crucial variables.
If concentrations of NOx are sufficiently high (~2 ppm) then a secondary (termolecular) reaction
with oxygen becomes significant:
2 NO + O2 → 2 NO
2
This reaction is second order with respect to NO and thus leads to rapid NO2 production
when NO is high. In theory, this might occur in longer tunnels or when airflow in the tunnel is insufficient to dilute NO emissions, and is another reason why NO
2 is likely to be higher near the
tunnel exit. In many tunnels, ventilation is provided by the movement of the vehicles themselves, so in congested conditions NO
x emission is higher and the airflow is reduced, leading to a ‘worst-
case’ scenario for NO2. The probability of this occurring is discussed further below.
Controlling NO and NO2 emissions has been more challenging than controlling CO and PM.
Emissions of NO per vehicle are falling, but not as rapidly as for CO. Also, recent reductions in vehicle NO emissions have had the unfortunate side effect of increasing direct NO
2 emissions
(Carslaw 2005). Hence, there is some uncertainty in the long-term trends in NO2 concentrations in
O3-limited locations such as tunnels.
Annual mean urban background concentrations tend to be in the range 20–40 ppb in cities with high car ownership (Europe, North America, Australasia), and slightly higher in the megacities of East Asia (plus Los Angeles); however, the problem of NO
2 is largely isolated to Europe. Stack
emissions of NOx, NO and NO
2 in the M5 East tunnel have been monitored since the tunnel
opened. Although there have been some reliability problems with the monitoring equipment, there is much reliable data that show maximum summer levels between 200 and 300 ppb and winter levels between 250 and 500 ppb at the stack. This means that the conservative WHO one-hour goal is unlikely to ever be exceeded during a tunnel trip.
The true importance of NO2 levels in relation to the significance of PM should be given serious
consideration. The potential for harm appears to lie strongly on the side of PM.

aiR QUaLitY in anD aRoUnD tRaFFiC tUnneLS
34 | Review of in-tunnel air quality
4.3.2 eFFeCt oF ventiLation on nitRogen CHeMiStRY
The dependence of the transformation of NO to NO2 in the presence of O
3, or oxygen in extreme
cases, implies that the rate of ventilation plays a complex role additional to the simple dilution of pollutants. Shortly beyond the entrance to the tunnel, O
3 is entrained from the external air into
the tunnel, providing for an initial ozonation of NO. In the case of a longitudinal tunnel, the O3
will be rapidly depleted by this process so that the ozonation reaction becomes progressively less active along the tunnel length. Thus, a decreasing proportion of the emitted NO is converted into NO
2 by this reaction. However, the tunnel contains high concentrations of VOCs and this
provides a potential alternative conversion route from NO to NO2 via free-radical catalysed VOC
oxidation. Studies have shown that oxides of hydrogen can be produced in vehicle exhausts due to a thermal reaction between NO
2 and conjugated dienes that may be present in exhaust (Shi
and Harrison 1997). The reaction is relatively slow and this review did not uncover any studies of the action and strength of this reaction, or the presence of free radicals, in road tunnels. Even without this reaction we may still expect NO
2 to rise along the tunnel’s length due to its direct
emission, and a reduced rate of NO conversion due to the remaining O3, but the NO
2:NO
x ratio
will fall along the tunnel’s length (evidence provided in the following three sections). If the tunnel is long enough for oxidants to be largely depleted, then, in the absence of any NO
2 production
mechanism, the NO2:NO
x ratio should tend towards the average emission ratio in the vehicle
fleet. This ratio is of significant value in managing NO2 concentrations (see Chapter 7) and will
be referred to repeatedly in this section.
In the case of a semitransverse or transverse tunnel, fresh air and fresh O3 is being injected
along the length of the tunnel. In this case, new oxidants are entering the tunnel at all points and will not be so rapidly depleted. In principle, this allows a greater rate of ozonation, leading to potentially higher NO
2 concentrations and a higher NO
2:NO
x ratio. In practice, however, the
variation of NO, NO2 and O
3 along the tunnel length is hard to predict due to:
variations in external levels of O•3
variations in ventilation rates•
varying degrees of entrainment of air through the entrance•
other reactions and processes, such as reactions with free radicals.•
The activation of the termolecular oxygenation of NO has been cited to explain severe NO2
episodes in ambient air (eg the London smog episode of December 1991 in Bower et al 1994) but its occurrence in road tunnels may be rare, and is probably limited to very long or poorly ventilated tunnels. However, its true prevalence is unknown due to the fact that NO
2 is rarely
monitored in tunnels.
4.3.3 oBSeRvationS oF no2 in a SiMpLe URBan tUnneL
Transects of NO2, NO
x and CO were conducted (three each way) in winter 1993 and summer
1994 in the Söderledstunnel, Stockholm (1.5 km long, naturally ventilated in most cases, moderate – high traffic flow) (SEHA 1994, 1995). Peak concentrations of NO
2 of about 150 ppb (winter
1993) and 195 ppb (summer 1994) were found near the tunnel exit, corresponding to maximum NO
x concentrations of 2.4 ppm and 2.8 ppm respectively, and CO concentrations of 20 ppm and
31 ppm, respectively (Figure 4.23). These results suggest a NO2:NO
x ratio of about 6% at the most
polluted section. There was a fairly steady rise in NO2 concentration with depth that was not
significantly different from the profile of CO or NOx. This indicates that the rate of oxidation did
not significantly vary along the tunnel length.

aiR QUaLitY in anD aRoUnD tRaFFiC tUnneLS
Review of in-tunnel air quality | 35
4.3.4 DetaiLeD oBSeRvationS oF nitRogen CHeMiStRY FRoM tWo Long tUnneLS
Five transects of NO, NO2 and O
3 were measured in the Tai Lam (northbound and southbound)
and Tate’s Cairn tunnels between September 2004 and May 2005 (Yao et al 2005). Both tunnels are nearly 4 km long, but differ in several crucial ways (see Section 4.2.10 and Table 4.3). The Tai Lam tunnel has lower traffic overall, but a larger proportion of HDVs, including vehicles originating or fuelled in mainland China.
In each transect, concentration of NO peaked in the second half of the tunnel, with maximum concentrations of around 1 ppm in the Tai Lam northbound, and approaching 3 ppm in the other tunnels, which have higher emissions (Figure 4.7, left). Ozone was rapidly depleted with depth in all tunnels, although never reaching zero (Figure 4.7, right). The Tai Lam tunnel is semitransverse so it is possible that fresh O
3-laden air is injected along the tunnel’s length. The
data appear to show lower concentrations of O3 in the first half of the Tai Lam tunnel compared
to Tate’s Cairn, although concentrations increase over the second half. As well as fresh O3 input
from the ventilation system, the increase in O3 towards the end of the tunnel may also be due
to entrainment. The concentration of O3 in the Tate’s Cairn tunnel does not recover in this way,
except in the final 800 m or so.
As a result, NO2 was found to initially fall due to dilution of entrained air. Beyond about 1500 m
depth, direct emission and transformation of NO overcame the dilution and NO2 rose. In the
midsections NO and NO2 rose rapidly even though O
3 was at a minimum. These rises can be
attributed to accumulation of emissions and a low rate of oxidation. However, in the latter section of the tunnels, NO fell while NO
2 continued to rise, suggesting that conversion was progressing
faster than accumulation. This is partly explained by the slight rise in O3 in this section, but the
amount of O3 was insufficient to explain the size of the rise in NO
2. A secondary process must
have been acting to increase NO2 to this degree. Free-radical catalysed VOC oxidation is possible
(but no data were collected to indicate this), but the high concentrations of NO, especially in the Tate’s Cairn and Tai Lam southbound tunnels, does not rule out that direct reaction of NO with oxygen may have been significant in the final kilometre of these tunnels.
The maximum NO2 (over the five runs) in the Tai Lam southbound tunnel was 82 ppb, with
an average over the length of the tunnel of 52 ppb. This is a low value considering the corresponding maximum and mean NO
x concentrations (2720 ppb and 1331 ppb respectively),
representing very low NO2:NO
x ratios in this tunnel (a minimum of 2%). The low rate of NO
oxidation midtunnel suggests that the NO2:NO
x ratio in this section should resemble the ratio
of NO2 to NO
x in the vehicle exhaust. As mentioned above, NO
x emissions were higher in the
Tai Lam southbound tunnel as use of high-sulfur fuel is believed to be higher and emission standards generally lower on average in this tube. This will lead to higher direct NO emissions per vehicle, but not NO
2. In the Tai Lam northbound and the Tate’s Cairn tunnels, the NO
2:NO
x
ratio in the midsection was considerably higher (~6%), so that both tunnel mean and maximum NO
2 concentrations were higher (maxima of the order of 100 ppb in the Tai Lam northbound and
200 ppb in the higher-traffic Tate’s Cairn tunnel).

aiR QUaLitY in anD aRoUnD tRaFFiC tUnneLS
36 | Review of in-tunnel air quality
fiGure 4.7 transect profiles of no and no2 (left), and no2:nox and o3 (right) from the tate’s cairn and tai lam tunnels, Hong kong
4000
5000
3000
2000
1000
NO
2 (pp
b)2000
(b) Northbound in Tai Lam Tunnel
NO
(pp
b)
Distance, m
1000
-1000 0 1000 2000 3000 4000 50000 0
100
200
300
400
NO
Entrance Exit
NO2
NO
2 (pp
b)
(c) Southbound in Tai Lam Tunnel
NO
(pp
b)
Distance, m-1000 0 1000 2000 3000 4000 50000 0
100
200
300
400
NO
Entrance Exit
NO2
4000 (a) Tate’s Cairn Tunnel
NO
(pp
b)
NO
2 (pp
b)
Distance, m
3000
2000
1000
-1000 0 1000 2000 3000 4000 50000 0
100
200
300
400
NO
Entrance Exit
NO2
0.8(a) Tate’s Cairn Tunnel
Rat
io o
f NO
2 to
NO
x (pp
b)
O3 (
ppb)
Distance, m
0.6
0.4
0.2
-1000 0 1000 2000 3000 4000 50000 0
20
40
60
80
NO2/NOx
Entrance Exit
O3
0.8(b) Northbound in Tai Lam Tunnel
Rat
io o
f NO
2 to
NO
x (pp
b)
O3 (
ppb)
Distance, m
0.6
0.4
0.2
-1000 0 1000 2000 3000 4000 50000 0
20
40
60
80
NO2/NOx
Entrance Exit
O3
0.8(c) Southbound in Tai Lam Tunnel
Rat
io o
f NO
2 to
NO
x (p
pb)
O3 (
ppb)
Distance, m
0.6
0.4
0.2
-1000 0 1000 2000 3000 4000 50000 0
20
40
60
80
NO2/NOx
Entrance Exit
O3
Source: Yao et al (2005)
4.3.5 oBSeRvationS oF no anD no2 in tHe MoRe CoMpLex M5 eaSt tUnneL
At 4 km long, Sydney’s M5 East tunnel is similar in length to the Tai Lam and Tate’s Cairn tunnels but carries a greater volume of traffic. A simple linear relationship with depth along the tunnel is not expected in the M5 East due to its unusual ventilation layout (see Figure 3.2). Fresh air is injected and vitiated air removed near the midpoint of both tubes. Tunnel air is not released at any of the portals (some portal emissions have occurred, but not during this study, and are discussed in Chapters 5 and 7) as air is transferred from near the exit of one tube to near the entrance of the other, at both ends. The consequence is that one may expect a ‘sawtooth’ profile, with maximum concentrations recorded near the tunnel midpoint just before the air exhaust point.
Vehicle-exterior concentrations of NO and NO2 (but not O
3) were recorded from 160 transects (80
in each direction), in an intensive six day study in the M5 East tunnel in Sydney in March–April 2004 (Holmes Air Sciences 2005). Transects were restricted to three daytime periods (0600–0900, 1100–1200 and 1500–1800). Concentrations were reported as 30 second averages; with an average transit time of 5.2 minutes this typically provided about 10 data points per transect.
As expected, maximum concentrations of NO and NO2 were recorded on approach to the
exhaust points. Average concentrations of NO at the exhaust points were in the range 4–5 ppm (westbound) and 4 to just over 6 ppm (eastbound)—significantly higher than in the Tai Lam

aiR QUaLitY in anD aRoUnD tRaFFiC tUnneLS
Review of in-tunnel air quality | 37
and Tate’s Cairn tunnels (see Section 4.3.4 above). Average concentrations of NO2 at the exhaust
points were in the range 0.2–0.3 ppm (westbound) and 0.2–0.35 ppm (eastbound). Although there was significant random variation in profiles between transects on different days, on average the expected ‘sawtooth’ profile was observed in all three time periods in both eastbound and westbound tubes, although the pattern was slightly clearer in NO
2 than NO. Most of the data
presented were indicative of a NO2:NO
x ratio of 5–6%, with slightly higher values near the fresh
air entry points of the tunnel where concentrations are lower.
Thirty-four individual profiles were presented in the report. In general, NO frequently exceeded 4 ppm at one or several points along the transect, but rarely exceeded 8 ppm. NO
2 reached
~0.4 ppm at some point of the transect on 13 out of the 34 presented profiles, and significantly exceeded 0.4 ppm on 3 profiles. A maximum of ~0.8 ppm was recorded, which is discussed further in Section 4.7.1.
4.3.6 DetaiLeD oBSeRvationS oF nitRogen CHeMiStRY FRoM a Long natURaLLY ventiLateD tUnneL
One study that has investigated the extended probability of variations in NO oxidation along the length of a long tunnel is that of Indrehus and Vassbotn (2001). NO
2 and NO
x (as well as CO)
were measured in the 7.5 km Hoyanger tunnel in Norway for 20 days in spring 1994 and 25 days in spring 1995. Traffic flows are relatively low in this tunnel (means of 28.9 h–1 in 1994 and 18.9 h–1) and this meant that a bidirectional design was more economical. Ventilation is nominally naturally driven by the pressure differences associated with the portals being at different altitudes. The piston effect is negligible due to the low traffic travelling in opposing directions in the same tube. A longitudinal system is installed, to be triggered by CO concentrations exceeding a certain level. The NPRA decrees that road tunnels should be closed if the concentration of CO at the tunnel’s midlength exceeds 100 ppm for longer than 15 minutes (NPRA 2004). This rarely occurred in the Hoyanger tunnel, yet users regularly complained of poor visibility and foul odours. Unlike most relevant authorities worldwide, the NRPA has also set an in-tunnel pollution limit for NO
2,
of 0.75 ppm at the tunnel midpoint and 1.5 ppm at the tunnel ends. Like CO, if this limit is exceeded for more than 15 minutes, the tunnel should be closed. However, NO
2 was not routinely
monitored as CO monitoring is more reliable (see Chapter 7 below) and, to quote Indrehus and Vassbotn, ‘…the CO concentration has been assumed to be the main source of poor air quality.’
Their study set out to investigate if the NO2 guideline was being exceeded, and why, by installing
monitors in the tunnel 2 km from one end.
The monitoring revealed that the 1.5 ppm NO2 limit was exceeded 17% of the time in 1994 and
1.3% of the time in 1995. The difference may in part be due to the significant reduction in traffic in 1995 due to the construction of a new road, and will otherwise be due to random variation in ventilation cased by meteorology. The wind speed within the tunnel varied between 0 and 2 m s–1 in both directions (which may be compared with the values of 2–6 m s–1 in one consistent direction, typical in busy unidirectional urban tunnels). The highest NO
x values were all associated
with the lowest wind speeds. The NO2:NO
x ratio decreased with increasing NO
x up to a value
of ~1 ppm, consistent with a reduced conversion of NO to NO2 in an O
3-limited atmosphere.
Oxidation was at a minimum at 2 ppm of NOx. When airflow was generally less than 1 m s–1,
NOx often rose above 5 ppm despite the relatively low traffic flow, due to the lack of ventilation.
Above this level there was a clear increasing trend in NO2:NO
x ratio, indicating an extra source
of NO2, consistent with the activation of oxidation with oxygen. These high values had not been
observed by the control system, which only monitored CO. CO remained below its 100 ppm limit throughout (the maximum observed value was 58 ppm), so the tunnel had remained open despite NO
2 rising to a maximum of 5.87 ppm, far above its limit value. In this study, a rough calculation
showed that at an airflow of 0.5 m s–1, with 6 ppm of NO and an initial 1.5 ppm of NO2, the air
would remain in the tunnel for 4.1 hours before exiting, in which time oxidation of NO with oxygen would produce a further 1.3 ppm of NO
2 (ie nearly doubling the NO
2 concentration).

aiR QUaLitY in anD aRoUnD tRaFFiC tUnneLS
38 | Review of in-tunnel air quality
4.3.7 no2:nox Ratio anD tHe inFLUenCe oF tUnneL LengtH on Mean ConCentRationS
Various studies present a NO2:NO
x ratio. This ratio is of interest for the control of tunnel
ventilation as it allows the calculation of NO2 (which is difficult to measure reliably on a long-term
basis) from concentrations of NOx, which are relatively simple to calculate from emissions if traffic
data, emission factors and in-tunnel wind speed are known. This will allow the NO2 levels in a
tunnel to be controlled without having to install NO2 monitors. However, the NO
2:NO
x ratio is not
a constant, but varies with NOx (and hence traffic levels, emission, tunnel length, and ventilation
type and strength), as well as varying with depth into the tunnel.
Due to the number of variables and scarcity of data we cannot present a definitive survey of how the NO
2:NO
x ratio varies. However, we can surmise that over extended periods we may expect
the NO2:NO
x ratio to be close to the ambient value in short tunnels, decreasing as tunnel length
increases, albeit nonlinearly. The small amount of data available confirms this general picture. For tunnels with high levels of traffic, mean NO
x concentrations are generally related to tunnel
length (see Figure 4.8). Two exceptions not shown on this figure are the Shing Mun tunnel in Hong Kong where NO
x concentrations are considerably lower than suggested by the illustrated
relationship. This may be due to lower NOx emissions per vehicle in this study due to long-term
reduction programs. This study was conducted in 2003–04, whereas the other studies in this figure all date from the 1990s. The other exception is the Hoyanger tunnel where mean NO
x is lower
due to its substantially lower traffic levels.
fiGure 4.8 relationship between mean nox in a range of tunnels as a function of their length
0
500
1000
1500
2000
2500
3000
3500
4000
0 200 400 600 800 1000 1200 1400 1600 1800 2000
Tunnel length (m)
Mea
n N
Ox
leve
ls (
ppb)
The ratio of NO2 to NO
x is related to NO
x as shown in Figure 4.9. Generally the figure illustrates
the expected pattern described above. The effect of the ventilation system is unclear due to lack of data from semitransverse tunnels. The semitransverse tunnel with a ratio of ~0.15 is the Landy tunnel in Paris. This high ratio is unlikely to represent higher oxidation due to fresh air supply along the tunnel’s length, as the measurements were made at the tunnel exit portal. The other data point is from the Croix Rousse tunnel in Lyon, but the NO
x value is calculated from the
reported mean NO2:NO
x ratio. The higher ratios in the Hoyanger tunnel are related to the lower
ventilation rates and longer timescales, allowing further oxygenation of NO to occur. A relatively high ratio is also observed in the south (uphill) tube of the Shing Mun tunnel.

aiR QUaLitY in anD aRoUnD tRaFFiC tUnneLS
Review of in-tunnel air quality | 39
fiGure 4.9 dependence of the ratio of mean no2 to mean nox on nox for a range of road tunnels as a function of ventilation type
0
0.05
0.1
0.15
0.2
0.25
0.3longitudinalsemitransverseHoyangerShing Mun S
Mea
n N
O2
: NO
x ra
tio
Mean NOx (ppb)
0 500 1000 1500 2000 2500 3000 3500 4000
Finally, Figure 4.10, below, illustrates the relationship between mean NO2 and tunnel length for
urban tunnels with busy traffic. Despite the scatter we see a roughly linear relationship. For the longitudinally ventilated tunnels the relationship is approximately NO
2 (ppb) = 0.09 L, where L
is tunnel length in metres. There are only three semitransverse tunnel data points, two of which show relatively higher NO
2 concentrations for their length compared to the longitudinal tunnels.
These two tunnels are the Croix Rousse tunnel in Lyon and the Landy tunnel in Paris (portal measurement). Both of these tunnels suffer from chronic congestion.
fiGure 4.10 relationship between mean no2 and tunnel length for a range of urban tunnels as a function of ventilation type
0
50
100
150
200
250
300
350
Tunnel length (m)
Mea
n N
O2
(pp
b)
longitudinalsemitransverse
0 200 400 600 800 1000 1200 1400 1600 1800 2000

aiR QUaLitY in anD aRoUnD tRaFFiC tUnneLS
40 | Review of in-tunnel air quality
4.3.8 DiURnaL CYCLeS
Measurements in the northbound (city-bound) tube of the Söderledstunnel, Stockholm in the winter of 1995–96 (Johansson et al 1996) indicated clear diurnal cycles in NO
x and NO
2. NO
x at
a depth of 100 m is indicative of the traffic flow in the tube showing clear morning and evening peaks. At 1 km depth, NO
x concentrations are generally 3–4 times higher and exceed 1 ppm
most of the day. However, the morning peak is relatively much higher, peaking at over 3 ppm, probably due to the chronic morning congestion which develops backwards from the exit in this city-bound tube. The resulting diurnal average NO
2 at 100 m shows a night-time minimum
of around 25 ppb, rising to a daytime maximum of around 50 ppb. At the 100 m point there is no evidence of the morning and evening traffic peaks, showing that the majority of the extra emissions at this time remain as NO without significant oxidation to NO
2. At 1 km depth NO
2
concentrations are typically up to 50% higher than at 100 m (ie ~75 ppb in the daytime), a much smaller enhancement than for NO
x, due to reduced oxidation. However, there is a dramatic
increase in NO2 in the morning congestion peak with NO
2 reaching 150 ppb, although this is in
proportion with the increase in NOx, and there is no compelling evidence of increased oxidation
in this period.
Holmes Air Sciences (2005) report data from a campaign in which NO and NO2 were measured
continuously for 39 days in March–April 2004 in Sydney’s M5 East tunnel. Measurements were made using an open path ultraviolet monitor (OPSIS R600 DOAS) located near in-tunnel monitor CP2. This monitor is located near the westbound exit portal, which was considered likely to record the highest concentrations of NO
2 in the tunnel due to the gradient of the exit ramp. Clear
and consistent diurnal patterns were observed matching traffic flows. Weekday concentrations were higher than weekends, despite similar traffic volumes, however heavy-duty vehicle flows were higher on weekdays. The daytime ratio of NO
2 to NO derived from this instrument was
typically ~5% (most values within 3–7%). At night some higher values were found, consistent with lower emissions and a lower likelihood of oxidant depletion. In total, a maximum of 2% of values were above 10% and all values were below 20%.
effect of traffic fleet composition
Figure 4.11 shows data from the Washburn tunnel in Houston showing how NOx emission from
the traffic fleet in the tunnel is positively related to the presence of diesel vehicles.
fiGure 4.11 nitrogen oxide emission factors versus diesel contribution to total carbon emissions in the washburn tunnel
% of carbon from diesels
y = 24x + 11R2 = 0.40
0% 25%5% 10% 15% 20%
NOx Emissions
20
18
16
0
4
6
8
10
12
14
2Emis
sion
inde
x (g
per
kg
C in
fuel
)
Source: McGaughey et al (2004)

aiR QUaLitY in anD aRoUnD tRaFFiC tUnneLS
Review of in-tunnel air quality | 41
The transect study of the M5 East tunnel (Holmes Air Sciences 2005) found that average NO2
concentrations external to a vehicle during 60 eastbound tunnel transits were higher in the midday period than in the morning or afternoon. Total traffic count was lower in the midday than morning or afternoon periods, but counts of long vehicles peaked in this midday period (5.8%), and the long vehicle count and average NO
2 (R2 = 0.96) and NO (R2 = 0.86) concentrations were
strongly correlated. In the westbound transits, long vehicle counts also peaked in the midday period (5.8% also), and midday NO
2 was higher than in the morning, but overall NO
2 peaked
in the afternoon. This could quite likely be due to the considerable effect of congestion in the westbound tube in the afternoon (discussed further in Section 4.7).
relationship between mean and maximum concentrations
As shown in Figure 4.12 below, maximum NO2 concentrations observed in road tunnels are
generally at least double the mean.
fiGure 4.12 relationship between maximum and mean nitrogen dioxide concentrations measured at fixed points in road tunnels
0
200
400
600
800
1000
1200
0 50 100 150 200 250 300
Mean NO2 (ppb)
Max
imum
NO
2 (p
pb)
longitudinalsemitransverse2 to 1
4.3.9 oveRvieW oF Mean ConCentRationS
Figure 4.13 below compiles the mean NO2 concentrations observed in road tunnels in the
literature. Not shown are the exceptionally long tunnels (Hoyanger tunnel, 7.5 km, 730 ppb in spring 1994, 220 ppb in spring 1995; Mont Blanc tunnel, 11.6 km, 500 ppb). As discussed above, tunnel length, ventilation, traffic volume and congestion play major roles in determining the concentrations. In summary, however, most concentrations are in the range 50–150 ppb with high emissions or congestion raising concentrations towards 300 ppb.
The WHO guideline for NO2 applies to an averaging period of one hour and is therefore
considered inappropriate for comparison. However, other guidelines exist, such as the Hong Kong Labor Dept occupational exposure limit of 5 ppm in 15 minutes. In most cases it appears that this limit is unlikely to be breached.

aiR QUaLitY in anD aRoUnD tRaFFiC tUnneLS
42 | Review of in-tunnel air quality
fiGure 4.13 Mean nitrogen dioxide concentrations in a range of tunnels
236
81
290
52 4763
206
84 88
157
95
206
107
147125
150
58 60
210 207
0
50
100
150
200
250
300
350
Land
y
Saint
-Clou
d
Croix
Rous
se
Tingst
ad
Gnistan
g
Ambrois
e Pare
Craeyb
eckx
Tseu
ng W
an O
summer
Tseu
ng W
an O
wint
er
Shing
Mun
S su
mmer
Shing
Mun
N su
mmer
Shing
Mun
S wint
er
Shing
Mun
N w
inter
Söde
rleds
93
Söde
rleds
94
Söde
rleds
96
Klarat
unne
l N
Klarat
unne
l S
M5 East
M5 East
Mea
n N
O2
conc
entr
atio
n (p
pb)
Tunnel
Black = long-term fixed point; white = transect (windows open)
Source: De Fré et al 1994, Johansson et al 1996, Westerlund and Johansson 1997, PIARC 2000, SEPSHU 2003’ Brousse et al 2005, Gidhagen et al 2005, HKPU 2005, Homes 2005
Ozone is rapidly depleted in a road tunnel due to its fast reaction with the abundant levels of NO and consequently has rarely been measured in road tunnels. The transects from the Tai Lam and Tate’s Cairns tunnels in Figure 4.7, above, show that concentrations of O
3 inside the
tunnels is considerably lower than that outside the tunnels. Minimum concentrations appear to be approximately 4 ppb in the Tai Lam tunnel and 6 ppb in the Tate’s Cairn tunnel.
4.4 PArticulAte MAtter—sPeciAl considerAtions
4.4.1 ReSUSpenSion anD veHiCLe WeaR pRoDUCtS
Measurements of PM10 are dependant on the presence of a relatively small number of coarse
or supermicron particles. These particles exist in very low numbers in ambient air relative to finer particles, but their large size means that they make a substantial contribution to the mass of particles in a given volume. Smaller particles can remain suspended in the air because the turbulence in the atmosphere is sufficient to overcome the action of gravity. Particles of greater mass are heavier and thus are more likely to form a sediment on the surface. They therefore have shorter atmospheric residence times and shorter atmospheric transport distances.
The main source of these particles in the atmosphere is the resuspension of particles off the surface by the action of wind, turbulence or mechanical contact. In the case of road particles, resuspension from the road surface by highly localised turbulent gusts is induced by vehicle motion and direct frictional contact between tyres and the road. Further sources include direct emission of tyre wear and brake wear products that can be localised in areas of braking, acceleration and curves. These processes produce an increased PM
10 level that exists only in
a narrow band alongside the road. The internal surfaces of vehicles will also be covered in resuspendible particles. In general, if there is no airflow in the cabin, these particles will remain on surfaces. Airflow from the vehicle ventilation system may resuspend a few particles, but open windows are likely to resuspend a lot more.

aiR QUaLitY in anD aRoUnD tRaFFiC tUnneLS
Review of in-tunnel air quality | 43
Online analysis of a random sample of individual particles can be performed using an aerosol time-of-flight mass spectrometer (ATOFMS). This instrument provides particle size information from time of flight between two fixed lasers before desorption, ionisation and analysis of the resulting positive and negative mass spectra. Such an instrument has been deployed in the Caldecott tunnel (Gross et al 2000) where 11% (or 18% in the LDV-only bore) of the sampled particles had mass spectra dominated by inorganic ions and were related almost exclusively to particles with an aerodynamic diameter > 1 μm; especially large signals for barium were observed. The authors were unable to discount a high sensitivity of the instrument to barium to account for this, but noted that barium has many roles in the automotive industry, including fuel synthesis, lubricating oil and brake pads.
4.4.2 Fine anD ULtRaFine paRtiCLeS
The remainder of PM10 can be characterised as either fine particles or ultrafine particles and
include nanoparticles. The fine particles (roughly of diameter 0.1–1 μm) are composed of both fresh and recent primary emissions, and aged particles generally not emitted in the locality in which they are found. Theoretically, one billion PM 0.01 μm are equivalent by weight to one PM
10
but have 1000 times the surface area. Locally emitted VOCs may condense onto, or be adsorbed onto the solid surfaces of these particles, or absorbed into liquid or liquid-coated fine particles, thus increasing the particle mass and volume.
The ultrafine particles are mostly freshly emitted particles from vehicle exhausts and from the nucleation and condensation of hot vapours as they cool. Their small size (roughly 10–100 nm) allows them to penetrate deeply in the lung, with the possibility of translocation to the cardiovascular system. Their effect on the body is still an area of research (more detail of the effects of particles on health is provided in Chapter 6). Despite the fact that ultrafine particles are by far the most numerous particles in urban air and near traffic, their small size also means that they possess very little mass, and contribute much less to PM10 or PM2.5 than their numerical abundance might suggest; thus, these mass-based metrics may under-represent the toxicity of PM.
4.4.3 LaBoRatoRY StUDieS on tHe inteRaCtion oF FUeL SULFUR Content, DRiving CYCLe anD engine teCHnoLogY on paRtiCULate eMiSSionS
Development of emission reduction technologies has depended on concurrent improvements in fuel quality, particularly in fuel sulfur content. Vehicles running on low-sulfur fuel also have lower air pollution costs, although these benefits are small in comparison to the benefits achieved from tighter vehicle emission standards. European data also indicate that moving from low-sulfur diesel to ultra-low sulfur fuel leads to lower air pollution costs (although the benefits are not as great as moving from conventional to low-sulfur fuels). However, Australian test data on the benefits of ultra-low sulfur fuel over low-sulfur fuel show mixed results (Watkiss 2002). Minimising emissions is complicated by the variations in fuel sulfur content and by the desire to reduce emissions over the full range of driving conditions and loads. Several studies have attempted to investigate how these factors interact, but have been hampered by the difficulties of:
acquiring the huge amount of data required to cover the full range of influencing variables•
adopting representative driving cycles •
measuring the full range of particulate emissions, which includes rapidly evolving and •
interacting components.
Removal of sulfur removes the lubricant from the fuel—producing greater wear on the engine. Lubricants not specified when added to the fuel may offset benefits. The type of lubricant needed must also be mandated.
One large European study involving 21 partners was designed to develop agreed laboratory test protocols to maximise the amount of intercomparable data. The PARTICULATES study, funded

aiR QUaLitY in anD aRoUnD tRaFFiC tUnneLS
44 | Review of in-tunnel air quality
by the European Community, reported in 2005 (Samaras et al 2005). A total of 8 diesel fuels and 3 petrol fuels, 25 cars and 10 trucks were tested, with a comprehensive measurement and characterisation of exhaust emissions, including total mass emission rates, total particle number emissions, number size distributions (total and solid) and PAH emission. Multiple driving cycles were tested, including motorway cycles.
As noted above, HDVs dominate particle emissions. Recent Australian vehicle standards have required new HDVs to meet an equivalent to the Euro III standard from 2003 (Australian Design Rule [ADR] 80/00) and Euro IV from 2006 (ADR 80/01). The current national limit for diesel-fuel sulfur content is 50 ppm (since 1 January 2006), to be reduced to 10 ppm from 1 January 2009. The PARTICULATES study found that the effect of fuel sulfur was most strongly observed at high speed and temperature operation. Over the European steady-state cycle, which includes a significant portion of high speed operation, particulate mass emissions were reduced on the low-sulfur fuels. For nonfiltered vehicles, the size of the reduction was generally significant but small, whereas for vehicles with diesel particulate filters, the reduction was dramatic. The evident cause of this difference was that reductions in fuel sulfur reduced emission of nucleation mode particles smaller than 30 nm, whereas the filters reduced particles of all sizes. The total number of particles < 30 nm for a Euro III truck was significantly higher when operating on fuels with > 300 ppm sulfur than on low-sulfur fuels. For Euro IV and Euro V trucks, the number of these nucleation mode particles was more directly related to fuel sulfur content. This is consistent with the expectation that the nucleation mode is dominated by sulfate particles. Vehicles with particle traps were shown to potentially reduce total solid particle numbers (principally accumulation mode soot) by three to four orders of magnitude when using ultra-low sulfur fuels. Other than the adoption of particulate traps, fuel sulfur was not found to influence the number of solid particles.
The report commented:
It is evident that Euro IV and Euro V engine technologies with advanced after-treatment systems operating on sulphur-free (10 ppm max) fuels should bring dramatic improvements in PM emissions. This represents a much larger step than the steps taken so far from Euro I to Euro III.
In Australia, the most recent vehicle emission standard for LDVs is ADR 79/01, which requires equivalence to Euro III from 2006. Petrol sulfur content was limited to 150 ppm from 2005. The PARTICULATES study found that particle emissions (mass, surface area, solid and total number concentrations) from Euro II and Euro III light-duty diesel vehicles, petrol vehicles and direct-injection petrol vehicles were all relatively insensitive to fuel sulfur content. However, the use of high-sulfur fuels did lead to the formation of a significant nucleation mode at high-speed driving in diesel cars. Results for some petrol vehicles at high speed revealed ‘diesel-like’ emission characteristics with high levels of particle mass surface area and total numbers; however, across the whole experiment the results were too variable to be conclusive. Diesel cars fitted with particulate filters operating on low-sulfur fuel emitted the least particle numbers of all the vehicles tested, including modern petrol cars. Strong nucleation mode emissions were observed from these filtered diesels if they were operating at high speed on high-sulfur fuels.
4.4.4 totaL paRtiCLe nUMBeR eMiSSionS anD ConCentRationS
Measuring the mass concentration of particles tends to bias measurements towards accumulation and coarse mode particles. However, total number concentrations will represent ultrafine particles much more strongly. Emission factors for particle numbers are much less well established than particle mass, and few studies have been conducted in tunnels. However, an opportunity to compare emission of particle numbers from LDVs and HDVs is provided by the Caldecott tunnel in California, where one of the two eastbound tubes is restricted to LDVs only. Kirchtetter et al (1999) calculated particle number emission factors from 1997 observations based on condensation particle counts (all particles above 10 nm in diameter; ie dominated by ultrafine particles) and optical particle counts (particles in the diameter range 0.1–2.0 μm; ie more representative of aggregated and processed particles). In both cases the emission factors were two orders of

aiR QUaLitY in anD aRoUnD tRaFFiC tUnneLS
Review of in-tunnel air quality | 45
magnitude greater for HDVs than for LDVs as a function of mass of fuel burned. Single-particle analysis by ATOFMS (Gross et al 2000) in the Caldecott tunnel revealed that HDVs emitted 48 times more particles in the size range ~0.1–3.0 μm.
Kirchtetter et al (1999) found that particle number concentrations were significantly higher (approximately double) in the mixed-fleet Bore 1 compared to the LDV-only Bore 2, despite the fact that Bore 2 carried 75% more vehicles in total. This result shows how a relatively small number of trucks make a large contribution to particle numbers. A similar effect was found seven years later in the same tunnel (Geller et al 2005), although the number concentrations as a whole had risen.
Number–size distributions of particles in a tunnel tend to show a peak in the ultrafine mode, as may be expected for an aerosol dominated by fresh exhaust emissions. Peaks were observed at 15–20 nm in the Caldecott tunnel (Geller et al 2005). Particles of this size are believed to principally arise from the condensation of organic vapours (from combustion, fuel or lubricating oil) onto soot, metallic or sulfuric acid nuclei. Secondary modes have sometimes been reported around 60 nm (Geller et al 2005), which can be attributed to soot agglomerations generally associated with diesel emissions. Several studies have noted an increase in particle number emissions from LDVs with vehicle speed (Gidhagen et al 2003, Geller et al 2005).
The total particle number concentrations for several tunnels are given in Figure 4.14.
fiGure 4.14 range of total particle number concentrations measured in road tunnels (year of observations given)
0
200
400
600
800
1000
1200
1400
Söderled99
CaldecottBore 1 99
CaldecottBore 2 99
Plabutsch01
GrandMare 02
Kingsway03
CaldecottBore 1 04
CaldecottBore 2 04
Mea
n N
_ 1
03 cm
-3
Tunnel
Box denotes full range (maximum to minimum), solid squares indicate mean.
Source: Kirchstetter et al 1999, Gourio et al 2004, Gidhagen et al 2005, Geller et al 2005, Imhof et al 2006
4.4.5 eLeMentaL CaRBon anD oRganiC CaRBon
As noted above, PM emitted from road vehicles is chemically dominated by carbonaceous compounds and elemental carbon (EC). Broadly, EC is associated with diesel emissions and organic carbon (OC) with petrol. EC is also associated with a reduction in visibility, but their relative toxicities are less clearly defined. Many toxicological studies have been conducted with diesel exhaust particles (see Chapter 6 for more detail), but such particles do not necessarily represent those found in the ambient atmosphere due to the adsorption of organic compounds onto EC agglomerates.

aiR QUaLitY in anD aRoUnD tRaFFiC tUnneLS
46 | Review of in-tunnel air quality
Several studies have measured the relative emission of elemental and organic carbon from vehicles in road tunnels as a means to quantify average emissions of the fleet in real-world conditions. In Europe, measurements were made in the Gubristtunnel, Zurich in 1993 (Weingartner et al 1997) and in the Kaisermuhlen tunnel in Vienna in 2002 (Laschober et al 2004). In the Gubristtunnel, PM
3 samples were analysed with ECs contributing 32% of the total PM
3 emissions from HDVs and
18% from LDVs. The sensitivity of EC in the tunnel to the fraction of HDVs was highlighted by the finding that HDVs emitted 77 times more EC per vehicle kilometre than LDVs (emission factors of 122 and 1.6 mg km–1 respectively). Nine years later, an emission factor for EC of 98.9 mg km–1 was found in the Kaisermuhlen tunnel. The authors noted that this was the lowest EC emission factor for HDVs yet reported, and this was described as a result of the success of emission reduction programs, although they also pointed out that the Kaisermuhlen tunnel is straight, level and has very smoothly flowing traffic. The LDV emission factor was much higher than the 1993 value, however, at 15.6 mg km–1. This was explained by the unusually high proportion of diesel-powered vehicles amongst the LDV fleet in this tunnel (39%). Overall, EC made up 58.8% of PM emissions, with organic compounds comprising 26.5%.
In the United States, data are reported from the Van Nuys tunnel (Los Angeles) in 1993 (Fraser et al 1998), the Sepulveda tunnel (Los Angeles) in 1996 (Gillies et al 2001) and the Caldecott tunnel (Oakland) in 1997 and 2004 (Kirchtetter et al 1999, Allen et al 2001, Geller et al 2005). These studies are not immediately directly comparable as some report mass emission per vehicle kilometre (or mile) while others report mass emission per kilogram of fuel burned. Fraser et al (1998) noted that EC accounted for 24% of all PM emissions, whereas OC accounted for 29% on a per litre of fuel basis. Gillies et al (2001) reported that PM2.5 emissions in the LDV-dominated Sepulveda tunnel were 48.5% EC and 31.0% OC on a per vehicle kilometre basis, despite the tunnel carrying a low level of HDVs (2.6%). The calculated EC emission factor was much higher than expected from dynamometer studies and the authors hypothesised that either a few smoky vehicles were having a disproportionate effect, or the emission factors for HDVs had been underestimated.
The Caldecott tunnel studies (with its LDV-only and mixed bore) allowed a closer investigation of the influence of HDVs. The second 1997 study (Allen et al 2001) reported much higher emission factors than either the Los Angeles or Zurich studies. EC emissions contributed 56% of PM
10 for
HDVs and 60% for LDVs per kilogram of fuel. HDVs were found to emit 32 times more EC per mass of fuel than LDVs, and 14 times more organic matter. Conventional measurements of EC and OC (offline thermal-optical analysis) were supplemented by single particle online analysis using an ATOFMS by Gross et al (2000). Sampling was conducted for three daytime hours on two days in the LDV-only bore and two days in the mixed-fleet bore, so the results can be viewed as indicative of the typical particle population in this tunnel. A total of 11.8% of the sampled particles in the mixed bore and 10.3% in the LDV-only bore, contained significant signals relating to carbon cluster ions, with almost no signal relating to other organic compounds; that is, these particles were EC. These particles were predominantly found at the lower end of the detectable size range of the ATOFM (0.2–0.4 μm aerodynamic diameter) in both bores.
The 2004 study further disaggregated emissions by making size-segregated measurements using two micro-orifice uniform deposit impactors, allowing the calculation of separate emission factors for the ultrafine, accumulation and coarse modes, although adsorption artefacts prevented a full analysis of the ultrafine mode. EC constituted 70.9% of PM10 emission from HDVs and 40.5% from LDVs per kilogram of fuel, a rise for HDVs and a fall for LDVs since 1997. For HDVs, EC represented 57% of the ultrafine mode (< 0.18 μm) mass, 100% of the accumulation mode mass and 88% of the coarse mode mass (2.5–10 μm). HDVs emitted 14.5 times more PM10 than LDVs.
Collated mean EC and OC concentrations measured within tunnels collated from the literature are indicated in Figure 4.15. These data are not strictly comparable because in some cases measurements were made midlength and in others at the tunnel exit; also, the upper size cut of particles, sampling method and analysis method are not identical. Nevertheless, the data are presented to provide an indication of the range of concentrations. Most of these studies report external concentrations, although in many cases these are at or near the tunnel entrances and still reflect a road influence. Figure 4.16 indicates the ratios of internal to external concentrations,

aiR QUaLitY in anD aRoUnD tRaFFiC tUnneLS
Review of in-tunnel air quality | 47
indicating values of 2.2–6.2 for OC and 7.5–21 for EC. Finally, Figure 4.17 presents the EC:OC ratio. Considering these three figures as a whole, we note the low EC signal in the American tunnels (Caldecott and Van Nuys) which also carry low HDV volumes. The highest values of both EC and OC are seen in the Chinese tunnels, which have high proportions of HDVs (33% for Shing Mun, 26% for Tseung Kwan O and 18% for Zhujiang).
f iGure 4.15 Mean concentrations of elemental carbon (ec) and organic carbon (oc) measured in a range of road tunnels
0
20
40
60
80
100
120
140
160
Caldec
ott 0
4 (LD
V only
)
Caldec
ott 9
9 (LD
V only
)
Van N
uys
Tseu
ng Kw
an O
Shing
Mun
Nor
th
Caldec
ott 9
9 (mixe
d)
Shing
Mun
South
Zhujian
g
Kaise
rmuh
len
Caldec
ott 0
4 (mixe
d)
Gubris
t
Mea
n co
ncen
trat
ion
(g
m-3)
ECOC
tunnel
Source: Weingarter et al 1997, Fraser et al 1998, Kirchstetter et al 1999, Lashober et al 2004, Geller et al 2005, HKPU 2005, Huang et al 2006
fiGure 4.16 ratios of mean elemental carbon (ec) and organic carbon (oc) concentrations between inside and outside a range of road tunnels
0
5
10
15
20
25
Caldec
ott 9
9 (LD
V only
)
Van N
uys
Tseu
ng Kw
an O
Shing
Mun
Nor
th
Caldec
ott 9
9 (mixe
d)
Shing
Mun
South
Zhujian
g
Kaise
rmuh
len
Rat
io o
f tun
nel:a
mbi
ent
conc
entr
atio
ns
ECOC
tunnel
Source: Fraser et al 1998, Kirchstetter et al 1999, Lashober et al 2004, HKPU 2005, Huang et al 2006

aiR QUaLitY in anD aRoUnD tRaFFiC tUnneLS
48 | Review of in-tunnel air quality
fiGure 4.17 Mean elemental carbon (ec) to organic carbon (oc) ratios measured in a range of road tunnels
0
0.5
1
1.5
2
2.5
Caldec
ott 0
4 (LD
V only
)
Caldec
ott 9
9 (LD
V only
)
Van N
uys
Tseu
ng Kw
an O
Shing
Mun
Nor
th
Caldec
ott 9
9 (mixe
d)
Shing
Mun
South
Zhujian
g
Kaise
rmuh
len
Caldec
ott 0
4 (mixe
d)
Mea
n EC
:OC
rat
io
tunnel
Source: Fraser et al 1998, Kirchstetter et al 1999, Lashober et al 2004, Geller et al 2005, HKPU 2005, Huang et al 2006
Analysis of the measurements in the Zhujiang tunnel in Guangzhou, China (Huang et al 2006) indicates that the most abundant EC-associated particles were larger than those generally seen elsewhere. American and European studies generally find median particle diameters at around 0.1 μm (Allen et al 2001), whereas this study reported a median diameter of 0.42 μm (ie in the accumulation mode). The authors argued that such large soot particles could not have arisen due to condensation of semivolatiles, but were largely emitted from tailpipes at that size. This was explained by the operation of diesel engines on a higher loading than is common elsewhere, plus lower quality engines and fuel, giving rise to preferential soot formation and accelerated agglomeration.
4.4.6 aeRoSoL tRanSFoRMation
Given the huge range in chemicals, solubility, particles size and shape it is not surprising that an aerosol (ie a suspension of PM) is a complex dynamic system. A road tunnel has unusually high concentrations of gases, vapours and other particles, plus a wide range of rapidly changing temperatures and humidities, and we must therefore expect that there are likely to be physical and chemical transformations within the aerosol. A key relevant transformation is the formation of aggregated fractal chains of EC (generally emitted from diesel engines) that can form at the upper end of the ultrafine mode size range, but can both form and grow well into the fine mode. Much of the growth of these chains is related to the adsorption of organic and other vapours onto the large surface of the chains. Other relevant transformations include coagulation of particles due to random collision, evaporation and deposition to surfaces. All of these processes have been extensively studied in the laboratory, in the ambient atmosphere, at roadsides and in street canyons. A few studies have been conducted in road tunnels, and these are reviewed below in terms of how they may affect human health.
The physical and chemical transformation of particles in an aerosol have been widely noted and investigated in the laboratory and in a range of ambient environments. In the context of road tunnels, the key issues are the adsorption of semivolatile material, especially organic compounds, onto the surface of soot aggregates and the absorption of organic compounds into

aiR QUaLitY in anD aRoUnD tRaFFiC tUnneLS
Review of in-tunnel air quality | 49
other pre-existing particles. Weingartner et al (1997) noted a change in shape in particles in the Gubristtunnel in Zurich to a more compact arrangement at higher concentrations. This tunnel is part of a city bypass that functions as both an important local road and a regional route. It has relatively high speed traffic (a posted speed limit of 100 km h–1) and a moderate proportion of HDVs (~12%). This leads to a relatively vigorous piston effect with airflows up to 9 m s–1. In this 3.3 km tunnel, typical air residence times are in the order of six minutes. The change of shape was indicated by the presence of a curvilinear relationship between particle surface area and PM
3 mass concentration at the tunnel exit, compared to a linear relationship at the entrance.
Effectively, surface area to mass ratios were lower at higher mass concentrations for air that had passed through the tunnel. The change in particle shape is consistent with an increased adsorption process as the availability of semivolatile material increased within the approximately six minute transit period.
One study focusing on solid particles (using an electrical low pressure impactor) in the Grand Mere tunnel (Rouen, France), found that their size distribution presented a single mode between 60 nm and 100 nm (Gouriou et al 2004). For particles in this size range, the main processes affecting their size distribution are growth by coagulation and deposition onto the available surfaces (Gidhagen et al 2003). These solid particles have been shown to have a relatively weak relationship with ambient conditions (Mathis et al 2005). Furthermore, Gouriou et al (2004) have shown that the particle number size distribution presents a similar shape along the length of a tunnel and only the total number concentration shows a variation that relates to the emissions in the tunnel.
On the other hand, studies including semivolatile particles usually report a bimodal particle size distribution with a primary mode in the nucleation size range (7–30 nm) and a secondary mode around 80–100 nm (Geller et al 2005, Imhof et al 2006). The nucleation mode particles include mainly volatile compounds and are probably the result of gas to particle conversion and condensational growth (Charron and Harrison 2003, Ning et al 2004). This nucleation mode has a stronger dependency on ambient conditions, and processes other than deposition and coagulation are thought to play a role in their behaviour (Gidhagen et al 2003, Imhof et al 2006). The secondary mode consists mainly of solid material (soot) and relates to the direct emissions from the vehicles (Gidhagen et al 2003).
A more detailed relationship between the solid and the volatile fractions of ultrafine particles is presented by Imhof et al (2006). These authors found that, for two tunnels with similar ventilation conditions but a different fleet composition (the Kingsway, Liverpool and the Plabutsch, Graz), the nucleation mode particles presented a notably different behaviour. In the Kingsway tunnel, with its low diesel fleet (7% HDVs) the nucleation mode particles showed a diurnal variation similar to the traffic intensity and to the soot-related particles. In the Plabutsch tunnel, with a larger fraction of diesel vehicles (18% HDVs + 39% diesel LDVs), the nucleation mode particles were much less abundant and their diurnal variation did not correlate strongly with the traffic intensity. The difference in the amount of diesel vehicles means that, for the low-diesel fleet, there was a relatively small soot mode, whereas for the high-diesel fleet the soot mode was about twice as large. This difference in the soot mode means that there was much more available surface area in the high-diesel fleet tunnel, acting as an increased sink for semivolatile compounds.Thus, instead of forming new particles (as in the case of the low-diesel fleet), these semivolatile compounds condense onto the available particles, effectively removing a source of nucleation mode particles. Imhof et al (2006) found that there is a threshold level for the soot mode below which it is not able to quench new particle formation and a nucleation mode is apparent. For soot mode concentrations above that threshold, new particle formation is inhibited and the nucleation mode is decreased.
In a vehicle-borne study that included transits of three similar Hong Kong tunnels, Yao et al (2007) found that the ratio of the volume concentration of fine particles (0.11–1.0 μm diameter) to the black carbon mass concentration correlated negatively with temperature. This indicates that at lower temperatures more semivolatile material has condensed into the particle phase and adsorbed onto the soot particles, leading to a larger amount of mass residing in larger particles.

aiR QUaLitY in anD aRoUnD tRaFFiC tUnneLS
50 | Review of in-tunnel air quality
For temperatures above 30°C, a unimodal volume size distribution was observed, with a modal diameter of the order of 0.2 μm. Below 20°C, bimodal distributions were observed, with an extra dominant mode at 0.5–0.7 μm. The ratio of volume to black carbon correlated positively with ambient particle volume concentration, derived from periods when the instrumented vehicle was not in tunnels and not in a vehicle-exhaust plume. This was cited as evidence that semivolatile material emitted in the tunnel was also condensing on particles generated outside the tunnel. These particles are generally larger than the soot particles emitted within the tunnels because they have already had time to age and collect condensed material. Thus the bimodal distributions observed could be the result of competition for condensation of semivolatiles onto smaller tunnel-originated soot particles and larger ambient-originated particles.
4.4.7 poLYCYCLiC aRoMatiC HYDRoCaRBonS
A key group of compounds present in PM from a health point of view is PAHs. PAHs arise during combustion as an intermediate in the formation of soot. Motor vehicles are a major source of PAHs in the urban atmosphere and were among the first compounds in the atmosphere to be identified as carcinogenic. Benzo(a)pyrene, in particular, has attracted the interest of researchers and has been more widely measured than other PAHs due to its especially carcinogenic potential. Other known carcinogenic PAHs include:
benzo(a)anthracene•
benzo(b)fluoranthene•
benzo(j)fluoranthene•
benzo(k)fluoranthene•
benzo(a)pyrene•
indeno(1,2,3-cd)pyrene•
dibenz(a,h)anthracene•
chrysene.•
A wide range of PAHs are found in vehicle exhaust including lower weight compounds in the gas phase, heavier weight in the particle phase (referred to as pPAH), and intermediate weight in both gas and particle phases. PAH exposure should be considered in terms of additive carcinogenic effects and increased risk of tumorigenisis in the presence of potentiators such as irritants. Miguel et al (1998) reported that gasoline-powered vehicles are a significant source of the higher molecular weight PAHs such as benzo(g,h,i)perylene, whereas diesel vehicles predominantly emit the lighter PAHs, such as fluoranthene and pyrene. PAHs can also be present in tunnel air due to their ambient concentrations, emissions from road bitumen and from tyres.
Several studies have measured PAHs in road tunnels, but reported only emission factors, not concentrations. Phenanthrene is regularly reported as a major compound from vehicle emissions in tunnels (eg Wingfors et al 2001, the Lundby tunnel, Gothenburg). In a 1998–99 study in the Söderledstunnel in Stockholm, Kristensson et al (2004) reported the dominant PAHs were phenanthrene and fluorene (mostly gas), pyrene and fluoranthene (mixed phase) and cyclopenta(c,d)pyrene in the particle phase. This study reported an emission factor for benzo(a)pyrene that was 15 times higher than that derived from dynamometer studies. A long-term study in two tunnels in Hong Kong (HKPU 2005) found that emission of gaseous PAHs was about 11 times higher than particulate PAHs. The five highest gaseous emission factors were for acenaphthene, naphthalene, acenaphthylene, phenanthrene and fluorene, and the five most abundant particulate PAHs emission factors were pyrene, fluoranthene, benzo(g,h,i)perylene, naphthalene and chrysene. Phenanthrene, fluorene, fluoranthene and pyrene were observed in diesel-fueled dominated source samples, whereas benzo(g,h,i)perylene was the most abundant particulate PAH in gasoline-fueled dominated samples. Of those PAHs mentioned above, phenanthrene, pyrene, acenaphthene, acenaphthylene, benzo(e)pyrene and benzo(g,h,i)perylene are believed to be noncarcinogenic.

aiR QUaLitY in anD aRoUnD tRaFFiC tUnneLS
Review of in-tunnel air quality | 51
The composition of a random sample of individual particles from road tunnel air was investigated over four days (three hours each) online using an ATOFMS by Gross et al (2000). Particles containing mass spectra representing PAHs were dominant (61.4% of the sampled particles in the LDV bore and 57.4% in the mixed-fleet bore). These PAH-containing particles were observed at all particle sizes. However, individual PAHs were more specific. In particular, the signal for 156 amu (probably dimethylnaphthalene) was almost absent in the LDV bore. In general, lighter PAHs were more prevalent in the bore containing HDVs, consistent with the findings of Miguel et al (1998).
A 2004 study in the Caldecott tunnel in California reported that the principle emitted compounds from LDVs were benzo(g,h,i)perylene and coronene in the accumulation and ultrafine modes, plus benzo(a)pyrene in the ultrafine mode (Phuleria et al 2006). For HDVs, the key compounds were fluoranthene, pyrene, and methyl-substituted PAH in both accumulation and ultrafine modes. In general, the emission factors from HDVs were much higher than LDVs. The HDV to LDV emission ratio was typically 10–20 for the heavier PAHs, but 40–80 for the lighter compounds. Thus, the emission of PAHs in general is sensitively dependent upon the number and emission quality of HDVs in the tunnel.
We identified four studies that actually report concentrations of PAHs in road tunnels. Some of the main data are presented in Table 4.5 and Figure 4.18. The difference between the north and south tubes of the Shing Mun tunnel is likely to be caused in part by the uphill gradient in the south tube.
tAble 4.5 studies reporting polycyclic aromatic hydrocarbon concentrations in road tunnels
Tunnel studydate of study
duration of study
tunnel length (m)
Measurement points
Mean benzo(a)pyrene concentration (ng m–3)
Caldecott Bore 1 phuleria et al (2006)
aug–Sept 2004 24 hours each
1100 entrance and exit
2.95
Caldecott Bore 2b phuleria et al (2006)
aug–Sept 2004 24 hours each
1100 entrance and exit
1.37
Craeybeckx De Fré et al (1994) Mar–apr 1991 11 days 1600 Unclear 9.6
Domain environment australia (2002)
Winter 2001 7 × 1 hour, 5 days
1600 exit 1a
Lundby Wingfors et al (2001)
apr 2000 < 16 hours 1220 entrance and exit
0.91
Shing Mun HKpU (2005) 2003–04 8 months 2600 in second half of tunnel
2.66 (north) 5.84 (south)
tseung Kwan o HKpU (2005) 2003–04 8 months 900 in second half of tunnel
11.75
a total paH (ie sum of gas and particle phase) b Caldecott Bore 2 is restricted to LDvs only

aiR QUaLitY in anD aRoUnD tRaFFiC tUnneLS
52 | Review of in-tunnel air quality
fiGure 4.18 concentrations of carcinogenic particle-bound polycyclic aromatic hydrocarbons in five tunnels
0
2
4
6
8
10
12
14
16
18
20
Benz
o(a)p
yrene
Benz
(a)an
thrac
ene
Benz
o(b)
fluor
anthe
ne
Benz
o(k)f
luoran
thene
Inden
o(1,2
,3-cd
)pyre
ne
Dibenz
(a,h)
anthr
acen
e
Chryse
ne
Con
cent
ratio
n (n
g m
-3)
LundbyCraeybeckxShing Mun northShing Mun southTseung Wan O
Carcinogen
Source: De Fre et al 1994, Brousse et al 2005, HKPU 2005
In general, concentrations of carcinogenic pPAHs were of the order 1–10 ng m–3 in most cases. Figure 4.19, below, highlights the most recent measurements from the Caldecott tunnel and the (cleaner) northbound Shing Mun tunnel. In general, levels of pPAHs are lower than in the other studies, with all but one concentration below 5 ng m–3. Without further data it is not possible to generalise on the causes of the variability.
fiGure 4.19 Mean concentrations of carcinogenic particle-bound polycyclic aromatic hydrocarbons in three tunnel studies conducted in 2003–04
0
1
2
3
4
5
6
7
Benz
o(a)p
yrene
Benz
(a)an
thrac
ene
Benz
o(b)
fluor
anthe
ne
Benz
o(k)f
luoran
thene
Inden
o(1,2
,3-cd
)pyre
ne
Dibenz
(a,h)
anthr
acen
e
Chryse
ne
Con
cent
ratio
n (n
g m
-3)
Shing Mun northCaldecott bore 1Caldecott bore 2
Carcinogen
Source: HKPU 2005, Phuleria et al 2006

aiR QUaLitY in anD aRoUnD tRaFFiC tUnneLS
Review of in-tunnel air quality | 53
4.5 otHer PollutAnts
4.5.1 SULFUR DioxiDe
Measurements of SO2 concentrations appear to be very scarce in the literature. The only data
found are summarised in Table 4.6. The short-term WHO guideline for SO2 is 500 μg m–3 over a
10-minute period (WHO 2005).
tAble 4.6 sulfur dioxide data from inside road tunnels
tunnel craeybeckx shing Mun north shing Mun south
Study De Fré et al (1994) HKpU (2005) HKpU (2005)
Year 1991 2002 2002
Minimum So2 (μg m–3) 49 – –
Mean So2 (μg m–3) 122 110 230
Maximum So2 ((μg m–3) 224 – –
SO2 = sulfur dioxide
4.5.2 LeaD
We found only one study that reported lead concentrations in road tunnels. Measurements of lead were made at the entrance and exit of the Tingstad and Lundby tunnels in Gothenburg, Sweden in 1999 and 2000 respectively (Sternbeck et al 2002). There was a significant difference between either ends of the tunnel in both cases, as shown in Table 4.7, below. The lead was related to direct nontailpipe emission of wear products, rather than exhaust fumes or resuspended dust.
tAble 4.7 concentrations of lead at either ends of two swedish tunnels
tunnel entrance (ng m–3) exit (ng m–3)
Lundby 59 113
tingstad 46 104
Source: Sternbeck et al (2002)
4.5.3 BenZene anD toLUene
Two further compounds arising from road vehicle emissions—benzene and toluene—are mentioned in the WHO air quality guidelines (WHO 2000). Benzene is a major component of petrol, although its use is strictly regulated because it is a group 1 carcinogen associated with leukemia. Due to this effect, the WHO guidelines do not specify a concentration of exposure duration for benzene. However, in June 2001, the National Industrial Chemicals Notification and Assessment Scheme (NICNAS), Australia’s regulator of toxic chemicals, recommended that the national exposure standard for benzene be cut by 90% (NICNAS 2001). In the report, the director of NICNAS, Dr Margaret Hartley, stated:
There is no known safe threshold for the carcinogenic effects of benzene, but since the risk for leukaemia increases with exposure, it can be reduced by controlling exposure to the highest practicable standard.

aiR QUaLitY in anD aRoUnD tRaFFiC tUnneLS
54 | Review of in-tunnel air quality
McLaren et al (1996) decomposed emissions of nonmethane hydrocarbons into direct tailpipe and evaporative emissions in the Cassiar tunnel near Vancouver. For benzene, 71% of the measured tunnel concentration was related to combustion emissions, 27% to unburned fuel and 2% to evaporative losses. Benzene has been measured in a number of tunnels, although only a few studies actually report concentrations. A summary of those that do is shown in Figure 4.20, sorted in order by the date of the study. The strong fall in concentrations over time is immediately apparent.
fiGure 4.20 concentrations of benzene measured in a range of road tunnels (with year of study given)
330
194
145
62
21 13 8 9 19
0
50
100
150
200
250
300
350
400
Tingst
ad 92
Gnistan
g 92
Sydn
ey H
arbou
r 94
Söde
rleds
96
Gubris
t 02
Shing
Mun
S 04
Shing
Mun
N 04
Tseu
ng W
an O
04M5
Mea
n be
nzen
e co
ncen
trat
ion
(µg
m-3)
Tunnel
Source: Barrefors 1997, Duffy and Nelson 1997, HKPU 2005, Indrehus and Aralt 2005, Stemmler et al 2005
The WHO air quality guidelines also mention toluene which, according to the International Agency for Research on Cancer (IARC), is a group 3 carcinogen, meaning that it is not classifiable as to its carcinogenicity to humans. Toluene is another component of petrol fuel. Inhalation of toluene fumes can be intoxicating, but in larger doses it induces nausea (Barrefors 1997). Chronic or frequent inhalation of toluene over long periods leads to irreversible brain damage (Barrefors 1997). The WHO sets a guideline of 1000 μg m–3 over an averaging time of 30 minutes.
Figure 4.21, below, illustrates the measured concentrations of toluene in a range of road tunnels. As with benzene, a strong decreasing trend can be seen over time, even though the figure compares different tunnels. This decreasing trend—consistent with the measured decrease in emission of these and other VOCs from road vehicles in the past two decades— is illustrated by Figure 4.22 below (from Stemmler et al 2005). In this study, emission factors for benzene and toluene were measured in the same tunnel (Gubristtunnel in Zurich) in 1993 and 2002. The bold lines represent the modeled emission factor for the intervening years, based on dynamometer studies.

aiR QUaLitY in anD aRoUnD tRaFFiC tUnneLS
Review of in-tunnel air quality | 55
fiGure 4.21 concentrations of toluene measured in a range of road tunnels (with year of study given)
630
365
258201
55 39 30 48 350
200
400
600
800
1000
1200
Tingst
ad 92
Gnistan
g 92
Sydn
ey H
arbou
r 94
Söde
rleds
96
Gubris
t 02
Shing
Mun
S 04
Shing
Mun
N 04
Tseu
ng W
an O
04 M5
Mea
n to
luen
e co
ncen
trat
ion
(µg
m-3) WHO Guideline
Tunnel
Source: Barrefors 1997, Duffy and Nelson 1997, HKPU 2005, Indrehus and Aralt 2005, Stemmler et al 2005
fiGure 4.22 Modelled (lines) and measured (points) emission factors for benzene (lower lines) and toluene (upper lines) in the Gubristtunnel, zurich
1992
emis
sion
fact
or m
g/km
0
5
10
15
20
25
30
35
40
1993 1994 1995 1996 1997 1998 1999 2000 2001 2002 2003
Dotted lines represent higher vehicle speed
Source: Stemmler et al (2005)
4.5.4 FoRMaLDeHYDe
Two key sources of formaldehyde in the atmosphere that are relevant for nonoccupational exposure of populations are vehicle emissions and smoking. Vehicle emission factors for formaldehyde have been calculated from measurements in several tunnels. In general, emission factors for HDVs have been substantially larger than for LDVs. The main exception is the study of Schmid et al (2001) in the Tauerntunnel in Austria, where the emission factors for HDVs and LDVs were nearly equal. Two studies have reported formaldehyde emission factors split between diesel

aiR QUaLitY in anD aRoUnD tRaFFiC tUnneLS
56 | Review of in-tunnel air quality
and petrol vehicles. Staehelin et al (1998) noted that diesel-powered vehicles in the Gubristtunnel emitted six times more formaldehyde than petrol vehicles in 1993. In Hong Kong in 2003 (Shing Mun tunnel), Ho et al (2007) found that diesel-powered vehicles emitted 11 times more formaldehyde than petrol vehicles.
Long-term trends related to emission reduction (and especially restrictions on the aromatic content of petrol fuel have been highlighted in at least three tunnels. Measurements in the Fort McHenry (Baltimore) and Tuscacora (Pennsylvania) tunnels in 1992 (Pierson et al 1996, Zielinska et al 1996) were repeated in the Tuscacora tunnel in 1999 (Grosjean et al 2001). In this study it was found that emission of formaldehyde from HDVs was four times lower than in 1992, but there was no reduction in LDV emissions. Formaldehyde emissions were measured in the Caldecott tunnel (California) from 1994 to 1999, with the exception of 1998. A reduction in the emission from LDVs of 50% was found over the whole five-year period (Kean et al 2001). In Europe, Schmid et al (2001) reported a large fall in emission factors (to one-third) between 1988 and 1997, for LDVs and HDVs.
Reported mean concentrations are summarised in Table 4.8.
tAble 4.8 Mean concentrations of formaldehyde in road tunnels and in external background locations from the literature
study and tunnel year
internal concentration (µg m–3)
background concentration (µg m–3) ratio
Zielinska et al (1996), Fort McHenry 1992 32.4 maximum not reported
Zielinska et al (1996), tuscacora 1992 19.6 maximum not reported
Johannson et al (1997), Söderleds 1995–96 20–40 not reported
Schmid et al (2001), tauerntunnel 1997 41.2 not reported
grosjean et al (2001), tuscacora 1999 4.59 1.72 2.7
environment australia (2002), Domain autumn 2001 14.18 not reported
environment australia (2002), Domain Winter 2001 15.14 not reported
environment australia (2002), Domain Spring 2001 13.79 not reported
environment australia (2002), Domain Summer 2002 15.01 not reported
HKpU (2005):
Shing Mun S Summer 2003 56.33 7.18 7.8
Shing Mun n Summer 2003 53.63 7.18 7.5
tseung Kwan o Summer 2003 29.53 7.18 4.1
Shing Mun S Winter 2003–04 37.07 10.71 3.5
Shing Mun n Winter 2003–04 32.26 10.71 3
tseung Kwan o Winter 2003–04 27.67 10.71 2.6
4.5.5 BioaeRoSoLS
The term ‘bioaerosols’ is here used to denote respirable PM of a cellular origin. It can include viruses, bacteria, fungi and spores, rusts, dander, pollen, microbial VOCs and fragments of all of these, as well as fragments of animal and vegetable material. We found no literature concerning the presence of these species in road tunnel air. It is widely reported that the most important factor influencing the survival of microorganisms in the air is high RH, with secondary factors being low temperature, absence of sunlight, and the presence of oxides of nitrogen and sulfur

aiR QUaLitY in anD aRoUnD tRaFFiC tUnneLS
Review of in-tunnel air quality | 57
(Lighthart and Shaffer 1997, Donnison et al 2004). Although the presence of such oxides and absence of sunlight is clearly relevant for road tunnels, we found no conclusive evidence of high RH in tunnels, and noted that temperatures are often raised within tunnels compared to outside them.
Awad (2002) has compared the presence of viable and nonviable bacteria and fungi between an underground and a surface metro station in Cairo. The concentrations of airborne total viable bacteria, staphylococci and suspended dust were higher in the air of the tunnel station than at the surface station. In contrast, spore-forming bacteria, Candida spp, fungi and actinomycetes were found at slightly higher levels in the surface station than in the tunnel station. A statistically significant difference (P < 0.01) was found between the levels of suspended dust at both stations. Cladosporium, Penicillium and Aspergillus species were the dominant fungi isolates. Fusarium, Aspergillus and Penicillium are the most common fungi that produce toxins. Tuhackova et al (2001) sampled PAHs, bacteria and fungi in the soil verging on a major highway and found a high abundance of bacteria (8.33 × background) and fungi (3.17 × background) close to the highway. It was suggested that this might be a consequence of hydrocarbon deposition from the traffic serving as a significant energetic input into the soil. The elevated concentrations of hydrocarbon substrates, as indicated by PAHs, increased both the absolute and relative numbers of the microbial degraders of diesel fuel, biphenyl, naphthalene and pyrene. We did not find any other relevant literature on this topic, but note that bioaerosols have received much less attention in atmospheric research in general compared to aerosols as a whole, and far less is known about these particles than about directly traffic-related particles.
4.6 in-veHicle exPosure of tunnel users
4.6.1 penetRation oF gaSeoUS poLLUtantS into a veHiCLe DURing a tUnneL tRanSit
The air-exchange rate (AER) for a road vehicle is highly variable between vehicles and, in general, is higher (see Park et al 1998) if (in rough order of importance):
the windows are open (AER can be 10–20 times higher for stationary vehicles than if closed)•
speed is higher (one study notes an increase in AER from 2 h• –1 if stationary to 92 h–1 at 100 km h–1 with windows closed and fan off)
the heating-ventilation-air-conditioning fan is on (as a rough estimate this doubles the AER)•
the vehicle is older.•
In one study in which windows were open, the minimum AER was 13.3 h–1 when stationary, and 92 h–1 at 100 km h–1. At these rates, gas concentrations inside a vehicle respond to changes outside in under a minute, and internal and external concentrations will effectively be the same. This is supported by observations from studies in the M5 East tunnel (SESPHU 2003). Similar studies performed on nonairconditioned buses in the Cross Harbour and Lion Rock tunnels in Hong Kong (Mui and Shek 2005) found that this in-cabin concentration could be reduced by up to ~20% with respect to the external concentration in a vehicle with a large internal volume, such as a bus, due to the timelag inherent in penetrated air becoming mixed throughout the cabin. This is consistent with measurements of benzene on buses on city streets in Sydney (Duffy and Nelson 1997).
If the windows are closed, then penetration into the cabin is slowed, introducing a timelag in the response of interior CO concentrations to exterior changes. As a hypothetical example, we may assign an AER of 22 h–1 to a vehicle travelling at 72 km h–1. If there is a step change in external concentration, the vehicle will have travelled more than 7 km before the internal concentration has responded by 90% in the absence of other factors. In practice, this means that in most cases a vehicle with closed windows will have exited the tunnel well before the internal concentrations have fully responded to the external rise.

aiR QUaLitY in anD aRoUnD tRaFFiC tUnneLS
58 | air quality near road tunnels
Surveys have shown mean interior CO for a whole tunnel transect is typically 25–50% of the mean exterior (in-tunnel) concentration (Chan et al 2002). We should expect this figure to depend upon the ‘leakiness’ of the vehicle and the ventilation settings, and thus to vary randomly for different tunnel users. In longer tunnels, the extra time spent in the tunnel allows more CO to penetrate and should increase this percentage. In congested conditions, the increased time in the tunnel may be partly offset by the reduced speed-dependent penetration.
Transect studies in the Söderledstunnel (SEHA 1995) included measurements of CO, NO2 and
NOx inside a vehicle with three different ventilation settings (windows open, closed with vents
open and closed with recirculation). The results, reproduced in Figure 4.23, show that when the windows are closed, changes in internal concentration are slower, with concentrations initially less than half those found with the open window. However, the relative reduction decreases with progress along the tunnel. When the vehicle exits the tunnel, external concentrations drop rapidly, but air from the tunnel is trapped within the vehicle, and concentrations in the vehicle cabin are now higher than outside.
fiGure 4.23 transects of the söderledstunnel, stockholm (length 1500 m) in a vehicle with windows open (full line); windows closed, vents open (dashed line); and windows closed, vents closed, air recirculating (dotted line)
NO
X [
ug/m
3 ]
6000
5000
4000
3000
2000
1000
00 500 1000 1500 2000
Antal meter från tunnelinfart
utanför bili bil venti bil recirk
NO
2 [ug
/m3 ] 300
400
250200150100
350
500
0 500 1000 1500 2000
Antal meter från tunnelinfart
utanför bili bil venti bil recirk
CO
[ug
/m3 ] 30
40
25201510
35
50
0 500 1000 1500 2000Antal meter från tunnelinfart
utanför bili bil venti bil recirk
Source: SEHA (1995)
aiR QUaLitY in anD aRoUnD tRaFFiC tUnneLS
Review of in-tunnel air quality | 59
The effect of traffic-sourced pollutants on drivers and passengers is not restricted to the time spent in tunnels alone, but also to the entire journey. On approaching a tunnel, vehicle occupants will already be inhaling concentrations of air pollutants significantly higher than in the ambient background air. On leaving the tunnel, there is a sudden fall in the outside concentration, but concentrations in the vehicle cabin will respond only slowly. The vehicle will carry the vitiated air it has collected in the tunnel away with it. In the case of a typical windows-closed AER of 20 h–1 at 80 km h–1, the vehicle may have travelled several kilometres before in-cabin concentrations return to their original values, so that a tunnel transect lasting one to two minutes may lead to raised concentrations in the cabin of tens of minutes. The exact values will vary hugely between vehicles and between journeys because it depends on the AER for each vehicle and its ventilation options, the emissions and concentrations within the tunnel, random variations in these, and chance factors, such as driving behind a gross-emitting HDV.
The effect is illustrated in the Hong Kong study of Mui and Shek (2005). They reported CO concentrations in a bus with open windows and an airconditioned bus with windows closed. In the open bus, median CO concentrations were 2.1 ppm before the tunnel, 4.6 ppm in the tunnel and 2.7 ppm after the tunnel (ie higher than before the tunnel). In the airconditioned bus, with a lower AER, the pre-tunnel, in-tunnel and post-tunnel concentrations were 2.6, 2.9 and 3.4 ppm respectively, indicating a slower response to external changes. A similar pattern was found for respirable particles.
These considerations are especially important in the case where road users are likely to encounter multiple tunnels on their journey. The WHO CO guidelines are set so as to maintain blood COHb levels below 2.5%. COHb is purged from the body at a rate typically measured in hours. Thus, on routes with multiple tunnels, CO exposure should be considered on the basis of the cumulative exposure through the tunnel network. This may be true for other pollutants also. It takes several minutes for a vehicle with sealed windows to be purged of air it collects in a tunnel and, if a second tunnel is entered before the air from the first has been exchanged, vehicle occupants effectively inhale pollutants from both tunnels simultaneously. Exposure to tunnel air is thus extended in time far beyond the actual time spent in the individual tunnels. There have been several documented cases, though none have been substantiated, of people fainting or feeling ill in the M5 East tunnel. Examples of networks with multiple tunnels include the Sydney orbital motorway (a 28 km section includes eight tunnels totalling 13 km, including the M5 East, Eastern Distributor, Sydney Harbour and Lane Cove tunnels), the Valerenga, Svartdals, Ekeberg and Oslo tunnels in Oslo, and the future North–South Bypass and Airport Link tunnels in Brisbane.
4.6.2 expoSURe tiMeS
One effect of varying vehicle AERs is the resulting variation in exposure times. This can be illustrated with a hypothetical example in which vehicles with a range of AERs drive through a tunnel at a steady speed for three minutes, and the external concentration of a pollutant increases linearly with depth. Assuming a nontunnel concentration of one unit, the predicted external and internal concentrations within the tunnel and for the following 27 minutes are shown in Figure 4.24. It is clear that in the windows-open case, the exposure to tunnel air is slightly reduced in magnitude compared to the external concentration, but it is extended in time, so that tunnel air remains in the vehicle cabin for up to three minutes after leaving the tunnel. In the well-sealed case, the magnitude is greatly reduced, but the exposure duration is extended in time. Significantly, the exposure time is extended towards those periods for which WHO guidelines exist for CO (15 and 30 minutes), and towards the exposure times employed in some experimental studies of controlled exposure to NO2 (see Chapter 6). In this hypothetical example, most of the exposure to tunnel air in the well-sealed car actually occurs after the car has left the tunnel, and the mean concentration for the first 15 minutes is larger than that during the three minutes within the tunnel. In fact, the average in-vehicle concentration for the first 3, 15 and 30 minutes is little different for the well-sealed case (see Figure 4.25).

aiR QUaLitY in anD aRoUnD tRaFFiC tUnneLS
60 | Review of in-tunnel air quality
fiGure 4.24 external and internal concentrations for two air exchange rates (10 representing well-sealed, 80 representing windows open) for a hypothetical tunnel transit
0
5
10
15
20
25
30
35
40
0 5 10 15 20 25 30
Con
cent
ratio
n (µ
g m
-3)
Time (minutes)
external
AER = 10AER = 80
fiGure 4.25 in-vehicle average concentrations for three averaging times, based on the hypothetical tunnel transit in figure 4.24
0
2
4
6
8
10
12
14
03513Averaging time (minutes)
AER = 10AER = 80
Ave
ragi
ng c
once
ntra
tion
(µg
m-3)
4.6.3 expoSURe to paRtiCULate poLLUtantS in RoaD tUnneLS
Unlike gases, there is a probability that particles passing from the exterior to the interior of a road vehicle will become impacted on a surface, especially when the airflow involves rapid changes of direction through small openings. Only limited experimental data exists, but one study (Ptak and Fallon 1994) found that when the windows in a car are closed, so that external air can only penetrate via the heating-ventilation-air-conditioning system and through leaks, 2–15% of

aiR QUaLitY in anD aRoUnD tRaFFiC tUnneLS
Review of in-tunnel air quality | 61
submicron particles and 40–70% of supermicron particles do not penetrate into the vehicle cabin. The removal of supermicron particles has been observed to reach 90% when an air filter was used (Ptak and Fallon 1994).
In the bus-based studies of the Cross Harbour and Lion Rock tunnels (Mui and Shek 2005) indoor to outdoor ratios for PM
10 were reported of 1.17 on the lower deck and 0.93 on the upper deck
of buses without airconditioning. The higher indoor PM10 concentrations were not observed in
airconditioned buses, although no indoor to outdoor ratios were available for this part of the study. The authors suggested that this was related to particulates on surfaces in the bus, acquired before the bus entered the tunnel, being resuspended due to the elevated turbulence in the bus as it passed through the tunnels. In this way, the vehicle brings an internal source of coarse particles into the tunnel.
In the M5 East study (SESPHU 2003) external concentrations were not reported, but are indicated by those transects in which the windows were down. PM
2.5 was measured; althoug less influenced
by the resuspension of coarse particles, it will still play a role. In this case, the ratios between windows closed to windows open were 0.16 with airconditioning off and 0.13 with it on. This represents a substantial reduction that will be due to the reduction in penetration of externally sourced particles, plus a reduction in the resuspension of particles settled on the internal surfaces. We can make a rough estimation of how much is due to the reduction in penetration alone, by considering the benzene and toluene ratios for the same study, summarised in Table 4.9. These show a consistent ratio of 0.5, rising to 0.6 if airconditioning is active.
tAble 4.9 ratios of in-cabin concentrations in the M5 east tunnel of windows closed to windows open
Airconditioning on Airconditioning off
Benzene 0.55 0.47
pM2.5 0.13 0.16
toluene 0.62 0.50
xylene 0.59 0.50
pM2.5 = particles of less than 2.5μm
Source: SESPHU (2003)
4.6.4 ReLating in-tUnneL ConCentRationS to tUnneL USeR expoSURe
In real tunnels, there is additional variability in pollutant concentrations due to the random variation between journeys. Many studies on surface roads have shown that the greatest determinant of in-vehicle concentrations is the emissions from the vehicle in front. Air generally enters a vehicle low at the front, at a similar height to the exhausts of most vehicles. Moving vehicles also possess ‘wake zones’ in which exhaust pollutants are trapped, and larger vehicles (such as trucks) have larger wakes. Concentrations are likely to be much higher if following a gross emitter through a tunnel. However, the effect of pollutant penetration needs to be considered. Reduced air exchange will act to smooth out brief peaks in external concentrations. This means that tunnel users who close their vehicle windows will not be directly exposed to brief or highly localised peaks, as might be detected through fixed monitors or external studies (as long as vehicle speed is maintained).

aiR QUaLitY in anD aRoUnD tRaFFiC tUnneLS
62 | Review of in-tunnel air quality
The study by Holmes Air Sciences (2005), based on the M5 East tunnel, assessed to what degree fixed-point in-tunnel NO monitoring data represent the varying concentration field through which vehicles in the tunnel move. In this study, in-vehicle concentrations were not measured and cannot be directly included in the analysis. Values from a fixed-point monitor, at a location where NO and NO
2 concentrations are generally the highest, exceeded the average measured over whole
concurrent vehicle transits for 98% of the time. The average fixed-point NO2 was larger than the
transit peak 30-second average for 75% of the time. From these observations, it was concluded that such a fixed-point measurement provided a reasonable indication of the upper levels of in-tunnel NO
2.
4.7 conGestion in roAd tunnels
The issue of the effect of chronic congestion in road tunnels was raised in Belgium in 1989, when the Institute of Hygiene and Epidemiology made measurements in the Leopold II tunnel in Brussels. It was found that drivers could regularly spend 20 minutes or more stuck in the 2 km long tunnel (De Fré et al 1994). Chronic congestion has been reported in the following other tunnels:
Söderledstunnel, Stockholm•
M5 East tunnel, Sydney•
Landy tunnel, Paris•
Croix Rousse tunnel, Lyon•
Gubristtunnel, Zurich.•
4.7.1 eFFeCt oF CongeStion on eMiSSionS
Pollutant emission is increased in congested conditions due to repeated bursts of acceleration and deceleration. Also, pollutant emission is generally increased at lower speeds. Dynamometer-based studies indicate that, averaged over a typical modern vehicle fleet, emission per kilometre of NO
x
rises only slightly below 40 km h–1. Emission of CO and PM rises by perhaps a quarter to a third as speeds fall from 80 km h–1 to 40 km h–1. At 20 km h–1, PM and CO emissions rise to more than double the value at 80 km h–1 (figures based on UK National Atmospheric Emissions Inventory 2004 UK fleet). The response of NO
x emissions to reduced speeds varies between vehicles.
However, HDVs are disproportionately high contributors to total NOx emission from a fleet, and
emissions of NOx from HDVs rise significantly on reducing from 40 km h–1 to 20 km h–1. For modern
(Euro I and beyond) cars the situation is more complex, but in general, NOx emissions decrease
with decreased speed for older (pre-Euro I) cars below 40 km h–1. Emission of resuspended road dust is strongly speed dependent and will be dramatically reduced in congested conditions, effectively falling to zero in stationary traffic.
Dynamometer-based studies often give results that deviate from what is actually emitted in real-world driving. The main alternative to such studies is to calculate emission factors of a real fleet from in-tunnel measurements. These seldom provide a range of speeds, so the effect of vehicle speed cannot be investigated. However, the persistent morning congestion in the Söderledstunnel in Stockholm provides just such an opportunity. Kristensson et al (2004) reported that CO emission per kilometre increased steadily as speed reduced, but to a greater extent than described above. As speed halved from 80 to 40 km h–1, CO emission was approximately doubled. The relationship with speed for NO
x was more complex, with emissions per kilometre from HDVs
(and their contribution to total emissions) peaking at 50–55 km h–1.
Details of the effects of speed on emissions of particle numbers are scarcer and this remains an area of ongoing research. However, Gidhagen et al (2003) proposed that mass and distance emission factors were reduced at lower speeds, to explain the observed falls in number concentrations of particles smaller than 29 nm during the consistent morning congestion in the

aiR QUaLitY in anD aRoUnD tRaFFiC tUnneLS
air quality near road tunnels | 63
Söderledstunnel in Stockholm. This lower apparent emission may be related to the preferential condensation of exhaust vapours onto the higher levels of pre-existing aerosol (as opposed to nucleation) in the congested conditions.
Data on NO and NO2 from 160 transects of the M5 East tunnel (Holmes Air Sciences 2005) were
discussed in Section 4.3.5 above. The highest NO2 concentration observed lasted for over a
minute, peaking at above 0.8 ppm. This was towards the end of a westbound transit (31 March 2004) at around 1617. Congestion was indicated by the long transit time in this case (in the 10–15 minutes band) and corresponded to a peak in NO (~12 ppm). The values here indicate a NO
2:NO
x ratio slightly raised above the typical daytime value for this tunnel of 5–6%. This
may be attributed to NO2 being produced via a reaction between NO and oxygen, but there is
insufficient evidence to support this. As the NO2:NO
x ratio deep inside the tunnel is expected
to be an indicator of the NO2 to NO
x emission ratio, then temporary or localised changes in this
concentration ratio may reflect changes in the emission ratio. Such a change is likely to be a result of changes in traffic speed. For example, Carslaw (2005) notes reported increases in the NO
2:
NOx emission ratio in buses without particulate filters when operating at low load. Thus, by this
mechanism, NO2 concentrations may increase beyond predicted values by assuming a constant
NO2:NO
x ratio in congested conditions.
4.7.2 eFFeCt oF CongeStion on DiSpeRSion pRoCeSSeS
In unidirectional tunnels, ventilation is assisted, or often provided entirely, by the piston effect of the moving vehicles. In congested conditions, reduction in vehicle speeds reduces this effect. The high density of vehicles also provides greater aerodynamic resistance, further reducing ventilation at a time when emissions are increasing. Thus, in the absence of increased ventilation, concentrations rise to higher than predicted levels, purely from the increase in emissions. This is likely to be particularly significant in the M5 tunnel where congested conditions in the west end of the westbound tunnel give rise to significant elevations in PM
10 levels (sometimes to over 2000 μg m–3) for short periods. The problem is the outcome of the combination of relatively high numbers of trucks in the afternoon traffic (about 200 ‘long vehicles’ per hour making up 8% of total traffic at average speeds less than 40 km h–1) and the small cross-section of the tunnel (44 m2), which means that two typical vans take up between 40 and 50% of the tunnel. The maximum ventilation volume of this segment of the tunnel, without portal emissions occurring, is 375 m3 sec–1. The New South Wales Road Traffic Authority (RTA), in its recent planning application, intended to improve in-tunnel conditions and identified filtration as the most appropriate means of dealing with this problem.
De Fré et al (1994) noted markedly increased emissions of CO, NO2 and hydrocarbons during
the frequent periods of congestion in the Craeybeckx tunnel in Antwerp. During an incident on 22 April 1991, a reduction in traffic speed in the tunnel coincided with a strong external wind in the opposite direction to the traffic, such that the wind speed in the tunnel dropped to 1 m s–1, reducing dispersion and leading to abnormally high peaks in in-tunnel pollutant concentrations.
Some of the intensive studies in the Söderledstunnel in Stockholm have identified regular daily congestion in the morning in the city-bound tube (Johansson et al 1996, 1997), with average vehicle speeds falling from 75 to 80 km h–1 to around 50 km h–1 (Gidhagen et al 2003). This has coincided with a consistent reduction in wind speed in the tunnel (falling to approximately half the mean daytime speed).
4.7.3 eFFeCtS oF CongeStion on aveRage ConCentRationS
The M5 East tunnel is an ideal location to study the effects of congestion on concentrations because it is known to be prone to chronic and sporadic congestion, resulting in a wide range of traffic speeds and transit times. For a 4 km tunnel with a speed limit of 90 km h–1, a transit time of 2.7 minutes could be expected. During the 32 mobile transits conducted in 2002 (SESPHU 2003) mean journey times of just under 5 minutes were noted on the eastbound tube, and 10 minutes on the westbound, corresponding to average speeds of approximately 50 and 24 km h–1 respectively. Over the 160 transits conducted in 2004 (Holmes Air Sciences 2005), the mean

aiR QUaLitY in anD aRoUnD tRaFFiC tUnneLS
64 | air quality near road tunnels
journey time was 5.2 minutes. Midday journeys took an average of 3.2 minutes (westbound) and 3.9 minutes (eastbound), with only three trips taking longer than 5 minutes. In the morning, the effects of congestion were more apparent, with average transit times of 4.3 (eastbound) and 5.1 (westbound) minutes. The latter included one 22 minute trip. In the afternoon, eastbound trips (towards Sydney) took an average of 3.5 minutes, with only one taking longer than 5, but westbound trips (away from central Sydney) took an average of 11 minutes (corresponding to an average speed of 22 km h–1), with all trips lasting longer than 5 minutes.
The M5 East tunnel study of 2004 (Holmes Air Sciences 2005) found no clear relationship between transit time, average NO
2 concentration and NO
2 measured external to a vehicle for
all journeys. However, concentrations during westbound transits were generally higher in the afternoon, especially at the peak points (exhaust and towards the exit), when journey times were significantly longer. The degree to which this was due to higher direct NO
2 emissions,
reaction of NO with oxygen or increased O3 availability due to increased ventilation rates
triggered by high CO or turbidity is unclear, especially as airflow data were not reported. An increased NO
2:NO
x ratio suggests all three mechanisms could be possible. Increased airflow
would suggest increased O3 availability, whereas decreased flow would imply reaction of NO
with oxygen. Without further data we can only speculate as to what might happen in more severe congestion or blockages.
4.7.4 CongeStion—SUMMaRY oF iMpaCtS
The impact of congested conditions on exposed persons in vehicles depends on three elements:
increased concentrations•
increased exposure duration•
reduced penetration rate of external pollutants into the vehicle cabin (which is speed dependent).•
General conclusions cannot confidently be drawn beyond this because every congestion event in every tunnel is different. We found no studies that explicitly study congestion in tunnels, except for the Söderledstunnel emission factor study cited above. The range of typical delays in tunnels, and resulting pollutant concentrations, is unknown.
4.8 lonG-terM eMission reductions
In the long term, emission factors have been reducing for CO, NO (and hence NOx), the fine
fraction of PM (and hence PM10) and a range of other traffic-related pollutants. Implementation of
more rigorous standards for fuel sulfur and aromatic content has also brought about step-change improvements. Consequently, we should expect to see reductions in tunnel concentrations over the long term unless these reductions have been offset by an increase in traffic flow, congestion or a reduction in ventilation.
The implementation and observed success of emission reduction programs (related to improvements in both vehicle and fuel technology) means that data only a few years old are already potentially out of date. The penetration of new technologies is uneven across the globe, and data from one city cannot be applied to another without considering these issues.
Long-term reductions in measured emission factors have been reported where measurements have been repeated in the same tunnel some years apart. Schmid et al (2001) reported major reductions of emission factors measured in the Tauerntunnel in Austria between 1988 and 1997 (see Figure 4.26), including an 85–87% fall in CO emissions per kilometre. Stemmler et al (2005) reported falls in benzene and toluene emission per kilometre in the Gubristtunnel (Zurich) between 1993 and 2002, of 80% and 76% respectively.

aiR QUaLitY in anD aRoUnD tRaFFiC tUnneLS
air quality near road tunnels | 65
fiGure 4.26 changes in road tunnel emission factors between 1988 and 1997 in the tauerntunnel, Austria
0.15
1.19
0.97
0.09
0.230.31
0.08 0.100.13
0.41
0.57
0.12
0.330.41
0.13
0
0.2
0.4
0.6
0.8
1
1.2
1.4
CONO x
SO2
NMVOC
Form
aldeh
yde
Acetal
dehy
de
Benz
ene
Tolue
ne
Rat
io o
f 198
8/19
97 e
mis
sion
fact
ors
weekdayweekend
0.13
Source: Schmid et al (2001)
Data covering multiple years are rare. However, CO, NOx and NO
2 concentration data were
collected for about two months every spring in every year between 1991 and 1996 in the 900 m long Klaratunnel in central Stockholm (Westerlund and Johansson 1997). Over the six years, traffic increased by 10%, but NO
x concentrations reduced by 10% in the southbound tube and by 14%
in the northbound. Reductions in CO over the same period were larger, 31% and 37% in the two tubes, although most of the fall occurred in the first two years, with a reduction of only 5–7% from 1993–96. NO
2 concentrations were largely unchanged up to 1994, and then rose by 34–42%
from 1994 to 1996. This is consistent with expectations due to the nonlinear link between NOx
cuts and NO2 concentrations, and the rising proportion of NO
x emitted directly as NO
2 from
newer vehicles.
Similar trends of emission and concentration reduction are apparent for particles. Measurements of PM were made at the Caldecott tunnel in California in the summer in 1997 (Kirchtetter et al 1999) and again at a similar time of day and year in 2004 (Geller et al 2005). The effect of vehicle emission reductions in that intervening seven years was clear and significant. PM
2.5 emission rates
per kilogram of fuel burned fell by 37% for LDVs and 60% for HDVs. Amongst the components of PM, the largest fall was in EC from HDVs. The resulting fall in concentrations can be seen in Table 4.10.
tAble 4.10 changes in the mean concentrations of carbon monoxide and particulate matter in the caldecott tunnel over seven years
1997 2004
Mean Co, Bore 1 (mixed fleet) 18.7 ppm 9 ppm
Mean Co, Bore 2 (LDv only) 27.6 ppm 10 ppm
Mean pM, Bore 1 pM2.5 = 132.5 μg m–3 pM10a = 37 μg m–3
Mean pM, Bore 2 pM2.5 = 53.7 μg m–3 pM10b = 16 μg m–3
Co = carbon monoxide; LDv = light-duty vehicle; pM = particulate matter ; pM2.5 = particles of less than 2.5 μm; pM10 = particles of less than 10 μm; ppm = parts per milliona pM2.5 was nearly 95% of pM10 in Bore 1 b pM2.5 was over 90% of pM10 in Bore 2

aiR QUaLitY in anD aRoUnD tRaFFiC tUnneLS
66 | air quality near road tunnels
4.9 GenerAl AssessMent of in-tunnel Air QuAlity cliMAtes
From a consideration of the data reviewed above, we propose notional ‘typical’ and ‘high’ in-tunnel air quality climate scenarios. These scenarios are used solely as illustrative exemplars to inform the assessment of health effects in Chapter 6. They are in no way intended to be objectively defined classifications. The descriptions of the physical parameters describing each scenario are summarised in Table 4.11. These scenarios describe urban tunnels with high traffic flow. The tunnel length, speed limit and traffic flow defined in the ‘normal’ scenario are all fairly typical for urban road tunnels.
tAble 4.11 in-tunnel air quality scenarios—physical parameters
normal High
time Daytime, off-peak Daytime, peak
Flow Uncongested Saturated (speed reduced without significantly changing flow rate)
tunnel length 2000 m 4000 m
traffic speed 80 km h–1 40 km h–1
transit time 1.5 minutes 6 minutes
Daily traffic flow 50 000 100 000
4.9.1 CaRBon MonoxiDe
All of the data discussed above suggest that exposure to CO in road tunnels is normally far below WHO guidelines. CO exposure remains a major issue only in the case of tunnel traffic congestion, blockage and poor or incorrect performance of the ventilation system.
For the ‘normal’ scenario, we believe an indicative mean CO concentration of 5 ppm is appropriate. This is based on the range of mean concentrations presented in Figure 4.4, above. We consider that the concentrations reported from the Söderledstunnel represent 1990s emission factors in a tunnel that experiences chronic congestion, and therefore would be an overestimate for the ‘normal’ scenario. The same is true for the Klaratunnel. We have discussed our concerns about the validity of the absolute concentrations from the Hong Kong studies above. Despite the relatively low concentrations reported in the Cross City tunnel, we propose a value of 5 ppm to retain a conservative margin.
For the ‘high’ scenario, we consider a doubling due to the increase in traffic and a doubling due to the increase in tunnel length (see Section 4.1). In considering peak traffic instead of off-peak, we further increase the CO concentration by 50%. Finally, we increase CO by another 30% due to the decrease in traffic speed. Hence, we arrive at an indicative CO concentration of 5 × 2 × 2 × 1.5 × 1.3, which is equivalent to 40 ppm.
This figure applies to all the peak-time users of the hypothetical tunnel. Random variation means that some will experience higher values. The review shows that a small number could be exposed to the ‘maximum’ scenario—that is, double the average, or 80 ppm. This presumes that increased ventilation will not be triggered by such a high concentration.
These hypothetical values may be considered as upper bounds. The ‘high’ concentration of 40 ppm is approximately double the average measured in the M5 East tunnel, which has characteristics similar to those described in the scenario and during relatively congested conditions (transit times from 3.6 to 18.1 minutes) at a time when daily traffic was of the order of 82 000.
For each of these values, we may assume that the majority of tunnel users will have vehicle windows closed. In this case, we may assume that concentrations inside the vehicle will be reduced to three-eighths of those outside the cabin (see Section 4.6)—that is 2 ppm and 15 ppm for ‘normal’ and ‘high’ scenarios respectively. For the ‘maximum’ scenario, we assume the windows are open and so no reduction is applied.

aiR QUaLitY in anD aRoUnD tRaFFiC tUnneLS
air quality near road tunnels | 67
4.9.2 nitRogen DioxiDe
The nonlinearities involved in NOx chemistry in road tunnels make the definition of typical
scenarios, and the delineation of the effects of single variables, difficult. However, we propose, based upon the above review, that a value of 100 ppb represents a reasonable value for the ‘normal’ scenario. The doubling of both traffic and tunnel length associated with the ‘high’ scenario does not lead directly to a four-fold increase in NO
2 because of the nonlinearities. We
propose a value of 200 ppb. The data show clearly that the ratio of maximum to mean NO2 is
approximately two, and so the ‘maximum’ scenario is double the ‘high’—that is, 400 ppb.
As noted in Section 4.3, concentrations of the order of 400 ppb were observed several times at some point during transits of the M5 East tunnel in conditions similar to those described in the ‘high’ scenario. However, trip averages were typically 100–300 ppb in congested conditions. Thus, this scenario cannot be seen as an upper bound, merely indicative of such tunnels. For the in-vehicle values (other than ‘maximum’), we apply the same 3:8 indoor to outdoor ratio as used for CO in the absence of any weight of contrary data. It should be noted, however, that a special ‘worst-case’ scenario exists for NO
2 in which severe congestion and/or very poor ventilation
leads to an increased NO2 production from the oxygenation of NO. In this case, NO
2 levels can
plausibly reach 1 ppm and beyond, while exposure times lengthen.
4.9.3 paRtiCULate MatteR
The ‘normal’ scenario is based upon the middle of the range of values identified in the literature. PM
10 values are based upon the observation that PM
2.5 can contribute approximately 90% of PM
10
in road tunnels. PM concentrations are sensitively dependent upon the contribution of HDVs, and so for the ‘high’ scenario we have applied a doubling of concentration with respect to the ‘normal’, because this gives a value that fits the observed data summarised in Figure 4.5. The ‘maximum’ follows the pattern of CO and NO
2 in being double the ‘high’ value. For in-vehicle PM
2.5 values,
we reduce the internal concentration by 20%, due to reduced penetration and resuspension. In the ‘maximum’ case there is no reduction. For PM
10 we increase the concentration by 20% for the
maximum case to account for extra resuspension of internal coarse particles.
4.9.4 SCenaRio SUMMaRY
tAble 4.12 ‘normal’, ‘high’ and ‘maximum’ in-tunnel air quality scenarios for urban road tunnels
normal High Maximuma
indicative external concentrations
Co 5 ppm 40 ppm 80 ppm
no2 100 ppb 200 ppb 400 ppb
pM2.5 150 μg m–3 300 μg m–3 600 μg m–3
pM10 167 μg m–3 333 μg m–3 667 μg m–3
indicative in-vehicle concentrations
Co 2 ppm 15 ppm 80 ppm
no2 37 ppb 75 ppb 400 ppb
pM2.5 30 μg m–3 60 μg m–3 600 μg m–3
pM10 33 μg m–3 67 μg m–3 800 μg m–3
Co = carbon monoxide; no2 = nitrogen dioxide; pM2.5 = particles of less than 2.5 μm; pM10 = particles of less than 10 μm; ppb = parts per billion; ppm = parts per milliona the levels of the respective pM10 and pM2.5 in the M5 east tunnel are at levels exceeding the ‘high’ and ‘maximum’ here

aiR QUaLitY in anD aRoUnD tRaFFiC tUnneLS
air quality near road tunnels | 69
5 Air quAlity neAr roAd tunnels
This chapter looks at various issues surrounding air quality near rather than in road tunnels. It first considers the principles and processes determining air quality near tunnels and then discusses how polluted air is released into the environment, particularly through portals. The chapter then considers the main challenges in assessing air quality near tunnels, reviews studies in specific urban districts and discusses a particular pollutant; that is, PM. Finally, the impacts on indoor air quality for those living or working near road tunnels are discussed.
5.1 PrinciPles And Processes deterMininG Air QuAlity neAr tunnels
When considering the effect of road tunnels on the air quality outside the tunnel, it is helpful to think in terms of the following three zones:
Portal vicinity• —within 100–200 m of the tunnel portals. Concentrations at the exit portals can approach the maximum values found within the tunnels. Within the first few metres, however, they fall rapidly. Monitoring data have shown that within 100 m they have fallen almost to background levels. The affected population is thus small. An indicative value for a population density of 3000 km–2 would be around 100, and the density is likely to be lower near a major road tunnel portal. In many cases, the resident population will be zero.
Local area• —within up to ~1 km of tunnel portals and/or ventilation stacks. The potentially affected resident population could be 1000s or 10 000s. However, the increase in concentrations (beyond the portal vicinity zone mentioned above) will generally be either small, zero or negative.
Wider area• —the area affected by the redistribution of traffic flow associated with the opening of a road tunnel.
5.2 releAse of Polluted Air into tHe environMent
Tunnel openings are a key focus of any tunnel air-quality assessment. It is at the portals and stacks that the pollutants, which have been released inside the tunnel and have accumulated rather than been dispersed as in the case of open roads, are finally released into the ambient environment at high concentrations. From the point of view of the local neighbourhood, it is at the tunnel openings that the air-quality impact of the tunnel is most keenly felt. This is the zone within which the road tunnel will inevitably worsen local air quality in comparison to an equivalent road without a tunnel.
Air-quality assessment of the impact of the openings tends to occur in the tunnel planning process, and is often required for planning approval. In this case, the assessment is necessarily a modelling exercise. In a few cases, monitoring has taken place after tunnel opening to check the effect of the tunnel on ambient air quality near the openings, to check the validity of the modelling results, and to further inform model development.
A simpler tunnel ventilation system involves the venting of contaminated air at the exit portals. If it is considered that the impact on the local environment is too high, the tunnel air can be vented elsewhere, at a ventilation station and possibly via a tall stack. In some cases, this stack is some distance from the tunnel so that tunnel air may be vented into the atmosphere in a nonresidential location. Variable control of the ventilation system can change the distribution of air vented through the portals and through alternative openings. One of the great advantages of road tunnels is the opportunity to deliberately site portals (or stacks) away from sensitive receptors so that road transport emissions may be removed from dense residential areas, improving local air quality. Examples of this are provided below.

aiR QUaLitY in anD aRoUnD tRaFFiC tUnneLS
70 | air quality near road tunnels
Pollutant concentrations are not necessarily worse in the vicinity of tunnel portals than they were before the tunnel was opened. This may be the case if the pretunnel site of the portals was a major road junction with congestion and queuing traffic. This illustrates how each tunnel must be assessed on its own merits, and environmental assessments should consider the induced changes on traffic flow in general as well as emissions from within the tunnel.
These features are illustrated for the M5 East tunnel (Sydney) in Figure 5.1. On the left are modelled contours of NO
x concentrations and on the right NO
x exposure zones are allocated as a
result of the modelling. There are three focal points. Highest concentrations are apparent on the left and right, relating to the tunnel portals. In the centre a ‘saddle’ point is apparent with a small area of low concentration surrounded by lobes of higher concentration. This is the exhaust stack. The shape of the ‘high’ exposure zone describes the interaction of prevailing meteorology with the emitted NO
x plumes from these three sources.
fiGure 5.1 Modelled average nox concentrations (left) and resulting assigned nox exposure zones (right) for the M5 east tunnel
Average NOx concentration (µg m-3)due to tunnel emissions, Sept-Nov 2003, all hrs6247
6246
6245
6244
6243
6242
MGA94 Easting (km)326 327 328 329 330 331
MG
A94
Nor
thin
g (k
m)
Low– Blue
Medium– Yellow
High– Green
Source: Investigation into the possible health impacts of the M5 East motorway stack on the Turella community – reanalysis report by NSW Health, November 2006 (see Chapter 6)
5.3 tunnel PortAls
5.3.1 poRtaLS—MoDeLLing anD MonitoRing
The suite of dispersion models used for calculating impacts of roads is generally unsuitable for tunnel portals. Such models are not designed to model dispersion involving the special features of portals such as sunken roadways, vertical walls, local topography, vehicle-induced turbulence and especially the turbulent effects of a jet of contaminated air exiting the tunnel and mixing with the ambient wind, which will generally be travelling in a different direction and at a different speed.
Complex numerical models that solve the equations of fluid motion have been developed as research tools, but are too complex and time consuming to be run by nonspecialists for regulatory purposes. Environmental impact modelling is often undertaken using Gaussian plume models, such as Caline or CalPuff, although such models often make unrealistic predictions close to tunnel portals. This is generally because they do not model the jet effect of the air exiting the tunnel portal. Caline is unsuitable if the influence of nonflat topography is to be investigated. CalPuff includes the effect of topography but tends to overpredict concentrations within 100 m of the source.

aiR QUaLitY in anD aRoUnD tRaFFiC tUnneLS
air quality near road tunnels | 71
A few simpler models have been developed specifically for tunnel portals. These models are generally based on, and validated against, monitored data from real tunnel portals, including tracer-release experiments. One of the more successful is the GRAL model developed at the Graz University of Technology (Oettl et al 2002). Development of this model revealed very strong gradients in concentration (two orders of magnitude over 10 m) that the model would only be able to begin to resolve with a detailed representation of the entrainment of air in individual vehicle wakes. Inevitably it makes this, and any other model, sensitively dependent upon the turbulence submodel or parameterisation, and upon finely detailed input data.
In a 2005 paper, Oettl et al reported that GRAL had been tested for five tunnels. Results were reasonable, but the model was dependent upon two empirical parameters that had to be set independently for each tunnel. The general experience of attempts to model tunnel portal emissions is that it is a complex physical phenomenon; dispersion varies significantly between tunnels and due to variations in ambient meteorology making it difficult to make general statements. However, one consistent result is that the extent of the zone around the portal within which ambient air pollutant concentrations are significantly raised by the portal is of the order of 100–200 m. The shape of this zone is dependent on wind direction, and in the long term the average will typically extend further in the direction corresponding to downwind in terms of locally prevailing winds. In the presence of dense or tall buildings local recirculation effects may distort the shape of this zone in ways that are hard to predict.
5.3.2 RevieW oF MonitoRing StUDieS in tHe viCinitY oF tUnneL poRtaLS
oslo, Paris
A study of the urban road tunnels in Oslo in 2001 combined measurement of PM10 and NO
x (and
hence emissions) at exit portals with modelling of dispersion from those portals (Tønnesen 2001). It found that the near-field zone of influence of each portal was typically 100–200 m for NO
2 and
significantly less for PM10. This difference is to be expected based on their differing chemistry and
physical transport properties. After exiting the tunnel the polluted airstream, travelling as a jet, will rapidly mix and dilute with external air. However, the resulting reduction in concentrations will be generally offset in the case of NO
2 by its rapid production as the high concentrations of NO come
into contact with oxidants including O3. This effect is short-lived, however, as NO is depleted and
diluted. Conversely, coarser PM10 particles resuspended by traffic within the tunnel will rapidly
deposit to surfaces once emitted from the portal, leading to a more rapid reduction in PM10 levels
with distance from the portal, especially perpendicular to the road.
Similarly, a study around a portal of the very busy Landy tunnel in Paris found that concentrations of NO
2 were comparable to other roadside sites in Paris except very close (< 100 m) to the
portal (Brousse et al 2005). As with the modelling studies mentioned above, this study found that consideration of wind speed and wind direction was crucial if fine-scale details of concentration variation within the 100 m zone are required, but that generally concentrations very close to the portal were four to five times smaller than at the portal itself.
M5 east, sydney
The M5 East tunnel in Sydney is somewhat exceptional as a 4 km long urban tunnel with high traffic flow. It is longitudinally ventilated with emissions generally vented some distance away from the tunnel via a stack, rather than at the portals. However, the option to vent via the portals is retained in the design, and portal emissions have become relatively common. Portal emissions occur mainly at night during maintenance operations, to reduce the in-tunnel concentrations workers are exposed to and due to fans being nonoperational, but also during vehicle breakdowns and times of congestion to relieve high in-tunnel concentrations (see Chapter 7 for further discussion of the management of portal emissions).
Results of long-term monitoring of CO, NO2 and PM
10 at two portals of the M5 East tunnel (Bexley
Road and Marsh Street) covering 25 months were recently reported by Holmes Air Science (2006). The monitors were located in the areas of expected maximum impact of the portal emissions (as

aiR QUaLitY in anD aRoUnD tRaFFiC tUnneLS
72 | air quality near road tunnels
determined by numerical modelling) and significant public exposure. The Bexley Road site was 200–300 m from the portal and approximately 20 m from the at-grade motorway. Although the long distance between the monitor site and the portal would allow dilution of emissions with ambient air, it represents the nearest residential receptors. The Marsh Street site is more complex. The monitor was located next to an off-ramp only a few metres from the ramp’s portal, and about 30 m from the main tunnel portal. Between the monitor and main portal is a major road with a signalled junction serving the motorway. In summary, both sites would be expected to report concentrations well above the background due to the emissions from traffic on the at-grade sections of the M5 motorway.
sodra lanken, stockholm
Following the opening of the extensive Sodra Lanken tunnel system in Stockholm (discussed further in Section 5.5.3), the emissions impact on the area surrounding the portals was modelled using the general-purpose dispersion model AirViro (SLB-analys 2006). Measurements of in-tunnel NO
x and PM
10 concentrations, which were the key modelling input, combined with airflow
measurements, were used to calculate emission rates from the portals. A ‘worst-case’ scenario from a peak ground-level impact perspective was simulated on the assumption that all tunnel air would be vented via the portals, rather than the stacks. (Note that this complex tunnel system has two stacks and seven portals.) The same general conclusions were reached from this modelling exercise as in the studies mentioned above. Elevated emission concentrations were recorded only within a short distance of the portals, where the residential population was negligible. An exception was one location within 50 m of a portal, with approximately 1000 residents expected to be exposed to an additional 50 μg m–3 of NO
x.
5.4 cHAllenGes in AssessinG Air QuAlity in urbAn districts contAininG roAd tunnels
Road tunnels in urban areas present significant challenges in assessing air quality effects, due to the inability to distinguish road tunnel emissions from other surface road emissions in any measurements. The two main approaches taken to assess air quality impacts are:
comparing monitored air quality before and after tunnel opening•
using wind direction to split data into at least two categories (in the simplest case downwind •
and upwind of the tunnel points of emission).
The former is especially challenging because some changes may be expected solely due to meteorology. Multiple monitors, especially in the case of the second approach, greatly extend the ability to make a less equivocal assessment.
Modelling and monitoring of dispersion at road tunnel portals have demonstrated the important role played by ambient wind speed and direction. Wind speed and direction are even more important when assessing the tunnel’s contribution to air quality in the wider neighbourhood (up to ~1 km from the tunnel openings). Potential long-term effects will be biased towards areas predominantly downwind of tunnel ventilation points, according to prevailing meteorology. An example of this is shown in Figure 5.1. In addition, other locations may be impacted episodically as a result of a particular set of meteorological conditions.
In any such assessments, it is important that consistent local weather patterns are considered carefully to understand the full picture. For example, a given location may have a prevailing southwesterly wind when viewed as an annual average. However, a seasonal analysis may reveal that northeasterlies are more common at a certain time of year. An understanding of consistent diurnal cycles is important for road tunnel assessment. For example, it is not uncommon for many cities to experience different prevailing wind directions and lower wind speeds in the morning. Thus, the most highly impacted area may not necessarily be that considered to be downwind according to annual prevailing winds. Maximum emissions may occur in the morning peak,

aiR QUaLitY in anD aRoUnD tRaFFiC tUnneLS
air quality near road tunnels | 73
coinciding with minimum dispersion due to lower wind speeds, with the plume directed in a different direction than the annual prevailing wind.
This effect of the morning ‘footprint’ being different from that at other times in the day is compounded by the diurnal and seasonal variations in the vertical ventilation of the urban canopy. Studies have shown that vertical dispersion of substances emitted at the surface is reduced in the morning due to the reduction in vertical motion and turbulence associated with nocturnal cooling of the surface. In many parts of the world, nocturnal inversions (ie when the atmosphere becomes thermally stratified, effectively putting a ‘lid’ on the surface layer of the atmosphere) are common. Although this is partly offset in urban areas by the release of anthropogenic and stored heat from the surface through the night, surface concentrations still remain raised relative to emissions. Even in the absence of inversions, direct measurements have shown that ventilation of the urban canopy is inhibited at night (eg Dorsey et al 2002, Longley and Gallagher 2006).
Destruction of inversions and an increase in the rate and depth of vertical dispersion begins once heating begins, from both anthropogenic sources and solar radiation. The impact on morning concentrations of traffic-related pollutants depends not only on the strength of any inversion, the size of the anthropogenic pollutant and heat emission, and the strength of solar radiation, but also the relative timing of sunrise and emission peak. In general, morning concentrations will be higher if the emission peak occurs before sunrise. The maximum solar insolation in summer varies little with latitude, but varies substantially in winter due to shorter daylight periods and smaller solar zenith angles. Similarly, the seasonal variation in the number of daylight hours increases with latitude. Thus, cities at higher latitudes may be expected to have a greater seasonal variation in urban concentrations of traffic-related pollutants. Peaks in particle concentration caused by poor turbulent ventilation during emission peaks will have greater significance in a high latitude city in winter when heating and traffic emissions are high, but solar flux is low, sunrise is late and sunset is early. Such conditions also favour the nucleation of ultrafine particles.
Another key issue to be considered in air quality assessment of tunnels is the choice of comparison. Within the road tunnel we can reasonably assume that the emissions come solely or largely from within that tunnel, as discussed earlier. However, outside the tunnel this is not the case. Any assessment therefore needs to clearly articulate whether it is the impact of the tunnel itself that is being assessed, or the traffic within it. In this context a road tunnel should be considered as a road along which all the normally evenly distributed emissions have been collected and emitted at a few points. Thus, from an air quality point of view the tunnel acts to redistribute the emissions and hence the local impacts. When asking the question, ‘What effect does tunnel X have on its neighbourhood?’ we must be very clear about whether we are comparing with the same road and traffic in a tunnel or distributed over the local road network.
Most new road projects not only redistribute traffic but can attract extra traffic to an area.
Ambiguities that can arise from traffic changes are illustrated by the case of the predicted effects of the Lane Cove tunnel in Sydney. Since this tunnel opened during the preparation of this review, no monitoring data representative of the tunnel’s normal use were available for inclusion in this review. However, in reviewing the dispersion modelling of the impacts, Manins (2005) noted that the modelling predicted that ground-level concentrations near the tunnel access ramps due to extra traffic, especially at the eastern end, were as high as or higher than predicted levels anywhere in the modelling domain from stack emissions. This is especially important as eastbound traffic levels were believed to have been underestimated and concerns were raised about drivers avoiding the tunnel once tolls are imposed, possibly leading to greater congestion on surface roads near tunnel entrances. Regardless of such behaviour, traffic in these areas was predicted to change as a direct result of the tunnel opening. So the question arises: do emissions from surface roads, such as tunnel access ramps and interchanges, constitute part of the tunnel’s air quality impact? Manins (2005) argued that they do, a view endorsed by this report. This has consequences for the selection of ‘background’ concentrations, to which modelled stack emissions may be added. Therefore, should the contribution of local tunnel-influenced surface roads count

aiR QUaLitY in anD aRoUnD tRaFFiC tUnneLS
74 | air quality near road tunnels
as part of background level or part of tunnel emissions? These arguments highlight the need for a clear definition of the goals of any air quality management strategy, and its dependence on good traffic data and predictions.
The remarkable efficiency with which the turbulent mixing of the ambient atmosphere disperses pollutants (subject to several factors) is not well appreciated. Not all mixing is actually turbulent and much of the dispersal occurs by means of discrete plumes of pollutants. This has been recognised by air quality scientists and pollution engineers for decades, even centuries, and has led to the widespread adoption of the tall stack as a means of reducing the effect of atmospheric releases in populated areas. Concentrations at ground level are significantly reduced as the height of the stack increases, and very tall stacks can have minimal to zero impact in their local vicinity. The following comment by Hibberd (2006) regarding a modelling study of the M5 East (discussed in detail below) succinctly illustrates the advantage of stack versus portal emissions:
…the portal emissions have an impact on ground-level concentrations that is up to 50 times greater than if the same emissions occurred from the [35 m] stack.
However, strong solar heating leading to thermal instability in the atmospheric boundary layer can lead to the formation of large turbulent eddies. Such eddies can momentarily and intermittently advect a relatively undiluted plume rapidly drawn down to the surface in a process known as ‘looping’. The effect is highly intermittent and likely to affect only a very localised area. The effect is also only likely to last for a short period of time (minutes to a few hours), and would be experienced at the surface as a brief period of polluted air followed by a period of unusually clean air. Consensus is lacking as to whether such brief impacts are significant and should be considered in an impact assessment. This highly localised effect is likely to escape monitoring, except in the case of a ‘lucky’ strike, but most ‘airshed’ scale atmospheric dispersion modelling tools are also not designed to predict such processes, other than the average effect over a period of at least an hour. The actual location and magnitude of the peak effects are inherently very unpredictable for modelling. Alternative modelling approaches that are more appropriate may be available, but no examples were found in the literature of such models being applied to tunnels.
The advantages of tall stacks are also somewhat diminished if sited on valley floors. The trapping of pollutants emitted in valleys has been known for over a century. Causes for pollutant trapping include sheltering from the wind, inversions capping the valley, katabatic flow down valley sides, and interactions between these processes. For achieving the full benefits of stack venting compared to portal emissions in populated areas, especially if sensitive receptors are located above the valley or on valley slopes, stacks need to be taller than valley sides to take advantage of natural atmospheric dispersion.
The choice of which pollutant to manage will primarily be driven by known or suspected health effects. However, in terms of generating an assessment, each pollutant has its own issues. In particular, the relative contribution of nontraffic and nonlocal sources should be known for each pollutant. This is relatively simple for pollutants dominated by road traffic sources. PM
10 is a clear
example of the opposite, as illustrated by the influence of natural windblown dust and bushfires on Melbourne and Sydney. In addition, the local contribution from surface road traffic should be known where possible. This is difficult as road-tunnel pollutants (once diluted in the ambient atmosphere) are chemically and physically indistinguishable from other road-traffic emissions. Without this information, however, it is difficult to ascribe any short-term rise in concentrations, or localised hot-spot, to the tunnel.

aiR QUaLitY in anD aRoUnD tRaFFiC tUnneLS
air quality near road tunnels | 75
5.5 review of studies in urbAn districts contAininG roAd tunnels
5.5.1 våLeRenga, SvaRtDaLS anD eKeBeRg tUnneLS, oSLo
Three road tunnels were built in Oslo (opening between 1989 and 2000) to reduce congestion and other detrimental effects of traffic from ground level in populated areas. The result was a general reduction in concentration of traffic-related pollutants due to a reduction in ground-level traffic. However, the exception was in the immediate area of the portals. Here, redistribution of traffic led to the formation of (previously absent) queues of traffic accessing the tunnels. Hence the localised adverse effect was due to the redistribution of traffic caused by the presence of the tunnels, rather than the tunnels themselves. Overall, however, the tunnels were assessed to have had a positive health effect on their surroundings (TØI 2004).
Surveys were repeated among residents in the affected neighbourhoods between 1987 and 2002, ie through the construction, phased opening and post-opening stages. Figures 5.2–5.4 show the percentage of respondents reporting annoyance due to traffic, noise and air pollution in three neighbourhoods which experienced changes in traffic. This study, however, concluded that the majority of residents were satisfied with the changes. The proportion that were satisfied was highest in areas where the improvements had taken place recently, particularly after the Svartdals and Galgebeg tunnels were opened for traffic, allowing Enebakkveien to be closed and alleviating the traffic problems in Dalehaugen. Residents living close to the tunnel entrances (eg Ensjøveien) were less satisfied.
fiGure 5.2 reported annoyance among local residents before, during and after opening of a tunnel in ensjøveien, oslo
100 15000
10000
5000
0
Trafikkutvikling og plager i Ensjøveien
Vegtrafikken
Vegtrafikkstøy ute
Støv’skitt ute
% ADT
ADT90
80
70
60
50
40
30
20
10
1987 1994 1996 1999 20020
original figures labelled in norwegian. Bars show % of people who were annoyed by traffic (red-brown), noise (brown-green), and air pollution (green). Line and crosses show the yearly averaged daily traffic intensity.
Source: TØI (2004)
In Ensjoveien there was an increase in annoyance following the opening of the Vålerenga tunnel in 1989 and the formation of associated traffic queues, although levels of annoyance reduced with time.

aiR QUaLitY in anD aRoUnD tRaFFiC tUnneLS
76 | air quality near road tunnels
fiGure 5.3 reported annoyance among local residents before, during and after opening of a tunnel in ekebergskraningen, oslo
100 15000
10000
5000
0
Trafikkutvikling og plager i Ekebergskråningen
VegtrafikkenVegtrafikkstøy uteStøv’skitt ute
% ADT
ADT90
80
70
60
50
40
30
20
10
01994 1996 1999 2002
original figures labelled in norwegian. Bars show % of people who were annoyed by traffic (red-brown), noise (brown-green), and air pollution (green). Line and crosses show the yearly averaged daily traffic intensity.
Source: TØI (2004)
In Ekebergskraningen there was no significant change in traffic (~500 cars/day) but there was a change in annoyance during construction.
fiGure 5.4 reported annoyance among local residents before, during and after opening of a tunnel in dalehaugen, oslo
100 15000
10000
5000
0
Trafikkutvikling og plager i Dalehaugen
Plage vegtrafikken
Plage trafikkstøy ute
Plage støv’skitt ute
% ADT
ADT90
80
70
60
50
40
30
20
10
01987 1996 1999 2002
original figures labelled in norwegian. Bars show % of people who were annoyed by traffic (red-brown), noise (brown-green), and air pollution (green). Line and crosses show the yearly averaged daily traffic intensity.
Source: TØI (2004)
Annoyance was reduced when traffic in Dalehaugen was drastically reduced.

aiR QUaLitY in anD aRoUnD tRaFFiC tUnneLS
air quality near road tunnels | 77
5.5.2 CitY LinK tUnneLS, MeLBoURne
The eastbound Burnley tunnel and associated westbound Domain tunnels are relatively long for urban tunnels (3.5 km and 1.6 km, respectively) and heavily used, so emissions from vehicles within these tunnels will be high. The tunnels are operated by Translink Operations (TLO) under a licence issued by EPA Victoria, which requires zero portal emissions (except in emergencies). Consequently ventilation is achieved using stacks—one installed at the end of each tunnel bore—with the Burnley tunnel stack located in a residential area. The licence also sets maximum discharge limits, which effectively requires continuous monitoring of CO, NO
x, PM
10 and PM
2.5 in
the stacks. The first annual review, in 2001, found that discharges were well within limits, with median mass flows typically no greater than 10% of the limits, maximum hourly flows within 20–40% of the limits for gases and 30–50% of the limits for particles (EPA Victoria 2002b). In a second review (EPA Victoria 2004) covering a further two years of operation (2001–03) the reported average hourly mass flows were no greater than 15% of limits, maximum flows less than 40% of limits for gases and less than 60% of limits for particles.
fiGure 5.5 Map of Melbourne’s city link tunnels and air quality monitoring sites
ventilation stack CityLink - Grant Street
Burnley Tunnel
EPA - Richmond
CityLink - Madden Grove
ventilation stackCityLink - Rooney Street
West Gate Freeway Domain Tunnel
EPA - Alphington
Eastern Freeway
0 0.5 1 2 3 4Kilometres
Map area
Victoria Parade
Hod
dle
Stre
et
Source: EPA Victoria (2004)
The licence also requires that continuous ambient monitoring is conducted near both stacks. The monitors were installed at Grant Street and Madden Grove (see Figure 5.3) and monitoring of PM
10 began in April 1997, three years before the opening of the first tunnel. Monitoring of gases
(CO and NO2) and continuous monitoring of PM
10 (by tapered element oscillating microbalance
[TEOM]) began in December 1999. EPA Victoria has undertaken a continuous review of the data by comparing it with data from other Melbourne monitoring sites in the EPA network, consisting of five stations. The tunnels were opened in 2000—Domain tunnel in April and the Burnley tunnel in December. Before this, the long-term concentrations of PM
10 (indicated by medians over several
months of data) were 5–9 μg m–3 higher at the City Link monitors compared to the median for the EPA network, depending on the period of time chosen (EPA Victoria 2001a). A clear exception was an increase of 18 μg m–3 over the network median at Madden Grove in summer 1998–99.

aiR QUaLitY in anD aRoUnD tRaFFiC tUnneLS
78 | air quality near road tunnels
Although no explanation was given for this, a much smaller increase of 6 μg m–3 was cited for the Grant Street site, which suggests a local source of PM
10 at Madden Grove, possibly construction.
However, data were not reported for exactly the same period so a direct comparison cannot be made confidently.
The first annual post-opening review in 2002 (EPA Victoria 2002b) found that:
PM10 levels…are similar to the EPA network medians. No change has been detected in
the levels relative to the EPA network post-opening of the tunnels.
The report, however, shows that the difference between the median tunnel PM10 concentrations
and the network median has reduced post-opening levels compared to pre-opening by 3–5 μg m–3 at Grant Street. This occurred more as a result of reductions at the tunnel sites rather than increases at the network sites. Such a reduction was not observable in PM
2.5. EPA Victoria review
went on to state:
Whilst exceedences of the PM10
objective
(50 μg m–3) at both Madden Grove and Grant Street have occurred, elevated PM
10 levels are observed in the EPA network when this
occurs. These results tend to indicate that City Link emissions are not the primary source of the particle levels monitored.
The report then notes the same conclusion for PM2.5
, and also…
CO [and NO2] levels monitored at Madden Grove and Grant Street are similar to the EPA network
medians, and well within [Victoria State Environmental Protection Policy] objectives. The analysis of air quality data has detected no impact of the emissions from the City Link project on local air quality.
Making comparisons with network medians is a relatively crude measure as variations in monitored concentrations cannot be attributed to tunnel emissions. In the first year after the tunnels opened, concentrations at Grant Street (near the western exit of the Domain tunnel) were found to be consistently higher than at Madden Grove (near the eastern exit of the Burnley tunnel). This was to be expected due to Grant Street’s more central location compared to Madden Grove’s suburban location. Median PM
10 concentrations in the 2002 review were 8% (Madden
Grove) and 19% (Grant Street) higher than at the EPA Alphington monitor (in a suburban location ~8 km from the central business district). The difference was greater for higher percentiles (25% and 43% for the 99th percentile). However, in the absence of wind direction analysis, it was not possible to assess the degree to which these increases were due to site location (within the spatial variation of concentrations across Melbourne) and the direct impact of the tunnels.
A second review (EPA Victoria 2004) covered another two years of data (March 2002 to February 2004 inclusive). During this period the Madden Grove site in Burnley had been shut down (November 2003) when the operators (TLO) lost tenure on the site. This review came to the same principal conclusions as the first review, leading to an assessment that reviews could be less frequent. Several exceedences of the Victoria PM
10 intervention level of 60 μg m–3 (and 36 μg
m–3 for PM2.5
) had been observed at Grant Street and Madden Grove. These exceedences were generally related to external sources (bushfires, fuel reduction burning, and duststorms). However, it was noted that exceedences were slightly more common at the City Link monitors than at two other suburban EPA monitors (Richmond, < 1 km from the Madden Grove site, and Alphington, approximately 6 km away). This indicates that although the tunnels may not be the source of the particles causing the exceedence, it does not rule out that the tunnels do contribute to a higher baseline (even if it is only slightly higher) to which external sources can be added.
While it can be said that the reported concentration differences between monitors is due to general urban spatial variability and not the tunnels, EPA Victoria publications do not support ruling out the tunnel as the cause of raised PM concentrations in the vicinity of the stacks. There are, admittedly, technical difficulties in achieving this due to the very small expected tunnel signal compared to the large background. (This is discussed later in Section 5.5.4.) These analyses are sufficient if the only goal is to identify potential breaches of current air quality standards. This approach is less satisfactory however, if one considers that the PM
10 air quality standards are not

aiR QUaLitY in anD aRoUnD tRaFFiC tUnneLS
air quality near road tunnels | 79
set on grounds of a zero or negligible effect threshold, and that PM10 standards could be tightened
in the future, following trends in Europe and North America.
The data presented in the second review (EPA Victoria 2004) indicate that annual mean PM10
was rising between 1997 and 1999 at the nearest EPA network sites (Alphington and Richmond) before the tunnel opened. This was then followed by a large decrease in 2000. In 2001 and 2002 the level is generally constant at Alphington and Richmond. The reason for the large decrease (by approximately one third) in 2000 is unknown. However, all of the reported intra-annual variation may be due to random variation in weather and natural sources, rather than any systematic changes in anthropogenic emission. From 1999 to 2002 the ratio of annual mean PM
10 at the tunnel monitoring sites (Grant Street and Madden Grove) to the two network sites
is relatively constant, suggesting that the opening of the tunnel had no localised effect on long-term PM
10 levels. However, PM
10 was proportionally higher at these tunnel sites in 1998. In 2003,
a divergence appears in the PM10 high volatility index (HiVol) data, with a rise in concentrations
at Madden Grove and Grant Street but not at Richmond. This divergence is not observed in the TEOM data, or in the CO or NO
2 data. This is most likely due to substantial gaps in the
Alphington HiVol data in 2003 (26% of the maximum possible data is missing). In 2003, the five months with the most missing HiVol data are also five out of the six months with the highest PM
10
concentrations (as reported by the TEOM). If this assumption is correct, it indicates that the rise in concentrations in 2003 was experienced across Melbourne and is not related to the tunnels. It is also noticeable that in contrast to the previous review, from 2002 median concentrations at Madden Grove start to exceed those at the more central Grant Street site. Concentrations of CO are also higher at Madden Grove compared to Grant Street in 2001–03. Although it was noted above concentrations might be expected to to be higher at the more central Grant Street location, this reversal may have been due to previously enhanced concentrations at Grant Street due to local construction (unrelated to the tunnels) finishing in 2000.
Short-term measurements were also made during December 2000 to March 2001 at the base of the Burnley tunnel stack using a mobile laboratory, principally to investigate if downwash in the wake of the stack could be observed. This can occur during high wind periods when the stack emissions cannot escape the ‘cavity zone’ in the lee of the stack structure, potentially dragging practically undiluted tunnel emissions to ground level at the base of the stack and typically for a few tens of metres downwind. There are houses within this radius of the Burnley stack, and modelling suggested a risk of elevated concentrations there. Further measurements were made by TLO for a year (1 June 2001 to 31 August 2002). It was concluded that such downwash, although predicted in numerical modelling, could not be observed on site (EPA Victoria 2002a, 2003).
Supplementary monitoring was commissioned jointly by the City of Yarra and the City of Stonnington, representing the communities potentially affected by the tunnel emissions (City of Yarra and City of Stonnington 2002). Monitoring commenced early in 2000, the year of tunnel opening, and ceased in 2002. CO and PM
10 was measured at three sites near the Burnley tunnel
stack, one at 250 m from the stack in the location predicted by modelling to receive the maximum impact, and two more at 400 m and 650 m from the stack. The method to measure PM
10 was
noncompliant with Australian Standards, and deliberately so. The express intention was to detect short-term effects (order of minutes), which standard techniques (eg filter sampling) are not capable of doing. The output of the optical instrument used (TSI DustTrak) is not true PM
10, yet
the objective of identifying the tunnel stack emissions could still be achieved by correlating rises in one of the three monitors with periods when that monitor is downwind of the stack. During two years of monitoring no stack impact was detected. The choice of methods for monitoring PM
10, especially when using air quality as an indicator of health risk, is discussed further in
Section 7.6.
In summary, monitoring appears to show that the Burnley and Domain tunnel stack emissions have minimal effect on long-term measures of air quality. The difference between the measured concentrations of PM
10 near the stacks and at other locations in urban Melbourne is of a similar
order to the accuracy of the instrumentation employed. The evidence presented is insufficiently sensitive to determine whether there has been a localised improvement or worsening of air quality as a result of traffic being diverted into the tunnels.

aiR QUaLitY in anD aRoUnD tRaFFiC tUnneLS
80 | air quality near road tunnels
It is particularly relevant that EPA Victoria issues a licence to operate tunnels and requires a correction factor for TEOM PM
10 and PM
2.5 measures, which is not the case in New South Wales.
More information can be found in Appendix D.
5.5.3 SoDRa LanKen tUnneL, StoCKHoLM
Part of the inner ring-road of Stockholm consists of a major tunnel, which opened in 2004, with branches designed to remove traffic from ground level and from the city centre. A major monitoring and modelling study (SLB-analys 2006) revealed that the net result was a worsening of air quality near the tunnel portals (assuming tunnel ventilation at portals rather than stacks). The study also found an improvement in air quality at ground level over a wider area, including the city centre, due to both removal of traffic underground and a reduction in congestion at ground level. Overall total emissions increased by 2–3%, indicating that this new road system attracted extra traffic to the area, but the majority of the local population of 410 000 experienced an improvement in air quality. This was due to the slight redistribution of the effects of road traffic away from populated areas. It was calculated that 41% of all affected persons (ie 170 000) would experience a worsening of air quality and 59% (240 000) an improvement, although for most people the change would be minor. For most locations the changes were in the range –0.5 to +1.0 μg m–3 in PM
10 and –1.0 to +0.5 μg
m–3 in NOx (translating to < 0.2 ppm of NO
2). Increases in NO
x of up to 2 μg m–3 could be found
within approximately 1 km of the major portals affecting 10 000–20 000 people.
5.5.4 M5 eaSt tUnneL, SYDneY
The M5 East tunnel in Sydney is one of the world’s longest urban road tunnels with known in-tunnel air quality problems. It forms part of a strategic motorway network, so it could be argued that it has brought extra (ie nonlocal) traffic into its neighbourhood. However, in its submission to the enquiry by the NSW Parliament (2002), the NSW RTA reported reductions in traffic of 23–33% on the surrounding major roads, and a reduction in HDVs on alternative local roads of 77%. Ventilation is largely achieved via a stack, deliberately placed ~1 km away from the tunnel and away from residential areas. The building of an extra 1 km tunnel for ventilation incurred considerable additional capital costs, and the extra operational costs of drawing air along this tunnel are ongoing.
Due to the ambitious nature of this project and the controversies surrounding it, it is not surprising that extensive literature is available concerning its effects on the neighbourhood.
M5 east—pre-opening dispersion modelling
Extensive modelling of the stack impacts were conducted in the planning stages. A key issue was the effect of localised meteorology due to the stack being located in a valley. The valley is approximately 400 m wide and 30–40 m deep (see green topographical contours in Figure 5.4), whereas the stack is 35 m high (although different stack heights were considered in the planning stages). It has long been established that valley settings are disadvantageous for dispersion of stack emissions due to sheltering, recirculation and being more prone to local inversions (effectively putting a ‘lid’ on the valley) compared to open locations. Current dispersion models have limited success in predicting such effects at local (< 1 km) scales.
Pre-opening modelling was conducted using the industrial source complex model (ISC3) at 50 m resolution within a 2 km × 2 km square surrounding the stack. The contribution of the stack was modelled, as was a background (ie nonstack) contribution based upon ambient air quality monitoring data from Earlwood (1.4 km northwest of the stack). It was predicted that the stack would contribute in the order of 1% of the measured annual mean PM
10 at the four tunnel external monitoring sites
(see below) and 6–7% of the annual mean NO2 at three out of the four sites (~3% at site U1, north
of the stack) (Beyers et al 2003). The most significant effect appeared to be the predicted maximum NO
2 concentrations, which were of a similar order to the maximum background concentrations.
aiR QUaLitY in anD aRoUnD tRaFFiC tUnneLS
air quality near road tunnels | 81
M5 east—monitoring
Long-term monitoring has been conducted primarily in the neighbourhood of the ventilation stack (see locations on Figure 5.4). Two stations (denoted U1 and T1) have monitored key pollutants and one (T1) has monitored air toxics since June 2000, before the tunnel opening in late 2001. In January 2002 two more stations were added, one near the stack (X1) and a second station near the stack measuring air toxics (T3). These monitors form an arc around the north of the stack, with X1 and U1 located at the edge of the residential areas on the top of the north valley slope, ~400 m from the stack. Another monitoring site was installed just prior to tunnel opening, deep in the residential area directly above the tunnel approximately at its midpoint, ~800 m southwest of the stack (named CBMS). Beyers et al (2003) reported that the locations were selected on the basis of the pattern of maximum ground-level concentrations as predicted by dispersion modelling. Additional selection criteria were imposed by the Australian Standards 2922 and 2923. Under the Conditions of Approval, stations X1 and CBMS were required to be operational six months before the tunnel opened, however they did not become operational until after the tunnel opened and so no pre-operational data were collected from these stations.
Data for a year before and after tunnel opening, from monitors T1 and U1, were compared by Barnett et al (2003). Occasional high pollution values, especially PM
10, were related to background
sources not associated with the M5. Annual pollution roses were compared for NO, NO2, NO
x,
CO and PM10. No significant change in these roses (and hence mean concentrations) could be
detected between before and after the opening of the tunnel in directions where the monitor was downwind of the tunnel stack, or in any direction (except a change in NO in WNW winds that could not be attributed to the tunnel). Similarly, the roses of the four highest concentrations for each wind direction showed no significant change after tunnel opening compared to before. Although these results are in agreement with expectations, the methodology used would be insensitive to the size of expected impact, and the influence of changes in wind speed distribution between the two years was not adequately explored.
Beyers et al (2003) compared the monitored data at T1, U1, X1 and CBMS for just over a year (from opening in December 2001 to February 2003) to the predictions of the pre-opening ISC3 modelling (1995–06 and 1998 meteorology). This modelling assumed daily traffic volume of 77 000, whereas observed monthly average daily traffic volume rose from 59 000 to 84 000 during the period of monitor data. They found generally close agreement for NO
2, with predictions
slightly above monitored maxima and within 10% of monitored means. For PM10 the modelled
means, and especially the maxima, were found to be under predictions, but this was attributed largely to bushfires, which were not considered in this assessment. The predicted NMVOC concentrations could not be verified due to the nonexistence of appropriately comparable monitoring data. No correlations or time–series were provided, nor were there indications of the conditions or periods in which the model performed better or worse.
M5 east—post-opening modelling
Post-opening, further modelling was conducted (Hibberd 2003) to provide for the delineation of exposure zones to support the 2004 investigation into the possible health impacts of the M5 East motorway stack phase 2 by NSW Health (see Chapter 6). Residences were assigned to one of three zones, depending on the modelled exposure level. The ‘high’, ‘medium’ and ‘low’ zones represented exposure in the ranges 1.2–0.34 μg m–3, 0.34–0.2 μg m–3, and < 0.2 μg m–3, respectively. Hibberd used measured rather than modelled stack emission data and a different model from the initial pre-opening studies (the air pollution model [TAPM] rather than ISC3) to predict ground-level concentrations over the period February 2002 to January 2003. The effect of the stack was compared to a ‘background’ effect. This background was assessed using the monitor data available from the area around the tunnel, discussed above; the periods when each monitor was downwind of the stack (within ±60 degrees) and hence influenced by it, were screened. Although this methodology is not perfect, it is believed to be appropriate given the relatively small stack contribution and lack of alternatives. In each wind direction, either two or three monitors were available for use (monitors downwind were screened and not included). Additionally, the presence

aiR QUaLitY in anD aRoUnD tRaFFiC tUnneLS
82 | air quality near road tunnels
of a network allowed the contribution of the stack to be estimated by comparing the value at any monitor within ±10 degrees of immediately downwind with the other three monitors. Some filtering was required to remove outliers that would have excessively biased the results. The result was that the mean predicted stack contribution was less than the standard deviation, with five out of eight computed values (PM
10 and NO
x for four monitors) being negative. The concentration predicted
for the same periods by TAPM was also small compared to the standard deviation in the estimated stack contribution. It was thus concluded that the impact of the stack at the monitoring sites was too small to be detected by either measurement or modelling within the noise in the monitoring data. These techniques are an interesting use of a network of monitors and illustrate its versatility and value.
fiGure 5.6 Modelled contribution of stack emissions to annual average nox ground-level concentrations around the M5 east tunnel stack, february 2002 – January 2003
Modelled contribution of stack emissions to anual average NO2 ground-level concentration (µg m-3)
Add to the background concentration of 60.0 µg m-3
6246
6245
6244
6243
6242
326 327 328 329 330 331
MG
A94
Nor
thin
g (k
m)
MGA94 Easting(km)
CBMS, t1, t3, U, x1 and x1 are pollutant monitoring stations.
Source: Hibberd (2003)
This study indicated that the maximum ground-level concentrations of PM10, NO
x and NMVOC
were found 600–1200 m downwind of the stack during daytime. The spatial pattern reflected the trends in prevailing winds (Figure 5.4). Most importantly, the highest concentrations were predicted to occur both upstream and downstream within the valley, which is generally nonresidential. Monitor T1 lies to the edge of the downstream zone and therefore should respond to the stack contribution, although it lies in an area in which the model predicted a large spatial gradient. This would hamper any attempt to validate the modelling using monitored data. The upstream location falls between monitors. A third zone with lower concentrations was identified in the residential area on the plateau northwest of the valley. Based on this modelling alone, it would appear that monitor X1 was well placed to identify the affect on this community. The relatively small impact of the stack was indicated by maximum annual average ground-level concentrations of 0.16 μg m–3 (PM
10), 1.56 μg m–3 (NO
x) and 1.08 μg m–3 (NMVOC). The stack
emissions were found to contribute < 1% towards the annual PM10 average (ie stack contribution
plus estimated background) and < 3.6% for NOx. However, results must be interpreted with
caution as the data input into the model did not contain portal emissions, leading to an inappropriate study design and inaccurate exposure zones.
The modelling was repeated for September–November 2003 (Hibberd 2006)—the actual period of the NSW Health study—with the inclusion of portal emissions. This changed the exposure zones

aiR QUaLitY in anD aRoUnD tRaFFiC tUnneLS
air quality near road tunnels | 83
such that 31% of the area originally deemed ‘high’ was reclassified as ‘medium’, and 46% of the area designated ‘medium’ was reclassified as ‘high’. In addition, the exposure levels were adjusted such that the ‘high’, ‘medium’ and ‘low’ zones represented exposure in the ranges 6.3–0.54 μg m–3, 0.54–0.3 μg m–3, and < 0.3 μg m–3, respectively. Generally similar results were found (an example of this output is given in Figure 5.1) for areas around the stack. The major difference was the unexpectedly much higher concentrations predicted in a localised zone around the tunnel portals (generally by an order of magnitude), despite portal emissions being five times smaller than stack emissions, clearly demonstrating the extent to which portal emission can adversely affect large areas of residential land.
This modelling represented a very challenging scenario for TAPM, since it is a weather forecast model with a transport module. The assumptions included in the model pose restrictions on its applicability for very high resolution situations, such as portal and stack emissions. TAPM has been shown to adequately reproduce concentrations measured close to emission sources via the Lagrangian particle model (LPM) approach, however, the increased complexity of the approach does not compensate for its accuracy when used in relatively simple situations. A real improvement will only be found when using a TAPM–LPM module in connection with a very detailed topography (including buildings) and land-use classifications.
The validation of the meteorological simulation is insufficient to judge accuracy of the simulated steering of airflow through the valley, as the simulation was compared with measured wind direction at monitors not located in the valley. This review proposes that the prediction of the general spatial extent and shape of the areas affected by the stack are mostly correct, so that the largest effects are in mostly non- or marginally residential locations. The inaccuracy in modelled absolute concentrations is of limited concern considering that they are small in comparison to the background (ie nontunnel source) levels.
Whereas PM10 and NO
x emission data were derived from measurements of concentration and flow
rate in the stack, the NMVOC emission rates were estimated by applying a NMVOC to NOx factor
of 0.69, derived from fleet-averaged emission factor studies from Sydney in 1992 and Melbourne (EPA Victoria 1999). Given the long-term reductions in NMVOCs from vehicles noted in Chapter 4, it must be pointed out that this factor may well have been out of date both by the study year of 2003 and subsequently.
5.5.5 noRtH–SoUtH BYpaSS tUnneL, BRiSBane
This tunnel is under construction and, at 5 km, will be Australia’s longest. The air quality assessment prepared for the environmental impact statement for the tunnel (Holmes Air Sciences 2004) concluded that predictions of air quality in 2011 for a ‘build’ and a ‘no-build’ case are very similar, and that any difference would be difficult to detect by current measurement techniques. Increased concentrations of CO, NO
2 and PM
10 are predicted near roads carrying an increased
traffic volume as a result of the redistribution of traffic due to the tunnel, whereas air quality is slightly improved in the centre of the study area. For example, the maximum one hour average NO
2 at the Woolloongabba ambient monitoring station was predicted to be 2 μg m–3 higher in
the ‘build’ than the ‘no-build’ case, whereas difference of +1 and –8 μg m–3 were predicted at the Brisbane central business district and South Brisbane monitors, respectively. For PM
10 the effect
of the ‘build’ case on the maximum 24-hour concentration was +0.2, –0.1 and –0.3 μg m–3 for Woolloongabba, the central business district and South Brisbane, respectively. In Brisbane as a whole, emissions were predicted to be reduced in the ‘build’ case relative to the ‘no-build’ case due to the general reduction in congestion.
5.5.6 eaStLinK tUnneL, MeLBoURne
The predicted impact of emissions from the two Eastlink tunnel stacks on the surrounding neighbourhood has been modelled using Calpuff (ANE 2006, Thiess John Holland 2006). Calpuff was chosen over Ausplume due to its ability to model airflow in the complex topography of
aiR QUaLitY in anD aRoUnD tRaFFiC tUnneLS
84 | air quality near road tunnels
the Mullum Mullum Valley where the tunnel lies, and the associated sheltering and microscale meteorological variability. An intercomparison of Ausplume and Calpuff results at this site indicated that Calpuff provided more conservative results, with predicted concentrations 1.5 to 2.5 times higher.
Predicted maximum tunnel-stack contributions within the model domain (3 km × 3 km) were less than 1% of the predicted concentrations of CO, NO
2, PM
10 and PM
2.5 (one-hour averages).
Contributions to maximum three-minute averages were also calculated for xylenes (6%), toluene (9%), benzo(a)pyrene (12%), formaldehyde (14%), benzene (22%) and 1,3-butadiene (44%). In each case except PM
10 and PM
2.5, the predicted maximum concentrations were well below the EPA
design criteria. For particulates, the maximum existing concentrations were already more than double the design criteria before adding the < 1% increase due to the tunnel stacks. Long-term ambient monitoring is now in place. This tunnel is due to open in 2008.
5.6 PArticulAte MAtter includinG ultrAfine PArticles
The dispersion of PM is complicated by the aerosol processing which may occur in the dispersing plume and differential transport properties that are a function of particle size. Most dispersion modelling ignores all of this and assumes that PM
10 can be considered as a single coherent
pollutant with only one set of physical properties. In this way the modelled patterns of dispersion of PM
10 are identical to those of CO.
Particles have an increasing sedimentation velocity with increasing size and thus larger particles travel shorter distances before settling out of the atmosphere onto the surface. Consequently, particles from a road tunnel will make a negligible contribution to local PM
10 beyond the
immediate vicinity (up to ~100 m, and in most cases much less) of the tunnel portals or stacks and the roads feeding the tunnel. The maximum atmospheric residence and transport distance belongs to aged accumulation mode particles (~0.1–0.6 μm in size), typically composed of ammonium (and sodium in coastal locations), nitrate, sulfates and chlorides, with organic components, especially in urban areas. These particles usually form the most substantive contribution to PM
2.5
but, in general, are not formed in a tunnel as they are not directly formed in traffic emissions but indirectly through slow secondary atmospheric reactions. Consequently, in the neighbourhood of a tunnel, this fraction will dominate the local PM concentrations forming a ‘background’ concentration. A study in Brisbane found that concentrations of accumulation mode particles were raised above the background level downwind of a major highway, but only up to a distance of 15 m from the highway (Hitchens et al 2000). Ultrafine particles are generated in huge numbers in a tunnel, but are susceptible to rapid transformation during dispersion. In particular, it is known that in high concentrations ultrafine particles are likely to coagulate, forming fewer particles, with a shift in size distribution to larger sizes (see Section 4.4). Unless fresh particles are produced, the reduction in particle numbers will decrease the probability of further coagulation taking place, so that the rate of coagulation rapidly falls. In a plume, the rate of coagulation will also be reduced by dilution with fresh air, which acts to reduce concentrations.
The competition between these processes has been studied theoretically and in the laboratory. Field data have been gathered on aerosol processes in a plume downwind of busy roads and within street canyons. There is not yet a consensus between these studies; aerosol processing has some temperature dependence and ambient conditions need to be considered. Studies in warm conditions include that by Zhu et al (2002) who found evidence of coagulation up to 100 m downwind of a major freeway in Los Angeles. Particle number concentrations had diluted to a point where they were indistinguishable from the background, 300 m from the freeway. In a similar experiment in Brisbane, Hitchens et al (2000) found that particle number concentration decayed by half over 150 m. Reponen et al (2003) found particle numbers were reduced to half over 50–150 m, and to background levels by 400 m from major highways in Cincinnati. Gidhagen et al (2004) modelled field data from a busy roadside in the cooler rural Sweden and concluded that ultrafine particles were almost inert over the first 100 m. Most recently, urban measurements within 200 m of a major road in Helsinki also concluded that the effect of coagulation in
aiR QUaLitY in anD aRoUnD tRaFFiC tUnneLS
air quality near road tunnels | 85
general conditions was negligible (Pohjola et al 2007). However, a more detailed analysis of one particularly cold and still morning (Kerminen et al 2007) came to different conclusions in these particular conditions. During the first nine hours of this particular February morning, wind speeds were in the range 0–0.3 m s–1 and the temperature was –3 to –7°C. In these conditions, significant self and intermodal coagulation was observed, as well as condensation and evaporation processes between measurements made 9 m and 65 m from the road. The degree to which these processes were dependent on the low temperatures, and hence their applicability to Australia, is not clear. However, in summary, all of the above studies essentially agree that dilution is by far the dominant process, whereas coagulation has a minor or no role, depending upon local meteorology and emissions. In this sense, the dispersion of ultrafine particles (expressed as a number or a mass concentration) over the range of interest here (order of 0.1–1 km from the tunnel opening) can be reasonably approximated by the dispersion of a nontransforming (‘passive’) scalar, such as CO.
5.7 iMPActs on indoor Air QuAlity neAr roAd tunnels
The penetration of outdoor pollutants into indoor environments involves the same issues as penetration into a vehicle. In the absence of indoor sources, gases will generally penetrate fully, although there will be a timelag in the indoor response to rapid changes outdoors, determined by the AER, such that persons indoors may be offered some protection from the magnitude of short-term outdoor peaks. The AER is strongly dependent on local climate, meteorological conditions, building design, the presence of artificial ventilation and airconditioning, and on cultural preferences influencing how buildings are designed and used. The American Society of Heating, Refrigeration and Air-Conditioning Engineering (ASHRAE) recommends (in its Standard 62–1999, Ventilation for Acceptable Indoor Air Quality) that homes receive 0.35 air changes per hour. However, in practice, values ranging from 0.02 (a ‘well-sealed’ modern home) to over two (a ‘leaky’ home) have been observed when windows are closed, increasing beyond two if fans are used or windows and doors are open. Experiments on six typical New Zealand homes found a relationship with wind speed that varied from 0.012 to 0.053 air changes per hour per km/h of wind speed (Clarkson 1981). Penetration of PM can be size dependent in cases where the building is relatively well sealed and outdoor air can only penetrate through narrow openings, providing opportunities for impaction of larger, high-inertia particles. Smaller fine and ultrafine particles, however, are small enough to evade impaction and penetrate more like gases (Riley et al 2002).
A study in four apartments within 40 m of a busy Los Angeles freeway investigated in detail fine and ultrafine particle penetration as a function of size (Zhu et al 2005). Internal concentrations were found to be approximately equal to external concentrations when windows were open. With ‘natural ventilation’ (windows closed) AERs ranged from 0.31 to 1.11 h–1. The indoor to outdoor (I:O) ratio in terms of particle number concentration was a maximum at ~0.6 for larger ultrafine particles (ie around 70–100 nm in diameter). This corresponds to the typical size range in which most diesel-originated soot-based particles are found. Particles above 220 nm were not measured. A minimum I:O ratio of around 0.3–0.4 was found for particle sizes around 10–20 nm, corresponding to the size range of relatively fresh nanoparticles from petrol and diesel vehicle exhausts. This reduction was likely to enhance the deposition of these particles to surfaces due to their higher rate of diffusion, although the low detection limit of the instrumentation in this size range could also be a contributory factor.
Quite often, however, the issue is complicated by the presence of indoor sources of air pollutants, including CO, NO
2, VOCs, PAHs and PM. Smoking is an indoor source that will generally
overwhelm outdoor sources. Other key sources include cooking, heating (especially unflued heaters, wood and coal burning), and evaporative emissions from solvents and oils. Resuspension of dust due to personal movement can have a surprisingly large effect on PM
10 levels.

aiR QUaLitY in anD aRoUnD tRaFFiC tUnneLS
impacts of road tunnel air pollutants on human health | 87
6 imPActs of roAd tunnel Air PollutAnts on humAn heAlth
This chapter describes how air pollutants from road tunnels affect human health. It first summarises the types of exposure from tunnels, the adverse health effects caused by air pollution and the guidelines for assessing risks to human health.
The chapter presents findings from studies of specific tunnels (Section 6.4) and from studies of experimental exposures intended to represent tunnels (Section 6.5). It then discusses general health effects near road tunnels, and the results of various studies on health outcomes from exposure to traffic and to traffic exhaust. Section 6.9 describes the health effects associated with the main pollutants in vehicle exhaust.
The last two sections of this chapter provide conclusions and recommendations based on the findings of this section of the literature review.
6.1 tyPes of exPosure froM tunnels And relevAnce for HeAltH
This report has shown that the following types of exposure to altered quality of ambient air occur as a consequence of the presence of tunnels:
Residence in a neighbourhood close to tunnel outlets or stacks, with outdoor and indoor air •
quality considerations.
Transit through a tunnel in a vehicle—normal exposure to typical air quality off-peak.•
Transit through a tunnel in a vehicle—high exposure at daytime peaks.•
Transit through a tunnel—prolonged transit time due to congestion.•
Residence in a neighbourhood close to tunnel portals regularly used to vent emissions which act additively with emissions from surface freeways, with outdoor and indoor air quality considerations.
The likely pollutants associated with the five exposure settings types are discussed in Chapters 4 and 5 along with the various parameters of tunnels that influence pollutant concentration. Generally speaking, exposure data for these pollutants is not available for Australian tunnels. In order to clarify matters, some recommendations for future monitoring investigations are presented.
6.2 Adverse HeAltH effects AssociAted witH Air Pollution
Concern about the potential for adverse health effects from air pollution, especially combustion pollutants, is not new and has led to a wide variety of epidemiological and toxicological research directed at understanding the nature of these effects, the dose-response relationships and the consequences of combined exposures. The contributing influence of traffic exhaust to air quality has been a feature of recent ambient air quality health research.
As noted in Chapter 1, this report focuses on research literature specific to road tunnels, however, it is helpful to provide an overview of other types of urban (traffic) air pollution. This overview is not comprehensive but emphasises seminal and recent research. Selection of general papers about air pollution and health for inclusion in the overview is also based on their contribution to the primary purpose of this report, the review of health risks from road tunnels.
In the ‘six cities’ study in the United States, air pollution was positively associated with death from lung cancer and cardiopulmonary disease but not with death from all other causes. Mortality was most strongly associated with fine particulates, including sulfates (Dockery et al 1993). A re-analysis confirmed the 26% increase in all-cause mortality in the most polluted city (Steubenville, Ohio) compared to the least polluted city (Portage, Wisconsin) (Krewski et al 2005).

aiR QUaLitY in anD aRoUnD tRaFFiC tUnneLS
88 | impacts of road tunnel air pollutants on human health
Subsequently, other investigators have examined the association between urban air pollution and adverse outcomes for overall and cardiopulmonary mortality (Pope et al 1995, Samet et al 2000, Dab et al 2001, Pope et al 2002, Hoek et al 2002, Wong et al 2002), including the issue of potential greater susceptibility amongst older adults (Fischer et al 2003). A small-area spatial study in Los Angeles found an indicator for traffic emission exposure was associated more strongly with ischemic heart disease than with cardiopulmonary or all-cause mortality (Jerrett et al 2005). Effects for ischemic heart disease are possibly relevant to short-term effects from tunnels.
The overall association between urban air pollution and respiratory morbidity has also been investigated, including exacerbation of asthma, allergy and respiratory infections in both adults and children (Anderson et al 1997, Atkinson et al 1999, Kunzli et al 2000, Wong et al 2002, Heinrich 2003, Bernstein 2004, Chang et al 2004). In general, the literature has confirmed adverse effects, including the biological mechanisms through which PM is able to exert toxic effects (Sandstrom et al 2005). For children, although air pollution has long been thought to exacerbate minor acute illnesses, recent studies have suggested that air pollution, particularly traffic-related pollution, is associated with infant mortality and the development of asthma and atopy (Schwartz 2004).
Effects on cardiovascular disease from urban air pollution have been reported (Ponka and Virtanen 1996, Poloniecki et al 1997, Prescott et al 1998, Peters et al 2000, Zanobetti and Schwartz 2002, Lin et al 2003, Sunyer et al 2003, Chang et al 2004, Yang et al 2004, Fung et al 2005, Ruidavets et al 2005, Dockery and Stone 2007, Miller et al 2007). For clinically manifest coronary heart disease, particularly strong adverse effects were seen for residential proximity to a main road and age under 60 years or for people who had never smoked (Hoffman et al 2006). A case-cross-over study in Germany found nonfatal myocardial infarction associated with motor vehicle, motorcycle, bicycle or bus travel in the preceding one hour, giving an odds ratio of 2.73, 95%CI 2.06 to 3.61 (Peters et al 2004). A case-control study in Massachusetts found nonfatal myocardial infarction associated both with residential proximity to main roads and cumulative traffic within 100 m of residence (Tonne et al 2007). However, the interpretation of the results is limited by the concurrent impact of neighbourhood poverty and exposure classification difficulties. Plausible biological mechanisms for associations between cardiovascular disease and air pollution are presented by Bai et al (2007). Eventual clarification of these toxic mechanisms will be of particular significance to reversibility of effects and timing of onset, which is relevant to brief but intense tunnel exposures.
Evidence as to whether air pollutants are a primary cause of asthma is conflicting. Also uncertain is the extent to which asthma symptoms alter through exposure to traffic pollutants (Neas et al 1995, Brunekreef et al 1997, Yu et al 2001, Brauer et al 2002, Trasande and Thurston 2005, Schildcrout et al 2006). There is some evidence that ambient air pollution (mainly traffic related) contributes to incidence of asthma in children, although the effect is small (Zmirou et al 2004, Gilmour et al 2006). However, PM and O
3 may contribute to exacerbations and increased rates
of hospitalisation for asthma (Tatum and Shapiro 2005).
A link between air pollution, and impaired lung function and lung development in children and adolescents has been demonstrated in a range of longitudinal studies (Gauderman et al 2000, Gauderman et al 2002, Horak et al 2002) and locations (He et al 1993, Jedrychowski et al 1999). Impaired lung function in later life has been described as a major mortality risk (Hole et al 1996). Although the studies from California (Gauderman et al 2000, Gauderman et al 2002) are about exposure to busy roads, they are included here. The presence of heavy vehicles is a likely risk characteristic of the busy roads that were included. Road tunnels share similar vehicle characteristics to busy roads. Gauderman (2006) concludes that the risks to children from exposure to busy roads is to be avoided wherever possible and highlights the consequences to lifetime lung function and healthy survivorship if there is impairment of lung development while young.
A number of research studies concern effects of air pollution on fetal development including overall growth (birth weight) and preterm birth (Ha et al 2001, Glinianaia et al 2004, Maisonet et al 2004, Liu et al 2006, Rogers and Dunlop 2006). As for causation of asthma, findings vary. Effects on low birth weight were very small (Ha et al 2001) or questionable (Maisonet et al 2004). Rogers and Dunlop (2006) reported the possibility of reduction in the term of pregnancy associated

aiR QUaLitY in anD aRoUnD tRaFFiC tUnneLS
impacts of road tunnel air pollutants on human health | 89
with traffic exposure. The possibility of adverse effects on lung development in utero associated with maternal exposure to pollutants has been discussed, based on toxicological principles and some animal data (Pinkerton and Joad 2006). Epidemiological studies have shown an association between infant respiratory morbidity and exposure to pollutants after birth, but have not determined whether perinatal outcomes associated with pollutant exposure are related to timing of exposure before or after birth or both (Lacasana et al 2005).
Concerns that childhood development of cancer may be affected by traffic emissions have been discussed by Savitz (1989). However, in a large study with good power no increased cancer risk was found among offspring of mothers living in high traffic-density areas, either for all cancer sites or leukemia (Reynolds et al 2004).
6.2.1 aUStRaLaSian StUDieS
Studies of both hospitalisations and mortality studies for relevant urban air pollution effects have been conducted in several Australian cities. Recent Australasian work has sought to quantify the magnitude of the contribution of air pollution to adverse health status (Petroeschevsky et al 2001, WA Department of the Environment 2003, Barnett et al 2005, Simpson et al 2005, Barnett et al 2006). These publications have set the scene for recognition of the public health problem presented by traffic emissions. However, none presents a quantitative basis for evaluation of effects for tunnel users. This is because the tunnel exposures are short and intense, whereas the models used to quantify health effects for ambient urban pollution use information from daily or longer exposure periods. They also do not clarify whether residence near a tunnel confers additional risk compared to urban residence elsewhere.
Australian studies by Simpson et al (1997), Morgan et al (1998ab), Petroeschevsky et al (2001), and WA Department of the Environment (2003) estimate burdens of hospitalisation associated with air pollution and likewise estimates of mortality. No studies have been identified that address disability-adjusted life years in the context of road tunnel associated effects.
6.3 HuMAn HeAltH risk AssessMent Guidelines
This report presumes that the reader is familiar with the existence of and basis for WHO ambient air quality guidelines and the application of these guidelines in Australia. Generally, reliance on ambient air guidelines—where these are applied in residential areas—is sufficient for protection of public health except in the case of PM where no threshold for adverse health effects has been identified. However, exposure to vehicle combustion pollutants in and around tunnels may differ from exposure situations envisaged by the WHO guidelines, for example, the very high peaks that can and do arise at times within a tunnel for some pollutants. Although exposure to such high concentrations within a tunnel is usually brief, it may be repeated on a daily basis.
6.4 studies relAted to sPecific tunnels
Relevant literature on specific tunnels was identified using the search strategy shown in Appendix A.
6.4.1 tHe SYDneY M5 eaSt tUnneL
The report on the M5 Motorway3 should be read in light of the significant criticism it received. The study design did not allow any conclusions to be made regarding an association between portal emissions and health effects.
3 http://www.health.nsw.gov.au/public-health/ehb/buildings/m5_east_reports.html

aiR QUaLitY in anD aRoUnD tRaFFiC tUnneLS
90 | impacts of road tunnel air pollutants on human health
Investigation into the possible health impacts of the M5 East Motorway Stack (Phase 1) (2003)
The M5 East tunnel is a 4 km twin tunnel connecting Sydney airport with the south-western freeway at Bexley. It opened to traffic in December 2001. Due to community concerns about air quality associated with the tunnel, NSW Health has undertaken two studies: The M5 East in-tunnel monitoring study and The M5 East health investigation. The in-tunnel monitoring study collected pollutants inside and outside a vehicle traversing the tunnels during peak hours on weekdays for 6 weeks.
Summary: Despite extensive local air quality monitoring not demonstrating increased pollution levels following the opening of the tunnel NSW Health received health complaints from local residents. The M5 East health investigation aimed to determine whether symptoms reported by local residents were associated with stack emissions. The health investigation was conducted in 2 phases. In the first phase residents who felt they had symptoms caused by the stack emissions were assessed by specialist physicians. This phase enabled us to formulate a case-definition of potential stack associated health effects.
After opening of the ventilation stack, residents reported adverse odour experiences; these reports were independently confirmed in December 2001 using an odour diary approach. Since the air quality measurements and predictions had not anticipated health problems, an epidemiological investigation was developed to find out more about the effects of the tunnel on residents.
A qualitative survey was made to clarify the nature of symptoms experienced, eg eye irritation. An exposed group was then defined based on location and residents were recruited in order to identify any patterns of symptoms. Active recruitment of volunteers who considered themselves at risk from the tunnel led to inclusion of 54 people in the defined locality for potential tunnel impacts. Ages of participants were skewed to older adults, and females were over-represented compared to the resident population. Self-reported health status measures were lower than expected, but without statistical association for reported predisposition to allergy. Analysis for causation was impossible with this study design.
Investigation into the possible health impacts of the M5 East Motorway Stack (Phase 2) (2004)
In the second phase of the investigation exposure to stack emissions for the area around the stack was modelled and households allocated to relatively low, medium and high exposure zones. Approximately 500 adult residents from each zone were surveyed during October and November 2003, and their symptoms over the previous month were recorded.
Following the earlier symptom investigation in Phase 1, potentially affected residents were included in a cross-sectional survey of symptom prevalence. Low, medium and high exposure zones were defined geographically using modelling for predicted NO
x (as discussed in
Section 5.5.4) and within those zones a random selection of households was made. Residents were asked by telephone about the prevalence of (a) eye, throat and nose symptoms, (b) general health and mental health status, (c) odour, (d) chemical sensitivity and (e) environmental worry. With a household response rate of 59%, 1431 individual interviews were completed. The results did not show any trends across zones and the authors recommended that additional epidemiological investigations would not be scientifically justified.
This report was unanimously criticised by three independent reviewers and it was suggested that the conclusions not be accepted.
Investigation into the possible health impacts of the M5 East Motorway stack on the Turrella Community—Re-analysis Report, November 2006
Subsequent to the release of the Phase 2 Report, NSW Health was made aware that significant portal emissions had occurred during the study period. This had the potential to influence the geographical pattern of pollutant distribution from the tunnels. We have reanalysed the participant responses from the Phase 2 study using re-estimated exposure to tunnel pollutants based on actual stack and portal emissions data collected over the study period.

aiR QUaLitY in anD aRoUnD tRaFFiC tUnneLS
impacts of road tunnel air pollutants on human health | 91
This report has not been tested independently and as such the findings must be interpreted with caution based on the previous history of the study.
The Phase 2 study of the Turella community was re-analysed after a significant level of portal emissions during the study period was identified. This study consisted of redefinition of exposure zones with re-examination of data for prevalence trends. As before, no health trends were shown.
An associated report about air monitoring of the M5 tunnel and within vehicles is discussed in Chapters 3–5 of this report.
unpublished reports
There have been several reported incidences of travellers becoming incapacitated while travelling through the M5 tunnel. There have been a few instances reported where the driver has fainted and a report of a bus load of children becoming ill after spending more than 30 minutes in the tunnel. None of these incidents has been reported officially.
These studies among residents near the Sydney M5 tunnel are unusual in the amount of detail and effort taken to comprehensively assess possible health effects. Despite this, little in the way of concrete adverse health outcomes was identified.
6.4.2 BRiSBane noRtH–SoUtH BYpaSS tUnneL
O’Meara (2004) provides a health risk assessment of changes to NO2 and PM
10 resulting from
ventilation outlet changes and includes impacts on residential communities near feeder roads. It does not address the health impacts of brief elevated exposures in the tunnel on road tunnel users.
This report provides a clear account of the types of methodologies that can be used to determine health outcomes from pollutant exposures in air: chamber studies, time-series studies and short-term panel or cohort studies. It also presents information about the extent of effects on morbidity and mortality in Australia associated with variation in ambient concentrations of pollutants in air. Australian analyses of health outcomes are provided by Simpson et al (1997), Morgan et al (1998ab), etroeschevsky et al (2001) and WA Department of the Environment (2003). Long-term effects cited by O’Meara (2004) include decreased lung function growth in children, increased nonmalignant respiratory deaths and increased mortality from lung cancer.
The outcomes from the assessment were derived from a modelling exercise for NO2 and PM
variation in urban air attributable to the Brisbane North–South Bypass tunnel. The potential change in community health status was then estimated based on published dose-response and the predicted incremental change in air quality. The impacts of the tunnel on health were assessed as very small eg a one in 280 million increase in the risk of respiratory admission associated with PM on a maximal pollutant day.
6.5 studies of exPeriMentAl exPosures intended to rePresent tunnels
Some studies were identified that were designed specifically to assess human health outcomes after exposure to contaminated air from or within a road tunnel, or experimental conditions intended to replicate tunnel exposures.
salvi et al (1999)
This study was an experimental assessment of airway inflammation and peripheral blood cells in 15 human volunteers, performed with diesel exhaust exposure rather than exposure in a tunnel. It is included because it was carefully conducted using one-hour exposures to diluted diesel exhaust or fresh air with intermittent exercise, covering a combination of inflammatory

aiR QUaLitY in anD aRoUnD tRaFFiC tUnneLS
92 | impacts of road tunnel air pollutants on human health
markers (bronchoscopy followed with lavage and endobronchial biopsies) and physiological (lung function) measurements. Lung function measurements did not change but inflammatory markers were increased in bronchial lavage, biopsies and peripheral blood. The findings support biological plausibility for a causative role of diesel exhaust in adverse health effects. They also demonstrate that standard lung function measurement can underestimate the response to diesel exhaust.
svartengren et al (2000)
This is the only study we have identified that investigates the biological response in persons who spent time inside a road tunnel. It reports an experimental study of 20 adults with mild asthma sitting in stationary cars inside the Söderledstunnel in Stockholm for 30 minutes during peak hour. The exposures within the cars were: NO
2 range 203–462 μg m–3, PM
10 range 103–613 μg m–3 and
PM2.5
range 61–218 μg m–3. It may be significant that PM10 is much higher than PM
2.5, indicating
the presence of a large concentration of coarse particles. This experiment took place in winter 1997–98, when pollen levels were low. However, the widespread use of studded tyres generally leads to a large emission of coarse road dust. Smell and irritant symptoms were reported, but there were no symptoms of increased airway resistance. The more frequent questionnaire scores for smells, cough and noise within tunnels are not presented as percentages. Once out of the tunnel, an allergen challenge test measured an enhanced response, but there was no statistically significant difference from similar results on a control day. Later in the evening after the tunnel exposure, more asthma symptoms were reported than for a control period, using the same subjects but with urban air exposure.
The study concluded:
It is thus reasonable to assume that exposure to air pollutants for half an hour in a road tunnel can increase the bronchial response to allergens several hours after the exposure in individuals with allergic asthma. The findings suggest that exposure to car exhaust initiates a pro-inflammatory or inflammatory process in the bronchial mucosa. This state persists for ≥4 h and gives an extra impetus to the allergic reaction with accompanying deterioration of lung function. Such an interpretation, implying a pro-inflammatory effect of exposure to NO2 and particles, is supported by data obtained in human and animal exposure experiments. If this interpretation is correct, it is also likely that the inflammation increases bronchial responsiveness to not only allergens but also non-specific agents such as cold air and tobacco smoke, as well as exercise. The increase in bronchial responsiveness in the present study occurred without changes in lung function during exposure or in the interval before allergen exposure. There are other studies reporting similar findings with no observed effect on lung function during NO2 exposure, but which induced an increase in airway responsiveness to agents like histamine, methacholine or ozone. This makes it difficult for the exposed individual to be aware of the risk. [Our emphasis]
This study presents an interesting and relevant comparison with previous studies of the influence of NO
2 exposure on allergen response conducted in the laboratory in the absence of above-
ambient levels of PM. For instance, Strand et al (1998) exposed 16 subjects with mild asthma to 500 μg m–3 of NO
2 followed four hours later by exposure to birch or timothy pollen repeatedly
over four days. Compared to a control with zero NO2 exposure, the asthmatic response was
significantly increased. This study involved NO2 exposure duration of 30 minutes each time. The
lower NO2 concentration in the Svartengren tunnel study indicates that a lower NO
2 concentration
may elicit the same order of response in the presence of a raised particulate concentration.
Herbert et al (2001)
This study reports the health effects of vehicle emission occupational exposure among bridge and tunnel officers. It presents both respiratory and cardiovascular disease outcomes and supports an interpretation that urban air pollution can be related directly to traffic exposure. The direct relevance to tunnel users is, however, limited because the occupational exposure was for periods of hours each working day.

aiR QUaLitY in anD aRoUnD tRaFFiC tUnneLS
impacts of road tunnel air pollutants on human health | 93
brook et al (2002)
Healthy subjects were exposed to 150 μg m–3 concentrated ambient fine particles and 120 ppb O
3 for two hours. The particle exposure levels are similar to the scenario levels in road tunnels
predicted by NIWA (PM2.5
normal is 150 μg m–3 and high is 300 μg m-3), but the O3 exposure is far
higher than that likely in tunnels. Vehicle occupants will not be in a road tunnel for two hours, but the length of exposure allows for other travel-related exposure approaching and leaving the tunnel. An effect on vasoconstriction was detected. This was likely to be the result of immune responses triggered by exposure to pollutants, which is one suggested mechanism underlying the correlation between urban air pollution and cardiovascular mortality (Bai et al 2007).
Holgate et al (2003)
This study used human volunteers and assessed the impact of short-term exposure to diluted diesel exhaust on inflammatory parameters in human airways. Subjects were exposed to a concentration of diesel exhaust at 100 μg m–3 PM
10 for two hours. At this concentration, both the
control subjects and those with asthma demonstrated a modest but statistically significant increase in airway resistance following exposure to diesel exhaust.
barck et al (2002)
This study exposed 13 subjects with mild asthma and allergy to either purified air or 500 μg m–3 NO
2 for 30 minutes, and followed this with an allergen inhalation challenge. Lung function was
measured by plethysmography and then hourly by portable spirometry.
The results suggested that ambient NO2 can enhance allergic inflammatory reaction in the airways
without causing symptoms or pulmonary dysfunction. A subsequent study by Barck et al (2005) tested repeated 15-minute exposures and found effects after only two to three brief exposures to ambient levels of NO
2.
larsson et al (2007)
This study follows up the study by Svartengren et al (2000) by exposing 16 healthy adult nonsmoking volunteers, without a history of allergy, to air in the same tunnel. In this case, the subjects were exposed for two hours during the evening peak traffic period in a room within the tunnel structure with doors open to both bores. The subjects alternated 15 minutes intervals of light exercise on a bicycle ergometer with 15 minutes of rest. The volunteers underwent bronchoscopy with bronchial mucosal biopsies and bronchoalveolar lavage (BAL) once at 14 hours after exposure, and once after a control day with subjects exposed to urban air during normal activities.
The median exposures were: PM2.5
64 (range 46–81) μg m–3; PM10 176 (range 130–206) μg m–3;
NO2 230 (range 180–269) μg m–3; and CO 5.8 (range 1.2–7.0) ppm. These values are somewhat
lower than in the Svartengren study, but still typical to high for urban road tunnels in general (see Chapter 4). Exposure to road tunnel air resulted in a lower airway inflammatory response, with cell migration within the lower airways together with signs of an initiated signal transduction in the bronchial epithelium, but a progression beyond an early inflammatory state did not occur.
6.6 HeAltH effects neAr roAd tunnels
Another important aspect of risk for people living near tunnels is the quality of the air in the indoor environment, an area of great uncertainty. However, it is reasonable to assume that external air pollution concentrations are a reasonable estimate of indoor exposures. It is vital to establish what the localised pattern of air quality actually is in residential areas near tunnels.
There is very little published work on observed health effects of residential location near a tunnel. Only the Sydney M5 reports have been identifed as attempting to assess these effects in detail.

aiR QUaLitY in anD aRoUnD tRaFFiC tUnneLS
94 | impacts of road tunnel air pollutants on human health
A cross-sectional approach was taken, with various questionnaire and medical examinations conducted to investigate any adverse health patterns associated with the tunnel. The reports indicate that few adverse effects were found.
The only approach that sought to determine daily symptoms and road tunnel exposures was a quality of life questionnaire in the Sydney M5 Phase 1 study. Quality of life among the 54 exposed volunteers was found to be lower than the Australian norm in some categories but was not statistically significant once adjusted for age and gender of respondents. These results should be interpreted with caution due to the criticism they received. Residents were experiencing health problems at the time of this study, and it was only later discovered that portal emissions had been occurring contrary to the conditions of approval for the tunnel.
The NSW Health has commissioned a study in response to community and local council concerns regarding potential adverse health effects of the recently opened Lane Cove tunnel. The Air Quality and Respiratory Health Study is monitoring changes in traffic patterns and resulting health implications for residents as a result of the tunnel commencing operation. The study is assessing the health of 2000 residents in three locations near the tunnel and one control region away from the tunnel. The results of the study will be available in mid 20094.
6.7 studies on HeAltH outcoMes And coMMunity trAffic exPosure
A selection of epidemiological studies on adverse health outcomes and traffic exposure that appear similar to the road tunnel scenarios are presented. The Californian studies on lung development and distance from a freeway are highlighted because they are likely to be transferable to the mix of traffic, including HDVs found in Australian tunnels.
Gauderman et al (2002)
Air pollution (measured by residence vicinity to freeway) impairs lung development of children living in southern California. Reduced lung function development in childhood is proposed to translate into lung function deficit throughout life. Reduced lung function later in life has been described as second only to the exposure to tobacco smoke as a risk factor for death.
Gauderman et al (2004)
The results of this study indicate that current levels of air pollution have chronic, adverse effects on lung development in children from age 10 to 18 years, leading to clinically significant deficits in attained FEV
1 (the forced expiratory volume in the first second) as children reach adulthood.
A linear concentration-response relationship was observed between the proportion of children under 18 years of age with an FEV
1 of < 80% of predicted and long-term exposure to PM
2.5.
This exposure was determined through monitoring in each of the 12 communities from which the cohort was recruited. This is highly relevant to communities living near tunnels and stacks if these produce deterioration of the quality of the urban air compared to general levels of current air pollution. Associations for the effect were seen with NO
2 and PM
2.5, both of which
are components of tunnel emissions.
Mcconnell et al (2006)
A cohort study of children from 13 schools, recruited in 2003, was conducted to assess the relationship between localised traffic exposure and history of wheeze and asthma. Eligible children, 5341 of 8193, participated through completion of a questionnaire. Residence within 75 m of a major road was associated with an increased risk of lifetime asthma (OR 1.29, 95%
4http://www.health.nsw.gov.au/airquality/lc_tunnel.html (accessed 19 June 2007)

aiR QUaLitY in anD aRoUnD tRaFFiC tUnneLS
impacts of road tunnel air pollutants on human health | 95
CI 1.01 to 1.86), and recent wheeze (OR 2.74, 95% CI 1.71 to 4.39). These are important findings if transferable as a risk to children with residential proximity to tunnels and their approach roads. Transferability of the results from a single study is limited. The study response rate was 65%, which indicates a possibility of some bias in results if respondents differed from nonrespondents.
Gauderman et al (2007)
This prospective study followed 3677 children (average age 10 years), with annual lung function measurements, for eight years. Children who lived within 500 m of a freeway had significantly reduced eight-year lung function compared with those who lived at least 1500 m from a freeway: FEV
1 deficit of 81 mL; maximum midexpiratory flow rate deficit of 127 mL. Subgroups of children
with no asthma and no active tobacco use also showed this significant association between residential distance from a freeway and lung function. However, nonfreeway road distance was not associated with reduced lung function, which suggests the risk was associated with features of the emissions from a freeway. This is a relevant study for road tunnel risks in a residential neighbourhood, if the emission characteristics of busy freeways and tunnels are similar (see Chapter 4).
sandstrom and brunekreef (2007)
This commentary in the Lancet, in response to the publication of the cohort study by Gauderman et al (2007), noted various study limitations and discussed the need to determine which traffic-related components are responsible for specific health effects. ‘The roles of fuels, engines, exhaust gases, and particles (as well as components of road and vehicle wear) demand much attention to reduce the biomedical consequences of traffic pollution.’ They commented on research that has associated diesel exhaust with inflammatory effects in the bronchial wall together with adverse functional consequences.
6.8 studies on cellulAr And bioMArker exPeriMents relAted to trAffic exHAust
A single publication was identified reporting experimentally observed effects in cells and traffic-associated toxic materials from a road tunnel. There have been a number of studies of people exposed to traffic exhaust including police officers, street vendors and traffic wardens.
Hetland et al (2004)
This study investigated the potency of different size fractions of urban ambient air particles to induce release of inflammatory cytokines in the human alveolar cell line A549 and in primary rat type 2 cells. A mineral-rich ambient air PM
10 sample collected in a road tunnel was used
as a source of exposure. The road tunnel sample was from Norway in winter and is described as coarse material formed through abrasion of the road surface with studded tyres. Hence any differentiating toxicity features of the road tunnel particulate are not transferable to an Australian situation. However, the results from this study are of value in interpreting the applicability of the results from the Svartengren et al study (2000) which subjected asthmatic subjects to tunnel air in winter in Sweden, where PM is similarly mineral rich.
tomei et al (2001)
Urinary markers for benzene and PAH exposure were elevated in traffic policemen in Rome (Italy) compared to office workers, but the numbers were small and related to one exposure location. It is not possible to infer from this study that people exposed to traffic in an Australian tunnel will show measurable urinary markers for benzene because the exposure times are different.

aiR QUaLitY in anD aRoUnD tRaFFiC tUnneLS
96 | impacts of road tunnel air pollutants on human health
riediker et al (2004)
North Carolina State Highway Patrol troopers took part in a study among healthy young nonsmoking men to assess effects of PM
2.5 in vehicles during a nine-hour shift. Physiological
monitoring and monitoring of PM2.5
in the vehicles was carried out and associations with fixed ambient and roadside PM
2.5 were investigated. The in-vehicle exposure was generally lower than
the concentrations recorded at the outdoor fixed sites. This is not unexpected because the vehicles spent only a limited period of each shift in busy traffic and the vehicle envelope provided partial filtering of particles from outdoor sources. Mean nine-hour exposure was 24 μg m–3 of PM
2.5.
A few hours after exposure, undesirable effects were seen in vagal activity (ectopic beats), peripheral blood inflammatory markers (C-reactive protein) and coagulation markers (fibrinogen). Despite the lower in-vehicle concentrations, these effects were more strongly associated with in-vehicle PM
2.5 than external PM
2.5. The largest effect on heart-rate variability was seen on waking
the morning after the in-vehicle exposure. This study is significant in terms of road tunnels because it heralds cardiovascular effects that involve inflammation, coagulation and cardiac rhythm among a group at otherwise low risk for such outcomes. While the measured exposure was to PM
2.5, this arose in a setting of exhaust and highway air exposure within a vehicle and hence
reproduces some of the aspects of combined pollutant exposure that might arise in a tunnel.
cebulska-wasilewska et al (2005)
City policemen were studied to examine the effects of air pollutant exposure on lymphocytes as an indicator of mutagenic potential of the exposure. The results showed no statistical differences between levels of exposure or between nonsmokers and smokers. The paper discusses the results in terms of PAH exposure but the exposure was actually to urban traffic, which was not measured.
ruchirawat et al (2005)
People susceptible to traffic congestion in Bangkok, including street vendors and children at two high-exposure schools were studied. Exposures were measured for PAHs and benzene. Urinary 1-hydroxypyrene (1-OHP) and t,t-muconicacid (t,t-MA) were measured as health endpoints and showed elevations among exposed groups compared to controls. The presence of altered urinary markers (1-OHP and t,t-MA) for carcinogen exposure indicates the potential for increased carcinogenic risk as a long-term outcome.
6.9 HeAltH effects AssociAted witH sPecific PollutAnts
6.9.1 CaRBon MonoxiDe
CO becomes a danger to human health when there is a combustion source in an inadequately ventilated space. Underground tunnels and car park buildings are classic situations for public health risk, but improvements in vehicle engines have led to marked reductions in CO from exhaust (Section 4.2). Another demonstrated public health risk arises from tobacco smoking in an enclosed space, particularly in a motor vehicle, where there is also an additive risk from exhaust gases.
The health risks of CO have been included in the WHO ambient air quality guideline review (2000). CO binds with haemoglobin to form COHb, which reduces the oxygen-carrying capacity of the blood and impairs the release of oxygen to the tissues. The risks are particularly significant in pregnancy. Raised COHb levels are associated with risks of abnormal heart function and risks for vehicle accidents, possibly through short-term reversible neurological effects.
Excessive CO within a tunnel is dangerous, especially for people with ischemic heart disease and pregnant women. Tunnel design has traditionally been directed at ensuring concentrations remain below recommended short-term guidelines. Outside the tunnel the risk of excess exposure is greatly reduced (see Chapter 5).

aiR QUaLitY in anD aRoUnD tRaFFiC tUnneLS
impacts of road tunnel air pollutants on human health | 97
6.9.2 nitRogen DioxiDe
Oxides of nitrogen are especially important with regard to road tunnels because concentrations can become significantly elevated in poorly ventilated environments (see Chapters 2–3). Risks for elevations of NO
2 in the community nearby tunnels and stacks also require management.
The recent update summary from the WHO air quality guidelines (2006) reiterates that NO2 is
associated with various adverse impacts on health, including increased respiratory symptoms in children, onset of respiratory symptoms among infants and increased bronchitic symptoms for children with asthma. Other demonstrated effects among people with asthma include direct effects on lung function and increased bronchial responsiveness at levels of 200 μg m–3 and above.
A concern about NO2 exposure is whether short exposures to concentrations within a road
tunnel can be sufficient to produce adverse effects. The recent WHO global update for ambient air guidelines (WHO 2006) indicates that there are few studies of short exposures (30 minutes or less) to NO
2 at concentrations expected in tunnels (100–400 ppb). Svartengren et al (2000)
found significant increases in airway resistance and increased late-phase reaction to allergen challenge for subjects exposed for 30 minutes to tunnel air with > 160 ppm NO
2. Bylin et al (1988)
exposed people with mild asthma to controlled concentrations of NO2 for 30 minutes. There
was a significant increase in histamine reactivity after exposure to 270 ppb NO2, and a tendency
to increased reactivity with exposure to 140 ppb and 540 ppb. In another experiment, Bylin et al (1985) exposed mild asthmatic and normal subjects to NO
2 for 20 minutes. After exposure
to 480 ppb there was a significant increase in reaction to histamine in the asthmatic subjects. Histamine reactivity was not tested at lower concentrations. Airway resistance increased after 20 minutes exposure to 240 ppb NO
2 and decreased after exposure to 480 ppb. Other investigators
have used NO2 concentrations greater than 500 ppb. Of most relevance to tunnel exposures is the
work of Barck et al (2005), who exposed people with mild asthma to 500 ppb for 15 minutes on one day and repeated the exposure twice on the following day. Inflammatory markers increased in reaction to pollen challenge. None of these NO
2 exposure studies include people with moderate to
severe asthma. It is possible to infer that in congested situations, or where an event delays traffic in a tunnel, there are risks of adverse effects among those with asthma.
6.9.3 paRtiCULate MatteR
The recent global update summary from the WHO air quality guidelines (WHO 2006) summarises adverse effects due to PM of size 10 μm or less (PM
10).
The range of effects is broad, affecting the respiratory and cardiovascular systems and extending to children and adults and to a number of large, susceptible groups within the general population. The risk for various outcomes has been shown to increase with exposure and there is little evidence to suggest a threshold below which no adverse health effects would be anticipated. In fact, the lower range of concentrations at which adverse health effects has been demonstrated is not greatly above the background concentration. The epidemiological evidence shows adverse effects of particles after both short-term and long-term exposures.
Particulate matter in tunnels is usually raised compared with urban air and can become highly elevated (see Section 4.2). The main issue for tunnel health effects is the significance of an elevated exposure if it is only brief. This is an area of considerable uncertainty. Particulate matter in tunnels contains substances that are directly toxic or carcinogenic, in which case brief but repeated exposures can add to lifetime risk. Examples of known or suspected carcinogens present in road tunnel particulates are soot and PAHs (see Section 6.9.9).
6.9.4 DieSeL exHaUSt
Diesel engines and petrol engines produce different mixtures of combustion products. In particular, the diesel engine emits high particulate mass emissions, including fine and ultrafine components. Health effects from these are discussed in Section 6.9.5. Diesel exhaust consists of a complex

aiR QUaLitY in anD aRoUnD tRaFFiC tUnneLS
98 | impacts of road tunnel air pollutants on human health
internally and externally mixed aerosol system based on semivolatile organic compounds and soot. Diesel exhaust hydrocarbons and other organic compounds include volatile and nonvolatile components existing in both gas and particulate phases. These include substances that are toxic or carcinogenic and can be problematic when they undergo photochemical reactions or oxidise to form irritant substances. Diesel exhause is also a source of PAH, soluble organic fraction, aldehydes, SO
2, nitrous oxide and metal oxides. Although not prominent components of diesel
exhaust, benzene and formaldehyde are classified as carcinogens (see Sections 6.9.9 and 6.9.10).
Diesel exhaust is carcinogenic in its own right. The United States Office of the Environmental Health Hazard Assessment lists ‘Diesel exhaust’ as a toxic air contaminant with a chronic inhalation risk reference exposure level of 5 μg m–3 and cancer unit risk (increased risk per μg m–3) of (3 × 10⁻⁴ μg m–3)–1 over 70 years (300 cancers per million per 1 μg m–3 increased exposure).
6.9.5 ULtRaFine paRtiCLeS
The epidemiological associations between ambient levels of PM and adverse health effects are not explicable in terms of the toxicity of the various chemical compounds contained within PM (Valberg 2004). Morawska et al (2004) recently reviewed the literature on ultrafine particulate and health effects. At that time there was a relatively small number (eight) of epidemiological studies on this topic; most were conducted in the European ULTRA program. Primary adverse health outcomes were an overall increase in daily mortality, adverse respiratory health outcomes (similar to those seen with fine particle effects), possible increased cardiovascular disease mortality, increased asthma symptoms, possible inflammatory events in the lung with a cumulative effect over five days following exposure, and increased cardiovascular morbidity among those with chronic heart diseases. The acute effects for asthma were more severe for adults than children. The effects identified for ultrafine particles remain similar to those recognised for PM in general. As yet there is no consensus on which a PM marker is a good indicator of potential health effects.
6.9.6 SULFUR DioxiDe
The recent update summary from the WHO air quality guidelines (2006) summarises adverse effects from SO
2. It refers to controlled experiments with exercising asthma sufferers indicating
that some experience changes in lung function and respiratory symptoms after periods of exposure as short as 10 minutes. This is directly relevant to transit time through a busy tunnel. A protective guideline of 10 minutes at exposures of 500 μg m–3 is therefore recommended. Concentrations of SO
2 within tunnels are not routinely measured but where measured, are well
below this level.
Recent epidemiological studies are discussed in the WHO review update which recommends moving towards a lowered guideline exposure for a daily averaging time. This recommendation is relevant to communities living near tunnels if ambient air is affected by tunnel traffic. Health effects associated with ongoing exposures to SO
2 include all-age mortality, childhood respiratory
disease, and hospital admissions for cardiac disease. There remains uncertainty about the extent to which these adverse outcomes are due to SO
2 alone or to a mixture of pollutants, including
PM and O3.
6.9.7 oZone
Ozone concentrations are not elevated in road tunnels, however the following studies are presented for reasons of completeness.
In a recent review of mortality associated with O3, Levy et al (2007) discuss the commissioning in
2003 by the United States EPA of three independent reviews (Bell et al 2005, Ito et al (2005), Levy et al (2005). A contextual factor for the studies was a lack of clarity over whether mortality effects are caused by O
3 itself or by association with temperature changes or other pollutants, especially
particulate levels or sulphates. Levy et al (2007) conclude that reductions in O3 exposure will lead

aiR QUaLitY in anD aRoUnD tRaFFiC tUnneLS
impacts of road tunnel air pollutants on human health | 99
to reductions in premature mortality. The relevance to road tunnels is that quantifiable effects were shown to be associated with increases in one-hour exposures to elevated O
3 levels and with
a short lag time before death.
Levy et al (2005) found a mean estimate of 0.21% increase in daily mortality per 10 μg m–3 increase in one-hour maximum O
3 exposure. Analyses by Ito et al (2005) and Bell et al (2005)
were remarkably consistent with these findings. When expressed in a comparable manner, the three studies suggest a 0.4% increase in short-term mortality for each 10 ppb increase in one-hour maximum O
3. Most of the risk is in the warmer seasons and there is a probable lag time of up to
two days from exposure.
A registry of acute myocardial infarction in Toulouse, France was used to investigate various environmental factors associated with air pollution (Ruidavets et al 2005). The only risk factor to show a strongly positive association was O
3, with a lag of one to two days, and with a RR = 1.09
(95%CI, 1.03–1.15, p = 0.004) in people aged 55 to 64 for an O3 increase of 5 μg m–3 and a greater
risk among those without prior heart disease, RR = 1.14 (95%CI, 1.06–1.23, p = 0.0007).
6.9.8 LeaD
Since alkyl lead is no longer added to petrol as ‘anti-knock’ in Australia (and diesel fuel never contained lead additive), the possibility of lead exposure in tunnels is small. In motor vehicle exhaust from leaded petrol, more than 90% of the emission is inorganic lead and the residual organic lead compounds decompose within hours or days to lead oxide. Meta-analysis of 17 published studies from five continents found strong linear relationships between blood lead concentrations in the population and the average concentration of lead in the air and in gasoline. Australia initiated a successful program in the early 1990s for removal of lead in petrol. The associated decline in vehicle-associated lead exposure is mentioned in earlier chapters. Lead can persist in the environment near a busy road, following past deposition, but direct exposure through inhalation of traffic exhaust is no longer likely with these changes in fuels.
According to a comprehensive review of health outcomes associated with lead, the IARC found that: organic lead compounds are not classifiable as to their carcinogenicity to humans (Group 3) and inorganic lead compounds are probably carcinogenic to humans (Group 2A). The effects of lead exposure include increased risk of minor congenital abnormalities, intrauterine growth retardation, spontaneous abortion, delivery complications, delays in physical and mental development, lower intelligence quotient levels, shortened attention spans, impaired hearing, and increased behavioural problems. Fetuses at any stage of development and children under the age of six years are at the greatest risk of adverse health effects. This increased vulnerability is due to the fact that the brain and central nervous system is still developing. Recent studies have shown that even low levels (< 5 μg dL–1) of lead exposure can result in intelligence quotient deficits (IARC 2006).
6.9.9 BenZene
In Australia, benzene content in petrol has ranged from 1–5% v/v. Under the Fuel Quality Standards Act 2000, the maximum concentration was lowered to 1% from 1 January 2006. Benzene in petrol engine exhaust is a combination of unburned benzene from the fuel and benzene produced through incomplete combustion of petrol. One of the situations for highest exposure concentrations is inside a petrol vehicle, especially if someone is smoking. Public exposure to benzene in Australia is reviewed by NICNAS (2001) who reported the highest concentration of benzene in urban air in Australia of 7–38 ppb from the Sydney Cahill tunnel at peak hour in 1991. Clearly, public concerns about benzene risks associated with road tunnels have a firm basis, although the 1991 concentrations predated the reduction in benzene in petrol.
Benzene is classified as carcinogenic to humans (Group 1) by the IARC, a category that is used when there is sufficient evidence of carcinogenicity in humans. Benzene is a cause of leukemia in humans. The adverse effects of benzene have been reviewed by WHO (2000); the most significant

aiR QUaLitY in anD aRoUnD tRaFFiC tUnneLS
100 | impacts of road tunnel air pollutants on human health
effects include haemototoxicity, genotoxicity and carcinogenicity. These effects may be relevant for road tunnel users with repeated intense exposures over time, but may also be relevant to residential exposure risks in the vicinity of tunnels.
The WHO review preferred a model for risk estimate that gave equal weight to concentration and duration of exposure. Hence the accumulation of dose becomes the determinant of cancer risk. WHO (2000) proposed that the concentrations of airborne benzene associated with an excess lifetime leukemia risk of 1 in 10 000, 1 in 100 000 and 1 in a million are, respectively, 17, 1.7 and 0.17 μg m–3. NICNAS (2001) also regarded benzene as a genotoxic carcinogen and assessed the additional lifetime risk for leukemia as 0.2 in 1000 at an exposure level averaging 48 ppb over 40 years. Based on 1996 incidence figures for Australia, the lifetime risk for leukemia of any cause is 8.5 per thousand population.
Risks from chronic exposure to benzene can include bone marrow depression (leucopenia, anemia or thrombocytopenia). Brief intense exposures to polluted air in a road tunnel are unlikely to exceed the threshold to produce these effects.
6.9.10 FoRMaLDeHYDe
Formaldehyde is ubiquitous. It is released as a product of metabolism and produced in the course of both natural processes and human activities that involve the combustion of organic materials, for example bush fires, tobacco smoking and motor vehicle fuel combustion.
In 2004, a working group convened by the IARC Monographs Programme concluded that formaldehyde is carcinogenic to humans. They determined that there is sufficient evidence that formaldehyde causes nasopharyngeal cancer in humans, limited evidence for cancer of the nasal cavity and paranasal sinuses and ‘strong but not sufficient evidence’ for leukemia. A review by NICNAS (2006) considered formaldehyde to have weak genotoxic potential and concluded, based on the available nasopharyngeal cancer data, that formaldehyde should be regarded as carcinogenic to humans following inhalation exposure. This finding is not relevant to road tunnels as it depends on exceeding a concentration threshold unlikely to be encountered in road tunnels.
Apart from the carcinogenic risk, formaldehyde is toxic. Eye, nose and respiratory tract irritation occur above levels of 0.5 ppm. There is limited evidence that formaldehyde may elicit a respiratory response in some very sensitive individuals with bronchial hyperactivity. Formaldehyde is a sensitiser but the available human and animal data indicate gaseous formaldehyde is unlikely to induce respiratory sensitisation. The issue relevant to road tunnel exposure is that direct irritation may occur.
6.10 conclusions
6.10.1 LiMitationS oF ReSiDentiaL expoSURe inFoRMation
In order to assess the potential health effects on communities living around road tunnels, accurate estimates of any increased exposure to air pollutants due to the road tunnel are required. As detailed in earlier chapters, the available information suggests that, with the exception of homes near tunnel portals where there are significant emissions, any exposure to tunnel air pollutants is unlikely to be significantly above background levels.
6.10.2 LiKeLiHooD oF HeaLtH eFFeCtS
There is a possibility of short-term effects for tunnel users in busy traffic and a smaller risk of health impacts in the residential neighbourhood. Characteristics of the air within a tunnel most likely to affect users are particulate matter, including coarse, fine and ultrafine particles, carbon monoxide and NO
2.

aiR QUaLitY in anD aRoUnD tRaFFiC tUnneLS
impacts of road tunnel air pollutants on human health | 101
For tunnel users, possible effects include immediate or delayed aggravation of asthma. Accrued effects from repeated tunnel use might include small increases in lifetime risk of cancer and potential for increased bronchitic events or respiratory infection. NO
2 appears to be a key pollutant
for which guidelines and controls are needed, both as an air quality indicator and a health risk.
People who live near tunnels or their stacks may be at risk if the presence of the tunnel alters the ongoing quality of the neighbourhood ambient air. Risks to cardiorespiratory health may arise if there is exposure to contaminated air from road traffic emissions, including tunnel emissions. Important indicators of this risk are NO
2 and particulate levels. A particular concern
is the association between impaired lung development in children and emissions from traffic. Particulates and volatile compounds including benzene may produce an increased lifetime risk for cancer.
6.11 recoMMendAtions for HeAltH MonitorinG
6.11.1 ReSiDentiaL expoSURe
There is currently no useful indicator for monitoring health in people residentially exposed to tunnel emissions.
There is as yet no confirmed evidence that people in Australia living near tunnels or their stacks experience increased exposure to pollutants. However, residents near the M5 East tunnel and stack have consistently reported increased levels of dust fallout since the tunnel opening. Pollutant exposure levels for people living near tunnel portals or stacks should be investigated further.
Nitrogen dioxide and PM are important indicators for tunnel effects on residential air quality, and represent aspects of the pollutant mix that are likely to be associated with adverse cardiopulmonary effects. Benzene concentration measurement is recommended as a useful exposure determinant. Despite recent reductions of benzene in petrol, it is a carcinogen, is relatively simple to model and measure, and is an indicator for the presence of VOCs from traffic pollution.
If public concern remains high, without confirmation of elevated exposures, further investigations will no doubt be requested. Studies of daily irritant symptoms or minor respiratory morbidity may be more practical than attempts to measure major health outcomes. Minor symptoms arise more commonly in the population and their monitoring may clarify whether any small differences in exposure among localities are occurring, and whether these are associated with any adverse health patterns. However, results from minor morbidity surveys are also more subject to reporting bias than medically diagnosed events and can present difficulties in interpretation.
6.11.2 MonitoRing FoR oUtCoMeS aMong tUnneL USeRS
Monitoring implies ongoing regular ascertainment of an adverse event. Usually an outcome event becomes suitable for monitoring if it is clearly linked to the situation targeted in the monitoring. Human health event monitoring is not recommended at this time for tunnel users:
There is insufficient evidence to be able to attribute events such as asthma attacks, angina or •
acute respiratory infection directly to a tunnel exposure.
Adverse cardiopulmonary health outcomes, while clearly associated with exposures to high •
levels of traffic emissions in urban settings, are not individually attributable in a manner usual for monitoring emission events.
Case ascertainment would be highly problematic for outcomes that often present to primary •
health care providers, or are self-managed at the time of occurrence.
Current cancer risks can only be inferred using risk-factor-based estimations and exposure •
measurements. The timeframe for development of cancers implies that studies of cancer presentations are largely investigations of historic causation events.

aiR QUaLitY in anD aRoUnD tRaFFiC tUnneLS
102 | impacts of road tunnel air pollutants on human health
Instead of monitoring per se, another approach to adverse health outcome measurement could be considered such as carefully designed study(ies) to determine the extent to which major morbidity is associated with tunnel use including monitoring for trends. Such studies might consider the following factors:
Major morbidity, for example hospital presentation with cardiac or respiratory events, is •
associated with greater accuracy of diagnosis than minor morbidity.
Possible recruitment of people with asthma, which is a relatively common condition, to •
investigate patterns of exacerbation with or without tunnel use.
Another type of effect measurement uses questionnaires of common symptoms such as odour, cough and upper respiratory irritation. Such questionnaires were the main way that differences in health experience among residents were investigated in the Sydney M5 tunnel work. However, this approach requires a comparative or trend study design among a group in the community and is not suitable for individual event monitoring.
Approaches may be limited in power by the small proportion of all city residents who regularly use tunnels and/or the small size of exposure elevation above the background urban environment, once total daily exposure is accounted for. The above aspects and other methodological issues warrant consideration before public expectations can be raised about the benefits of research.

aiR QUaLitY in anD aRoUnD tRaFFiC tUnneLS
air quality and health risk management | 103
7 Air quAlity And heAlth risk mAnAgement
This chapter looks at how various factors affect air quality and can be managed to reduce health risk. It considers tunnel ventilation design and operation, visibility criteria and PM, exposure to NOx, traffic emission and control, advice to tunnel users and protection of ambient air quality.
7.1 tunnel ventilAtion desiGn And oPerAtion
7.1.1 in-tUnneL ConCentRation LiMit vaLUeS FoR HeaLtH pRoteCtion
The key way to manage air quality within and near road tunnels is the setting of in-tunnel concentration limits which must be achieved and maintained by ventilation systems. The key international body that provides advice on such issues is PIARC, which recommends a range of limits (see Table 7.1 below). The ‘normal’ CO operation limit of 100 ppm is based upon the WHO 15-minute guideline of 87 ppm. Limits for visibility are also provided, but for the purpose of safe driving rather than health protection. National agencies around the world have either adopted or adapted the PIARC recommendations. For example, a 15 minute limit of 87 ppm is applied in Sydney tunnels, 100 ppm at the tunnel midpoint in Norway, and 120 ppm in the United States.
CO has been chosen as a criterion of air quality; it is a traffic-dominated pollutant and is the only pollutant with WHO health-based guidelines with a relevant exposure time (15 minutes). However, since the adoption of this criterion, CO emissions have dramatically fallen. In the meantime NO
2 (and PM in some locations) have become the dominant traffic-related pollutants
of concern. PIARC have not released definitive recommendations for NO2 in tunnels and there
are scientific and technical challenges in managing compliance with NO2 limits (due to its
nonlinear processes and difficulties in monitoring, discussed further below). Nevertheless, some bodies have declared limit values for NO
2 (as shown in Table 7.2), but the variation between
the limits speaks for itself. The Norwegian NPRA has a limit of 1.5 ppm at the tunnel end and 0.75 ppm at its midpoint (NPRA 2004). As described in Chapter 4, exceedences of this limit have been observed but not acted upon because of the absence of NO
2 sensors in the tunnel.
tAble 7.1 PiArc recommended in-tunnel pollutant limits
carbon monoxide concentration
design year
1995 2010
traffic situation ppm ppm
Fluid peak traffic 50–100 km h-1 100 70
Daily congested traffic, standstill on all lanes 100 70
exceptional congested traffic, standstill on all lanes 150 100
planned maintenance work in a tunnel under traffic 30 20
Closing of the tunnel 250 200
ppm = parts per million
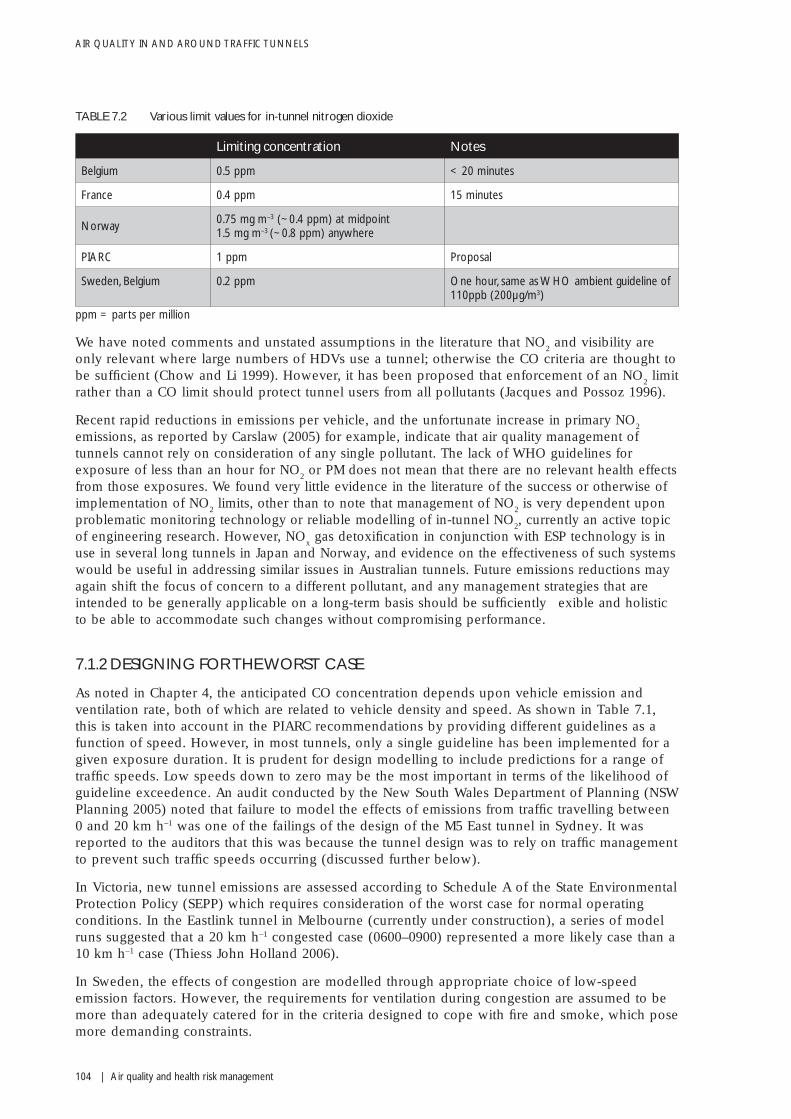
aiR QUaLitY in anD aRoUnD tRaFFiC tUnneLS
104 | air quality and health risk management
tAble 7.2 various limit values for in-tunnel nitrogen dioxide
limiting concentration notes
Belgium 0.5 ppm < 20 minutes
France 0.4 ppm 15 minutes
norway0.75 mg m–3 (~0.4 ppm) at midpoint 1.5 mg m–3 (~0.8 ppm) anywhere
piaRC 1 ppm proposal
Sweden, Belgium 0.2 ppm one hour, same as WHo ambient guideline of 110ppb (200μg/m3)
ppm = parts per million
We have noted comments and unstated assumptions in the literature that NO2 and visibility are
only relevant where large numbers of HDVs use a tunnel; otherwise the CO criteria are thought to be sufficient (Chow and Li 1999). However, it has been proposed that enforcement of an NO
2 limit
rather than a CO limit should protect tunnel users from all pollutants (Jacques and Possoz 1996).
Recent rapid reductions in emissions per vehicle, and the unfortunate increase in primary NO2
emissions, as reported by Carslaw (2005) for example, indicate that air quality management of tunnels cannot rely on consideration of any single pollutant. The lack of WHO guidelines for exposure of less than an hour for NO
2 or PM does not mean that there are no relevant health effects
from those exposures. We found very little evidence in the literature of the success or otherwise of implementation of NO
2 limits, other than to note that management of NO
2 is very dependent upon
problematic monitoring technology or reliable modelling of in-tunnel NO2, currently an active topic
of engineering research. However, NOx gas detoxification in conjunction with ESP technology is in
use in several long tunnels in Japan and Norway, and evidence on the effectiveness of such systems would be useful in addressing similar issues in Australian tunnels. Future emissions reductions may again shift the focus of concern to a different pollutant, and any management strategies that are intended to be generally applicable on a long-term basis should be sufficiently flexible and holistic to be able to accommodate such changes without compromising performance.
7.1.2 desiGninG for tHe worst cAse
As noted in Chapter 4, the anticipated CO concentration depends upon vehicle emission and ventilation rate, both of which are related to vehicle density and speed. As shown in Table 7.1, this is taken into account in the PIARC recommendations by providing different guidelines as a function of speed. However, in most tunnels, only a single guideline has been implemented for a given exposure duration. It is prudent for design modelling to include predictions for a range of traffic speeds. Low speeds down to zero may be the most important in terms of the likelihood of guideline exceedence. An audit conducted by the New South Wales Department of Planning (NSW Planning 2005) noted that failure to model the effects of emissions from traffic travelling between 0 and 20 km h–1 was one of the failings of the design of the M5 East tunnel in Sydney. It was reported to the auditors that this was because the tunnel design was to rely on traffic management to prevent such traffic speeds occurring (discussed further below).
In Victoria, new tunnel emissions are assessed according to Schedule A of the State Environmental Protection Policy (SEPP) which requires consideration of the worst case for normal operating conditions. In the Eastlink tunnel in Melbourne (currently under construction), a series of model runs suggested that a 20 km h–1 congested case (0600–0900) represented a more likely case than a 10 km h–1 case (Thiess John Holland 2006).
In Sweden, the effects of congestion are modelled through appropriate choice of low-speed emission factors. However, the requirements for ventilation during congestion are assumed to be more than adequately catered for in the criteria designed to cope with fire and smoke, which pose more demanding constraints.

aiR QUaLitY in anD aRoUnD tRaFFiC tUnneLS
air quality and health risk management | 105
7.1.3 SenSitivitY to tRaFFiC Data, HDvS anD CHoiCe oF eMiSSion FaCtoRS
For a given tunnel, the factor which most strongly determines its air quality is the rate of emission into its volume. If we assume that tunnel length, gradient, the local traffic fleet and fuel are fixed, then emission is most strongly controlled by the level of traffic and the proportion of HDVs, and good ventilation design rests on good traffic data and accurate emission factors.
The experience of the controversies surrounding the tunnels in Sydney, especially the M5 East, has provided an expensive (financially and politically) illustration of the crucial importance of the selection of accurate emission factors at the design stage. Williams et al (2000) noted that the widely used PIARC emission data (largely based on limited chassis dynamometer tests) underestimated PM
10 emission from Australian diesel vehicles by approximately half. Manins
(2007) found wide disparity between emission factors applied for the Australian fleet in design and environmental impact modelling for recent Australian tunnels. Crucially, he found that emission factors for PM
10 estimated from measurements made in the M5 East tunnel were higher
than the factors used in modelling in all Sydney tunnels (M5 East, Cross City and Lane Cove) by a factor of two. Accurate traffic prediction is also a crucial element. Traffic in the M5 East tunnel swiftly exceeded the design assumption after opening in December 2001. Annual growth of 0.9% was predicted in the first 10 years. Actual growth was 22% from February 2002 to Feburary 2003 (~70 000 to ~85 000 vehicles), with a further 16% growth from December 2002 to December 2003, leading to a flow of 95 000 vehicles by February 2004 (Manins 2005) and over 100 000 by 2006 (Manins 2005). Conversely, Manins (2007) reports a huge overestimation in traffic flow in the Cross City tunnel (30 000 vehicles actual compared to an estimated 90 000 or 112 000 vehicles after one year. This is undoubtedly partly related to toll avoidance and a reversal of surface road changes designed to feed traffic into the tunnel. Nevertheless, the tunnel design is now locked into the assumption of far more traffic than the ventilation was designed for. It is no surprise that the CO concentrations reported inside the tunnel are very low. Yet the Cross City tunnel has a relatively expensive (to both build and operate) ventilation system in which emissions are vented via a stack at one end only (the design changed from the simpler arrangement of a stack at each end after community objections). This required the construction of a separate, parallel ventilation tunnel. Management of air quality in and near tunnels is very dependent on the selection of emission factors and traffic predictions at the design stage.
Emission factors for many pollutants are much higher for HDVs compared to LDVs (see Chapter 4). This is especially true for PM
10, PM
2.5, EC and NO
x. Concentrations of these substances in tunnels
are sensitively dependent on the contribution of the heavy duty fraction of the fleet, especially if that fraction is likely to include poorly maintained gross polluters, trucks operating at high load or trucks operating on poor quality fuel. It has been shown in Sydney that accurate prediction of HDV patronage is crucial to the successful design and operation of tunnel ventilation (Manins 2007). In particular, on most major roads, the fraction that HDVs represent of all traffic varies during the day, and varies also between weekdays and Saturdays and Sundays; a variation by up to 30% would not be surprising. It is crucially important that this temporal variation in fleet mix is considered and predicted as accurately as possible at the design stage, rather than relying on the application of a constant or two-value fleet profile (Manins 2005).
7.1.4 ventiLation ContRoL anD tUnneL CLoSURe—tHeoRY anD iSSUeS
Once the ventilation system has been designed to prevent a certain concentration limit being breached, and the tunnel is built, there are limited opportunities to make changes. Limit values are also used in the management of the ventilation system. If the limit value is breached or likely to be breached, additional forced ventilation should be activated. However, this is not as simple as it sounds. A ‘live’ system will continuously monitor CO and/or visibility in the tunnel (preferably at multiple locations). Once a decision to activate extra ventilation is made there can be a significant time delay before the extra fans reach full speed. A simple system that switches the additional thrust on and off in response to threshold levels is liable to be unstable, rapidly switching fans

aiR QUaLitY in anD aRoUnD tRaFFiC tUnneLS
106 | air quality and health risk management
on and off in an uneconomical way. Changes in ventilation induce pressure changes in the tunnel that can have unpredictable effects on airflow and concentrations in other parts of the tunnel, especially in complex tunnels with curves, changes in gradient and branches. Experience in ventilating complex mineshafts has shown that a stable system is preferable to an optimal one (Jacques and Possoz 1996). Achieving a stable system can require complex airflow monitoring and computer modelling.
A system that reacts to changes in concentrations in the tunnel has a number of disadvantages. As it reacts to past events (changes in emission or airflow due to localised congestion, for instance, leading to localised rises in concentration), it is always trying to ‘catch-up’ and this timelag can lead to inherent dynamic instability. Such a system is also dependent upon monitor data which is prone to inaccuracy (see below). An alternative approach is not to react, but to anticipate. Such a system does not rely (entirely) on monitoring concentrations, but instead models those concentrations as, or preferably before, they happen, based on traffic data. At a basic level, this traffic data can be average traffic counts (preferably long term to establish variability). A more sophisticated system will make live observations of traffic flow. The predictive ability of the system is improved if traffic flow data upstream of the tunnel is available, giving vital extra minutes to calculate the expected emissions and concentrations in the tunnel, and to bring fans up to speed if necessary in advance of the predicted limit breach. Such a system requires a significant cost in terms of design and testing. However, in the case of a relatively polluted tunnel in which extra ventilation is regularly required, this is compensated by a lower operational cost in terms of energy saved from unnecessary fan operation.
7.1.5 ventiLation ContRoL anD tUnneL CLoSURe—pRaCtiCe
We found many examples of tunnels with optional forced ventilation systems in which busy traffic leads to high concentrations of NO
2 without the forced ventilation being activated. This has been
due to CO remaining below the locally specified limit value and the absence of NO2 monitoring
as part of the ventilation control system. In some cases the fans are automatically operated during peak periods as a preventative measure (eg Craeybeckx tunnel, Antwerp; Shing Mun, Hong Kong; Klaratunnel, Stockholm). Active ventilation control is entirely dependant on the accuracy and reliability of the monitoring equipment and the skill of the operators in interpreting the data. The possibility of monitor malfunction must be a serious consideration in reactive ventilation control. Filtration technologies, in operation in several tunnels in Japan, Norway, Vietnam and Hong Kong, can address these issues. ESPs have been reported to remove up to 90% of PM, and can be accompanied by NO
x gas detoxification systems to remove NO
2. These systems improve tunnel air
quality, external air quality or both.
Evidence of 10 exceedences of the CO guideline in the M5 East tunnel (87 ppm averaged over 15 minutes) was found by auditors between 5 March 2002 and 13 May 2003 (NSW Planning 2005). On four occasions traffic congestion was cited as the cause (including one vehicle breakdown incident and one flood). Five incidents were related to malfunctions of airflow sensors, and one incident related to incorrect operation of the ventilation system during a shutdown of the stack for maintenance work.
Several guidelines decree when a tunnel should be closed to traffic due to excessive levels of air pollutants. For example, in Norway, tunnels should be closed if CO in the tunnel midpoint exceeds 100 ppm for more than 15 minutes. Indrehus and Vassbotn (2001) reported that NO
2 levels reached
dangerously high levels in at least one tunnel, without triggering a closure, because the 100 ppm CO concentration was not reached, and monitoring of NO
2 was not part of the tunnel’s control system.
7.1.6 in-tUnneL MonitoRing
The interior of road tunnels presents a challenging environment for the measurement of air quality. Optical surfaces that are essential for measurements of opacity, and which are also essential elements of the chemi-luminescence instruments generally used to measure NO
2, are
exposed to a very dirty, dusty and sooty environment for long periods of time. Tunnels are often

aiR QUaLitY in anD aRoUnD tRaFFiC tUnneLS
air quality and health risk management | 107
cleaned using jet sprays including strong solvents or acids. Hence monitors require high levels of maintenance, protection and regular calibration. However, maintenance of any kind in a road tunnel is difficult and expensive due to the need to greatly reduce pollutant concentrations when personnel are likely to be spending prolonged periods of time in the tunnel (see Table 7.1). Monitors are generally not designed for use in tunnels and are usually deployed and operated by nonspecialists. As concentrations can vary significantly with depth into the tunnel, and potentially across the cross-section, the choice of monitor location is crucial.
The issue of the representativeness of the monitor can be overcome to some degree by using multiple monitors through the tunnel; control systems should not rely on a single monitor, especially considering the maintenance, reliability and accuracy issues. The M5 East tunnel contains four CO monitors in each tube. The Cross City tunnel contains a total of 18 CO monitors. The Shing Mun tunnel contains 10 sets of CO, NO, NO
2 and visibility monitors (Yao et al 2005).
Data should always be validated by regular calibration. We have noted an eight-month calibration schedule in the Bomlafjord tunnel in Norway (Indrehus and Aralt 2005).
To illustrate some of these issues it is interesting to consider two studies that have compared independently monitored data with data from the tunnel’s own monitoring systems. Permanent CO sensors will often be located in the roof of the tunnel. In the case of any potential negative vertical concentration gradient, roof-mounted CO sensors will under-represent the concentration at exposure heights (typically 1 m for cars, or 1–3 m for other vehicles). This possibility was studied by HKPU (2005) in the Shing Mun and Tseung Kwan O tunnels in Hong Kong. CO and NO data from the tunnel company were compared to that gathered by monitoring conducted by the research team at 1.5 m height above the roadway. Small differences were measured in the Tseung Kwan O tunnel, but in the Shing Mun tunnel mean exposure-height concentrations were 1.8 times higher than the tunnel company’s data in the northbound tube in winter, 1.6 times higher in the south tube in summer and 3.5 times higher in the south tube in winter. There were insufficient data in the report to assess the degree to which this discrepancy could be explained by other factors (eg sensor accuracy, lateral location, averaging time, etc).
A comparison between CO concentrations measured from the roof of a moving vehicle and from tunnel company monitors was made in the M5 East tunnel in Sydney (SESPHU 2003). Of 32 eastbound transects in the morning, only measurements from one of eight fixed monitors showed a correlation with mobile measurements. All eight monitor values were highly correlated with mobile values on westbound journeys. The highest correlation was for one sensor and eastbound afternoon journeys, with the following relationship: monitor value = 1.36 × mobile value + 20.02.
In September 2002, the NSW Department of Infrastructure, Planning and Natural Resources requested that they be notified of any exceedences of 200 ppm of CO as a three-minute average at any monitor. In order to provide such information, the operating scales of CO monitors in the M5 East tunnel were reset in July 2003 from 0–100 ppm to 0–300 ppm. This change potentially reduced the accuracy of the data from the monitors, from ±8 ppm to ±24 ppm, although this conclusion is dependent upon a disputed interpretation of manufacturer’s data (NSW Planning 2005). A comparison between one of the CO monitors and an infra-red absorption instrument was conducted between 1 April 2004 and 5 April 2004. If the infra-red instrument is assumed to have been accurate, then it gave readings between –5 ppm and +1 ppm of the monitor value. In-tunnel monitors are more prone to drift errors than those in nontunnel environments. Consequently, the maintenance schedule was amended for monitors in the M5 East tunnel, requiring monitors to be removed and calibrated every six months, protection of the monitors during tunnel wall washing (followed by another calibration) and weekly checks by comparison with the nearest monitor.
Airflow sensors are critical items in a ventilation system. Of 10 exceedences of the CO limit value in the M5 East tunnel identified by auditors in 2002–03, five were due to malfunction of airflow sensors (NSW Planning 2005).

aiR QUaLitY in anD aRoUnD tRaFFiC tUnneLS
108 | air quality and health risk management
7.1.7 enviRonMentaL appRovaL, ConDitionS anD LiCenCing
Tunnel air quality and health risks can be managed through a legal framework. These frameworks are notably different in Victoria and New South Wales.
In Victoria, the City Link and Eastlink tunnels are Scheduled Premises under Environment Protection Scheduled Premises and Exemptions Regulations requiring works approval and licencing by EPA Victoria. Works approval depends on the applicant demonstrating that the emissions comply with the State Environmental Protection Policy—Air Quality Management, or SEPP (AQM) (or in the case of City Link, SEPP (the Air Environment)). The SEPP requires all sources of emissions in Victoria to be managed to ensure that the beneficial uses specified in the SEPP are protected. These include protection of the life, health and wellbeing of people. All emissions must be controlled by the application of best-practice emissions management or, in the case of Class 3 indicators (such as benzene), to the maximum extent achievable. Modelling of residual emissions remaining after the application of appropriate emission controls must be done in accordance with Schedule C of the SEPP (AQM) and must include background concentrations. Schedule A of the SEPP (AQM) establishes design criteria that are used in the assessment of the design of new sources of emissions such as the tunnel ventilation stacks. Predicted maximum ground-level concentrations arising from residual emissions plus background in the source vicinity are assessed against the design criteria. Concentrations are specified for Class 1 pollutants (NO
2,
CO and PM10), Class 2 pollutants (formaldehyde and PM
2.5 on the basis of toxicity, and xylenes and
toluene on the basis of odour) and Class 3 carcinogenic pollutants (benzene, 1,3-butadiene and PAHs as BaP). If design criteria are exceeded, and no further emissions controls can be applied, then an impact assessment is required to ensure that the beneficial uses are protected.
Schedule B of the SEPP(AQM) sets intervention levels to be used in the assessment of local or neighbourhood air monitoring. An intervention level is numerically greater than the design criteria for a given contaminant as it does not apply to an individual source but to all sources of the contaminant within a defined area. The requirements for in-tunnel air quality are specified in the works approval and licence. Works approval and licence also require an environmental improvement plan which specifies management and monitoring and reporting post-opening. The licence also specifies mass discharge limits that have been set to ensure that under the approved design the design criteria in the SEPP (AQM) are not exceeded. The licence discharge limits are subject to licence fees. Emission of Class 3 indicators attracts a higher licence fee. Breaches of licence limits and conditions incur enforcement action and may lead to prosecution under the provision of the Environment Protection Act 1970.
7.2 visibility criteriA And MAnAGeMent of PArticulAte MAtter in tunnels
7.2.1 in-tUnneL viSiBiLitY gUiDeLineS
In addition to the widely adopted CO guidelines, limit values for visibility in tunnels are also provided. The visibility guidelines are strictly intended to manage safety by ensuring that vehicles have enough visibility to able to respond to an incident on the road ahead. However, the visibility in a tunnel is directly related to the presence of particles large enough to scatter visible light. This essentially means particles of diameter greater than 0.4 μm and especially dark particles, such as soot. Such particles have known effects on human health, so monitoring visibility also provides the potential for an alternative assessment of the air quality and health risk within a tunnel. This assessment is limited by the short duration of exposure in tunnels compared to the longer exposure times for which the health effects of particles are established. However there is no safe minimum threshold for particles, and so visibility cannot reliably be used as a criterion for health risk.

aiR QUaLitY in anD aRoUnD tRaFFiC tUnneLS
air quality and health risk management | 109
Visibility guidelines are expressed in terms of the extinction coefficient in units of m–1. PIARC (2000) provides these subjective impressions of different values:
0.003 m• –1 clear air
0.007 m• –1 haziness
0.009 m• –1 foggy
0.012 m• –1 uncomfortable, yet will allow a vehicle to stop safely.
The commonly applied visibility limits are listed in Table 7.3.
tAble 7.3 PiArc recommended in-tunnel visibility limits
visibility
extinction transmission
coefficient k (beam length: 100 m)
traffic situation km–1 %
Fluid peak traffic 50–100 km h–1 0.005 60
Daily congested traffic, standstill on all lanes 0.007 50
exceptional congested traffic, standstill on all lanes 0.009 40
planned maintenance work in a tunnel under traffic 0.003 75
Closing of the tunnel 0.012 30
Source: PIARC (2004)
7.2.2 eStiMating paRtiCLe ConCentRationS FRoM viSiBiLitY MonitoRS
As visibility monitors respond to the presence of PM there has understandably been some interest in using these monitors to provide PM
10 data. Manins (2005) reports on the estimation of PM
10
from measurements of in-tunnel visibility. He states that PIARC (1995) provides a conversion factor to derive PM
10 concentrations from turbidity:
1000 • μg m–3 = 0.0045 m–1.
The NSW RTA reported to a parliamentary inquiry (NSW Parliament 2002) that visibility in the M5 East tunnel in the first year of operation was generally below 0.005 m–1 with a maximum of 0.0068 m–1. Data from the M5 East tunnel was used to test the relationship with PM
10. An
approximately linear relationship was found, but with an offset, such that
1000 • μg m–3 = 0.0025 m–1
2320 • μg m–3 = 0.0045 m–1
The consequence is that the PIARC factor underestimates PM10 concentrations derived from
visibility in this tunnel by a factor of approximately two. Manins (2005) argued that this discrepancy is due to the relatively high proportion of gross emitting HDVs in the Australian fleet, whose emissions are biased towards larger particles.
The Norwegian authority (NPRA 2004) presents a different approach to the management of visibility. It sets a guideline limit for a maximum visibility-reducing particle content of 1.5 mg m–3. This content can be estimated as follows:
P•vis
= pvis
(Mt + 0.08 M
1) k
hh × k
s × L [mg h–1]
where P•vis
= quantity of soot produced in the tunnel [mg h–1]
p•vis
= basic value for soot production per heavy vehicle determined at 750 mg h–1 [mg veh·km–1]
aiR QUaLitY in anD aRoUnD tRaFFiC tUnneLS
110 | air quality and health risk management
M•t = traffic volume, heavy vehicles [veh h–1]
M•l = traffic volume, light vehicles, [veh h–1].
k•hh
= correction factor for height above sea level for tunnels > 400 m asl
k•s = correction factor for driving uphill (an approximately linear relationship with % gradient
so that emission increases by 43% for each 1% of gradient up to 6%). ks = 0.5 is used for
downhill gradients
L = tunnel length [km].•
The formula estimates that LDVs emit 8% more visibility-reducing particles as HDVs.
The Norwegian guideline also states that the limit value is half (ie 0.75 mg m–3) at the tunnel midpoint. In tunnels where PM has a significant EC component, drivers will complain about poor visibility at levels below 0.75 mg m–3 (Indrehus and Aralt 2005).
In Norway, ventilation control using direct monitoring of visibility (ie extinction coefficient, expressed in m–1) was found to be inaccurate and led to inappropriate activation of fans (Indrehus and Aralt 2005). The NPRA West Region installed aerosol optical scattering monitors in some tunnels, giving an output in μg m–3, derived through application of a calibration. Wedberg (2000) compared the output of such a sensor to a gravimetric PM
10 instrument over six days in the
Nygaard tunnel in Bergen (860 m long, 12 500 vehicles per day). The installed sensor in this tunnel was used as part of a control system to trigger the operation of an ESP filtration system. A strong correlation was found between the two instruments in the range 50–300 μg m–3 (agreement within ±10%). Disagreement occurred when the pavement was wet, with the optical monitor over-reading by approximately 40%. This was attributed to the formation of a mist of spray droplets generated by vehicle tyre contact with the road, especially behind large vehicles. Such a mist will scatter light, but the particles involved are probably too large to penetrate into the gravimetric monitor. This effect could be adjusted for by recalibration of the monitor, but it was felt that this was not required due to the relatively low aerosol concentrations during rainfall events. This study estimated that LDVs contributed only 1% of the emission of visibility-reducing particles in summer, indicating that visibility monitors may be heavily biased towards the impact of HDV emissions.
7.2.3 tHe USe oF viSiBiLitY oR aeRoSoL MonitoRS in ventiLation ContRoL
The existence of limit values for CO and visibility means that measurements of either or both can be used to control ventilation. For example, the Central Artery tunnel in Boston uses only CO monitors to meet both CO and visibility guidelines (Betchel/Parkers Brinkerhoff 2006). This may be due to the relatively low contribution of diesel-engined vehicles and HDVs on this route. Measurements of visibility are directly used in ventilation control in many tunnels, including the Kingsway tunnel, Liverpool (Imhof et al 2006) and the Tauerntunnel, Austria (Schmid et al 2001).
Optical aerosol monitors have been installed in some Norwegian tunnels for ventilation control. The Bomlafjord tunnel in Norway is a 7.9 km long subsea tunnel. It has a single bidirectional tube and carries approximately 2500 vehicles per day. Despite low emission levels, such a tunnel has significant ventilation demands due to its length, significant gradients (maximum 8.5% for the Bomlafjord), the inability to vent midlength and the lack of piston effect. In the Bomlafjord tunnel, a longitudinal system was installed with axial fans triggered initially by CO and NO measurements monitoring. In the first year of operation the operational cost of the ventilation system was deemed to be very high and multiple complaints of poor visibility were made, despite limit values not being exceeded. In the light of long-term CO emission reductions, and the difficulties in measurement of NO and NO
2 in tunnels (discussed further below) a new control system
was implemented using optical particle monitors. The system included four steps of increased ventilation triggered at 75, 150, 225 and 300 μg m–3.
aiR QUaLitY in anD aRoUnD tRaFFiC tUnneLS
air quality and health risk management | 111
The effectiveness of this arrangement to protect users from high concentrations of CO and NO2
was the subject of a six-week monitoring study in 2001–02 by Indrehus and Aralt (2005). They found that the optimisation brought about a 15% decrease in electrical consumption. During this period the NPRA limit for aerosol (0.75 mg m–3 at the midpoint) was not breached (mean at the two monitors nearest to the midpoint was 66.5–99.4 μg m–3 with a maximum of 673 μg m–3). The CO concentrations were far below the limit of 100 ppm at the midpoint (mean at the two monitors nearest to the midpoint was 3.6–12.6 ppm with a maximum of 47.4 ppm). The success of the ventilation scheme in protecting users from NO
2 was assessed by converting the limit value
for NO2 (1.5 ppm, or 0.75 ppm at the midpoint) into an equivalent limit for NO, based on the
assumption of a NO2:NO
x ratio of 0.1. There is some uncertainty on what this ratio should be as
it varies between tunnels because of differences in length, ventilation, background oxidants and emissions (see Section 4.2). Nevertheless, with a ratio of 0.1 it was found that the NO (and by implication NO
2) limit values were not breached; however, NO came closer to breaching the limit
than CO.
7.2.4 tUnneL FiLtRation BY eLeCtRoStatiC pReCipitation
Electrostatic precipitator (ESP) technology has been installed in a number of tunnels in Japan, Spain and Norway with the intention of specifically addressing the need to meet visibility limits (except in the 24.5 km Laerdal tunnel in Norway where ESP technology has been installed with the explicit intention of managing air quality and minimising health risks to users as well as maintaining visibility). ESP technology is potentially appropriate in situations where particle emissions are especially high relative to gaseous emissions. However when used in conjunction with NO
x gas detoxification systems, it can also be used in situations with high gaseous emissions and VOCs, such as tunnels with very high emissions of soot from HDVs. ESPs are also appropriate where an increased supply of fresh air is unavailable or especially expensive to provide. Unlike the general ventilation controls discussed above, ESP filtration controls particulate concentrations only, leaving gaseous concentrations unaffected. Thus, in particle-dominated tunnels where the visibility limit is more likely to be breached than the CO limit, ESP technology provides the possibility of maintaining air quality without the extra operational cost of increasing the ventilation rate. ESP technology also potentially provides additional benefits by reducing the emission of PM into the external environment. The environmental benefits of ESP technology should always be balanced against its environmental costs, including energy costs and treatment and disposal of the collected particulate mass. Experimental evidence from Norway shows that a 50% saving can be achieved using ESP filtration compared with conventional ventilation (EPA Victoria 2006). Estimates from Japan are that ESP technology costs at least 30% less than conventional ventilation operational costs (EPA Victoria 2006).
The use and status of ESP technology around the world has been reviewed by Child and Associates (2004), and our review found no further new information. In June 2006, Child (pers comm) provided further information to NSW RTA on the progress of the filtration installations in Madrid. He noted:
In my view, changes in circumstances—in particular the proposed use of air treatment technology in the Madrid Calle 30 project—now provide a sound basis for a further evaluation of the use of appropriate air treatment technology in the M5 East Tunnel as generally described below. It is my recommendation that the NSW RTA considers the installation of an air treatment system able to process 200-250 cubic meters per second of tunnel air at the western end of the M5 tunnel.
The significance of this suggestion is that such an installation would remove the necessity to vent unfiltered air from the portal at Bexley North and meet, in part, the demands of the local community (which also wants the same degree of treatment at the Marsh St end of the tunnel).
There is no evidence on the effect of ESP technology on external air quality. It is therefore suggested that evidence from existing operational ESP and NO
x gas detoxification systems be
analysed. ESP systems are generally used on an as needed basis, with those used for external air quality being used more extensively than those used to improve in-tunnel visibility.

aiR QUaLitY in anD aRoUnD tRaFFiC tUnneLS
112 | air quality and health risk management
ESP technology has been in use in Japen for 25 years, with approximately 40 tunnels using the technology, seven in urban areas. Seven tunnels in Norway use ESP technology, and have done for six years. Of those seven, six were installed to improve in-tunnel visibility, with only one being installed to improve external AAQ. More recently, ESPs have been installed in Madrid, Vietnam, Korea and Italy. Based on this widespread use over the last 25 years it is assumed that there are sufficient data to conduct an analysis of the effect of ESPs on external air quality. The analysis should be used to inform debate on the relative benefits and costs of the systems compared to ventilation cost saving and potential health and environmental benefits.
7.3 MAnAGinG exPosure to oxides of nitroGen
7.3.1 MonitoRing oxiDeS oF nitRogen
Several studies have noted the particular difficulties involved in the reliable and accurate monitoring of NO and/or NO
2 in road tunnels. Jacques and Possoz (1996) noted that the chemiluminescence
method, used routinely in ambient monitoring stations around the world, is accurate only up to 1 mg m–3 (approximately 500 ppb).
…its implementation as a practical measurement technique results in a very sophisticated and expensive instrument that must be handled with care. To our knowledge no such devices have ever been specially designed to be installed in the adverse environmental conditions that exist in a tunnel… The full scale measurement range is programmed to be 1 ppm.
Indrehus and Aralt (2005) noted that chemiluminescence monitors demand a very high degree of maintenance due to their exposure to high aerosol levels, resulting in a high cost that needs to be justified. An alternative is to use electrochemical sensors, but these have very low accuracy (of the same order as the NO
2 in-tunnel limit values). A low-maintenance open-path optical
technique (DOAS, or differential optical absorption spectroscopy) is employed to monitor NO at two locations per tube in the M5 East tunnel, but this method also has a low accuracy in this enviroment, especially in optically turbid conditions.
7.3.2 MoDeLLing no2 FoR ventiLation ContRoL
As NO is routinely measured in a number of tunnels, its relationship with NO2 (NO
2:NO ratio)
can be used to estimate NO2 concentrations in a tunnel. Several studies have sought to find
indicative or maximum values of NO2:NO (or NO
2:NO
x) for a range of tunnels. The general
consensus has been that a value of 0.1 or 10% provides a conservative estimate of NO2 (PIARC
2000). The variability in this ratio as a function of location in the tunnel, tunnel length, ventilation scheme, time of day and traffic flow was presented in Chapter 4. We found that a value of 10% is appropriate and conservative for most busy long urban tunnels. The true NO
2:NO
x ratio is
generally higher in shorter tunnels, but concentrations in such tunnels will generally be lower anyway. In long tunnels with slack airflow, a value of 10% may be too low, as in the Hoyanger tunnel (Indrehus and Vassbotn 2001). As the true ratio and its variation are dependent on a number of factors, some of which are hard to predict, we recommend that NO
2 and NO (and
preferably airflow and CO) are measured using a reliable and accurate method on a campaign basis in any tunnel before an NO
2:NO ratio or protocol for managing NO
2 is implemented.
Such a campaign measuring NO2 and NO using a DOAS method was conducted in the M5
East tunnel in 2004 (Holmes Air Sciences 2005). The NO2:NO ratio based on 1 minute averages
was below 6% for 80% of the time, below 9% for 95% of the time and below 10% for 98% of the time. The 2% of values in which the ratio was above 10% occurred late at night at low NO concentrations, and it was concluded that a ratio of 10% would be appropriate and conservative for this tunnel. We agree with this conclusion.
Due to the technical limitations in measuring NO2 or NO in tunnels, several studies have
considered the practicality of modelling NO and NO2 concentrations on the basis of CO and/or

aiR QUaLitY in anD aRoUnD tRaFFiC tUnneLS
air quality and health risk management | 113
aerosol monitoring. Indrehus and Aralt (2005) presented a model to predict NO concentrations in the Bomlafjord tunnel in Norway, based on data from both CO and aerosol monitors. The resulting predictions were compared with six weeks worth of monitored NO data at four locations in the tunnel. A correlation of 0.807 was found between modelled and measured concentrations, reducing to 0.771 if only the aerosol data was used. The model was found to under-predict at high concentrations. It was concluded that CO monitoring was required in addition to aerosol monitoring in order to predict NO and NO
2 concentrations.
Any system to manage in-tunnel user exposure using conventional NO monitors has a number of weaknesses which could compound to make such a system impractical. Firstly, the NO monitors have inherent uncertainties, including issues of reliability and representativeness. Estimation of NO
2 from NO using a fixed ratio is likely to be inherently conservative, although a
dynamic ratio dependent on other data is likely to be more accurate. Relating fixed-point data to variations within the tunnel is highly location and tunnel dependent and will introduce further errors, especially if a simplified conservative approach is taken. Further degrees of uncertainty are introduced if the effects of tunnel networks are considered, or if it is believed or found that the NO
2:NO ratio is likely to vary significantly in extreme conditions. Such a system can be
implemented, but care must be taken to avoid the compounding of conservative steps leading to an excessively conservative system.
7.4 trAffic And eMission control
Alternative approaches to controlling tunnel air quality involve limiting emissions by controlling the traffic flow. Variables that are amenable to control include:
minimum or maximum speed limits (gas emissions will generally be reduced at higher speeds, •
although resuspension of particles may be increased)
vehicle emission control (eg vehicles not meeting specified emission standards can be barred •
from the tunnel)
fleet mix (eg HDVs could be barred from the tunnel)•
traffic flow (could be regulated by traffic signals on entry)•
flow reduction (on-ramps or individual lanes can be closed to reduce the number of vehicles •
in the tunnel)
redistribution of emissions in time (for example HDVs can be restricted to certain times of the •
day when their impact will be lessened, eg night or outside peak traffic periods).
Many road tunnels, especially in Australia, are tolled or form part of toll roads and networks. Several of the variables listed above can be influenced by differential and variable tolling. This tolling needs to be carefully reviewed so that it is a) effective, and b) used primarily as an air quality or traffic management tool rather than a revenue-generation tool (ie high emissions generate increased toll revenue). This may be offset by the savings made in ventilation costs if in-tunnel concentrations are reduced. Where electronic tags are used, new or renewed tags could be made conditional upon vehicles meeting emission standards, which could include testing. This condition could be applied selectively to those parts of the fleet contributing disproportionately to poor air quality.
The Environmental Management Plan (Operation Stage) of the M5 East tunnel (as approved in December 2001) states that traffic management is the primary tool for managing air quality in the tunnel in the case of congestion, supported by ventilation responses. As noted above, low traffic speeds, perhaps as a result of congestion, lead to higher emissions and reduced piston effect, thus giving rise to a worst-case scenario for in-tunnel air quality. The Incident Response Plan of the M5 East tunnel notes that if traffic speeds fall below 20 km h–1, only one lane should remain open in order to limit the number of vehicles in the tunnel and hence reduce emissions. Although this should be effective in maintaining CO concentrations below the appropriate guideline, it can have the undesirable effect of worsening congestion further upstream.

aiR QUaLitY in anD aRoUnD tRaFFiC tUnneLS
114 | air quality and health risk management
The plan was later revised in light of operational experience following tunnel opening. It was found that the automated system to increase airflow in the event of an incident did not react quickly enough to maintain sufficient airflow.
As noted above, HDVs have a disproportionately large effect on air quality, especially through PM (resuspension, soot and ultrafine particles) and NO
2. Concentrations of these pollutants are
sensitively dependent on the number, speed and variation in emissions of HDVs. This is becoming increasingly true as emission controls are more widely applied to vehicles. Therefore, any controls that focus on HDVs are likely to have a large effect. In the 2004 study in the Caldecott tunnel (cited by Phuleria et al 2006), HDVs constituted 3.8% of traffic in Bore 1, but were responsible for the emission of 36% of the particles.
Systems are commonly installed to improve safety in tunnels by reducing the causes of accidents and fires. These are often caused by congested traffic, so measures to reduce congestion will also lead to improvements in air quality. An increasingly common example is the use of variable signs at some tunnels. These allow the posting of variable speed limits, plus advance warnings of lane closures. These measures allow a smoothing of traffic flow near capacity-saturation conditions and prevent the development of congestion. In some cases these systems have been retro-fitted to existing tunnels. Unfortunately, as they have not been installed specifically for the purposes of air quality, we are not aware of any assessment study of their effectiveness in reducing pollutant concentrations.
7.5 Advice to tunnel users
The NSW RTA has distributed a brochure Staying Safe in Sydney’s Road Tunnels that provides advice about closing the cabin, and specific advice for people with asthma. The brochure and other material can be downloaded from their website.5
The environmental impact statement for the North–South Bypass tunnel (Brisbane) cites the M5 East studies of SESPHU (2003) to conclude that:
…exposures [to NO2] previously reported to be associated with increased inflammatory
response to allergens in asthmatics may be encountered if the vehicle cabin is not closed [in prolonged transits].
It is therefore concluded that, for this project, traffic management programs will be required to be implemented to ensure that prolonged exposure (>15 minutes) is not experienced by any motorist. In the event that those circumstances are not possible, then motorists who may be susceptible to asthmatic symptoms should be advised, via the tunnel communication system, to close their car windows while they wait. (SKM Connell Wagner 2005)
7.6 ProtectinG AMbient Air QuAlity
7.6.1 teCHniCaL oBJeCtiveS
The air quality impact of road tunnels upon their neighbourhoods is modelled for all new projects. Good practice in terms of managing nearby air quality should include follow-up activities to a) ensure compliance, and b) update or correct emissions data, or correct for unexpected effects beyond the capability of the modelling to describe, for example, the weather. These activities should include some monitoring. The most important aspect of any assessment is the clear and unambiguous statement of air quality objectives. Primarily this means an assessment of whether local air quality standards are likely to be, or are being, breached close to the tunnel. The second and much more challenging objective is to assess whether any such breaches are
5 http//:www.rta.nsw.gov.au

aiR QUaLitY in anD aRoUnD tRaFFiC tUnneLS
air quality and health risk management | 115
being directly caused by emissions from the tunnel. This may be important if breaches from ‘any source’ are occurring with equal magnitude over a wide area such as to eliminate the tunnel as the cause. An even more demanding objective is to assess the variability of effects over space and time, and between different members of the potentially affected population. Dilution, meteorology and the interaction between meteorology and topography will cause spatial variation in concentrations of not only tunnel-sourced pollutants, but also other local sources and ‘background’ pollutants. A true assessment of this variability requires data on the variability in pollutants from all sources at the same or similar spatial and temporal resolution. Such a detailed assessment is technically and financially demanding but practically achievable.
7.6.2 tUnneL-ReLateD aMBient MonitoRing
In many cases, existing monitors near the tunnel are used to assess the impact of the tunnel, whereas in others new monitoring stations are installed. For example, five new monitoring sites were installed around the M5 East tunnel, four around the Cross City tunnels and three around the Lane Cove tunnel in Sydney, and two each (one for each stack) for the City Link and EastLink tunnels in Melbourne. A new monitor was also installed next to one of the busiest portals of the Sodra Lanken tunnel in Stockholm. Monitoring can include continuous monitoring of criteria pollutants, but can also include passive sampling campaigns, as in the Sodra Lanken and Norra Lanken tunnels in Stockholm, and the Lane Cove Tunnel Air Quality and Respiratory Health Study (Woolcock 2006). If monitoring identifies significant deviation in behaviour from that predicted by the modelling, then further modelling may be required (following an examination of the causes of the deviation). The influence of meteorology and local effects will be crucial. Monitors should be sited carefully so that they accurately represent exposure-relevant locations without being overinfluenced by local effects. Better representativeness, and comparison with modelling, can be achieved if monitors are sited in areas with low spatial concentration gradients. These can be assessed by either dispersion modelling or a campaign using a dense network of passive samplers, or preferably a combination of both methods. Monitors should not be located in sites that present known difficulties for dispersion modelling, or are subject to local influences of a scale that falls between the grid spacing used in the available and appropriate models.
7.6.3 aSSeSSMent oF BaCKgRoUnD
Monitoring in areas expected to be influenced by the tunnel should not be considered in isolation. It has been repeatedly noted that exceedences of air quality standards in areas close to tunnels can be caused by background sources that affect the whole city (eg the influence of bush fires causing high PM
10 values to be registered by the monitors near road tunnels in Sydney
and Melbourne). Although the PM10 peak may be caused by background sources, the duration,
magnitude and spatial extent of the exceedence may be influenced by the presence of the tunnel and its emissions.
Assessment of background concentrations, to which tunnel contributions may be added, is an inexact science—even agreed definitions of ‘background’ do not exist—and approaches and viewpoints are continually evolving. This is particularly the case when future background is being estimated on the basis of emission predictions and past meteorology, and in road-based projects where the opening of a new road inevitably induces a redistribution of traffic that is not always easy to predict, leading to a redistribution of local emission sources. We have discussed whether increased local surface traffic emissions arising as a result of tunnel opening should be considered as background (Section 5.4) and the use of a network of local monitors to assess background post-opening (Section 5.5.4).
The first recommendation made in the review of dispersion modelling for the M5 East tunnel (Williams et al 2000) was that ‘a revised procedure [was necessary] for combining background concentrations with the plume footprint to account for variability in background concentrations’. They discussed the problems that can arise when modelled hourly concentrations with large inherent uncertainties are summed with background concentrations derived from actual monitored

aiR QUaLitY in anD aRoUnD tRaFFiC tUnneLS
116 | air quality and health risk management
values for the corresponding hour or day. They argued that background values that were more an indication of typical values or ranges for that time of day, day of the week and time of year are more appropriate, a view which we support. The issue was explained very clearly by Manins (2005) in his review of modelling for the Lane Cove tunnel:
In accounting for the background concentrations, the [original modelling] report presents a Level 1 (add plume impacts to background maxima) and a Level 2 (add plume impacts to hour-by-hour background levels) assessment. EPA NSW (2001) approved assessment guidelines require a Level 2 assessment in situations where it is likely that the proposal could exceed air quality standards. However, in my view a Level 2 assessment only gives a semblance of greater accuracy and reduced conservatism…. In the present case, the increments made by the Tunnel vent emissions to air pollution concentrations are almost always small, and the Level 1 assessment already demonstrates compliance with the standards. Thus a Level 2 assessment is unnecessary and unduly complicates the report presentation without adding anything that could not have been done in the context of a Level 1 presentation.
DEC NSW (2004) seems to believe that a Level 2 assessment is more accurate and less conservative. However, it can be shown that only when the mean of the background concentrations is much larger than the mean of the concentrations due to the plume, do the predicted peak values sum in a linear fashion. If the means are similar then the predicted peak values can be significantly smaller than the combination of the two independent peaks. Thus the Level 2 assessment procedure is inherently overly conservative—a characteristic that is not intended by the regulators.
We support these comments.
7.6.4 MoDeL SeLeCtion, opeRation anD vaLiDation
We have noted above our concerns regarding the capability of models like TAPM to accurately predict dispersion on ranges of 100–1000 m due to insufficiently fine resolution. Tunnels are often in areas of complex topography and in such cases steady-state Gaussian models are generally not recommended. The steady-state assumption is also particularly inappropriate for receptors close (order of 100 m) to a point source. The literature on modelling of dispersion from road tunnels provides a fairly comprehensive consideration of the various weaknesses of dispersion models. Many sensitivity studies on the effect of different modelling or data input options have been reported, and model validation and intercomparison is a very active area of research in the air quality and academic communities. Issues that affect the predicted concentration magnitudes (such as emission data) are important for the prediction of breaches of air quality standards. Issues that affect the spatial distribution of effects are important for exposure assessment and the siting and representativeness of monitors. The key issue is the potential effect of model uncertainty on predicted population exposure. In most cases, the predicted exposure is so small (or negative in comparison to a pre-tunnel or no-build case) that model uncertainties will have small or insignificant effects on exposure.
Wind tunnel modelling is often used to validate dispersion modelling in a range of scenarios. Wind tunnel dispersion modelling from the M5 East tunnel stack was conducted before opening. A review of the modelling (Williams et al 2000) found that the modelling produced good repeatable results, but that the reliability of the modelling at low wind speeds was questionable, a well-established problem with wind tunnel modelling (Schatzmann et al 2001). This is crucial as low winds are more strongly associated with atmospheric stability and weak dispersion giving rise to maximum ground-level concentrations. Monitoring has also shown that wind speeds are lower in the valley containing the tunnel stack than on the plateau above (Barnett et al 2003). It was concluded that it was not possible to use the wind tunnelling results to assess the claim that the numerical modelling results were conservative.

aiR QUaLitY in anD aRoUnD tRaFFiC tUnneLS
air quality and health risk management | 117
7.6.5 MoDeLLing oF StaCK eMiSSionS
Several studies have highlighted the dependence of model output, in the case of stack emissions, on the correct description of stack emissions and plume rise. In the pre-opening case, stack emission rates need to be calculated from estimated vehicle emissions and mass balance, and are thus dependent upon the accurate prediction of traffic flow and composition, and a realistic representation of the planned operation of the ventilation system. Post-opening modelling is dependent upon the accuracy of measured stack emissions, which are always prone to uncertainties. Williams et al (2000) modelled the effect of heat transfer through the walls of the ventilation tunnel on the temperature of vitiated air in the M5 East tunnel. They found that for a well-mixed flow of 800 m3 s–1, the air reached the temperature of the rock after about 600 m of passage through the ventilation tunnel. This distance would be shorter for lower airflows. The significance of this finding is that a large thermal difference may exist between the plume emitted at the stack and the surrounding air in winter, especially in the mornings when air temperatures are minimal and tunnel emissions peaking. This would give rise to significant thermal buoyancy that would influence plume dispersion and should be considered in modelling. In a review of modelling for the Lane Cove tunnel, Manins (2005) made a similar observation that initial modelling had assumed no thermal gradient between the stack plume and ambient air, whereas he predicted a beneficial extra thermal plume rise which would reduce ground-level concentrations below those modelled without this effect.
7.6.6 poRtaL veRSUS StaCK eMiSSionS—DeSign
In urban locations, it is often felt that portal emissions are not acceptable because of the localised effect of such a powerful point source of air pollutants. Polluted air can be discharged through a ventilation stack at a height. The rationale is that by the time the stack plume reaches the ground it will be so diluted as to minimise its effect on the exposed population. Stack construction (and the extra ventilation ducting, instrumentation and control systems) represent an increased capital cost; there is also an operational cost. These costs are greater if the ventilation stack is some distance from the tunnel bores (eg ~1 km in the case of the M5 East tunnel). Design options include:
stack emissions only, with optional portal emissions•
portal emissions only, with optional stack emissions•
combined portal and stack emissions.•
In the M5 East tunnel, the 4 km length and anticipated high traffic led to an initial design incorporating three stacks. Community opposition forced a change in the design that was never tested through consultation. The final design was altered to a single stack with limited portal emissions at an increased construction cost of $30 million and an additional $1 million per annum in ventilation costs. However, the Department of Planning rejected this proposal, requiring a system which ‘avoids’ portal emissions. This led to what was to become the problematic Planning Condition 71:
The ventilation system for the main tunnel…must be designed to avoid air emissions through the portals as far as is practical.
Controversy has surrounded this condition due to the words ‘designed’ and ‘as far as is practical’. Firstly, this condition can be interpreted as not applying to operation, only to the design stage. The ambiguity of ‘as far as is practical’ has been seen by some as a licence to allow portal emissions at will.
7.6.7 poRtaL veRSUS StaCK eMiSSionS—opeRation
The revised Environmental Management Plan (Operations Stage) of the M5 East tunnel, released in August 2002, addressed the poor performance of the previous procedure for dealing with congestion incidents by allowing portal emissions (despite Planning Condition 71) instead of by improved traffic management and increased airflow.

aiR QUaLitY in anD aRoUnD tRaFFiC tUnneLS
118 | air quality and health risk management
From May 2003 to June 2004 auditors found that portal emissions were ‘a relatively common occurrence’ (NSW Planning 2005). Reasons for portal emissions being activated included ‘ventilation trials’, ‘fine tuning’, a malfunction not being repaired for 23 days due to a delay in the supply of spare parts, incorrect operation of jet fans and a faulty CO monitor. The largest tunnel emission in terms of volumetric flow occurred in the morning of 8 October 2003 following vehicle breakdowns in both tubes.
An important consideration in the decision to allow portal emissions is the possibility that such emissions (generally required to maintain acceptable air quality inside the tunnel) will lead to a breach of ambient air quality standards outside the tunnel. Maintaining a balance between inside and outside air quality is difficult to achieve in a location where ambient air quality is close to, or already breaches, local air quality standards, and is complicated by the different nature of in-tunnel and local exposure (different populations and different timescales of exposure). It is plausible, for instance, that occasional portal emissions could be allowed for a short period (eg an hour or two) in order to help clear tunnel air in the case of severe congestion, without causing a breach of the one hour NO
2 standard outside the tunnel. The effect of longer duration emissions
needs to be assessed against the incremental resulting daily exposure to PM10 or PM
2.5. Persistent
or continuous emissions will need to be assessed against the probability of exceeding both these standards, and the annual standards for PM
10, PM
2.5 and NO
2.
Modelling these effects requires portal emission rate data, which are not always available. In modelling the effect of portal emissions from the M5 East tunnel, Hibberd (2006) noted that NO
x
emission data were not directly available. Modelling proceeded by assuming that NOx emission
from the stack was also representative of portal emissions. This was an imperfect but reasonable assumption to make in this case and was supported by data showing that portal emissions peak at high traffic flow, during which time NO
x concentrations in the stack and portals should be similar.
However, such an approach involves significant uncertainties and in general it is recommended that direct measurements of portal concentrations are made if portal emissions are likely.
Once such portal emissions are in operation, compliance should be assured through the use of monitors (at least PM and NO
2) at an exposure-relevant location at the tunnel portals. An ideal
ventilation control system would use live data from these monitors to adjust and control the tunnel fan system to minimise any effect of tunnel emissions on population exposure to air pollutants.
Sturm et al (2004) report on an example of such a system in Austria (Kalvariengürtel, Graz). The location of the tunnel exit near tall residential buildings prevented the use of stacks. The tunnel is relatively short (600 m) with low traffic compared to many of the tunnels covered in this review (12 000–14 000 day–1). In such a case in-tunnel concentrations are relatively low, so the key air quality issue is the venting of polluted air, especially NO
x, at the ground-level portals in a built-up
area with existing high NO2 levels. In this case a system was deployed based on CO and visibility
inside the tunnel, but powered ventilation was discontinued—reducing portal emissions—if NO2
levels outside the tunnel exceeded 150 μg m–3 as a 30-minute average.
7.6.8 RiSK ManageMent gUiDeLineS
As outlined in earlier chapters, the traffic emission exposure context is steadily, even rapidly, changing due to advances in motor vehicle emission controls. Against this changing exposure background, expert review groups have contributed to international efforts to prepare ambient air quality guidelines for protection of human health. These guidelines have been adopted in many countries including Australia, following national expert and regulatory consultation. The relevant ambient air guidelines in Australia are listed and their applicability to road tunnels discussed in Chapter 8.

aiR QUaLitY in anD aRoUnD tRaFFiC tUnneLS
Concluding discussion and recommendations | 119
8 concluding discussion And recommendAtions
A draft version of this chapter was presented to attendees of the NHMRC Air Quality in and around Traffic Tunnels Workshop hosted by NHMRC in Canberra on 15 May 2007. The draft served as a catalyst for debate leading to a consensus in some areas and disagreement in others. In response to this debate, the report on workshop discussions is included in Appendix G. As a result of extra submissions made to us subsequent to the workshop, this chapter has been extensively rewritten. The comments below remain the opinions we have reached as a result of the review and workshop, but are also intended to reflect the weight of opinion we noted from workshop attendees.
In the following discussion we cover some of the key issues regarding external and internal tunnel air quality and health that were identified in the review, and were the focus of debate at the workshop.
We would first like to comment on how difficult it was to obtain data about some Australian tunnels, especially where private operators were involved. In some cases this hindered or delayed our analysis. Such an approach to data management is unhelpful and contributes to the mistrust that has arisen in some cases between tunnel operators and relevant government agencies on the one hand, and the general public and concerned community groups on the other.
In the majority of cases, road tunnel ventilation system design and operation is based on protecting tunnel users from short-term exposure measured against the WHO short-term air quality guidelines for CO. Emissions from the tunnel into the ambient atmosphere are managed with reference to the ambient air quality guidelines (WHO or local), principally for NO
2 and PM
10
in urban areas. These two requirements may result in conflicting actions: venting tunnel air to reduce concentrations inside versus reducing venting (at least at ground level) to protect external air quality.
The former approach—managing internal CO concentrations—has a longer history. The design stage usually includes an assessment of external impacts, but we have shown how modelling uncertainties and emission evolution demand a continuous management system which should include monitoring and, in some cases, updated modelling. If nearby breaches of ambient air quality standards are sensitive to small changes, or a clear risk to a population is identified, then an effective management system should provide for feedback from the external monitoring back into the ventilation control system in the same way that internal monitoring does.
8.1 eMission reductions Are tHe key to MAnAGinG Air QuAlity
The overwhelming consensus of the workshop attendees, and of NIWA, is that the most effective way to manage air quality both in and around tunnels is through vehicle fleet emission reductions. This means tackling the causes of poor air quality rather than dealing with the effects. Monitoring, standard-setting, experimental studies, enhanced ventilation and tunnel filtration all become less urgent if the ambient air is not seriously polluted in the first instance. The recent success of the European Auto-Oil Programme (the Euro-I to V emission standards and associated reductions in fuel sulfur content) has shown that emissions from a vehicle fleet can be reduced by more than half in a decade. Australia lags substantially behind the European Union in the adoption of proven emission reduction technology, and fleet turnover is slower here. Accelerated introduction of new vehicle technologies and replacement or retrofitting of technology to old vehicles is likely to be the most effective means of reducing the health risk associated with road tunnels in Australia. This should be supported by enforcement of emission standards through regular testing of the current fleet and maintenance to prevent emission deterioration.
Secondly, it was widely appreciated at the Workshop that free-flowing tunnels are not only the most effective for transport, but also the least problematic in terms of air quality and health impacts. Congestion not only leads to more emissions, a larger number of vehicles and exposed persons in the

aiR QUaLitY in anD aRoUnD tRaFFiC tUnneLS
120 | Concluding discussion and recommendations
tunnel and longer exposure times, it also introduces further uncertainties in quantifying the pollutant concentrations and personal exposures, making health-based air quality management more difficult to achieve. However, the effect of tunnel traffic management on the surrounding surface road network cannot be ignored, especially if tunnel management results in vehicles, especially trucks, being diverted into busy or congested unsuitable residential roads much closer to sensitive populations.
8.2 in-tunnel Air QuAlity
8.2.1 nitRogen DioxiDe in tUnneLS
In every documented example we found, road tunnel ventilation is designed to keep CO concentrations below a certain health-based limit, and, by definition, protect against CO-related health impacts, as long as the system operates correctly. Protection for tunnel users against the health effects of other pollutants is less clear, mainly because of the large uncertainties in the effects of such short-duration exposures.
Vehicle emission factors for CO have fallen in the last two decades. This has permitted the construction of longer tunnels without a commensurate increase in ventilation demand and cost. However, emission factors for NO and PM
10 have fallen less rapidly (and direct emission of NO
2
may be rising) so that these pollutants now constitute a larger proportion of tunnel air relative to CO than before. This means that the concentrations of NO
2 and PM that correspond to a CO
concentration likely to trigger an increase in ventilation are likely to be higher than they were in the past. This is especially true for tunnels that are more sensitive to HDV emissions (eg higher HDV use, gradients and low fuel quality). We have noted one example of a tunnel in which very high levels of NO
2 were allowed to build up without management intervention due to
nonexceedence of the CO limit (Indrehus and Vassbotn 2001, see Chapter 4). In normal operation this is more likely to apply to tunnels with poor airflow (long, bidirectional tunnels), but may also apply in other longitudinally ventilated tunnels if congestion events reduce airflow without CO levels rising sufficiently to trigger extra ventilation. Whether this commonly occurs is unknown due to the lack of NO
2 monitoring or the absence of a tested and verified method for modelling
of NO2 in tunnels. It is not yet clear whether this is an issue in Australian tunnels.
However, concentrations of NO2 which do or could arise in Australian tunnels present cause for
concern. Within a tunnel, brief but intense exposures to NO2 and PM may aggravate asthma. The
key tunnel exposure study of Svartengren et al (2000) showed a significantly increased allergenic response in asthmatics after exposure for 30 minutes to NO
2 at levels > 300 μg m–3 (160 ppb), a
concentration which could be experienced in a single transit of at least one Australian tunnel. A precautionary approach might be to consider an interim NO
2 limit of a similar magnitude, perhaps
adjusted for more typical shorter tunnel transits. The concentration within vehicles relative to the tunnel air has to be considered. We have shown how tunnel pollutants are trapped inside vehicles if the windows are closed, extending exposure times well beyond tunnel transit times, while reducing concentrations below what is actually observed in the tunnel. We therefore argue that 15 or 30 minute exposure limits are appropriate.
The workshop delegates supported the development of a NO2 exposure limit for tunnel users, but
accepted that a separate process needs to be established beyond this review to develop such a limit (such as the NEPM development process). More than one delegate described NO
2 as ‘the new CO’.
8.2.2 paRtiCLeS in tUnneLS
Compared to NO2, the issue of protecting users from the effects of PM was more controversial, reflecting the relative lack of scientific data and consensus regarding the short-term effects of particulate pollutants, and the uncertainty in their toxicity and toxicological mechanisms. Although we can measure PM10 in tunnels, it is unclear if this measure corresponds well, or at all, to any toxic effect on tunnel users. More research needs to be done before we can begin to

aiR QUaLitY in anD aRoUnD tRaFFiC tUnneLS
Concluding discussion and recommendations | 121
relate measurable properties of an aerosol (eg turbidity, black carbon mass, PAH content, total number concentration, specific surface area, hygroscopicity, etc) to quantifiable health endpoints. Those studies that have been conducted have involved exposure times of hours. We suspect that particles pose a potential risk, but we are a long way from being able to quantify that risk or define exposure limits. However, it is a common observation that motorists start to experience adverse health effects when particle levels exceed 500 μg m–3. This level may suggest a suitable starting point, and is similar to that identified by Svartengren et al (2000).
The interaction between road traffic pollutants, especially in terms of the effect on living tissue, remains a major area of uncertainty. It has been suggested that the effect of NO
2 is greater in the
presence of inhalable particles, and thus any exposure limit for NO2 needs to also consider PM
levels. This requires further research. An ideal experiment would be a chamber study in which the relative concentrations of NO
2 and PM could be varied, but this apparently simple design
becomes hugely complicated when one considers the multivariant nature of the particles found in road tunnels. In the simplest terms, we have identified two road tunnel particle climates, one dominated by soot particles with adsorbed organic compounds and biased towards ‘larger’ particles (most numerous around ~100 nm in diameter and most mass in particles ~0.5 μm in diameter), and one dominated by organic nucleation mode ultrafine particles (most numerous around 20–30 nm in diameter). Whether these two different particle populations present different additive and interactive effects when inhaled with NO
2 needs to be studied. Finer particles, those
containing substantial semivolatile components, cannot be captured in a tunnel for later study in the same way that solid (soot or mineral) particles can, and so such experimental studies must be conducted wherever such particle mixtures can be generated. ‘Real-world’ exposure studies in tunnels, or similar high exposure locations, greatly reduce the opportunities to control the exposure leading to interesting and indicative, but far from comprehensive results, such as in the Svartengren tunnel exposure study (Svartengren 2000). Generating realistic traffic exhaust aerosols in the laboratory is not yet a practical possibility. Aerosols generated artificially do not represent the complex composition of the real world aerosol. Aerosols fed directly from a test vehicle to an experimental chamber will not have undergone the processes of interaction that take place inside a road tunnel, and are also very difficult to control. These problems are seen even more in in vitro studies where storage of the particulates prior to dose is usually required. Wittmaack (2007) has recently noted the wide range in toxicity encountered in particles generated from the same material but using different techniques. Further uncertainty exists regarding the rate at which inflammation and other biological responses develop, due to experimental limitations regarding the limited number of biopsies, bronchoalveolar lavages, blood samples or animal models in a study. In summary, reproducing a realistic aerosol in controlled conditions is not yet possible and is a major obstacle to furthering our understanding of both the direct effects of short-term exposure to particles and the role co-exposure of NO
2 plays in those effects.
8.2.3 eMiSSion FaCtoRS
A simple scaling of CO emission factors or concentrations is not possible for PM10 or NO
2. In
the case of PM10,
the emission processes for coarse particles are significantly different from fine particles, and the toxicities of the different fractions of PM
10 are highly variable (yet poorly
established). In particular, vehicle emission factors for coarse particles are poorly established in general, especially in road tunnels where deposition is highly significant. The nonlinearities inherent in atmospheric nitrogen chemistry and its dependence on fresh air supply make prediction of the ratio of in-tunnel NO
2 to CO a complex issue which needs to be assessed in
detail for each individual tunnel.
Air quality management is sensitively dependent upon the selection of emission factors, which need to be as accurate and representative as possible. Many studies have shown that emission factors derived from dynamometer studies can differ very significantly from the ‘real-world’ factors measured in tunnels. Tunnel air quality management procedures are largely implemented in response to congested traffic, but there remain major scientific uncertainties regarding the emission behaviour of congested traffic, and this is an area of current active research.

aiR QUaLitY in anD aRoUnD tRaFFiC tUnneLS
122 | Concluding discussion and recommendations
8.2.4 expeRiMentaL StUDieS on tUnneL USeRS
In light of the small identified risk to tunnel users, it would be advantageous to investigate if a health deficit could be observed. Whether or not such a study should be conducted is dependent on whether a suitable and practical endpoint can be identified. Beyond the usual issues of controlling for confounding influences, the key issues that must be addressed are:
the large differential exposure between test and control•
the ability to attribute the exposure, or part of it, to tunnel use rather than time spent on •
surface roads
high-quality exposure characterisation.•
A focused study could involve a detailed study of a small number of subjects along the lines of previous work by Svartengren (2000), but in an Australian tunnel. The key aspects of the subject’s exposure are NO
2 concentrations and some measure of PM. We suggest both mass-based and
number-based measurements of PM inside the vehicle. Both are needed as their ratio can vary, and this ratio may be crucial in terms of health effects. Repeated exposure to ultrafine particles over a few days has a greater effect than a single day’s exposure (Peters et al 1997), indicating the value of a study of repeated exposure periods. Data of at least a one-minute time resolution are required as the short-term concentration variability is likely to be high, and the time spent in the tunnel is relatively short. Data collected from the e-Tag when vehicles enter and exit motorways (used in New South Wales and Victoria) could be used to identify periods when the subject is in a major tunnel; global positioning system data could indicate periods in nontolled tunnels and traffic conditions in general. Susceptible and healthy subjects could be compared. The value of such a study would be greatly enhanced if in-vehicle concentrations could be supplemented by concentrations external to the vehicle and reported by the tunnel’s monitoring system. If the relationship between fixed monitored concentrations and in-vehicle concentrations (and possibly vehicle speed) can be established, then exposure can be estimated for other subjects whose travel patterns could be monitored via e-Tag, global positioning systems or diaries. Appropriate endpoints could include measures of lung function tests, heart rate variability, and levels of appropriate biomarkers and inflammation from blood samples or bronchoalveolar lavage. Very careful consideration should be paid to the time gaps between peak exposure and sampling as this can have a strong influence on the results and conclusions drawn.
Additional reseach is also recommended on the effectiveness of exposure mitigation strategies, such as closing the vehicle cabin while in road tunnels. There is a lack of knowledge both in regard to this behaviour by tunnel users and its effect on exposure to tunnel pollutants and reduction in any health effects.
8.2.5 Setting expoSURe LiMitS FoR tUnneL USeRS
Our review has identified that the most important effect of pollutants related to road tunnels is acute exposure to NO
2 and PM in severe congestion events. We found insufficient epidemiological
or toxicological evidence on the effects of specific levels of these pollutants in the relevant timeframes to make recommendations regarding specific exposure limits. The key issues of very short duration exposures, the regular repetition of such exposures, and the interaction between biological responses to NO
2 and particles remain major gaps in our understanding of the effects of
exposure to traffic pollution. At this stage, in the absence of further data, we recommend that the WHO one-hour NO
2 limit value of 200 μg m–3 should be used as the basis of management of risks
to health.
Overall, the risk to human health posed by road tunnels appears to be small relative to the risks posed by exposure to road traffic emissions in general. Concern was expressed at the workshop that any health-based management measures applied to road tunnels in Australia should be relative to the risk. Many potential measures may conflict with other requirements

aiR QUaLitY in anD aRoUnD tRaFFiC tUnneLS
Concluding discussion and recommendations | 123
for a sustainable, healthy community and global environment. Restricting traffic in the tunnel and portal emissions are two examples of actions which may improve in-tunnel air quality but compromise external air quality. Furthermore, mechanical tunnel ventilation, pumping air through ventilation stacks and tunnel air filtration all involve significant energy costs and hence greenhouse gas emissions. Over-ventilation is not necessarily desirable.
The ‘precautionary principle’ was cited by a number of workshop attendees. This principle is generally taken to mean that if a risk to health is identified but cannot yet be fully quantified or its toxicological mechanism explained, then a mitigating action (which may mean forming and/or enforcing an exposure limit) should be adopted despite the remaining scientific uncertainties, as a precaution. The adoption of PM
10 standards around the world are widely seen as being based
on the precautionary principle due to the substantial uncertainties regarding the toxicological mechanisms behind the effects of PM
10. There is widespread support among workshop attendees
and in the wider tunnel management community for an exposure limit for NO2 in tunnels but no
consensus on what that limit should be has been reached. The precautionary principle would dictate that this lack of consensus, arising from gaps in the toxicological and epidemiological literature, should not prevent the setting of a limit, at least on an interim basis. Even greater uncertainty exists surrounding the effect of particles and the best way to quantify that risk. Many years of research are probably needed to clarify the relationship between particle dose and biological or public health response, yet some workshop attendees still felt, on the basis of the precautionary principle, that the growing toxicological evidence for a significant effect of these particles justified some sort of practical action based on whatever limited data are available.
A high level of protection from the effect of particles, and indeed all road vehicle pollutants, is provided through a combination of the existing CO and visibility limits. However, we advise that a stronger level of protection will be provided through the addition of an NO
2 limit. Development
of this limit must take into account the potential for this limit to protect against exposure to PM, and especially the possibility that co-exposure to NO
2 increases the response to particles, and
vice versa. Thus particular attention must be paid to different outcomes from studies that report exposure to NO
2 only, and those that report co-exposure to PM. Close attention must be paid
to the nature of that PM, ie whether it is ‘realistic’ in terms of road tunnel aerosol, or artificially generated. A clear starting point should be the Svartengren et al (2000) study that showed undesirable effects in asthmatics after a 30 minute exposure to an average 313 μg m–3 of NO
2 in
the presence of 170 μg m–3 of PM10 (probably dominated by road dust generated by studded tyre
use) and 95 μg m–3 of PM2.5
.
Any standard that is set to cover tunnel users cannot consider road tunnels in isolation. Exposure occurs in vehicles that use the tunnels as a small part of, usually, a much longer journey. We have shown how exposure to tunnel air is not restricted to the time spent in the tunnel. Such a standard will potentially have implications and applications beyond the management of road tunnels. We recommend that these implications are thoroughly considered as part of the standard-setting process, including a detailed consideration of communication with the public of the need, use, scope and purpose of such a standard.
8.2.6 ReCoMMenDationS
We recommend development of a health-based exposure limit for NO2 and PM as a precautionary
interim measure appropriate to both average and above average tunnel transit times in order to capture normal and congested conditions.
This process should consider interactions with co-exposure to other tunnel pollutants.
Particulate matter levels should be monitored with a view to reduction, as current levels of PM in some tunnels in Australia are in excess of 1000 μg m–3 which is clearly dangerous to health.

aiR QUaLitY in anD aRoUnD tRaFFiC tUnneLS
124 | Concluding discussion and recommendations
In order for progress to be made in developing a more definitive NO2 and PM limit we
recommend the following:
The health effects of exposure to tunnel air and its components at the relevant timescales •
(minutes) need to be determined from experimental studies. The relative importance of different indicators of in-tunnel air quality (eg NO
2, particulates) in predicting
pathophysiological or health effects should be explored. If possible, such studies should include sensitive individuals (eg those with asthma), and be extended to cover repeated exposure (eg to mimic exposure of taxi drivers repeatedly using tunnels). In-tunnel exposures should be compared to nontunnel exposures.
A practical and reliable method for monitoring NO•2 concentrations in road tunnels needs to
be developed. Development should be supported by studies using accurate measurement techniques and world’s best practice to measure in-tunnel concentrations of NO and components of PM in Australian tunnels, updating and extending the studies already conducted. These should cover the widest possible range of traffic densities, HDV use, and congested conditions, and be subject to peer review and publication in the open academic literature. Such studies would validate in-service vehicle emission factors.
A practical method needs to be developed for predicting tunnel users’ exposure to NO•2.
Development should be supported by a comprehensive study of AERs in Australian vehicles in the context of vehicle ventilation, driver behaviour and pollutant retention after tunnel transits.
8.3 externAl Air QuAlity
8.3.1 aiR QUaLitY ManageMent in aUStRaLia
The National Environment Protection Council was established to harmonise approaches to environmental management in Australia. The council makes NEPMs; two NEPMs relate to air quality: the Ambient Air Quality NEPM and the Air Toxics NEPM. These NEPMs establish a nationally consistent framework for the monitoring, reporting and assessment of regional air quality and contain national air quality standards for a range of common pollutants. NEPMs are implemented through state and territory legislation. The NEPM standards and monitoring investigation levels for air toxics are listed in Table 8.1. Exceedence of levels requires further investigation of the cause.
table 8.1 relevant standards from the National Environment Protection (Ambient Air Quality) Measure
Maximum concentrationa
Averaging period 1 year 24 hours 8 hours 1 hour
no2 0.03 ppm 0.12 ppm
Co 9.0 ppm
pM10 50 μg m–3
pM2.5b 8 μg m–3 25 μg m–3
Benzene 0.003 ppm
Benzo(a)pyrene 0.3 ng m–3
Toluene 0.1 ppm 1 ppm
Formaldehyde 0.04 ppm
Xylenes 0.2 ppm 0.25 ppm Co = carbon monoxide; no2 = nitrogen dioxide; pM2.5 = particles of less than 2.5 μm; pM10 = particles of less than 10 μm; ppm = parts per milliona italics indicate nepM for air toxics, where values are ‘investigation levels’ rather than standards.b pM2.5 is an advisory reporting standard.

aiR QUaLitY in anD aRoUnD tRaFFiC tUnneLS
Concluding discussion and recommendations | 125
NEPM standards are not intended for individual source control such as emissions from tunnel ventilation stacks. State legislation, such as environment protection policies in Victoria, contain the relevant objectives and statutory frameworks for the assessment of air quality around tunnels. NEPM standards are not designed or used for this purpose.
In terms of the NEPM (and equivalents abroad), we find that, except in the very localised cases of tunnel portals, the effects of emissions from a road tunnel on the air quality in its surrounding community are very small in comparison to other sources (especially local surface roads) and in comparison to the ability of monitoring to identify the effect. The failure of monitoring studies to distinguish tunnel emissions from background sources may be because the techniques used are too insensitive to detect a small signal hidden in a large background, or the signal is not there. Either way, we conclude that the spatial variability in pollutant concentrations in a city district containing a road tunnel is generally smaller than the spatial variations across the city due to variations in emission strength, density, and the interaction between local winds and topography. We would therefore not expect to find any detectable localised greater effect on the health of residents living in the vicinity of tunnels when judged using the air quality standards.
The NEPM standards for particles are expressed as PM10 and PM
2.5. However, PM
10 is not
necessarily the most appropriate way of measuring the effect of particulate road vehicle emissions in an urban community. Due to the numerical dominance of low-mass, potentially more toxic ultrafine particles in road traffic exhaust, PM
10 may under-represent traffic exhaust, and especially
its toxicity, particularly when there are large local contributions from other sources related to less fine particles, such as sea salt. The very low PM
10 signal measured or modelled in a community
and attributed to road tunnel emissions, although not surprising, does not rule out an effect on health in that community by particles from the tunnel. A focus on PM
2.5 measurements would
remove some of the problems associated with nontraffic sources; PM1 and PM
0.1 would be even
better. Modelling and monitoring these measures, or similar ones which focus on particles emitted from traffic exhaust, would be better suited to identifying a tunnel impact on local air quality. However, we are many years from being able to set standards for smaller fractions.
Particle number concentrations or other measurements which more clearly represent ultrafine particles, will show more clearly the relative contributions of emissions from traffic in a tunnel and on local surface roads. This is more likely to be the case in peak events. The modelled high percentile NO
x concentrations in the vicinity of the M5 East tunnel (Hibberd 2006) suggest
to us that number concentrations of particles could be enhanced by some thousands per cm3 in high emission or poor dispersion conditions, whereas ambient concentrations tend to be in the low tens of thousands per cm3, representing a not insignificant enhancement. If such values are realistic (we have found no data to indicate one way or the other), the expected effects of such an event on health in the community cannot yet be estimated due to our current lack of epidemiological data on ultrafine particles, and it may affect too small a population for such effects to be observable. We must assume that the one hour NO
2 standard affords some protection
against the effects of ultrafine particles (and traffic-derived air toxics) on the community, but we recommend that further research is sorely needed in this area, including modelling and monitoring of particle number concentrations near road tunnels.
A frequently cited limitation of monitoring particle number concentrations is the high degree of spatial variability over tens and hundreds of metres, so that a fixed point measurement cannot be taken as representative of a concentration over a wider area. Although this is true, techniques exist at a research level to extend the spatial applicability of fixed-point data through geographic information science (GISc) techniques and semimobile surveys (eg Identification and Verification of Ultrafine Particle Affinity Zones in Urban Neighbourhoods—a current study funded by the Natural Environment Research Council in the United Kingdom). We recommend that such techniques be applied to provide ultrafine particle exposure assessment for an epidemiological study of residents potentially affected by a road tunnel.
The many outstanding scientific questions about aerosol dynamics and transport mean that modelling the dispersion of ultrafine particles is not yet performed except as research. Workshop
aiR QUaLitY in anD aRoUnD tRaFFiC tUnneLS
126 | Concluding discussion and recommendations
delegates were not in agreement about the need to monitor ultrafine particle concentrations, with some noting that there were no standards against which to evaluate measurements. It is the lack of such monitoring data that prevents any standard being devised. However, a majority who commented supported monitoring. Monitoring of ultrafine particles near a road tunnel will provide evidence as to whether monitoring of PM
10 and PM
2.5 is adequate to protect public health.
Such monitoring could also support badly needed epidemiological studies into the effects of exposure to these particles.
Current ideas about ambient air quality standards in the United States and United Kingdom are moving towards further consideration of exposure, rather than just ambient concentrations. A given concentration of, for example, PM
10 is not equally important in all situations. Instead, it is
proposed that air quality management focus more on those times and places where large numbers of the population are likely to be exposed. This approach is proposed as an option for inclusion in the Ambient Air Quality NEPM. A good example is the dispersion modelling of impacts from the M5 East tunnel reported by Hibberd (2003, 2006) in which modelling was split into day and night periods to split exposure assessment between people assumed to be present in the domain all day, and those present in the domain during day or night only. Population-weighting of concentration data around the Sodra Lanken tunnel was illustrated in Section 5.5.3, where geographic information system data was used to show how areas of worsened air quality were biased towards low population districts and vice versa. Future approaches may also incorporate a fuller consideration of the variation in population susceptibility. NIWA fully supports this approach and advocates its adoption in Australasia. No zero-effect threshold has been observed for PM
10 or PM
2.5. The
Global Update of the WHO ambient air quality guidelines (WHO 2005) stated that ‘Countries are encouraged to consider adopting an increasingly stringent set of standards [for PM].’ This should be borne in mind in any case where air quality in or around tunnels meets current standards.
8.3.2 aSSeSSing iMpaCtS on HeaLtH in tHe CoMMUnitY
For people living near tunnel portals, particulate and NO2 exposure may be the most critical
in terms of general health. If VOC (eg benzene) exposure is increased, then there will be an associated increase in the lifetime risk for cancer. Other carcinogens may also be increased through road tunnel exposure, but we recommend that a focus on benzene (which is relatively simple to model and measure), together with particulate monitoring (not necessarily PM
10) will
also provide an indication of whether exposure to other substances of concern is increased.
There is no routine monitoring or data collection to monitor the health of people living near tunnels or regularly using tunnels. Focused health studies should be considered, but have to overcome several problems. Workshop delegates were split as to whether air quality data were a more practical proxy for health outcomes than trying to measure outcomes directly. A number of key recent health studies have shown strong associations between a variety of measures of vehicle pollution such as proximity of residence to traffic, number of vehicles per day on nearby roads and proximity to motorways (Hoffman et al 2006, McConnell et al 2006, Gauderman et al 2007, Tonne et al 2007). None of these studies directly compared individual exposure to air pollution and the various traffic measures. Using geospatial data (residence location with respect to local traffic flow) to predict health outcomes is always subject to doubts regarding causality. Such an approach also assumes that residential proximity to traffic is a better approach to exposure assessment than air quality monitoring, but such an assumption is based on assuming a single monitor in a fixed location. More sophisticated approaches that utilise multiple monitors, mobile or roving monitoring, GISc modelling based on land-use or socio-economic data, advanced dispersion modelling and personal monitoring, and ideally a combination of some or all of these (as in the Air Quality and Respiratory Health Study) greatly enhance exposure assessment.
Modelling can improve the insufficient range of exposure provided by conventional monitoring, but the modelling needs to be verified. A large spatial variation can be provided if large numbers of passive samplers are deployed, and this may be appropriate for longer term studies in a community. However, long-term studies will inevitably study an exposure that is dominated by the road network as a whole and to which the tunnel contributes a very small fraction.

aiR QUaLitY in anD aRoUnD tRaFFiC tUnneLS
Concluding discussion and recommendations | 127
Any exposure variation detected through passive sampling may represent gradients related to sources other than the tunnel. Relating observed health endpoints to exposure to the tunnel would be extremely ambitious. Studies of shorter term effects which may be associated with plume strike may not be possible due to the random and unpredictable nature of this phenomenon, posing a major obstacle to exposure assessment.
In the case of road tunnel exposures, workshop delegates were clear what the measurable health endpoints should be. The population potentially affected by the external impact of a road tunnel is generally not large enough to consider traditional morbidity outcomes. Some delegates at the workshop supported consideration of more subtle endpoints such as those being used in the Air Quality and Respiratory Health Study (respiratory symptoms, lung function and lung inflammation).
Road tunnels convert a line source (the road) into one or a few point sources (portals, stacks). This represents a redistribution of pollutants, generally reducing concentrations over a large area while increasing concentrations in a small area around the point sources. In the hypothetical case of an even population distribution (and an immobile population) over the district, a road tunnel asks a few people to bear a greater health burden on behalf of the majority who benefit from better air quality. This may seem unacceptable, especially if those living near the point sources do not gain as much from the transport benefits of the tunnel. However, this is not the case if the point sources (and their ‘impact zones’) can be located in areas of reduced or zero population density, or dispersion can be designed in such a way that the increased burden is negligibly small. This should be the goal of good tunnel design.
8.3.3 iDentiFYing tUnneL-oRiginateD aiR
Identifying tunnel emissions within an atmosphere containing emissions from many other road traffic (and other) sources is hampered by the fact that tunnel emissions are almost chemically identical to surface road emissions, preventing direct identification of tunnel-sourced air at a receptor. However, research has hinted that there may be some subtle differences between tunnel air and the air it mixes with; the tunnel can act as a concentrating volume. In tunnels where soot emission rates are above a certain threshold, there is an increased probability of particles and gases interacting leading to enhanced condensation of semivolatile compounds onto soot-based particles, leading to a subtly different aerosol. Aerosol transformation in such scenarios is still a very active area of research and its implications for particle toxicity and health have barely begun to be studied. We are not aware of any studies that have compared the detailed chemical and physical composition in a tunnel, near a tunnel and in other urban locations. The only other ways in which tunnel air is compositionally different to ambient air are the low NO
2:NO
x ratio
and low levels of O3. However, the reaction of NO with O
3 is fast enough that we expect the NO
2:
NOx ratio in the tunnel emission plume to revert to an ambient value within seconds of emission.
In summary, we know of no airborne substance which may be used as a marker of road tunnel emissions. This problem can be partly overcome by the use of artificial tracer releases, which can support modelling in sensitive or controversial locations.
8.3.4 SUB-HoUR iMpaCtS, oDoUR anD anxietY
Transient processes on timescales of less than an hour are considered in various state government documentation such as the SEPP (AQM) in Victoria and the guideline for modelling of air emissions in NSW. Such processes, for example plume looping, which was mentioned in Chapter 5, are inherently difficult to identify in monitoring. Nearly all conventional modelling approaches are not designed to look at any period shorter than an hour. At best, such modelling will identify the probability of such a process occurring, and will thus show smooth contours which fail to highlight how such an impact would actually be concentrated in a small area. The health effects of such transient exposures to particles are still effectively unknown. However, the major impact of such events is likely to be the detection of odour, annoyance due to that odour, and anxiety arising from that annoyance. This may be especially significant if, as has been reported, initial

aiR QUaLitY in anD aRoUnD tRaFFiC tUnneLS
128 | Concluding discussion and recommendations
detection of odour leads to an increased sensitivity to subsequent detection. The design process is generally not structured to protect against such effects, and they generally come to light, not as part of any scientific or environmental assessment, but from self-reporting in the community amongst groups who may be predisposed to anxiety regarding the anticipated effect of tunnel emissions in their neighbourhood. According to some workshop delegates and subsequent submissions, this aspect of the environmental management of road tunnels is sometimes not handled as well as other aspects and can be the source of mistrust between communities and professionals. Where community members feel that their concerns are not being addressed, and that they have no influence over their own exposure, then the subsequent anxiety and stress can be as detrimental to health as the actual emissions.
Assessment of odour effects is less well developed than general air quality. Response to odour is highly variable between individuals, (susceptibility to pollutants such as NO
2 also varies between
individuals) but response to odour also has a significant emotional component, such that one person’s response can differ from one day to the next. This subjectivity means that an objective (chemical) measure is only a crude indicator of the likelihood that odour will lead to annoyance or stress in an individual. We are left with the choice between a ‘scientific’, measure that poorly represents impact, or a subjective measure (self-reporting) that cannot be quantified and suffers from the weaknesses and uncertainties associated with a ‘nonscientific’ method (principally incomplete reporting). A combination of the two should be applied where an odour assessment is to be made. In general, more attention should be paid to this issue, and especially to risk communication and the minimisation of community anxiety at an early stage in tunnel design and operation.
8.3.5 StaCKS anD poRtaLS
In order to manage in-tunnel air quality, it may be necessary to increase the rate of removal of pollutants to the external atmosphere. This can be achieved by increasing stack emissions, or in the absence of this option, increasing portal emissions. In the case of the M5 East tunnel, monitoring has shown that portal emissions have not compromised external air quality; however, these portal emissions have mainly occurred at times of low tunnel usage. Portal emissions may not be necessary if the tunnel were not dependent upon a single stack. A second stack may seem more expensive, but this is compensated for by reductions in the cost of pumping air around the system to the single stack or using a separated ventilation duct, as in the case of the Cross City tunnel. A second stack also introduces an alternative when one stack is nonoperational. In general a stack will distribute the health burden of tunnel emissions. However, if the residential or workplace population near the portals is close to zero, then portal emissions may be preferable to stack emissions in a residential area. In the case of the M5, both the portals and stack are located in residential areas and so a third option should be considered. If tunnel emissions are treated to remove dangerous pollutants, increased portal and/or stack emissions would be a viable option. The cost, benefit and practicality of all options should be investigated.
Monitor failure and malfunction should be expected and planned for so as to minimise data gaps. Monitoring to identify the magnitude of plume impacts relative to other sources need not be NEPM-compliant (eg optical or condensation particle counters for fine and ultrafine particles). Some of the analysis techniques employed with monitored data have not been sensitive enough to detect the expected small plume impacts. Better methods should be explored, such as analysis of the timing of peaks across monitor networks or analysis of wind roses of standard deviation to identify plume meandering.
8.3.6 poRtaL ZoneS
In the 100–200 m zone around tunnel portals where emissions are permitted, a significant, measurable impairment of air quality might be expected, but this will be highly localised and vary with time, depending upon meteorology, so that the impacted zone will not appear merely

aiR QUaLitY in anD aRoUnD tRaFFiC tUnneLS
Concluding discussion and recommendations | 129
as a circular zone around the portal. The impact of portal emissions on health depends on the sensitivity of the population. While health studies are unlikely to yield meaningful results in such small populations, the precautionary principal dictates that any incremental exposures to air pollutants above background should be minimised.
8.3.7 ReCoMMenDationS
In terms of existing or conventional techniques for assessing external air quality we make the following recommendations:
Environmental impact assessment should include induced emission changes arising from •
changes to surface traffic as well as emissions from the tunnel itself.
Air quality monitoring is an essential component of environmental management of a road •
tunnel in the early stages after opening (perhaps the first two years). However, beyond that period, monitoring is less important, although it could become important if emission from the tunnel rises significantly. Monitoring data should be used to verify and improve dispersion modelling so that modelling can become the principle means of environmental management if or when monitoring is removed.
Monitors should be sited, where possible and practical, in locations relevant for exposure, •
representing a relatively high predicted ground-level impact, high frequency of plume impact and low average spatial concentration gradients (in terms of both tunnel and background contributions), as predicted by dispersion modelling and ideally verified by passive sampling campaigns.
At least two monitors are preferred to increase the likelihood that at least one is upwind of the •
tunnel emission point source(s). This allows determination of ‘background’ air quality and the composition of the air entering a tunnel.
We are not convinced that long-term monitoring of PM•10 is useful for the purposes of
managing the impact on a community of a road tunnel alone, as opposed to the road network in general. CO and NO
x are more robust indicators of effects on traffic impacts. The
one hour NO2 WHO guideline, used in conjunction with WHO annual guidelines for PM2.5
and NO2 should provide adequate protection of health until scientific developments allow the development of a more robust standard for road traffic emissions that includes the effects of pollutant interaction.
Further study should investigate the impacts of tunnels on the indoor air quality of residences •
near portals or stacks. This should include study of the health effects resulting from any increased exposure to pollutants.

aiR QUaLitY in anD aRoUnD tRaFFiC tUnneLS
appendixes | 131
APPendix A seArch strAtegy
The search strategy for the Systematic Literature Review to Address Air Quality in and around Traffic Tunnels (Phase 1) was prepared for the Commonwealth of Australia (as represented by the National Health and Medical Research Council) by Ian Longley (National Institute of Water and Atmospheric Research Ltd, NIWA, Auckland) and Francesca Kelly (Environ Medical Services Ltd, Auckland), 14 March 2007.
The strategy consisted of three elements:
identifying relevant research and summarising the datasets it contains•
appraising the quality and coverage of each study, using a standardised system•
synthesising key high quality studies supported by secondary studies.•
The search addressed the following questions:
What are the typical concentrations of key pollutants in road tunnels, and what are the major •
causes of variation between tunnels?
What are the typical temporal patterns in pollutant concentration variability within a road •
tunnel, and what are the principle causes?
What are the typical pollutant concentration increments in the vicinity of urban road tunnels, •
both modelled and measured?
What are the adverse health effects associated with typical exposure to key pollutants in road •
tunnels?
What health outcomes (both theoretical and observed) have been associated with urban road •
tunnel usage or determined in the vicinity of urban road tunnels?
What guidelines for road tunnel air quality management have been implemented around the •
world? Is there any measure of how successful they have been?
The data and studies sought included:
long-term monitoring data from within road tunnels•
short-term monitoring and measurement within road tunnels, generally arising from academic •
research studies
modelled predictions of concentrations within road tunnels made as part of environmental •
impact assessments and resource consents
measurements made within vehicles operating in road tunnels•
research studies into environmental impacts on neighbourhoods surrounding urban road •
tunnels
general physical data and traffic data for the tunnel•
health effects of key pollutants present within road tunnels•
amount of key pollutants to which road tunnel users are typically exposed•
short-term and long-term health outcomes associated with road tunnel use for the general •
population and for those who are particularly vulnerable
any quality-adjusted life years or disability-adjusted life years indicators relevant to short-term •
or long-term health outcomes.
Some tunnels have been extensively studied, and these were targeted through direct contact with the study teams as a priority. These tunnels included:
Söderledstunnel, Stockholm (University of Stockholm, Karolinska Institute)•
M5 East, Sydney•
Eastlink tunnels, Melbourne.•

aiR QUaLitY in anD aRoUnD tRaFFiC tUnneLS
132 | appendixes
Furthermore, several cities have extensive road tunnel networks, or are planning them. Part of the search concentrated on these tunnels and cities:
Hong Kong•
Oslo•
Stockholm.•
Specific data sources used were:
Web of Science•
Science Direct•
NIWA Library•
conference proceedings (eg • International Symposium on the Aerodynamics and Ventilation of Tunnels)
websites and direct contact with relevant environmental protection agencies (EPAs) and •
regulatory bodies
direct contact with research institutions•
National Transportation Library (United States)•
International Tunnel Association•
World Road Association.•
Specific health data sources used were:
Medline•
Pubmed•
World Health Organization (WHO)•
International Agency for Research on Cancer (IARC)•
websites and direct contact with relevant EPAs and regulatory bodies•
direct contact with research groups.•
An initial search identified some key papers, tunnels, institutions and relevant individuals. This sparked a secondary search, in which citations were followed, bibliographies screened for further studies and further work of key authors searched for, as well as similar articles to the initial papers. This led to further search iterations in the same way.
study screening
All studies, reports and papers identified were screened for the presence of the following data:
dates for all measured data•
duration of data•
time resolution of data•
pollutants reported•
concentrations in or near tunnels and background•
meteorological data•
physical tunnel data (length, bore)•
description of ventilation and filtration regime•
traffic data (volume, fleet composition, speed, occurrence of congestion and variability in •
each).

aiR QUaLitY in anD aRoUnD tRaFFiC tUnneLS
appendixes | 133
Health effect studies and reports were also screened for the presence of the following information:
type of study (clinical, epidemiological or experimental)•
size and characteristics of the study population•
length of the study•
numbers of repeat of the study•
experimental conditions•
exposure data•
methods used to assess and analyse health outcomes•
type and extent of health outcomes•
mechanism of action responsible for the health outcomes•
limitations of the study.•
Quality of studies was evaluated using the following criteria:
how recent the data were•
whether the publication was peer-reviewed•
how often the publication had been cited•
whether measurements were made using standard or referenced methods•
whether the data were quality assured•
how extensive the data were (pollutants, resolution, duration, supporting concurrent data, etc)•
whether the study included two or more concurrent in-tunnel, tunnel vicinity and background •
concentrations (such studies were considered to be stronger)
whether the study reported direct traffic emissions (NO•x, CO, PM
10), especially multiple
pollutants, or indirect pollutants (NO2, O
3, SO
2)
whether the study reported the response of concentrations to changes in traffic flow.•
Quality of health-outcome studies was evaluated using the following criteria:
how recent the study was•
whether the publication was peer-reviewed•
journal the study was published in•
how often the publication had been cited•
how large the study was•
whether the study population, health outcomes, and exposure were well assessed and defined •
by the authors
the statistical significance of the data•
whether the study design or analysis dealt with confounders.•
This screening stage was summarised in a table of all identified studies.

aiR QUaLitY in anD aRoUnD tRaFFiC tUnneLS
appendixes | 135
tunn
elc
ityd
ate
open
edle
ngth
(m
)la
nes/
bore
vent
ila-
tion
type
inte
rnal
m
onito
ring
indi
cativ
e da
ily
traf
fic fl
ow%
Hd
vs
ope
rato
rsn
otes
Sydn
ey H
arbo
urSy
dney
1992
2280
2S-
t?
87 0
00Sy
dney
Har
bour
tun
nel
Com
pany
tolls
east
ern
Dist
ribut
orSy
dney
1999
1700
2/3
L, 2
S, p
?60
000
airp
ort
Mot
orw
ay
Lim
ited
tolls
. por
tal e
miss
ions
ar
e th
e no
rm; s
tack
s ar
e us
ed in
ext
rem
e co
nges
tion
City
Lin
k Bu
rnle
yM
elbo
urne
2000
3500
3L,
1S
Co
a55
000
17%
tran
slink
ope
ratio
ns
pty
Ltd
Dom
ain
Mel
bour
ne20
0016
003
L, 1
SC
oa
45 0
0017
%tr
ansli
nk o
pera
tions
pt
y Lt
d
nor
thbr
idge
pert
h20
0016
003
??
82 0
00~
9%b
Baul
ders
tone
Clo
ugh
Join
t ven
ture
M5
east
Sydn
ey20
0140
002
L, 1
SC
oc ,
no
90 0
00
~5%
BHBB
Join
t ven
ture
occ
asio
nal p
orta
l em
issio
ns
Cro
ss C
itySy
dney
2005
2100
2L,
1S
Co
c,d
30 0
00~
4%(4
)bBH
BB Jo
int v
entu
reto
lls, o
ccas
iona
l po
rtal
em
issio
ns
perm
itted
Lane
Cov
eSy
dney
2007
3600
2/3
L, 2
SC
oc
80–1
10 0
00
(exp
ecte
d)~
5%(4
)bC
onne
ctor
Mot
orw
ays
tolls
, no
port
al
emiss
ions
, 3.2
5%
grad
ient
east
link
Mel
bour
neU
nder
-co
nstr
uctio
n15
103
L, 2
SC
oe ,
no
, vi
sibili
ty80
000
(p
roje
cted
)~
6%(4
)bC
onne
ct e
ast
port
al e
miss
ions
not
pe
rmitt
ed
nor
th–S
outh
By
pass
Brisb
ane
Und
er-
cons
truc
tion
5000
2L,
2S
Co
f , no
, no
2, vi
sibili
ty96
000
(p
redi
cted
)~
9% (4
)b
airp
ort
Link
Brisb
ane
prop
osal
5000
2/3
L, 3
SC
of , n
o,
no
2g , vi
sibili
ty93
000
(p
redi
cted
)n
o po
rtal
em
issio
ns
nor
ther
n Li
nkBr
isban
epr
opos
al30
00
east
–Wes
t Li
nkBr
isban
epr
opos
al50
00
HD
v =
hea
vy-g
oods
veh
icle
; L =
long
itudi
nal,
S-t
= s
emi-t
rans
vers
e, p
= p
orta
l em
issio
nsa l
imit
150
ppm
pea
k, 50
ppm
ove
r 15
min
utes
, 25
ppm
in e
xces
s of
2 h
ours
e l
imit
of 5
0 pp
m o
ver
15 m
inut
es, 2
5 pp
m in
exc
ess
of 2
hou
rs, 1
50 p
pm s
hort
-ter
m p
eak
b es
timat
ed o
r pr
edic
ted,
rat
her
than
obs
erve
d f li
mit
of 7
0 pp
m a
s a
peak
c lim
it of
87
ppm
ove
r 15
min
utes
, 50
ppm
ove
r 30
min
utes
g l
imit
of 1
ppm
ave
rage
d lim
it of
200
ppm
ove
r 3
min
utes
, any
whe
re in
the
tun
nel
APPendix b roAd tunnels in AustrAliA

aiR QUaLitY in anD aRoUnD tRaFFiC tUnneLS
appendixes | 137
ref
eren
ces
tunn
elc
ount
ry o
r ci
tyle
ngth
(m
)ve
ntila
tion
type
dai
ly t
raffi
c (n
umbe
r of
ve
hicl
es)
Hd
v
(%)
dat
e op
ened
lane
s/bo
ren
otes
Brou
sse
et a
l (20
05)
Land
ypa
ris13
60St
220
000
1519
974
Cha
n et
al (
1996
, 200
2), M
ui a
nd S
hek
(200
5)C
ross
Har
bour
Hon
g Ko
ng18
48St
120
000
1019
722
Cha
n et
al (
2002
)C
heun
g t
sing
Hon
g Ko
ng16
00L
57 0
0020
1997
3
Cha
n et
al (
2002
)ea
ster
n H
arbo
urH
ong
Kong
2100
71 0
008
1989
2
Cha
n et
al (
2002
), M
ui a
nd S
hek
(200
5)Li
on R
ock
Hon
g Ko
ng14
00t
88 0
0016
1967
2
Cho
w a
nd C
han
(200
3)Ka
i tak
Hon
g Ko
ng13
00L
58 0
0013
1982
also
kno
wn
as t
he
‘airp
ort
tunn
el’
Col
berg
et
al (
2005
), im
hof e
t al
(20
06)
plab
utsc
hg
raz
9757
t23
000
1819
872
eSp
De
Fre
et a
l (19
94)
Cra
eybe
ckx
ant
wer
p16
00L
70 0
0020
5
ger
lter
and
pier
son
(199
6), M
cLar
en e
t al
(19
96)
Cas
siar
vanc
ouve
r73
0L
25 0
0010
2
gill
ies
et a
l (20
01)
Sepu
lved
aLo
s a
ngel
es58
250
000
53
gou
riou
et a
l (20
04)
gra
nd M
are
Rou
en16
00L
40 0
0012
1992
2
HKp
U (
2005
)t
seun
g Kw
an o
Hon
g Ko
ng90
0L
66 0
0026
1990
2
HKp
U (
2005
), C
heng
et
al(2
006)
, Ho
et a
l (20
07)
Shin
g M
unH
ong
Kong
2600
L53
000
3319
902
Hua
ng e
t al
(20
06)
Zhu
jiang
gua
ngzh
ou12
3818
3
imho
f et
al (
2006
)Ki
ngsw
ayLi
verp
ool
2483
St45
000
719
712
indr
ehus
and
ara
lt (2
005)
Bom
lafjo
rdn
orw
ay78
60L
Bi-d
irect
iona
l
indr
ehus
and
vas
sbot
n (2
001)
Hoy
ange
rn
orw
ay75
00L
Bi-d
irect
iona
l
Joha
nnso
n et
al (
1996
, 199
7), g
idha
gen
et a
l (20
03),
Kr
isten
sson
et
al (
2004
)Sö
derle
dSt
ockh
olm
1500
L72
000
52
Kirc
htet
ter
et a
l (19
99),
gro
ss e
t al
(20
00),
alle
n et
al
(200
1), g
elle
r et
al (
2005
), ph
uler
ia e
t al
(20
06)
Cal
deco
tto
akla
nd11
00t
150
000
72
4.2%
gr
adie
nt, 3
bo
res
(eac
h w
ith 2
lane
s)
Mcg
augh
ey e
t al
(20
04)
Was
hbur
nH
oust
on89
5St
Bi-d
irect
iona
l
APPendix c detAils of the non-AustrAliAn tunnels referred to in this rePort

aiR QUaLitY in anD aRoUnD tRaFFiC tUnneLS
138 | appendixes
ref
eren
ces
tunn
elc
ount
ry o
r ci
tyle
ngth
(m
)ve
ntila
tion
type
dai
ly t
raffi
c (n
umbe
r of
ve
hicl
es)
Hd
v
(%)
dat
e op
ened
lane
s/bo
ren
otes
pia
RC
(20
00)
Cro
ix R
ouss
eLy
on17
53St
60 0
005
1952
4Bi
-dire
ctio
nal
pier
son
et a
l (19
96),
Sage
biel
et
al (
1996
), Z
ielin
ska
et
al (
1996
)Fo
rt M
cHen
ryBa
ltim
ore
2332
St19
572
pier
son
et a
l (19
96),
Sage
biel
et
al (
1996
), Z
ielin
ska
et
al (
1996
)tu
scac
ora
penn
sylv
ania
1623
L10
000
182
Sate
helin
et
al (
1995
, 199
8), W
eing
artn
er e
t al
(19
97),
Col
berg
et
al (
2005
), St
emm
ler
et a
l (20
05)
gub
rist
Zur
ich
3268
L45
000
1219
932
Schm
id e
t al
(20
01)
taue
rntu
nnel
nr
Salz
burg
6400
L12
000
2
SLB
(200
6)So
dra
Lank
enSt
ockh
olm
3620
L
Ster
nbec
k et
al (
2002
)t
ings
tad
got
henb
urg
500
L45
000
103
tØ
i (20
04)
Svar
tdal
so
slo13
91L
2000
tonn
eson
(20
01)
Bryn
oslo
500
L64
000
14
tonn
eson
(20
01),
tØ
i (20
04)
vål
eren
gao
slo70
0L
64 9
0814
1989
2/3
tonn
eson
(20
01),
tØ
i (20
04),
ekeb
erg
oslo
1400
L75
000
1419
942
Fitt
ed
with
eSp
, op
erat
iona
l du
ring
traf
fic
peak
s
toua
ty a
nd B
onsa
ng (
2000
)t
hiai
spa
ris60
0St
60 0
007
1996
2
Wes
terlu
nd a
nd Jo
hans
son
(199
7)Kl
arat
unne
lSt
ockh
olm
Win
gfor
s et
al (
2001
), St
ernb
eck
et a
l (20
02),
C
olbe
rg e
t al
(20
05)
Lund
byg
othe
nbur
g12
21L
25 0
0014
2
Yao
et a
l (20
05)
tai L
amH
ong
Kong
3700
St45
000
3019
983
Yao
et a
l (20
05)
tate
’s C
airn
Hon
g Ko
ng40
00L
63 0
0013
1991
2
eSp
= e
lect
rost
atic
pre
cipi
tato
r; H
Dv
= h
eavy
-dut
y ve
hicl
e; L
= lo
ngitu
dina
l; S
-t =
sem
itran
sver
se; t
= t
rans
vers
e

aiR QUaLitY in anD aRoUnD tRaFFiC tUnneLS
appendixes | 139
APPendix d melbourne city link tunnels
The Melbourne City Link (MCL) comprises:
the Southern Link, which links the West Gate Freeway and the South Eastern Freeway, and •
includes two tunnels:
the Burnley (eastbound) tunnel, which is 3.4 km long•
the Domain (westbound) tunnel, which is 1.6 km long•
the Western Link, which links the Tullamarine Freeway and the West Gate Freeway.•
The two unidirectional tunnels of the Southern Link are designed to carry about 99 000 vehicles per day. Both tunnels are located in mixed-use zones that combine industrial and residential use. Vehicle exhaust and air from each tunnel is discharged from a ventilation stack near the tunnel’s exit—the Domain’s stack is located in Southbank; the Burnley’s stack is in Richmond. The Burnley tunnel also has a ventilation shaft at Swan Street, Olympic Park, midway along the tunnel, to supply additional ambient air during peak traffic loads.
Pollutants emitted from the tunnels are identical to those emitted from similar surface roads. They include NO
2, CO, PM
10, PM
2.5, 1,3-butadiene, benzene and formaldehyde.
d1 environMentAl reGulAtionThe ventilation system used in the MCL tunnels is scheduled under the Environment Protection (Scheduled Premises and Exemptions) Regulations 1995, because it reaches the threshold of > 500 kg CO/day discharged from each stack. Therefore, the system was subject to works approval by Environment Protection Authority (EPA) Victoria, in accordance with Section 19A of the Environment Protection Act 1970. The tunnel ventilation systems currently also require a licence from EPA Victoria.
In the works approval application, the applicant must demonstrate that the emissions from the ventilation system comply with the State Environment Protection Policy (The Air Environment), referred to as the ‘Air SEPP’.6 At the time of the application for the MCL, there were no health-based objectives established for PM
10 or PM
2.5 in the Air State Environment Protection Policy
(SEPP), and no national standards. Twenty-four-hour objectives for PM10 of 50 μg m–3 and for PM
2.5
of 25 μg m–3 were adopted as design criteria for the project. A health risk assessment was also conducted, acknowledging that no threshold for adverse health effects from exposure to particles has been observed in epidemiological studies. This assessment helped to determine whether the design of the ventilation system was sufficient to provide the beneficial uses identified in the Air SEPP—in particular, protecting ‘life, health and wellbeing of human beings’. All other pollutants were assessed against the Air SEPP and were found to meet the objectives specified.
As part of the works approval application, extensive air dispersion modelling was conducted for each tunnel. Modelling was conducted in accordance with the requirements of the Air SEPP, using the regulatory model AUSPLUME. The modelling looked at worst-case emission scenarios under normal operating conditions; that is, congested traffic conditions with the tunnel at maximum capacity. A large receptor grid was used for the modelling, which included sensitive locations, such as the nearest houses and schools. For the Domain tunnel, modelling also included elevated ‘flagpole’ receptors, to assess the potential impact on apartments in the vicinity of the proposed Grant St stack in Richmond, as the areas has a significant proportion of high-rise apartment buildings.
The SEPP required background data to be included in the model. In the case of PM10 and PM
2.5,
this involved a daily time-varying background, for which existing ambient air quality in the area were used. The data were not modified to account for changes in ambient air quality due to redistribution of traffic once the tunnels were in operation. This approach builds conservatism
6 the Sepp (the air environment) was split into two policies in 1999—Sepp (ambient air Quality), referred to as the Sepp(aaQ), and Sepp (air Quality Management), referred to as the Sepp(aQM), following the making of the ambient air Quality nepM in 1998. the Sepp (aaQ) adopts the ambient air Quality nepM in victorian legislation. the Sepp (aQM) provides the statutory framework for the management of air quality in victoria. the Sepp (aQM) was revised in 2001 and contains objectives for both pM10 and pM2.5.

aiR QUaLitY in anD aRoUnD tRaFFiC tUnneLS
140 | appendixes
into the assessment, because it effectively assumes the tunnels represent an additional source of pollution. Meteorological and emissions data for the full year of 2001 was used to predict the full years modelling for 2011.
The results of the modelling indicated that the existing air quality in the area dominated the predicted combined ground-level concentrations of all pollutants. This is shown in Table D1 for the Burnley stack. The Burnley stack was expected to give rise to the maximum potential impact given that it was the longer of the two tunnels and the ventilation stack was proposed at 20 m high compared with 46 m for the Domain stack. The Domain stack is higher due to the proximity of high-rise apartments.
Table D1 Contribution of background levels to the maximum likely ground-level concentration
PollutantAveraging time (hours)
Maximum likely ground-level concentration (µg m–3)
contribution from background (µg m–3)
Proportion from background (%)
Co 1 6.33 6.11 97
8 3.12 2.95 95
no2 1 0.0623 0.0610 98
24 0.031 0.030 97
pM10 24 40.3 38.9 97
pM2.5 24 24.0 23.6 98
Co = carbon monoxide; no2 = nitrogen dioxide; pM2.5 = particles of less than 2.5 μm; pM10 = particles of less than 10 μm
Figure D1, below, shows a time-series plot of 24-hour average PM10
concentrations. The plot includes the:
background•
contribution from the ventilation system •
total for the receptor predicted to experience the maximum likely ground-level concentration •
in the vicinity of the Burnley ventilation stack; the figure shows the relative contribution of background and ventilation system emissions at this receptor.
Figure D1 shows that the emissions from the ventilation stack were predicted to be small (< 3% of the combined PM
10 levels predicted) in that area, under the design put forward in the works
approval application.
figure d1 time series plot PM10 concentrationsWorst Case Receptor
0
5
10
15
20
25
30
35
40
45
50
1 13 25 37 49 61 73 85 97 109
121
133
145
157
169
181
193
205
217
229
241
253
265
277
289
301
Day
PM10
(ug
/m3)
Combined EmissionsBackgroundEmissions From City Link

aiR QUaLitY in anD aRoUnD tRaFFiC tUnneLS
appendixes | 141
Dispersion modelling was used to assess emissions from major roads in the vicinity of the Burnley ventilation stack, using the US Caline4 model. Eighteen road links were used to approximate the geometry of roads in the area. The diurnal traffic density along each link was estimated from the project scope and technical requirements.
Lane width for all road links was assumed to be 3.5 m. The road links used in this simulation are indicated in Figure D2. Receptor locations were assigned at approximately 100 m intervals over an 800 m × 800 m area, centred on the Burnley vent. The nearest receptor to the road was 50 m from the road centreline. Crosses mark the receptor locations used in this simulation.
Caline4 was modified to accept a full year of meteorological data. The Paisley 1992 meteorological data file, used in the AUSPLUME vent simulations for the works approval, was also used for this Caline4 simulation.
Maximum 24-hour average PM10 concentration contours are shown in Figure D2. The maximum
predicted concentration of PM10
due to major road emissions during 1992 was 20.9 μg m–3. These maximum average concentrations would not necessarily occur at the same time or location as the maximum contribution from the Burnley ventilation stack. The meteorological conditions that give rise to maximum concentrations near surface roads (ground-level sources) are calm, stable conditions. In the case of elevated sources, such as the vent stack, such conditions do not force the plume to the ground; therefore, the impact of the vent emissions at ground level is minimal under calm, stable conditions. For example, a maximum predicted impact of 26.2 μg m–3 due to Burnley ventilation stack emissions was predicted to occur with meteorology similar to that occurring on 11 November 1992. Under these conditions, the maximum 24-hour average concentration predicted by Caline4 due to neighbourhood road emissions was 3.5 μg m–3.
figure d2 PM10 background concentrations due to emissions from major roads

aiR QUaLitY in anD aRoUnD tRaFFiC tUnneLS
142 | appendixes
Background concentrations of pollutants are generally higher close to major roads. However, highest concentrations are likely to occur when the ventilation system makes a relatively small contribution. The location of predicted maximum likely ground-level concentrations is also different for the two sources—major roads and ventilation systems. The contribution from major roads not in the immediate vicinity of the stacks is included in the background pollutant contribution. The emissions from nearby major roads were predicted to not have a significant impact on the predicted maximum ground-level concentrations.
Modelling was also run for discrete receptors elevated above ground level (flagpole receptors) in the vicinity of Grant St. These receptors were specified for the Guilfoyle and Sovereign apartment blocks, on the building face closest to the ventilation stack, at each floor level and on the eastern face of the Sovereign building. Several modelling options were run to determine the impact of surrounding buildings on the dispersion of emissions from the ventilation stack. The effect of airflow around the buildings was found to be significant and this worst-case scenario was factored into the design of the ventilation stack and subsequent design making.
All predicted maximum likely concentrations occurred when taking account of the building wake. The results of this modelling are shown in Table D2.
table d2 Predicted maximum likely concentrations Grant st, elevated (flagpole) receptors
indicator Averaging time (hours)design ground-level concentration Predicted concentration
Co 1 30 ppm 6.33 ppm
8 10 ppm 3.24 ppm
no2 1 0.15 ppm 0.07 ppm
24 0.06 ppm 0.03 ppm
pM10 24 50 μg m–3 39.7 μg m–3
pM2.5 24 25 μg m–3 24 μg m–3
Co = carbon monoxide; no2 = nitrogen dioxide; pM2.5 = particles of less than 2.5 μm; pM10 = particles of less than 10 μm; ppm = parts per million
As part of the works approval assessment, EPA Victoria conducted a health risk assessment, evaluating the public health risk from PM
10 and PM
2.5 emissions from the MCL ventilation stacks
(Denison and Dawson 1998). The assessment considered estimates of:
particle levels that would be present in the absence of the tunnel•
the incremental increase in particle levels due to the tunnel•
local population statistics•
appropriate dose–response relationships for the selected indicators of morbidity and mortality. •
Only the ventilation stack located in Richmond was considered. This stack serves the longer of the two tunnels. It was therefore predicted to have the highest emission rates for all the pollutants; in consequence, ground-level concentrations of particles were predicted to be greatest in the vicinity of this ventilation stack. Modelling conducted by EPA Victoria as part of the works approval assessment found no significant overlap of emissions from the two ventilation stacks. The method was based on that used by the United States Environmental Protection Agency (US EPA) in its risk assessment for particulate matter in Philadelphia and Los Angeles (Abt Associates 1996).
The principal conclusion from the Denison and Dawson (1998) study is that—in terms of acute and chronic mortality and morbidity—the emissions from the MCL tunnel ventilation systems were predicted to have a minimal impact on public health in the defined area. As the predicted contribution from emissions from MCL ventilation stacks are only 2.5% of background levels for PM
10 and 3.5% for PM
2.5, the risk posed by these emissions is minimal when compared with
the existing risk from background levels of these pollutants. In all cases, the number of people

aiR QUaLitY in anD aRoUnD tRaFFiC tUnneLS
appendixes | 143
adversely affected by the emissions from the MCL tunnels ventilation stacks was predicted to be very small.
Three national and international peer reviewers, as well as the Victorian Department of Human Services, reviewed the health risk assessment. The reviewers all concluded that the methodology used was suitable and agreed with the conclusions of the assessment.
Works approval for the construction of the MCL tunnels was issued by EPA Victoria in July 1997. The tunnels were constructed and operate under EPA Licence EA41502. The licence requires in-tunnel and in-stack monitoring of pollutants. No portal emissions are allowed except under defined situations, including emergency situations. Licence discharge limits have been set, based on the worst-case emission design used in the works approval application, and the results of the dispersion modelling, which showed no adverse impact on air quality in the surrounding environment.
A high level of conservatism was built into the modelling and assessment of the emissions from the ventilations stacks for the MCL tunnels. However, the approval for the Burnley tunnel required it to be built with foundations that would allow the stack to be increased in height to provide greater dispersion of emissions. Thus, if monitoring programs demonstrated that the tunnels were affecting local air quality, the height of the stack could be increased. The approval also required space to be made within the ventilation stack for the retrofitting of air pollution control equipment, should equipment become available that would demonstrably reduce emissions from the stack. Such equipment was not available at the time of the assessment, a conclusion supported by the Administrative Appeals Tribunal and an independent government inquiry (Bongoirno 2000). Subsequent air quality monitoring has shown that there is no demonstrable impact on local air quality from the emissions from the stacks at either location (see Section D5).
The issue of works approval was subject to third-party appeals in the Administrative Appeals Tribunal. A local group and the City of Yarra challenged EPA Victoria’s decision based on concerns about the potential risk to health of the local community in Richmond. The tribunal heard evidence from all parties and ultimately upheld EPA Victoria’s decision to issue works approval.
d2 oPerAtion of tHe Melbourne city link tunnels
The MCL tunnels were constructed in accordance with the works approval conditions and were opened in 2000. The ventilation systems for the Burnley and Domain tunnels are designed to deal with normal operation (ie normal traffic flow) and incident scenarios such as a vehicle fire. A complete description of the systems is beyond the scope of this document. Accordingly, the information that follows relates to normal operation of the ventilation systems.
D2.1 BURnLeY tUnneL
The Burnley tunnel is 3.4 km long and 65 m deep in the deepest section. The grade at the exit is greater than 5%, which places extra load on vehicles climbing out of the tunnel.
Traffic travels from east to west and causes air to travel longitudinally down the tunnel. This phenomenon is known as the ‘piston effect’. The length of the tunnel is insufficient for the piston effect to adequately ventilate the tunnel at all times. Therefore, 36 jet fans located within the tube provide forced ventilation and control the velocity of air within the tunnel; four of the fans are reversible.
Air is extracted from the tunnel through the Burnley ventilation stack, which is approximately 20 m high, and is partitioned into a primary and secondary stack. Extraction is achieved using axial fans, of which there are four in the primary stack and six in the secondary stack.
Fresh air can also be introduced into the tunnel through the Swan St shaft. There are three axial fans in the shaft, of which two can be used at any one time. The design of the tunnel is shown in Figure D3.

aiR QUaLitY in anD aRoUnD tRaFFiC tUnneLS
144 | appendixes
figure d3 diagrammatic representation of the burnley tunnel
Swan St Shaft
JFE 1-17 JFE 18-36
Secondary StackPrimary Stack
Burnley ventilation stack
The various fans are controlled by the ventilation control algorithm that resides within the plant control and monitoring system. The function of the algorithm is to maintain the air quality within defined limits and to ensure a net inflow of air into the exit portal. It achieves this using pollutant concentration and air velocity data from sensors within tunnels. Sensors located at each portal record portal air flux, speed and direction, to ensure there are no portal emissions under normal operation of the tunnel ventilation system.
Experience has shown that if the ventilation system for the Burnley tunnel is operated in a manual mode using the fans in the secondary stack, tunnel longitudinal air speed (and hence air extraction capacity) can be substantially increased. This reduces electricity use and associated greenhouse gas emissions. Burnley tunnel is currently being operated in this manner. Even in manual mode, all monitoring alarms are presented to the operator, who takes action in response to the alarm in question.
D2.2 DoMain tUnneL
The Domain tunnel is 1.6 km long and 25 m deep in the deepest section. Traffic travels from west to east, again causing air to travel longitudinally down the tunnel. In contrast to the Burnley tunnel, the short length of the Domain tunnel means that there is more than enough piston effect to adequately ventilate the tunnel. However, at times this effect is excessive and must be reduced. The tunnel contains 12 reversible jet fans located within the tube to control the velocity of the air. Most of the time, these fans operate in reverse to reduce the longitudinal air speed.
Air is extracted from the tunnel through the Grant St ventilation stack, which is approximately 46 m high, using axial fans. There are five axial fans in the ventilation chamber of which four are available for use at any one time. The design of the tunnel is shown in Figure D4.
figure d4 diagrammatic representation of the domain tunnel
Grant Streetventilation stack
JFN 1-12

aiR QUaLitY in anD aRoUnD tRaFFiC tUnneLS
appendixes | 145
Control of the various fans is performed by the ventilation control algorithm that resides within the plant control and monitoring system. This algorithm performs the same function and uses the same types of data as the Burnley tunnel. Also, as with the Burnley tunnel, sensors located at each portal ensure there are no portal emissions under normal operation of the tunnel ventilation system.
The ventilation system in the Domain tunnel is usually operated in a manual mode to improve ventilation efficiency, as with the Burnley tunnel.
d3 ventilAtion systeM desiGn Process
When designing tunnels that are longitudinally ventilated and have zero portal emissions, it is usual practice to construct at least one ventilation stack per tunnel. However, various configurations can work in practice. Two key issues relate to vehicles emissions in and around zero portal emission tunnels—in-tunnel air quality and ambient air quality, both of which are discussed below.
D3.1 in-tUnneL aiR QUaLitY
To determine the appropriate scale for the ventilation system, simulations should be undertaken using appropriate emission factors and expected traffic volumes and traffic mix. Any errors in these initial estimates will manifest themselves in the final design. For example, underestimation of traffic figures or emission factors will generally lead to tunnel ventilation system design that has little or no excess capacity; overestimation of traffic and emission factors will lead to an excess in ventilation capacity.
Another critical issue for in-tunnel air quality is the cross-sectional area of the tunnel. The governing standards advise that tunnel air speeds should be limited to below 10 m s–1. If an air speed greater than 10 m s–1 is required to ventilate the tunnels, then the efficiency of the ventilation system will suffer because of excessive frictional losses induced by the tunnels walls. Also, at air speeds greater than 10 m s–1 there can safety concerns with increased tail winds in the tunnel.
Although air speeds in excess of 10 m s–1 are not specifically prohibited, the standard implies that tunnels requiring air speeds significantly in excess of that figure are poorly designed.
D3.2 aMBient aiR QUaLitY
When designing a tunnel exhaust system, the goal is to locate the exhaust point so that any exhaust air reaching a sensitive receptor is extremely dilute. The Burnley and Domain tunnels achieved this by using ventilation stacks.
The rate at which pollution is generated (the mass rate) is determined by the number and mix of different vehicles, and by the rate at which each vehicle produces the pollutant species in question. This rate is determined from the emission factors.
The mass rate will, in practice, exhibit a diurnal variation; however, it is customary to use the worst case when designing a ventilation stack.
Once the maximum mass rate for a pollutant species has been identified, air dispersion modelling is undertaken (using a model such as AUSPLUME) to establish two critical design parameters—namely, ventilation stack height and exhaust air speed.
System performance is validated after construction using an ambient air monitoring program.
aiR QUaLitY in anD aRoUnD tRaFFiC tUnneLS
146 | appendixes
d4 wAste discHArGe licence eA41502—tunnel ventilAtion
The Burnley and Domain tunnels are Schedule 1 Premises for the purposes of the Environment Protection Act 1970. A works approval was obtained for the construction of both tunnels. Subsequently, a licence was issued for the Domain tunnel, which opened on 16 April 2000. The licence was amended to include the Burnley tunnel, which opened on 22 December 2000. There have also been amendments in relation to maintenance activities.
The waste discharge licence has been issued to Translink Operations Pty Ltd (TLO) by EPA Victoria. It deals principally with the operation of the Burnley and Domain tunnels (in terms of in-tunnel air quality) and discharges from the ventilation stacks. The licence has associated fees (payable by TLO) based on the mass discharge rate. Fees are higher for pollutants that are Class 3 indicators and are specified in the SEPP. Benzene is a Class 3 indicator under the SEPP.
The licence specifies the conditions for the discharge of waste to the environment. It lists:
the mass rate discharge limits•
the requirements for implementing an environment management plan•
the operating requirements for key plant items, to ensure protection of the environment under •
both normal and abnormal conditions
the scope of the performance monitoring program required to demonstrate environmental •
performance and specifies the arrangements for submission of performance monitoring reports and other reports to EPA Victoria.
Lane closure and traffic restrictions in the tunnel are required under the licence if in-tunnel air quality or licence limit for mass discharge exceed the specified limits.
A plan of the premises, including discharge points, is also included in the licence. The waste discharge licence includes quality control and quality assurance measures for the ventilation stack monitoring program.
The waste discharge licence requires that TLO accurately measure and record emissions from the Burnley and Domain tunnel ventilation stacks at all times, in accordance with the EPA Victoria publication, A guide to the sampling and analysis of air emissions (EPA Victoria 2002c). The guide must be followed for the sampling and analysis of CO, NO
x and NO
2, particles as PM
10 and PM
2.5,
temperature and velocity. These data on the ventilation stacks must be made available upon request from any authorised officer of EPA Victoria. The stack-monitoring program must also be operated in accordance with the quality control and quality assurance measures for the ventilation stack monitoring.
The licence originally required that ground-level air quality must be measured and recorded at all times at the monitoring stations, in accordance with A guide to the sampling and analysis of air emissions (EPA Victoria 2002c). This must be done on a continuous basis for CO, NO
2 and PM
10
and PM2.5
.
Two monitoring stations were installed, one in the vicinity of the Burnley stack and the other in the vicinity of the Domain stack. Meteorological data—including wind speed, wind direction and temperature—must be accurately measured and recorded at all times, and made available on request from any authorised officer of EPA Victoria. This requirement for a ground-level monitoring program was removed after the five-year monitoring program demonstrated that no adverse impact from the ventilation stacks had been detected in the surrounding environment (see Section D6). Stack emissions are still monitored on a continuous basis.
All air monitoring reports supplied under the licence to EPA Victoria must be signed by the director or person concerned in the management of the licence holder, who is nominated to verify the truth or correctness of any reports supplied to the organisation under the licence. Monitoring must be conducted by a laboratory accredited by the National Association of Testing Authorities and checked by an independent auditor.

aiR QUaLitY in anD aRoUnD tRaFFiC tUnneLS
appendixes | 147
The licence holder must make available to EPA Victoria traffic data relating to the numbers of vehicles of different classes using the tunnels upon request.
D4.1 iSSUeS aFFeCting in-tUnneL aiR QUaLitY
The licence requires in-tunnel monitoring of CO at four locations along the length of the tunnel. Monitoring is conducted continuously and recorded at one-minute intervals. In-tunnel air quality objectives were set by EPA Victoria and are listed in Table D3.
table d3 in-tunnel objectives—carbon monoxide
carbon monoxide exposure concentration (ppm)
peak 150
tunnel average for 15 minute exposure period 50
tunnel average for continuous exposure in excess of 2 hours 25
ppm = parts per million
EPA Victoria derived these objectives using the Coburn–Foster equation, linking exposure to CO to carboxyhaemoglobin (COHb) levels in blood. The target COHb level was 2.5–3% in the initial calculations. Although travel time through the tunnel is less than five minutes, objectives were set for longer time periods to allow for conditions whereby people may be in the tunnel for longer periods (eg if an accident occurred and blocked traffic). The final in-tunnel objectives listed in Table D3 were obtained by applying a safety factor to the values derived to maintain a COHb level no greater than 2.5%, to ensure that any sensitive individuals in the tunnel at any time would have an additional margin of safety from exposure. The objectives used in MCL and listed in Table D3 are more stringent than the World Road Association (PIARC) objectives for in-tunnel air quality and the 15-minute World Health Organization guideline for CO of 90 ppm.
The peak value in Table D3 applies to any reading that occurs at any time within the tunnel. The objective for exposures in excess of two hours was derived to protect maintenance workers who might be in the tunnels for extended periods of time. This objective is more stringent than the current eight-hour Worksafe standard of 30 ppm. If in-tunnel monitoring indicates that any of these objectives may be exceeded and no additional fan capacity is available, then traffic restrictions or lane closures are required, to ensure that in-tunnel air quality remains within the licence limits.
The MCL tunnels perform much better than the design specifications require, with mass discharge rates much lower than the licence limits. No breaches of the licence limits have been recorded since the tunnels opened. The first annual review of in-stack monitoring found that discharges were well within licence limits, with median mass rate discharge typically no greater than 10% of the licence limits, and maximum hourly flows within 20–40% of the limits for gases and 30–50% for particles (Victoria EPA 2002b). In a second review (Victoria EPA 2004) covering a further two years of operation, the reported values were average hourly mass discharge rates no greater than 15% of licence limits, and maximum flows less than 40% of limits for gases and 60% for particles.
The vast majority of complaints about in-tunnel air quality that Transurban receives relate to visible pollution arising from truck exhaust. It is not uncommon for heavy vehicles to struggle when travelling out of the Burnley tunnel due to the steep grade, and thus to produce excessive smoke.
A section of the truck population is poorly maintained, overloaded or otherwise incapable of travelling at an appropriate speed with the loads that are being carried. Often these vehicles produce excessive smoke. This is the same for surface roads as it is for the tunnels. These trucks slow traffic in the tunnel and can lead to sporadic periods of poor visibility within the tunnel near the exit.
A number of actions are in place to address emissions from diesel trucks and, in particular, poorly maintained vehicles. These include implementation of the Diesel National Environmental

aiR QUaLitY in anD aRoUnD tRaFFiC tUnneLS
148 | appendixes
Protection Measure (NEPM), introduction of new design rules and fuel-quality standards, road-side testing of in-service vehicles, reporting of smoky vehicles and enforcement action. However, some poorly performing vehicles remain in service and can adversely affect air quality both in tunnels and in the vicinity of surface roads.
d5 AMbient Air QuAlity MonitorinG
Under the requirements of the works approval and licence, ambient air quality monitoring was required before and after construction of the MLC tunnels. The monitor stations were installed at Grant St, South Melbourne (Domain tunnel) and Madden Grove, Richmond (Burnley tunnel) (see Figure D5). Monitoring of PM
10 began in April 1997, three years before the opening of the tunnels.
EPA Victoria also operates a fixed-site air monitoring station in Lord St, Richmond, about 1 km from the Burnley stack, monitoring for PM
10, PM
2.5, CO and NO
2.
The licence requires that the results from the continuous monitoring of the tunnel emissions be reported in real time on the TLO website. Where possible this is linked to EPA Victoria’s website.7 Results for EPA Victoria’s ambient monitoring program are also available via its website.
figure d5 Map of Melbourne’s city link tunnels and air quality monitoring sites
ventilation stack CityLink - Grant Street
Burnley Tunnel
EPA - Richmond
CityLink - Madden Grove
ventilation stackCityLink - Rooney Street
West Gate Freeway Domain Tunnel
EPA - Alphington
Eastern Freeway
0 0.5 1 2 3 4Kilometres
Map area
Victoria Parade
Hod
dle
Stre
et
Source: EPA Victoria (2004)
EPA Victoria has conducted a number of reviews of the monitoring data collected for the MCL tunnels, as well as surveillance on stack emissions against the licence discharge limits.
Ambient data collected before the opening of the tunnels showed that patterns of PM10 and PM
2.5
levels at Madden Grove and Grant St were similar to those recorded at other air monitoring stations within the EPA Victoria monitoring network, although the actual values were higher at Madden Grove and Grant St. Pollutant levels are inherently higher at inner city locations than in suburban locations, particularly when the sites are located near major traffic routes. As the Grant St and Madden Grove stations are located close to major traffic routes on surface roads, the higher levels recorded at these locations were expected. However, the day-to-day variation in pollution levels follows the same trend as that observed at other sites.
During 1998–99, peak levels at both Madden Grove and Grant St were found to be significantly higher than those observed at other locations within the network, but were well within the licence requirements. Site visits by EPA Victoria officers found that local construction activities were affecting the particle levels recorded at these sites, rather than emissions from the ventilation stacks.7 http://www.epa.vic.gov.au

aiR QUaLitY in anD aRoUnD tRaFFiC tUnneLS
appendixes | 149
The impact of emissions from the MCL tunnels ventilation stacks was analysed primarily by comparing the data with those from other Melbourne monitoring sites in the EPA Victoria network. These comparisons were done to determine whether:
levels or trends in air quality at the MCL sites differed from those observed elsewhere in •
Melbourne
local air quality differed before and after the opening of the tunnels•
intervention levels in SEPP (air quality management—AQM) had been exceeded.•
Intervention levels in the SEPP (AQM) are used to assess whether there are local air pollution problems that might represent an unacceptable risk to human health. They are used as trigger levels that, if exceeded, initiate further investigation or action to improve air quality. They apply primarily at ‘hot-spots’ rather than at locations considered to be representative of regional air quality that are assessed against the ambient air quality (AAQ) standards in the SEPP (AAQ) and NEPM (AAQ).
The first annual post-opening review in 2002 (Victoria EPA 2002b) found that:
PM10
levels…are similar to the EPA network medians. No change has been detected in the levels relative to the EPA network post-opening of the tunnels.
Some studies suggest that, at Grant St, the difference between median PM10 concentrations from
the tunnel monitor and the network has reduced since opening compared with pre-opening by 3–5 μg m–3. This fall appears to reflect reductions at the tunnel sites, rather than increases at the network sites. Such a reduction was not observable in PM
2.5. The review went on to state:
Whilst exceedences of the PM10
objective
(50 μg m–3) at both Madden Grove and Grant St have occurred, elevated PM
10 levels are observed in the EPA network when this
occurs. These results tend to indicate that City Link emissions are not the primary source of the particle levels monitored.
It then notes the same conclusion for PM2.5
, and also states:
CO [and NO2] levels monitored at Madden Grove and Grant St are similar to the EPA
network medians, and well within [Victoria State Environment Protection Policy] objectives. The analysis of air quality data has detected no impact of the emissions from the City Link project on local air quality.
A second review (EPA Victoria 2004) covered another two years of data (March 2002 to February 2004 inclusive). During this period, the Madden Grove site in Burnley had been shut down (November 2003) when the operators (TLO) lost tenure on the site. The second review came to the same main conclusions as the first review. Overall, the PM
10 and PM
2.5 levels at the MCL
sites were about 20% higher than those recorded at other sites in the Melbourne air monitoring network. This difference was also observed before the opening of the tunnels, indicating that the emissions from the ventilation stacks were not significantly affecting local air quality. As a result, it was concluded that reviews could be made less frequently.
Several exceedences of the Victoria PM10 intervention level of 60 μg m–3 (and 36 μg m–3 for PM
2.5)
had been observed at Grant St and Madden Grove. These exceedences were related to identified external sources (bushfires, fuel reduction burning and dust storms). Significant bushfires were experienced in Victoria in 2003 that affected Melbourne’s air quality. This led to exceedences of air quality objectives and intervention levels across the entire network. In addition, a large dust storm arising from prolonged drought conditions also affected air quality in Melbourne during March 2003.
Monitoring of NO2 showed that no exceedences of the intervention levels were recorded at any
time at any station and the data from the MCL sites followed the same trends as other monitoring stations in Melbourne. The NO
2 levels were higher at the City Link sites reflecting their inner city
locations and proximity to major surface traffic routes.
aiR QUaLitY in anD aRoUnD tRaFFiC tUnneLS
150 | appendixes
Carbon monoxide levels were also well within intervention levels at all monitoring stations, including MCL, and followed a similar trend across the network. Maximum levels recorded at all stations were similar to those recorded at the MCL sites (EPA Victoria 2004).
Short-term measurements were also made in December 2000 to March 2001, at the base of the Burnley tunnel stack, using a mobile laboratory. The main aim was to investigate whether downwash in the wake of the stack could be observed. This can occur during periods of high winds when the stack emissions cannot escape the ‘cavity zone’ in the lee of the stack structure. It can potentially drag almost undiluted tunnel emissions to ground level at the base of the stack, and for typically a few tens of metres downwind. There are houses within this radius of the Burnley stack, and modelling suggested a risk of elevated concentrations there. Further measurements were made by TLO for a year (1 June 2001 to 31 August 2002). It was concluded that such downwash, although predicted in numerical modelling, was not observed on-site (Victoria EPA 2002a, 2003) confirming the conservative nature of the modelling that had been conducted as part of the works approval assessment process.
Supplementary monitoring was commissioned jointly by the City of Yarra and the City of Stonnington, representing the communities potentially affected by the tunnel emissions (City of Yarra and City of Stonnington 2002). This monitoring was conducted independently of EPA Victoria. Monitoring began early in 2000, the year of tunnel opening, and ceased in 2002. Levels of CO and PM
10 were measured at three sites near the Burnley tunnel stack—one 250 m from the stack in the
location predicted by modelling to receive the maximum impact; the others at 400 m and 650 m from the stack. The method used to measure PM
10 deliberately did not comply with Australian standards.
The express intention was to detect short-term impacts (in the order of minutes), which standard techniques such as filter sampling are not capable of doing. The output of the optical instrument used (TSI DustTrak) was not true PM
10, but the objective of identifying the tunnel stack emissions
could still be achieved by correlating rises in one out of the three monitors with periods when that monitor was downwind of the stack. During two years of monitoring, no impact of the stacks was detected. The choice of methods for monitoring PM
10, especially when using air quality as an
indicator of health risk, is discussed further in Section 7.6. This monitoring was established with the intent of measuring the impact of the stacks, but was unable to detect such an impact.
In summary, monitoring appears to show that the Burnley and Domain tunnel stack emissions have minimal impact on their surrounding communities in terms of long-term measures of air quality. The difference between the measured concentrations of PM
10 near the stacks and at other
locations in urban Melbourne is of a similar order to the accuracy of the instrumentation employed. The data presented are not sufficiently sensitive to determine whether there has been a localised improvement or worsening of air quality as a result of traffic being diverted into the tunnels.
d6 suMMAry
The experience with MCL tunnels has demonstrated that rigorous assessment during the design phase of the tunnel is critical to the successful operation of the tunnels in terms of both in-tunnel and external air quality.
The level of conservatism built into the modelling during the design stage and works approval application, including the use of worst-case scenarios, has been reflected in the results of monitoring air quality while the tunnels are in operation. Mass emission rates were well below the licence limit and effects on ambient air quality could not be detected. The use of conservative in-tunnel limits for CO to trigger management responses (eg increased ventilation and traffic restrictions) ensures that in-tunnel air quality will not, under normal operating conditions, affect the health of tunnel users or workers within the tunnel.
Regulation of the operation of tunnels by licensing and the requirements for monitoring (in-stack, in-tunnel and ambient air), provide an ongoing mechanism to minimise the effect of exposure to air pollution from the tunnels on human health, and to ensure that performance of the tunnels is transparent and accountable.

aiR QUaLitY in anD aRoUnD tRaFFiC tUnneLS
appendixes | 151
stud
ytu
nnel
year
dur
atio
n of
ca
mpa
ign
Mea
sure
men
t lo
catio
nsa
mpl
ing
tech
niqu
esM
easu
red
para
met
ers
offl
ine
anal
ysis
alle
n et
al (
2001
)C
alde
cott
1997
3 ho
urs
each
ov
er
4 co
nsec
utiv
e da
ys
40 m
in fr
om e
xit
of e
astb
ound
tub
esFi
lter
sam
ples
, 10-
stag
e ca
scad
e im
pact
orpM
10, p
M1.
9 n
o3–
, So
42–, C
l–
nH
4+, n
H3
eC, o
C e
lem
ents
Filte
r w
eigh
ing
io
n ch
rom
atog
raph
y co
lrim
etry
t
herm
al-o
ptic
al
neu
tron
aci
vatio
n
Che
ng e
t al
(20
06)
Shin
g M
un20
03/0
44
× 2
hou
rs
in s
umm
er,
12 ×
1 h
our
in w
inte
r
686
and
1286
m
into
wes
tbou
nd
tube
Filte
r sa
mpl
es
Che
mi-l
umin
esce
nce
gas
filte
r co
rrel
atio
n
pM2.
5 n
o, n
o2,
no
x C
o
Filte
r w
eigh
ing
De
Fré
et a
l (19
94)
Cra
eybe
ckx
1991
11 d
ays
Unc
lear
Che
milu
min
esce
nce
Uv
fluo
resc
ence
iR
Fl
ame
ioni
satio
n Sa
mpl
e ba
gs
Hi-v
ol s
ampl
ers
no
, no
2 So
2 C
o
nM
HC
vo
Cs
pM10
envi
ronm
ent
aus
tral
ia (
2002
)D
omai
n20
01/0
25
days
in 4
se
ason
sex
it st
ack
Do
aS
not
sta
ted
Dn
pH
Mic
rovo
l/Hi-v
ol a
nd p
UF
SUM
Ma
H
eavy
met
als
Co
, no
, no
2 pM
10, p
M2.
5 C
arbo
nyls
paH
s vo
Cs
teflo
n fil
ters
HpL
C
pix
e
Fras
er e
t al
(19
98)
van
nuy
s19
934
hour
s75
m fr
om e
xit
Bag
sam
ples
H
i-vol
dic
hoto
mou
s vi
rtua
l im
pact
ors
with
pU
F ca
rtrid
ges
Lo-v
ol s
ampl
ers
eC, o
C, S
io2,
aL 2o
3,
no
3-, S
o42-
, Ci-
nH
4+, n
H3,
spe
ciat
ed
voC
s
Filte
r w
eigh
ing
gC
-MS
gC
-FiD
g
C-e
CD
gel
ler
et a
l (20
05)
Cal
deco
tt20
046
hour
s ea
ch
on 4
day
sU
ncle
arQ
trac
SM
pS+
CpC
M
oU
Di
Hi-v
ol s
ampl
er
Co
pa
rtic
le n
sd
pM10
, pM
2.5,
met
als
eC, o
C
no
3-, S
o42-
Ci-
eC, o
C
Filte
r w
eigh
ing
xR
F t
herm
al-o
ptic
al
ion
chro
mat
ogra
phy
gid
hage
n et
al
(200
3)Sö
derle
ds19
9815
day
s13
5 m
in fr
om
nort
hbou
nd e
xit
DM
pSpa
rtic
le n
sd
APPendix e fixed-Point meAsurement cAmPAigns inside roAd tunnels referred to in this rePort

aiR QUaLitY in anD aRoUnD tRaFFiC tUnneLS
152 | appendixes
stud
ytu
nnel
year
dur
atio
n of
ca
mpa
ign
Mea
sure
men
t lo
catio
nsa
mpl
ing
tech
niqu
esM
easu
red
para
met
ers
offl
ine
anal
ysis
gilli
es e
t al
(20
01)
Sepu
lved
a19
9617
× 1
hou
r pe
riods
ove
r 5
days
Unc
lear
Med
-vol
sam
pler
spM
10, p
M2.
5 el
emen
ts
no
3-, S
o42-
, Ci-
eC, o
C
Filte
r w
eigh
ing
xR
F io
n ch
rom
atog
raph
y t
herm
al-o
ptic
al
gou
riou
et a
l (20
04)
gra
nd M
are
2002
3 da
ysM
id-p
oint
eLpi
part
icle
nsd
gro
sjean
et
al
(200
1)tu
scac
ora
1999
10 h
ours
inle
t an
d ou
tlet
Dn
pH-c
oate
d ca
rtrid
ges
Car
bony
lsLC
-Da
D-a
pCi-M
S
gro
ss e
t al
(20
00)
Cal
deco
tt19
973
hour
s
each
ove
r
4 co
nsec
utiv
e da
ys
east
ern
exit
ato
FMS
Sing
le p
artic
le
aero
dyna
mic
dia
met
er
and
com
posit
ion
HKp
U (
2005
), W
ang
et a
l (20
06)
Shin
g M
un
Sout
h Sh
ing
Mun
n
orth
t
seun
g Kw
an
o
2003
/04
4 m
onth
s ea
ch in
su
mm
er/
win
ter
350
m fr
om e
xit
(Sou
th)
686
m fr
om e
xit
(nor
th)
256
m fr
om e
xit
(tKo
)
Filte
r sa
mpl
e a
voC
S pU
F D
npH
pu
lsed
fluor
esce
nce
Che
mi-l
umin
ensc
ence
g
as fi
lter
corr
ecla
tion
pM25
, pM
com
posit
ion
voC
s pa
Hs
Car
bony
ls So
2 n
o, n
o2
Co
Filte
r w
eigh
ing,
xR
F, an
ion
chro
mat
ogra
phy,
colo
rimet
ry,
atom
ic a
bsor
ptio
n sp
ectr
opho
met
ry, t
herm
al/
optic
al
gC
-MSD
/FiD
/eC
D, H
pLC
/Uv
H
pLC
Ho
et a
l (20
07)
Shin
g M
un20
03/0
44
mon
ths
each
in
sum
mer
/w
inte
r
686
m a
nd 1
286
m
from
ent
ranc
eD
npH
carb
onyl
sH
pLC
imho
f et
al (
2006
)pl
abut
sch
King
sway
2001
20
037
days
6
days
Mid
-poi
nt
exit
and
entr
ance
SMpS
t
eoM
C
hem
i-lum
inse
scen
ce
part
icle
nsd
, pM
10/p
M2.
5 n
ox
indr
ehus
and
va
ssbo
tn (
2001
)H
oyan
ger
1994
19
9520
day
s 25
day
s2
km fr
om
entr
ance
iR a
bsor
ptio
n C
hem
i-lum
ines
cenc
eC
o
no
, no
2
indr
ehus
and
ara
lt (2
005)
Bom
lafjo
rd20
01/0
26
non-
cons
ecut
ive
wee
ks
4 sit
es a
long
leng
thel
ectr
oche
mic
al c
ell
Back
-sca
tter
Co
, no
a
eRo
SoL
Kean
et
al (
2001
)C
alde
cott
1999
2 ho
urs
(pea
k),
8 w
eekd
ays
entr
ance
, and
exi
tD
npH
Car
bony
lsLC
-Da
D-a
pCi-M
S

aiR QUaLitY in anD aRoUnD tRaFFiC tUnneLS
appendixes | 153
stud
ytu
nnel
year
dur
atio
n of
ca
mpa
ign
Mea
sure
men
t lo
catio
nsa
mpl
ing
tech
niqu
esM
easu
red
para
met
ers
offl
ine
anal
ysis
Krist
enss
on e
t al
(2
004)
Söde
rleds
1998
/09
2 m
onth
s37
0 an
d 96
5 m
in
to n
orth
boun
d tu
be
Hi-v
ol s
ampl
ers,
teo
M
Chr
ompa
ck
Dn
pH
Filte
rs, p
UF
DM
pS
Che
mi-l
umin
esce
nce
nD
iR
pM10
Bt
x
ald
ehyd
es a
nd k
eton
es
paH
s el
emen
ts
part
icle
nsd
n
ox
Co
eC
, oC
gC
/FiD
H
pLC
g
C/M
S pi
xe
Lash
ober
et
al
(200
2)Ka
iserm
uhle
n20
0219
day
sa
ppro
x. m
id-p
oint
Filte
r sa
mpl
ing
eC, o
C
ions
m
etal
s
the
rmal
/nD
iR
ion
chro
mat
ogra
phy
et-a
aS
Mcg
augh
ey e
t al
(2
004)
Was
hbur
n20
002
× 2
hr
sam
ples
, 4
days
50 m
from
nor
th
entr
ance
Che
mi-l
umin
esce
nce
Can
ister
no
x C
o, H
Cg
C-F
iD
phul
eria
et
al (
2006
)C
alde
cott
2004
6 ho
urs
each
on
4 d
ays
50 m
from
exi
tsH
i-vol
sam
pler
eC
paH
s
pier
son
et a
l (19
96)
Fort
McH
enry
1992
11 x
1 h
r pe
riods
ends
and
mid
-poi
ntBa
g sa
mpl
ers
Can
ister
D
npH
Co
, no
, no
2 n
MH
C
carb
onyl
s
nD
iR c
hem
i-lum
ines
cenc
e
Schm
id e
t al
(20
01)
taue
rntu
nnel
2007
Unc
lear
3.2
km fr
om
sout
hbou
nd
entr
ance
Uv
fluo
resc
ence
, nD
iR
Che
mi-l
umin
esce
nce,
FiD
D
npH
So2
Co
n
ox
nM
voC
C
arbo
nyls
Btx
HpL
C
FiD
Stae
helin
et
al (
1995
,8),
Wei
ngar
tner
et
al
(199
7)
gub
rist
1993
7 da
ys
(incl
. 7 ×
1 h
r sa
mpl
es)
entr
ance
and
exi
tC
anist
ers
Dn
pH
teo
M
phot
oem
issio
n D
Ma
+ C
pC
aet
halo
met
er
epith
anio
met
er
no
, no
x, C
o, H
C
ald
ehyd
es
pM3
ppa
H
part
icle
nsd
eC
su
rfac
e ar
ea
FiD
, gC
-MS
ion
chro
mat
ogra
phy
Stem
mle
r et
al
(200
5)g
ubris
t20
0227
day
s20
0 m
from
en
tran
ce a
nd
100
m fr
om e
xit
voC
sg
C-M
S

aiR QUaLitY in anD aRoUnD tRaFFiC tUnneLS
154 | appendixes
stud
ytu
nnel
year
dur
atio
n of
ca
mpa
ign
Mea
sure
men
t lo
catio
nsa
mpl
ing
tech
niqu
esM
easu
red
para
met
ers
offl
ine
anal
ysis
Ster
nbec
k et
al
(200
2)t
ings
tad
Lund
by19
99
2000
5 ho
urs
per
tunn
el50
m (
Lund
by
150
m)
from
exi
t an
d en
tran
ce
Filte
r sa
mpl
est
Sp, p
M10
, met
als
Win
gfor
s et
al
(200
1)Lu
ndby
2000
4 ×
2 –
4
hr s
ampl
es20
0 m
from
en
tran
ce a
nd e
xit
Hi-v
ol s
ampl
erpM
10, p
M2.
5, pM
1 H
C
paH
Filte
r w
eigh
ing
gC
-FiD
g
C-M
S
ato
FMS
= a
eros
ol t
ime
of fl
ight
mas
s sp
ectr
omet
er; a
voC
S =
am
bien
t vo
latil
e or
gani
c ca
nist
er s
ampl
er; B
tx
= b
enze
ne, t
olue
ne, x
ylen
es; D
Ma
+ C
pC =
diff
eren
tial m
obili
ty
anal
yser
+ c
onde
nsat
ion
part
icle
cou
nter
; DM
pS =
diff
eren
tial m
obili
ty p
artic
le s
izer
; Dn
pH =
2,4
-din
itrop
heny
lhyd
razi
ne; D
oa
S =
diff
eren
tial o
ptic
al a
bsor
ptio
n sp
ectr
osco
py;
eC =
ele
men
tal
carb
on; e
CD
= e
lect
ron
capt
ure
dete
ctio
n; e
Lpi =
ele
ctric
al lo
w p
ress
ure
impa
ctor
; et-
aa
S =
ele
ctro
-the
rmal
ato
mic
abs
orpt
ion
spec
tros
copy
; FiD
= fl
ame
ioni
satio
n de
tect
or;
gC
-eC
D =
gas
chr
omat
ogra
phy—
elec
tron
cap
ture
det
ecto
r; g
C-F
iD =
gas
chr
omat
ogra
phy—
flam
e io
nisa
tion
dete
ctor
; gC
-MS
= g
as c
hrom
atog
raph
y—m
ass
spec
trom
etry
; H
pLC
= h
igh
perfo
rman
ce li
quid
chr
omat
ogra
phy;
iR =
infr
ared
; LC
-Da
D-a
pCi-M
S =
liqu
id c
hrom
atog
raph
y w
ith d
etec
tion
by d
iode
arr
ay u
ltrav
iole
t sp
ectr
osco
py a
nd b
y at
mos
pher
ic p
ress
ure
nega
tive
chem
ical
ioni
satio
n m
ass
spec
trom
etry
; Mo
UD
i = m
icro
-orifi
ce u
nifo
rm d
epos
it im
pact
or;
nD
iR =
non
disp
ersiv
e in
fra-
red;
nM
HC
= n
onm
etha
ne
hydr
ocar
bon;
nsd
= n
orm
al-s
ize
dist
ribut
ion;
oC
= o
rgan
ic c
arbo
n; p
aH
= p
olyc
yclic
aro
mat
ic h
ydro
carb
on; p
ixe
=pa
rtic
le in
duce
d x-
ray
emiss
ion;
pU
F =
pol
yure
than
e fo
am
plug
s; SM
pS =
sca
nnin
g m
obili
ty p
artic
le s
izer
; SU
MM
a =
typ
e of
can
ister
use
d to
sam
ple
voC
s; t
eoM
= t
aper
ed e
lem
ent
osci
llatin
g m
icro
bala
nce;
tKo
= t
seun
g Kw
an o
tun
nel;
Uv
= u
ltrav
iole
t; vo
C =
vol
atile
org
anic
com
poun
d; x
RF
= x
-ray
fluo
resc
ence
.

aiR QUaLitY in anD aRoUnD tRaFFiC tUnneLS
appendixes | 155
APPendix f studies identified but not included in the rePort
Authors reference title reason for exclusion
Bari and nasr (2005) tunnelling and Underground Space technology 20:281–290
Simulation of smoke from a burning vehicle and pollution levels caused by traffic jam in a road tunnel
Deals with emergency (fire) scenario only
Barrefors (1996) the Science of the total environment 189/190:431–435
air pollutants in road tunnels very limited data, out of date
Ballesteros-tajadura et al (2006)
tunnelling and Underground Space technology 2121–28
influence of the slope in the ventilation semi-transversal system of an urban tunnel
Deals with emergency (fire) scenario only
Bellasio (1997) atmospheric environment 31(10):1539–1551
Modelling traffic air pollution in road tunnels
Discusses an emission modelling approach— not sufficiently relevant
Bring et al (1997) tunnelling and Underground Space technology 12(3):417–424
Simulation and measurement of road tunnel ventilation
Model of air flow in Söderledstunnel
tunnel-specific and not sufficiently relevant
Dimashki et al (2000) atmospheric environment 34:2459–2469
Measurements of nitro-paH in the atmospheres of two cities
nitro-paH a highly specific noncarcinogenic pollutant not specified in contract or requested by Working Committee
Funasaka et al (1998) environmental pollution 102:171–176
Characteristics of particulates and gaseous pollutants in a highway tunnel
too much missing data, including identification of studied tunnel, traffic data
Jamriska et al (2004) environmental Science and technology 38:6701–6709
Diesel bus emissions measured in a tunnel study
Bus-only emissions too specific for our brief
John et al (1999) atmospheric environment 33:3367–3376
Comparison of emission factors for road traffic from a tunnel study (gubrist tunnel, Switzerland) and from emission modelling
no new data other than those presented elsewhere
Katestone group, (2003) Report from Katestone environmental to pike pike Fenwick
Review of Lane Cove tunnel pM10 impact issues
Reports on very specific technical issue of losses of semi-volatiles in teoMs, and consequences of incorrect pM10 data on impacts assessment
We have no further comments to make
Katolicky and Jicha (2005) Journal of Wind engineering and industrial aerodynamics 93:61–77
eulerian–Lagrangian model for traffic dynamics and its impact on operational ventilation of road tunnels
tunnel-specific study into rationalisation of fan requirements in prague tunnel—too specific, did not inform our review
Martins et al (2006) environmental Science and technology 40:6722–6729
emission factors for gas-powered vehicles traveling through road tunnels in Sao paulo, Brazil
emissions are uniquely specific to use of ethanol as fuel in Sao paolo—not relevant in australia

aiR QUaLitY in anD aRoUnD tRaFFiC tUnneLS
156 | appendixes
Authors reference title reason for exclusion
Swietlicki et al (1999) aerosol Science 30(S1):S49–S50
Road tunnel measurements of submicrometer particle size distributions, elemental composition and gas phase components
vague or momentary data
Wang et al (2006) environmental Science and technology 40:6255–6260
Low molecular weight dicarboxylic acids, ketoacids, and dicarbonyls in the fine particles from a roadway tunnel: possible secondary production from the precursors
very specific compounds not mentioned in contract or requested by working committee

aiR QUaLitY in anD aRoUnD tRaFFiC tUnneLS
appendixes | 157
APPendix g Air quAlity in And Around trAffic tunnels workshoP
This appendix provides a report of discussions held at the Air Quality in and around Traffic Tunnels Workshop, held on 15 May 2007.
G1 bAckGround
The National Health and Medical Research Council, in collaboration with the Australian Government Department of Health and Ageing, commissioned New Zealand’s National Institute of Water and Atmospheric Resources (NIWA) to conduct a systematic review of national and international literature and practices in relation to air quality in and around traffic tunnels. The draft report produced by NIWA was circulated to participants to stimulate discussion ahead of the workshop.
The aim of the workshop was to discuss best practice for managing air quality in and around traffic tunnels in Australia, by drawing on the varying experience and expertise of participants.
G2 recoMMendAtions
The workshop discussions centred on standard setting, tunnel management and research, and the resulting recommendations are outlined below:
g2.1 ReCoMMenDation one—StanDaRD Setting
Establish an evidence-based 15-minute standard for NO2, using a health risk assessment approach,
considering:
health effects from NO•2 and its interaction with other pollutants, such as particulate matter (PM)
the difference between tunnel air and other exposure; for example, from portals and stacks•
tunnel design and planning; for example, the ability to reduce the volume of traffic when •
emissions are high (eg in Melbourne City Link)
improved vehicle standards, including the introduction of cleaner fuels and retrofitting older •
vehicles with pollution-reduction devices
exposure factors, such as time in tunnel, multiple trips and external exposures•
responsibility for regulation, audit and methods of enforcement.•
g2.2 ReCoMMenDation tWo—tUnneL ManageMent
Tunnel operators should aim for lowest possible emissions, and regulators should encourage zero portal emissions, travel demand management and filtration equipment. Data accreditation could be incorporated into regulations for operators collecting monitoring information. It was noted that Victoria has a good model of regulation and licensing.
g2.3 ReCoMMenDation tHRee—ReSeaRCH
Studies are needed to demonstrate links between pollutants and adverse health effects. Once a relationship is established, air pollution should be monitored and thresholds established. Monitoring can then be used to inform estimates of related health problems.

aiR QUaLitY in anD aRoUnD tRaFFiC tUnneLS
158 | appendixes
Suggested areas of research include:
health impacts of acute periods of high-concentration exposures and repeated short-term •
exposures; it was suggested that the e-tag system be used to facilitate this
monitoring to determine whether the tunnel has reduced traffic in urban areas.•
It was agreed that tunnel emissions be considered as part of the larger problem of urban air pollution. It was suggested that emissions be treated at the source, with design issues, management techniques and removal coming after.
G3 PresentAtion on key issues
Dr Ian Longley and Dr Francesca Kelly of NIWA presented the key issues identified in the draft report, Systematic Literature Review to Address Air Quality in and around Traffic Tunnels.
NIWA outlined the scope, content and main findings of the report, and posed the following questions in relation to health outcomes:
Can morbidity be quantified?•
Can those people at risk be identified?•
What can be done to monitor adverse health outcomes?•
Which pollutants cause the problems?•
How can risk be prevented?•
The presentation also raised the issues of exposure of tunnel users, vehicle emission reductions, protecting against the effects of pollutants, NO
2 exposure, reduction in emissions from travel
speed and the effect of congestion on CO2 levels.
G4 discussion on PresentAtion
Comment: Setting in-tunnel NO2 exposure limits requires good emission data as well as regular
review of data and collection mechanisms.
Comment: At present, the monitoring systems for the emissions of the M5 tunnel do not indicate an impact on the population; however, there is a strong publicly perceived impact. Studies have not shown conclusively that air quality is being altered. If there is no change in exposure then it is difficult to maintain the change in outcome.
Question: Are the right things being measured?
Response: People in the vicinity of the M5 were asked to collate a diary of their experiences and any adverse reactions to emissions. These data have been analysed and form the stimulus for further health studies based on the close correlation of the reported impacts.
Comment: A change of fleet is a complex issue as this changes the nature of particulates and their interaction in the tunnels. The key issue is that complex interactions occur in tunnels and, for all new vehicles, air quality impact depends on exact emissions from these vehicles, which is one area that needs to be explored further.
Question: European Smoke Emergency Management Control—is this also a requirement in Australia?
Response: The consultants were not tasked to review smoke and fire management, and could not directly comment on this question. They did note that in these circumstances, ventilation systems can operate in reverse, encompassing significant engineering factors, which enable the two objectives of air quality and fire safety to be met.

aiR QUaLitY in anD aRoUnD tRaFFiC tUnneLS
appendixes | 159
It was noted that air quality in longitudinal ventilation tunnels was managed by flow at 4 m s–1 and that, in other tunnels, 10 m s–1 air flow was required to manage quality. It was acknowledged that a certain flow of air is required so that smoke and heat do not come back into the tunnel.
Question: NO2 concentrations can increase if the air flow is 1 m s–1. How strong a measure is this
and if the ratio was increased would this significantly prevent increases in NO2?
Response: The consultants noted that there is very little data on NO2 emissions and therefore little
evidence to back up this threshold; however, high NO2 levels do not occur with a 2 m s–1 air flow.
Question: Would there be value in translating the emission rates in Europe to the Australian situation?
Response: In general there are a greater number of diesel vehicles in Europe and emissions also depend on the age and technology of the vehicles. Calculations need to be based on the right emission factors and broken down effectively.
G5 sMAll GrouP discussions
The three questions below were posed for small group discussion:
g5.1 QUeStion one—HoW Can We MonitoR eFFeCtiveLY tHe HeaLtH oF tUnneL USeRS anD tHoSe Living oR WoRKing neaR tUnneL poRtaLS oR ventiLation StaCKS?
It was suggested that a risk management approach, with an emphasis on vehicle standards, be used to quantify the extent of risk of vehicle emissions and identify how to reduce the risks in priority order.
Based on the inability of routine monitoring data to quantify the relationship between health and air quality, monitoring should be project based, measuring specific endpoints, with a focus on subtle health effects, such as quality of life as well as traditional health indicators. As two-thirds of the health costs incurred below 50 microgram standards are over-the-counter medications, health impacts could be audited using pharmacy sale data. In addition, records and statistics on hospital admissions could help determine health impacts.
Monitoring of health indicators is required where adverse health effects are expected, and such monitoring data should be made available to the public. Continuous measuring of particles would be preferred as levels of particles are frequently underestimated, and it is associated with the minister’s condition of approval.
g5.2 QUeStion tWo—WHat LeveLS oF poLLUtantS aRe tUnneL USeRS anD tHoSe Living oR WoRKing neaR tUnneL poRtaLS oR ventiLation StaCKS expoSeD to?
It was proposed that financial incentives be provided to operators of tunnels with low levels of emissions, encouraging efficient system design and subsequent reductions in the impact on ambient air quality. It was also noted that ventilation increases greenhouse gases and greenhouse energy, and this impact could be reduced by effective system design.
The community’s perception of odour as a pollutant was raised. It was advised that toxicological investigations be conducted to capture air odour and categorise it properly, particularly to determine whether the odour has the impact or whether there is also a related health impact. Stacks should be designed such that odour is undetectable.

aiR QUaLitY in anD aRoUnD tRaFFiC tUnneLS
160 | appendixes
Equipment that is certified by the National Association of Testing Authorities is required to measure CO
2, NO
2, NO, PM
10 and CO. However, certification is expensive to obtain and as such is often
only applied in a minimal sense.
Tunnel design should take into account motor vehicle emissions, air quality standards and the application of appropriate technologies for removing pollutants. Risk communication is imperative at the primary stage of tunnel development, to reduce community outrage and perceived health burden.
g5.3 QUeStion tHRee—HoW iMpoRtant iS StanDaRD Setting FoR aiR QUaLitY in anD aRoUnD tRaFFiC tUnneLS?
It was noted that the precautionary principle should be applied in relation to standard setting and regulation. The standard-setting process needs to be rational, the level of uncertainty acknowledged, and action be taken on what is proven and reasonable. Value judgements should be applied when risk cannot be quantified precisely and available data used until better data is available.
G6 concludinG reMArks—Professor MicHAel Moore
We have come here today to debate how the recent Australian move to the use of transport tunnels might be contributing to improvement of the health of tunnel users and those living next to tunnels.
Health outcomes are generally difficult to measure therefore the focus is on monitoring of pollutants. There are dual responsibilities—the Government regarding the regulatory process, individuals in respect of their contribution to pollution and modification of behaviour to minimise this. Different to investigation of health outcomes which gave guidance on the likely exposures to given concentrations of pollutants, the NHMRC needs to know how it can contribute to the resolution of the research especially in respect of exposure-dose-response relationships. There is a need to fill in the knowledge gaps. Current guideline values are not helpful and there is a pressing need to develop shorter term guideline values for say 15 minutes with NO
2 being the
new CO. We also need to re-evaluate the extensive data-sets measured on a very short time base in some of the new tunnels, including the transects of the tunnel.
Congestion management is critical since it increases both pollution and exposure time. The consideration of health outcomes we need to remember is that although we can sum the effects of individual compounds it is much more appropriate to look at mixtures. All potential health outcomes are always a result of mixture exposure.
The issue of low sulfur diesel fuel determines the level of uptake of new technologies. The adoption of both heavy and light diesel engine technology is behind that already in place in Europe. We note differences in the regulatory environment from state to state and that a process of continuous improvement would serve the population best. This regulatory process needs to include appropriate enforcement measures.
Critical to pollution is the type of fuel and we currently focus on diesel and petrol but have not mentioned possible future changes to hydrogen and electricity.
We are very appreciative of the time committed by all present from all sections of health, environment and transport across the Commonwealth. This is not the end of the process. All of today’s discussions have been recorded and will be utilised along with submitted material in the enhancement of the preliminary document you have already seen. We are working to tight timelines and need to have submissions in by Thursday, 17 May 2007 as the Committee will be working with the Consultants in integrating this new approach into the text. We expect to have the process completed in June 2007 for final review before submission to the Minister. None of this would have been possible without the unstinting support of all participants and for that I thank you on behalf of the NHMRC and the Committee. We look forward to corresponding with you over the next month.

aiR QUaLitY in anD aRoUnD tRaFFiC tUnneLS
appendixes | 161
G7 coMMents recorded by GrouPs
g7.1 QUeStion one—HoW Can We eFFeCtiveLY MonitoR tHe HeaLtH oF tUnneL USeRS anD tHoSe Living oR WoRKing neaR tUnneL poRtaLS oR ventiLation StaCKS?
table one
1. Should we be monitoring (health/air)?
monitor air quality in tunnel•
investigate health effects (targeted)•
– short-term vs long-term exposure– pre-, pen-, post-tunnel behaviour advice
ultrafines, value of monitoring, characterise (unknown)•
2. Odour
monitor and characterise, see if health effects •
driver of perception•
need toxicological studies (mixtures)•
3. Tunnel design and management (effective measure of reduction)
remove vehicles from roads•
source control•
4. Clean up/monitor Australian fleet
badly characterised—old vehicles•
consistency between states•
5. Prospective risk communication
more short-term NO•2 exposure studies
table four
1. What we know, what we don’t know, what we need to know
2. Costs versus benefits (health risk versus health impact)
3. Weighted average (pollutant × people)
4. Quality of life factors
is any form of monitoring able to suitably address these concerns?•
use of other instruments eg planning policies•
benefits and impacts•
table seven
1. External
too much noise for long term indicators•
value in prospective one-off studies looking at irritative symptoms•
value in long-term studies into health effects of traffic-generated pollutants•

aiR QUaLitY in anD aRoUnD tRaFFiC tUnneLS
162 | appendixes
2. Internal
value in a health commuter study of repeated short-term, high-concentration exposure to •
complex mix of pollutants in tunnels
value in routine sentinel health study? linked to e-tag•
value in pollutant in tunnel indicator NO•2?
g7.2 QUeStion 2—WHat LeveLS oF poLLUtantS aRe tUnneL USeRS anD tHoSe Living oR WoRKing neaR tUnneL poRtaLS oR ventiLation StaCKS expoSeD to?
table two
1. Best overall—reduce vehicles emissions and use
2. Ambient air dilemma—no change versus community concern
3. Measure—CO, NO2, NO, PM
2.5, PM
10, ultrafines, benzene, volatile organic compounds (VOCs),
biologicals
ensure data used are valid•
seek Australian Standard methods and National Association of Testing Authorities (to •
ensure that pollutants are measured in a consistent way nationally)
4. Establish vertical gradients, breathing zone versus roof instruments
ambient—monitoring stations at compass points•
5. Establish guidelines for tunnels eg NO2, PMs—5 mins – 15 mins. Maybe low levels 99% compliance
consider synergy eg NO•2/PMs
6. Note NO2 instruments now available for tunnels (eg for Lane Cove tunnel)
7. Request NO2 transect data for M5 from the road traffic authority
table five
1. Ventilation stacks
designed, operated with contingencies in place•
unlikely impacts to air quality around the stack—neighbourhood due to air flow, dispersion •
and dilution
10/15 metres/secondcontinuous stack outside
inside (continuous)
no plus no2pM10/pM2.5
Co, Co2 (greenhouse and calibration)
visibilitynoCo
pollutants and health, car exhaust leads to NO•2, PM, PAH, CO
visibility (safety)•
2. Where are the Australian data? Needed to inform second draft. Change in fleets/fuels/types of vehicles/AQ (air quality) policy
3. Too many variables from one country to another, one tunnel to another. Therefore need better focus on in-tunnel and stack values. These should be the same.

aiR QUaLitY in anD aRoUnD tRaFFiC tUnneLS
appendixes | 163
4. Health-based guidance value, standard. Is CO levels adequately protective of health?
5. OH&S—peak maintenance workers. OH&S data to inform public health decisions.
6. NO = 10ppm, NO2 = 1.0ppm (Permanent International Association of Road Congresses)
7. Transurban—controlling on NO drives control of ventilation
8. CO—150 ppm—peak (1 min), 50 ppm—15 min, 25 ppm greater 2 hours
9. Risk management—do not allow congestion in tunnel (fire measures plus decrease in AQ issues). Need more enforcement of emission. Standards to also reduce AQ impacts, maintenance of fleet.
10. Portals and in-tunnel focus for research? Feeder roads within a 300 m radius should also be considered
11. Mixtures too hard (put more focus on getting single pollutant decisions right)
g7.3 QUeStion 3—HoW iMpoRtant iS StanDaRD Setting FoR aiR QUaLitY in anD aRoUnD tRaFFiC tUnneLS?
table three
1. Usefulness of standards
standards required to allow tunnels to be designed to ensure human health protected•
standards for inside and outside•
For outside—current process National Environmental Protection Measures (NEPMs)•
For inside use similar health-based process as NHMRC document on setting health-based •
AQ standards
Need for shorter term standards for in tunnel, considerations:•
tunnel length/time exposure•
multiple tunnel exposure•
outside exposure•
System of enforcement to ensure compliance (eg Victorian model)•
2. Pollutants
Have outside standards:•
NEPM (9AIR)•
PM•10, PM
2.5 need shorter term
CO, NO•2
NEPM (AIR Toxics)—benzene, toluene, xylene (BTX) ; formaldehyde; polycyclic aromatic •
hydrocarbons; new fuels E10?
Inside tunnels:•
as for outside•
ultrafines—particle number? (Is it possible? Where is standard set at?) •
3. Interaction of pollutants is important, difficult to assess, and needs to be taken into account when setting standards

aiR QUaLitY in anD aRoUnD tRaFFiC tUnneLS
164 | appendixes
4. Air monitoring requirements:
Continuous, desirable—[outside, in-tunnel, in stack]—may be difficult for air toxics•
Quality data—quality assurance systems required•
Peak concentrations in tunnel•
Multipoint monitoring•
Display next to real-time (internet)•
table six
1. Usefulness of standards
health protection•
design—NO•2 the ‘next’ standard, the ‘new’ CO, developments in Europe, monitoring +
goals
PM—less well understood, short term•
2. Monitoring
Internal—argument for NO•2 in tunnel
External—current status discernable, future near roads•
3. Tunnel operation, optimal flow:
health•
traffic•
financial•
design greater than 20 km h• –1
education—windows•
4. Tail pipe
Hierarchy of treatment: source, design, management, removal
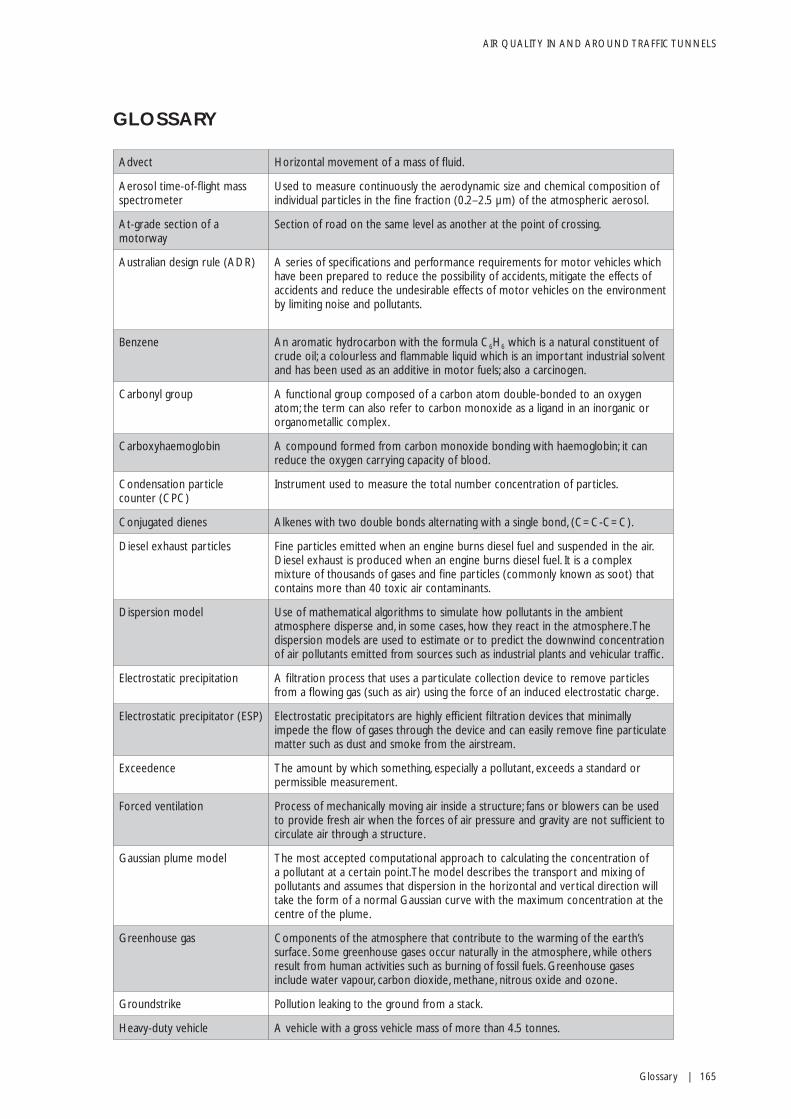
aiR QUaLitY in anD aRoUnD tRaFFiC tUnneLS
glossary | 165
glossAry
advect Horizontal movement of a mass of fluid.
aerosol time-of-flight mass spectrometer
Used to measure continuously the aerodynamic size and chemical composition of individual particles in the fine fraction (0.2–2.5 μm) of the atmospheric aerosol.
at-grade section of a motorway
Section of road on the same level as another at the point of crossing.
australian design rule (aDR) a series of specifications and performance requirements for motor vehicles which have been prepared to reduce the possibility of accidents, mitigate the effects of accidents and reduce the undesirable effects of motor vehicles on the environment by limiting noise and pollutants.
Benzene an aromatic hydrocarbon with the formula C6H6 which is a natural constituent of crude oil; a colourless and flammable liquid which is an important industrial solvent and has been used as an additive in motor fuels; also a carcinogen.
Carbonyl group a functional group composed of a carbon atom double-bonded to an oxygen atom; the term can also refer to carbon monoxide as a ligand in an inorganic or organometallic complex.
Carboxyhaemoglobin a compound formed from carbon monoxide bonding with haemoglobin; it can reduce the oxygen carrying capacity of blood.
Condensation particle counter (CpC)
instrument used to measure the total number concentration of particles.
Conjugated dienes alkenes with two double bonds alternating with a single bond, (C=C-C=C).
Diesel exhaust particles Fine particles emitted when an engine burns diesel fuel and suspended in the air.Diesel exhaust is produced when an engine burns diesel fuel. it is a complex mixture of thousands of gases and fine particles (commonly known as soot) that contains more than 40 toxic air contaminants.
Dispersion model Use of mathematical algorithms to simulate how pollutants in the ambient atmosphere disperse and, in some cases, how they react in the atmosphere. the dispersion models are used to estimate or to predict the downwind concentration of air pollutants emitted from sources such as industrial plants and vehicular traffic.
electrostatic precipitation a filtration process that uses a particulate collection device to remove particles from a flowing gas (such as air) using the force of an induced electrostatic charge.
electrostatic precipitator (eSp) electrostatic precipitators are highly efficient filtration devices that minimally impede the flow of gases through the device and can easily remove fine particulate matter such as dust and smoke from the airstream.
exceedence the amount by which something, especially a pollutant, exceeds a standard or permissible measurement.
Forced ventilation process of mechanically moving air inside a structure; fans or blowers can be used to provide fresh air when the forces of air pressure and gravity are not sufficient to circulate air through a structure.
gaussian plume model the most accepted computational approach to calculating the concentration of a pollutant at a certain point. the model describes the transport and mixing of pollutants and assumes that dispersion in the horizontal and vertical direction will take the form of a normal gaussian curve with the maximum concentration at the centre of the plume.
greenhouse gas Components of the atmosphere that contribute to the warming of the earth’s surface. Some greenhouse gases occur naturally in the atmosphere, while others result from human activities such as burning of fossil fuels. greenhouse gases include water vapour, carbon dioxide, methane, nitrous oxide and ozone.
groundstrike pollution leaking to the ground from a stack.
Heavy-duty vehicle a vehicle with a gross vehicle mass of more than 4.5 tonnes.

aiR QUaLitY in anD aRoUnD tRaFFiC tUnneLS
166 | glossary
Heavy-goods vehicle a large road vehicle intended to carry goods and with a maximum laden weight in excess of 7.5 tonnes.
inversion a deviation from the normal change of an atmospheric property, such as temperature, with altitude.
Katabatic flow a cold flow of air travelling down a topographic incline.
Lagrangian particle model independence of particle motions. each particle moves along its trajectory in the spatial domain by the effect of the sum of a deterministic velocity and a stochastic term, due to the effect of air turbulence. at each time step the new particle velocity is computed and the updated particle position in the spatial domain is obtained.
Light-duty vehicle Motor vehicle with a gross vehicle weight of 4000 kg or less.
Longitudinal ventilation a system that creates a uniform longitudinal flow of air (constant airflow velocity) along the length of the tunnel. Fans are mounted on the tunnel ceiling above the traffic area. Clean air enters the tunnel from one portal and gets gradually polluted with substances emitted by vehicles, and reaches the tunnel exit with a higher concentration of pollution (the concentration of toxic substances increases in the direction of the airflow linearly).
Measured transact a continuous measurement of pollutant concentrations made from a normal vehicle moving through the tunnel.
natural ventilation See passive ventilation
nonmethane volatile organic compound (nMvoC)
organic chemical compounds, excluding methane, such as benzene, xylene, propane and butane that under normal conditions can vaporise and enter the atmosphere. nMvoCs are mainly emitted from transportation, industrial processes and use of organic solvents.
off-ramp a segment of road with one or two lanes, used by traffic to move from a freeway to a smaller road (also called an exit ramp).
optical particle counter instrument that measures light scattered by particles typically greater than 0.05 μm in diameter.
particulate matter (particulates)
Complex mixture of extremely small particles and liquid droplets suspended in a gas, ranging in size from less than 10 nanometres to more than 100 micrometres in diameter. particle pollution is made up of a number of components, including acids (such as nitrates and sulfates), organic chemicals, metals, and soil or dust particles.
passive ventilation Unassisted airflow. power is generated when heated air rises up through ventilation ducting and out of a structure, creating negative pressure and new, ‘fresh’ air enters the structure through vents or poorly sealed areas. passive ventilation is extremely dependent on the weather.
piston effect vehicles moving through a tunnel induce their own airflow in the same direction. this phenomenon is known as the ‘piston effect’ and is the basis of passive ventilation.
pollution rose a diagram that indicates the frequency and intensity of pollution from different directions for a particular place.
portal entrance to a tunnel.
portal emissions emissions of pollutants that leave the tunnel via the entrance (rather than via a chimney stack or other ventilation mechanism).
Residence time the average time a substance spends within a specified region of space, or how fast something moves through a system in equilibrium. a common method for determining residence times is to calculate how long it would take for a region of space to become filled with a substance.

aiR QUaLitY in anD aRoUnD tRaFFiC tUnneLS
glossary | 167
Semitransverse ventilation in a semitransverse ventilation system, fresh air is added equally along the tunnel through out of an air supply duct, but there is no air extraction. the fresh air is supplied transversely while the polluted air flows longitudinally to the two ports. in the case of fire, smoke can be extracted through the duct out of the tunnel. the main disadvantage of such a ventilation system is that it is not possible to control the longitudinal airflow.
Stack See ventilation stack
termolecular a reaction involving three molecular entities.
toluene an aromatic hydrocarbon; a clear, water-insoluble liquid with the typical smell of paint thinners that is widely used as an industrial feedstock and as a solvent.
tracer-release experiment investigation of circulation and dispersion through the use of controlled releases of sensitive tracers into a system.
transverse ventilation Fresh air is supplied or extracted through purpose built ducts along a tunnel. there are two ducts and air flows from one of the ducts through slots or ports into the traffic section while polluted air is withdrawn through the other duct. the ducts may be above or below the roadway but usually fresh air is input near the roadway and the vitiated air is exhausted along the tunnel ceiling. in ideal case there is no longitudinal airflow.
Urban canopy the buildings, trees and other objects composing a town or city and the spaces between them.
ventilation stack a chimney-like space included in the tunnel design to expel vehicle emissions mixed with air in the tunnel.
vitiated air air from which oxygen has been removed; mainly nitrogen containing a reduced percentage of oxygen
volatile organic compound Carbon-based compounds such as aldehydes, ketones, and hydrocarbons that have high enough vapour pressures under normal conditions to significantly vaporise and enter the atmosphere.

aiR QUaLitY in anD aRoUnD tRaFFiC tUnneLS
References | 169
references
Abt Associates Inc (1996). A Particulate Matter Risk Assessment for Philadelphia and Los Angeles, US EPA Contract 68-W4-0029.
Allen J, Mayo P, Hughes L, Salmon LG and Cass GR (2001). Emissions of size-segregated aerosols from on-road vehicles in the Caldecott Tunnel. Environmental. Science and Technology 35:4189–4197.
Anderson HR, Spix C, Medina S, Schouten JP, Castellsague K, Rossi G, Zmirou D, Touloumi G, Wojtyniak B, Ponka A, Bacharova L, Schwartz J and Katsouyanni K (1997). Air pollution and daily admissions for chronic obstructive pulmonary disease in 6 European cities, results from the APHEA project. European Respiratory Journal 10:1064–1071.
ANE (Air Noise Environment Pty Ltd) (2006). Eastlink—Mullum Mullum Creek tunnels air quality assessment. ANE Pty Ltd.
Atkinson RW, Anderson HR, Strachan DP, Bland JM, Bremner SA, and Ponce de Leon A (1999). Short-term associations between outdoor air pollution and visits to accident and emergency departments in London for respiratory complaints. European Respiratory Journal 13:257–265.
Awad AHA (2002). Environmental study in subway metro stations in Cairo, Egypt. Journal of Occupational Health 44:112–118.
Bai N, Khazaei M, Van Eeden SF and Laher I (2007). The pharmacology of particulate matter air pollution-induced cardiovascular dysfunction. Pharmacological Therapies 113:16–29.
Barck C, Sandström T, Lundahl J, Halldén G, Svartengren M, Strand V, Rak S and Bylin G (2002). Ambient level of NO
2 augments the inflammatory response to inhaled allergen in asthmatics.
Respiratory Medicine 96:907–911.
Barck C, Lundahl J, Halldén G and Bylin G (2005). Brief exposures to NO2 augment the allergic
inflammation in asthmatics. Environmental Research 97:58–66.
Barrefors G (1997). Monitoring of benzene, toluene and p-xylene in urban air with differential optical absorption spectroscopy technique. The Science of the Total Environment 196(1):99–104(6).
Barnett JR, Cox JA, Holmes NE and Stricker J (2003). Effect of road tunnel ventilation emissions on ambient air quality—M5 East: a case study. In: Proceedings of the National Clean Air Conference, Newcastle, New South Wales, 23–27 November 2003, CASANZ.
Barnett AG, Williams GM, Schwartz J, Neller AH, Best TL, Petroeschevsky AL and Simpson RW (2005). Air pollution and child respiratory health, a case-crossover study in Australia and New Zealand. American Journal of Respiratory and Critical Care Medicine 171:1272–1278.
Barnett AG, Williams GM, Schwartz J, Best TL, Neller AH, Petroeschevsky AL and Simpson RW (2006). The effects of air pollution on hospitalizations for cardiovascular disease in elderly people in Australian and New Zealand cities. Environmental Health Perspective 114:1018–1023.
Bechtel/Parsons Brinkerhoff (2006). Central Artery (I-93)/Tunnel (I-90) Project. Operating Certification of the Project Ventilation System. Technical support document, prepared for the Massachusetts Turnpike Authority. http://www.mass.gov/dep/air/approvals/opcertsd.pdf (Accessed June 2007)
Bell ML, Dominici F and Samet JM (2005). A meta-analysis of time-series studies of ozone and mortality with comparison to the National Morbidity, Mortality, and Air Pollution Study. Epidemiology 16:436–445.

aiR QUaLitY in anD aRoUnD tRaFFiC tUnneLS
170 | References
Bernstein JA (2004). Health effects of air pollution. Journal of Allergy and Clinical Immunology 114:1116–1123.
Beslic I, Sega K, Sisovic A and Klaic ZB (2005). PM10, CO and NO
x concentrations in the Tuhobic
road tunnel, Croatia, International Journal of Environment and Pollution 25(1–4):251–262.
Beyers CJ, Burrell CJ and Richardson CM. (2003). Atmospheric dispersion of emissions from the M5 East freeway tunnel: prediction v/s performance. In: Proceedings of the National Clean Air Conference, Newcastle, New South Wales, 23–27 November, CASANZ.
Bongoirno report (2000). Review of Emission Control Technology on City Link Tunnels, report to EPA Victoria and the Minister for Environment and Conservation. (Unpublished report to the Minister).
Bower JS, Broughton GFJ and Stedman JR. (1994). A winter NO2 smog episode in the UK.
Atmospheric Environment 28:461–475.
Brauer M, Hoek G, Van Vliet P, Meliefste K, Fisher PH, Wijga A, Koopman LP, Neijens HJ, Gerritsen J, Kerkhof M, Heinrich J, Bellander T and Brunekreef B (2002). Air pollution from traffic and the development of respiratory infections and asthmatic and allergic symptoms in children. American Journal of Respiratory and Critical Care Medicine 166:1092–1098.
Brook RD, Brook JR, Urch, B, Vincent R, Rajagopalan S and Silverman F (2002). Inhalation of fine particulate air pollution and ozone causes acute arterial vasoconstriction in healthy adults. Circulation 105:1534–1536.
Brousse B, Vidal B, Ponticq X, Goupil G and Alary R (2005). Pollution dispersion at an urban motorway tunnel portal: comparison of the small-scale predictive study with the actual conditions measured on the site. Atmospheric Environment 39:2459–2473.
Brunekreef B, Janssen NAH, de Hartog J, Harssema H, Knape M and van Vliet P (1997). Air pollution from truck traffic and lung function in children living near motorways. Epidemiology 8:298–303.
Bylin G, Lindvall T, Rehn T and Sundin B (1985). Effects of short-term exposure to ambient nitrogen dioxide concentrations on human bronchial reactivity and lung function. European Journal of Respiratory Disease 66:205–217.
Bylin G, Hedenstierna G, Lindvall T and Sundin B (1988). Ambient nitrogen dioxide concentrations increase bronchial responsiveness in subjects with mild asthma. European Respiratory Journal 1:606–612.
Carslaw DC (2005). Evidence of an increasing NO2/NO
X emissions ratio from road traffic
emissions. Atmospheric Environment 39:4793–4802.
Cebulska-Wasilewska A, Wiechec A and Panek A (2005). Influence of environmental exposure to PAHs on the susceptibility of lymphocytes to DNA damage induction and on their repair capacity. Mutation Research 588:73–81.
CETU (Cente d’Etudes des Tunnels) (2003). Les dossiers pilotes du CETU: Ventilation, CETU, France. http://www.cetu.equipement.gouv.fr/IMG/pdf/DP_ventilation_cle557d66-2.pdf
Chan LY, Zeng L, Qin Y and Lee SC (1996). CO concentration inside the Cross Harbour tunnel in Hong Kong. Environment International 22:405–409.
Chan LY, Liu YM, Lee SC and Chan CY (2002). Carbon monoxide levels measured in major commuting corridors covering different land use and roadway microenvironments in Hong Kong. Atmospheric Environment 36:255–264.
Chang TY and Rudy SJ (1990). Roadway tunnel air quality models. Environmental Science and Technology 24:672–676.
aiR QUaLitY in anD aRoUnD tRaFFiC tUnneLS
References | 171
Chang CC, Tsai SS, Ho SC and Yang CY (2004). Air pollution and hospital admissions for cardiovascular disease in Taipei, Taiwan. Environmental Research 98:114–119.
Charron A and Harrison RM (2003). Primary particle formation from vehicle emissions during exhaust dilution in the roadside atmosphere. Atmospheric Environment 37:4109–4119.
Cheng Y, Lee SC, Ho KF and Louie PKK (2006). On-road particulate matter (PM2.5
) and gaseous emissions in the Shing Mun Tunnel, Hong Kong. Atmospheric Environment 40:4235–4245.
Child and Associates (2004). M5 East Freeway: A Review of Emission Treatment Technologies, Systems & Applications, Roads and Traffic Authority of NSW.
Chow WK and Chan MY (2003). Field measurement on transient carbon monoxide levels in vehicular tunnels. Building and Environment 38:227–236.
Chow WK and Li JSM (1999). Safety requirements and regulations reviews on ventilation and fire for tunnels in the Hong Kong Special Administrative Region. Tunnel and Underground Space Technology 14:13–21.
City of Yarra and City of Stonnington (2002). Monitoring City Link—The City of Yarra and the City of Stonnington’s air monitoring program. Report Eight. (Unpublished report to Victoria).
Clarkson TS (1981). Preliminary investigation of air filtration into typical New Zealand timber frame dwellings. Final Report, New Zealand Meteorological Service Technical Information Circular 182.
Colberg CA, Tona B, Catone G, Sangiorgio C, Stahel WA, Sturm P and Staehelin J (2005). Statistical analysis of the vehicle pollutant emissions derived from several European road tunnel studies. Atmospheric Environment 39:2499–2511.
Dab W, Segala C, Dor F, Festy B, Lameloise P, Le Moullecy Y, Le Tertre A, Medina S, Quenel P, Wallaert B and Zmirou D (2001). Air pollution and health, correlation or causality? The case of the relationship between exposure to particles and cardiopulmonary mortality. Journal of Air Waste Management Association 51:220–235.
DEC NSW (Department of Environment and Conservation NSW) (2004). Approved methods for the modelling and assessment of air pollutants in New South Wales, draft, November 2004.
De Fré R, Bruynseraede P and Kretzschmar JG (1994). Air pollution measurements in traffic tunnels. Environmental Health Perspective 102(Suppl 4):31–37.
Denison L and Dawson B (1998). Health risk assessment: evaluation of the impact of particle emissions from the City Link Tunnels ventilation system. In: Proceedings of the 14th International Clean Air and Environment Conference, Melbourne, Clean Air Society of Australia and New Zealand.
Dockery DW and Stone PH (2007). Cardiovascular risks from fine particulate air pollution, editorial. New England Journal of Medicine 356:511–513.
Dockery DW, Pope CA, Xu X, Spengler JD, Ware JH, Fay ME, Ferris BG and Speizer FE (1993). An association between air pollution and mortality in six U.S. cities. New England Journal of Medicine 329:1753–1759.
Donnison A, Ross C, Noonan M, Fisher G and Waller J (2004). Bacterial survival and dispersal in spray irrigation aerosols. New Zealand Journal of Agricultural Research 47:575–585.
Dorsey JR, Nemitz E, Gallagher MW, Fowler D, Williams PI, Bower KN and Beswick KM (2002). Direct measurements and parameterisation of aerosol flux, concentration and emission velocity above a city. Atmospheric Environment 36:791–800.
Duffy BL and Nelson F (1997). Exposure to emissions of 1,3-butadiene and benzene in the cabins of moving motor vehicles and buses in Sydney, Australia. Atmospheric Environment 31:3877–3885.

aiR QUaLitY in anD aRoUnD tRaFFiC tUnneLS
172 | References
El-Fadel M and Hashisho Z (2001). Vehicular emissions in roadway tunnels: a critical review. Critical Reviews in Environmental Science and Technology 31:125–174.
Environment Australia (2002). Determination of emission factor for in-service motor vehicles using City Link tunnel, Melbourne, Australia.
EPA NSW (Environment Protection Authority of New South Wales) (2001). Approved Methods and Guidance—For the modelling and assessment of air pollutants in New South Wales, EPA 2001/57, Sydney, Australia.
EPA Victoria (Environment Protection Authority Victoria) (1999). Measurement of Motor Vehicle Pollutants and Fleet Average Emission Factors in Melbourne, publication 652, EPA Victoria.
EPA Victoria (Environment Protection Authority Victoria) (2001a). Review of Air Quality Monitoring Data—City Link project, TLO report 4, publication 781, EPA Victoria.
EPA Victoria (Environment Protection Authority Victoria) (2002a). Air Quality Monitoring at Rooney Street, Burnley, publication 857, EPA Victoria.
EPA Victoria (Environment Protection Authority Victoria) (2002b). Annual Review of Air Quality Monitoring Data—City Link Project, publication 864, EPA Victoria.
EPA Victoria (Environment Protection Authority Victoria) (2002c). A Guide to the Sampling and Analysis of Air Emissions and Air Quality, EPA Victoria.
EPA Victoria (Environment Protection Authority Victoria) (2003). Air Quality Monitoring at Rooney Street, Burnley June 2001 – August 2002, publication 889, EPA Victoria.
EPA Victoria (Environment Protection Authority Victoria) (2004). City Link: Review of Air Quality Monitoring, publication 958, EPA Victoria.
EPA Victoria (Environment Protection Authority Victoria) (2006). Tunnel Ventilation System Technology Review and Best Practice, EPA Victoria.
Fischer P, Hoek G, Brunekreef B, Verhoeff A and van Wijnen J (2003). Air pollution and mortality in the Netherlands. Are the elderly more at risk? European Respiratory Journal 21(Suppl 40):34 s–38 s.
Fraser MP, Cass GR and Simoneit BRT (1998). Gas-phase and particle-phase organic compounds emitted from motor vehicle traffic in a Los Angeles roadway tunnel Environmental Science and Technology 32:2051–2060.
Fung KY, Luginaah IN, Gorey KM and Webster G (2005). Air pollution and daily hospital admissions for cardiovascular diseases in Windsor, Ontario. Canadian Journal of Public Health 96:29–33.
Gauderman WJ (2006). Air pollution and children-an unhealthy mix. New England Journal of Medicine 355:78–79.
Gauderman WJ, McConnell R, Gilliland F, London S, Thomas D, Avol E, Vora H, Berhane K, Rappaport EB, Lurmann F, Margolis HG and Peters J (2000). Association between air pollution and lung function growth in southern California children. American Journal of Respiratory and Critical Care Medicine 162:1383–1390.
Gauderman WJ, Gilliland GF, Vora H, Avol E, Stram D, McConnell R, Thomas D, Lurmann F, Margolis HG, Rappaport EB, Berhane K and Peters JM (2002). Association between air pollution and lung function growth in southern California children, results from a second cohort. American Journal of Respiratory and Critical Care Medicine 166:76–84.
Gauderman WJ, Avol E, Gilliland F, Vora H, Thomas D, Berhane K, McConnell R, Kuenzli N, Lurmann F, Rappaport E, Margolis H, Bates D and Peters J (2004). The effect of air pollution on lung development from 10 to 18 years of age. New England Journal of Medicine 351:1057–1067.

aiR QUaLitY in anD aRoUnD tRaFFiC tUnneLS
References | 173
Gauderman WJ, Vora H, McConnell R, Berhane K, Gilliland F, Thomas D, Lurmann F, Avol E, Kunzli N, Jerrett M and Peters J (2007). Effect of exposure to traffic on lung development from 10 to 18 years of age: a cohort study. Lancet 369:571–577.
Geller MD, Sardar SB, Phuleria H, Fine PM and Sioutas C (2005). Measurements of particle number and mass concentrations and size distributions in a tunnel environment. Environmental Science and Technology 39:8653–8663.
Gertler AW and Pierson WR (1996). Recent measurements of mobile source emission factors in North American tunnels. Science of the Total Environment 189–190:107–113.
Gidhagen L, Johansson C, Ström J, Kristensson A, Swietlicki E, Pirjola L and Hansson HC (2003). Model simulation of ultrafine particles inside a road tunnel. Atmospheric Environment 37:2023–2036.
Gidhagen L, Johansson C, Omstedt G, Langner J and Olivares G (2004). Model simulations of NOx
and ultrafine particles close to a Swedish highway. Science and Technology 38:6730–6740.
Gillies JA, Gertler AW, Sagebiel JC and Dippel A (2001). On-road particulate matter (PM2.5
and PM
10) emissions in the Sepulveda Tunnel, Los Angeles, California. Environmental Science and
Technology 35:1054–1063.
Gilmour MI, Jaakkola MS, London SJ, Nel AE and Rogers CA (2006). How exposure to environmental tobacco smoke, outdoor air pollutants, and increased pollen burdens influences the incidence of asthma. Environmental Health Perspective 114:627–633.
Glinianaia SV, Rankin J, Bell R, Pless-Mulloli T and Howel D (2004). Particulate air pollution and fetal health, a systematic review of the epidemiologic evidence’, Epidemiology 15:36–45.
Gouriou F, Morin JP and Weill ME (2004). On-road measurements of particle number concentrations and size distributions in urban and tunnel environments. Atmospheric Environment 38:2831–2840.
Grosjean D, Grosjean E and Gertler AW (2001). On-road emissions of carbonyls from light-duty and heavy-duty vehicles. Environmental Science and Technology 35:45–53.
Gross DS, Gälli ME, Silva PJ, Wood SH, Liu D and Prather KA (2000). Single particle characterization of automobile and diesel truck emissions in the Caldecott Tunnel. Aerosol Science and Technology 32:152–163.
Ha EH, Hong YC, Lee BE, Woo BH, Schwartz J and Christiani DC (2001). Is air pollution a risk factor for low birth weight in Seoul? Epidemiology 12:643–648.
He QC, Lioy PJ, Wilson WE and Chapman RS (1993). Effects of air pollution on children’s pulmonary function in urban and suburban areas of Wuhan, People’s Republic of China. Archives of Environmental Health 48:382–391.
Heal M, Beaverland J, McCabe M, Hepburn W and Agius RM (2000). Intercomparison of five PM
10 monitoring devices and the implications for exposure measurement in epidemiological
monitoring. Journal of Environmental Monitoring 2(5):455–461.
Heinrich J (2003). Nonallergic respiratory morbidity improved along with a decline of traditional air pollution levels, a review. European Respiratory Journal 21(Suppl 40):64 s-69 s.
Herbert R, Szeinuk J and O’Brien S (2001). Occupational health problems of bridge and tunnel officers. Occupational Medicine 16:51–64.
Hetland RB, Cassee FR, Refsnes M, Schwarze PE, Låg M, Boere AJ and Dybing E (2004). Release of inflammatory cytokines, cell toxicity and apoptosis in epithelial lung cells after exposure to ambient air particles of different size fractions. Toxicology In Vitro 18:203–212.

aiR QUaLitY in anD aRoUnD tRaFFiC tUnneLS
174 | References
Hibberd MF (2003). Annual average and maximum 1-hour average pollutant concentrations around the M5 stack. CSIRO Atmospheric Research Report C/0883, prepared for NSW Health—Environmental Health Branch.
Hibberd MF (2006). Modelling of NOx concentration near the M5 stack (Sep—Nov 2003). CSIRO
Atmospheric Research, prepared for NSW Health—Environmental Health Branch.
Hitchins J, Morawska L, Wolff R and Gilbert D (2000). Concentrations of submicrometre particles from vehicle emissions near a major road. Atmospheric Environment 34:51–59.
HKPU (Hong Kong Polytechnic University) (2005). Final report of determination of suspended particulate and VOC emission profiles for vehicular sources in Hong Kong.
Ho KF, Ho SSH, Cheng Y, Lee SC and Yu JZ (2007). Real-world emission factors of fifteen carbonyl compounds measured in a Hong Kong tunnel. Atmospheric Environment 41:1747–1758.
Hoek G, Brunekreef B, Goldbohm S, Fischer P and van den Brandt PA (2002). Association between mortality and indicators of traffic-related air pollution in the Netherlands, a cohort study. Lancet 360:1203–1214.
Hoffman B, Moebus S, Stang A, Beck E, Dragano N, Möhlenkamp S, Schmermund A, Memmesheimer M, Mann K, Erbel R and Jöckel K (2006). Residence close to high traffic and prevalence of coronary heart disease. European Heart Journal 27:2696–2702.
Hole DJ, Watt GC, Davey-Smith G, Hart CL, Gillis CR and Hawthorne VM (1996). Impaired lung function and mortality risk in men and women: findings from the Renfrew and Paisley prospective population study. British Medical Journal 313:711–715.
Holgate ST, Sandstrom T, Frew AJ, Stenfors N, Nördenhall C, Salvi S, Blomberg A, Helleday R and Söderberg M (2003). Health effects of acute exposure to air pollution. Part I: Healthy and asthmatic subjects exposed to diesel exhaust. Research Report 112:1–30, discussion 51–67, Health Effects Institute, Capital City Press, Montpelier VT.
Holmes Air Sciences (2004). Air quality impact assessment: Brisbane North-South Bypass Tunnel. Draft, prepared for Sinclair Knight Merz/Connell Wagner Joint Venture on behalf of Brisbane City Council.
Holmes Air Sciences (2005). M5 East tunnel air quality monitoring project. Prepared for Roads and Traffic Authority of NSW.
Holmes Air Sciences (2006). M5 East portal monitoring analysis. Prepared for Roads and Traffic Authority of NSW.
Horak F Jr, Studnicka M, Gartner C, Spengler JD, Tauber E, Urbanek R, Veiter A and Frischer T (2002). Particulate matter and lung function growth in children, a 3-yr follow-up study in Austrian schoolchildren. European Respiratory Journal 19:838–845.
Huang XF, Yu JZ, He LY and Hu M (2006). Size distribution characteristics of elemental carbon emitted from Chinese vehicles: results of a tunnel study and atmospheric implications. Environmental Science and Technology 40:5355–5360.
IARC (International Agency for Research on Cancer) (2006). Inorganic and Organic Lead Compounds, volume 87 in the series Monographs on the Evaluation of Carcinogenic Risks to Humans, WHO, Lyon.
Imhof D, Weingartner E, Prévôt ASH, Ordóñez C, Kurtenbach R, Wiesen P, Rodler J, Sturm P, McCrae I, Ekström M and Baltensperger U (2006), Aerosol and NO
x emission factors and
submicron particle number size distributions in two road tunnels with different traffic regimes. Atmospheric Chemistry and Physics Discussions 6:2215–2230.

aiR QUaLitY in anD aRoUnD tRaFFiC tUnneLS
References | 175
Indrehus O and Aralt TT (2005). Air quality and ventilation fan control based on aerosol measurement in the bi-directional undersea Bomlafjord tunnel. Journal of Enviromental Monitoring 7:349–356.
Indrehus O and Vassbotn P (2001). CO and NO2 pollution in a long two-way traffic road tunnel:
investigation of NO2/NO
x ratio and modelling of NO
2 concentration. Journal of Enviromental
Monitoring 3:220–225.
Ito K, De Leon SF and Lipmann M (2005). Associations between ozone and daily mortality: analysis and meta-analysis. Epidemiology 16:446–457.
Jacques EJ and Possoz L (1996). Road tunnels and the environment. Proceedings of a workshop on Measurement Techniques in Energy Systems and Processes, 83–108.
Jedrychowski W, Flak E and Mroz E (1999). The adverse effect of low levels of ambient air pollutants on lung function growth in preadolescent children. Environmental Health Perspective 107:669–674.
Jerrett M, Burnett RT, Ma R, Pope CA, Krewski D, Newbold KB, Thurston G, Shi Y, Finkelstein N, Calle EE and Thun MJ (2005). Spatial analysis of air pollution and mortality in Los Angeles. Epidemiology 16:727–736.
Johansson C, Johansson PA and Burman L (1996). ITM Rapport 49: Emissioner av kväveoxider och kolmonoxid från vägtrafik -Analys av mätningar I Söderledstunneln, ITM Luftlaboratoriet, Stockholms universitet och Stockholms luft- och bulleranalys (in Swedish).
Johansson C, Romero R and Vesely V (1997). ITM Rapport 61: Emissioner av kolväten från vägtrafik -Analys av mätningar I Söderledstunneln i Stockholm, ITM Luftlaboratoriet, Stockholms universitet och Stockholms luft- och bulleranalys (in Swedish).
Kean AJ, Grosjean E, Grosjean D and Harley RA (2001). On-road measurement of carbonyls in California light-duty vehicle emissions. Environmental Science and Technology 35:4198–4204.
Kerminen VM, Pakkanen TA, Mäkelä T, Hillamo RE, Sillanpää M, Rönkkö T, Virtanen A, Keskinen J, Pirjola L, Hussein T and Hämeri K (2007). Development of particle number size distribution near a major road in Helsinki during an episodic inversion situation. Atmospheric Environment 41:1759–1767.
Kirchstetter TW, Harley RA, Kreisberg NM, Stolzenburg MR and Hering SV (1999), On-road measurement of fine particle and nitrogen oxide emissions from light- and heavy-duty motor vehicles. Atmospheric Environment 33:2955–2968.
Krewski D, Burnett RT, Goldberg M, Hoover K, Siemiatycki J, Abrahamowicz M and White W (2005). Reanalysis of the Harvard Six Cities Study, part I, validation and replication. Inhalation Toxicology 17:335–342.
Kristensson A, Johansson C, Westerholm R, Swietlicki E, Gidhagen L, Wideqvist U and Vesely V (2004). Real-world traffic emission factors of gases and particles measured in a road tunnel in Stockholm, Sweden. Atmospheric Environment 38:657–673.
Kunzli N, Kaiser R, Medina S, Studnicka M, Chanel O, Filliger P, Herry M, Horak F, Puybonnieux-Texier V, Quénel P, Schneider J, Seethaler R, Vergnaud JC and Sommer H (2000). Public-health impact of outdoor and traffic-related air pollution, a European assessment. Lancet 356:795–801.
Lacasana M, Esplugues A and Ballester F (2005). Exposure to ambient air pollution and prenatal and early childhood health effects. European Journal of Epidemiology 20:183–199.
Larsson BM, Sehlstedt M, Grunewald J, Sköld CM, Lundin A, Blomberg A, Sandström T, Eklund A and Svartengren M (2007). Road tunnel air pollution induces bronchoalveolar inflammation in healthy subjects. European Respiratory Journal 29:699–705.

aiR QUaLitY in anD aRoUnD tRaFFiC tUnneLS
176 | References
Laschober C, Limbeck A, Rendl J and Puxbaum H (2004). Particulate emissions from on-road vehicles in the Kaisermühlen-tunnel (Vienna, Austria). Atmospheric Environment 38:2187–2195.
Levy JI, Chemerynski SM and Sarnat JA (2005). Ozone exposure and mortality: an empiric bayes metaregression analysis. Epidemiology 16:458–468.
Levy J, Schwartz J and Hammitt JK (2007). Risk in perspective: mortality risks from ozone exposure, editorial. Harvard Centre for Risk Analysis 15:1–4.
Lighthart B and Shaffer BT (1997). Increased airborne bacterial survival as a function of particle content and size. Aerosol Science and Technology 27:439–446.
Lin CA, Amador Pereira LA, de Souza Conceição GM, Kishi HS, Milani R, Ferreira Braga AL and Nascimento Saldiva PH (2003). Association between air pollution and ischemic cardiovascular emergency room visits. Environmental Research 92:57–63.
Liu S, Krewski D, Shi Y, Chen Y and Burnett RT (2006). Association between maternal exposure to ambient air pollutants during pregnancy and fetal growth restriction. Journal of Exposure Science and Environmental Epidemiology (online), doi:10.1038,/sj.jes. 7500503.
Longley ID and Gallagher MW (2006). Particle and sensible heat fluxes measured by eddy covariance above and within an urban canopy. In: Proceedings of the Sixth International Conference on Urban Climate, Göteborg, Sweden, 12–16 June 2006, Urban Climate Group, Göteborg University, 40–43.
Maisonet M, Correa A, Misra D and Jaakkola JJ (2004). A review of the literature on the effects of ambient air pollution on fetal growth. Environmental Research 95:106–115.
Manins P (2005). Review of Air Quality Modelling for Lane Cove Tunnel, prepared for Lane Cove Tunnel Air Quality Community Consultative Committee, CSIRO Marine and Atmospheric Research Report C/1074.
Manins P (2007). Air quality as a technical and political issue for Sydney’s major tunnels. Paper to be presented to the 14th World Congress of the International Union of Air Pollution Prevention and Environmental Protection Associations, Brisbane, 9–14 September 2007.
Mathis U, Mohr M and Forss AM (2005). Comprehensive particle characterization of modern gasoline and diesel passenger cars at low ambient temperatures. Atmospheric Environment 39:107–117.
McConnell R, Berhane K, Yao L, Jerrett M, Lurmann F, Gilliland F, Künzli N, Gauderman J, Avol E,
Thomas D and Peters J (2006). Traffic, susceptibility, and childhood asthma. Environmental Health Perspective 114:766–772.
McGaughey GR, Desai NR, Allen DT, Seil RL, Lonneman WA, Fraser MP, Harley RA, Pollack AK, Ivy JM and Price JH (2004). Analysis of motor vehicle emissions in a Houston tunnel during the Texas Air Quality Study 2000. Atmospheric Environment 38:3363–3372.
McLaren R, Gertler AW, Wittorff DN, Belzer W, Dann T and Singleton DL (1996). Real-world measurements of exhaust and evaporative emissions in the Cassiar Tunnel predicted by chemical mass balance modeling. Environmental Science and Technology 30:3001–3009.
Miclea PC, Chow WK, Shen-Wen C, Junmei L, Kashef AH, Kang K (2007) International Tunnel Fire-Safety Design Practices, American Society of Heating, Refrigerating and Air-Conditioning Engineers Journal 8:50–60.
Miguel AH, Kirchstetter TW, Harley RA and Hering SV (1998). On-road emissions of particulate polycyclic aromatic hydrocarbons and black carbon from gasoline and diesel vehicles. Environmental Science and Technology 32:450–455.

aiR QUaLitY in anD aRoUnD tRaFFiC tUnneLS
References | 177
Miller KA, Siscovick DS, Sheppard L, Shepherd K, Sullivan JH, Anderson GL, and Kaufman JD (2007). Long-term exposure to air pollution and incidence of cardiovascular events in women. New England Journal of Medicine 356:447–458.
Morawska L, Moore MR and Ristovski ZD (2004). Health impacts of ultrafine particles, desktop literature review and analysis. Prepared for the Department of Envrionment and Heritage.
Morgan G, Corbett S and Wlodarczyk J (1998a). Air pollution and hospital admissions in Sydney Australia, 1990 through 1994. American Journal of Public Health 88:1761–66.
Morgan G, Corbett S, Wlodarczyk J and Lewis P (1998b). Air pollution and daily mortailty in Sydney Australia, 1989 through 1993. American Journal of Public Health 88:759–764.
Mui KW and Shek KW (2005). Influence of in-tunnel environment to in-bus air quality and thermal condition in Hong Kong. Science of the Total Environment 347:163–174.
Neas LM, Dockery DW, Koutrakis P, Tollerud DJ and Speizer FE (1995). The association of ambient air pollution with twice daily peak expiratory flow rate measurements in children, American Journal of Epidemiology 141:111–122.
New South Wales Department of Planning (2005). Compliance Audit Report: M5 East Motorway, Department of Planning, Sydney.
New South Wales Parliament (2002). Inquiry into the M5 East Tunnel, [report]/General Purpose Standing Committee 5 (Parliamentary paper 332).
NICNAS (National Industrial Chemicals Notification and Assessment Scheme) (2001). Benzene, priority existing chemical assessment report 21, Commonwealth of Australia.
NICNAS (National Industrial Chemicals Notification and Assessment Scheme) (2006). Formaldehyde, priority existing chemical assessment report 28, Commonwealth of Australia.
Ning Z, Cheung CS and Liu SX (2004). Experimental investigation of the effect of exhaust gas cooling on diesel particulate. Aerosol Science 35:333–345.
NPRA (Norwegian Public Roads Administration) (2004). Road tunnels.
O’Meara T (2004). Health effects of ambient pollutants resulting from the North South Bypass Tunnel. The Woolcock Institute of Medical Research, confidential draft dated 22 December 2004, available through private communication.
OECD and PIARC (Organisation for Economic Co-operation and Development and Permanent International Association of Road Congresses) (1998). ERS2 Transport of dangerous goods through road tunnels. Technical report of Mission 2, OECD.
Oettl D, Sturm PJ, Bacher M, Pretterhofer G and Almbauer RA (2002). A simple model for the dispersion of pollutants from a road tunnel portal. Atmospheric Environment 36:2943–2953.
Oettl D, Sturm P and Almbauer R (2005). Evaluation of GRAL for the pollutant dispersion from a city street tunnel portal at depressed level. Environmental Modelling & Software 20:499–504.
Park J, Spengler J, Yoon D, Dumyahn T, Lee K and Ozkaynak H (1998). Measurement of air exposure rate of stationary vehicles and estimation of in-vehicle exposure. Journal of Exposure Analysis and Environmental Epidemiology 8(1):65–78.
Peters A, Wichmann HE, Tuch T, Heinrich J and Heyder J (1997). Respiratory effects are associated with the number of ultrafine particles. American Journal of Respiratory and Critical Care Medicine 155:1376–1383.
Peters A, Liu E, Verrier RL, Schwartz J, Gold DR, Mittleman M, Baliff J, Oh JA, Allen G, Monahan K and Dockery DW (2000). Air pollution and incidence of cardiac arrhythmia. Epidemiology 11:11–17.

aiR QUaLitY in anD aRoUnD tRaFFiC tUnneLS
178 | References
Peters A, von Klot S, Heier M, Trentinaglia I, Hörmann A, Wichmann HE and Löwel H (2004). Exposure to traffic and the onset of myocardial infarction. New England Journal of Medicine 351:1721–1730.
Petroeschevsky A, Simpson RW, Thalib L and Rutherford S (2001). Associations between outdoor air pollution and hospital admissions in Brisbane, Australia. Archives of Environmental Health 56:37–52.
Phuleria H, Geller MD, Fine PM and Sioutas C (2006). Size-resolved emissions of organic tracers from light- and heavy-duty vehicles measured in a California roadway tunnel. Environmental Science and Technology 40:4109–4118.
PIARC (Permanent International Association of Road Congresses) (1995) Road Tunnels: Emissions, Ventilation and Environment, PIARC Committee on Road Tunnels, PIARC.
PIARC (Permanent International Association of Road Congresses) (2000). Pollution by Nitrogen Dioxide in Road Tunnels, Technical Committee on Road Tunnel Operation, PIARC.
PIARC (Permanent International Association of Road Congresses) (2004). Road Tunnels: Vehicle Emissions and Air Demand for Ventilation, Technical Committee on Road Tunnel Operation, PIARC.
Pierson WR, Gertler AW, Robinson NF, Sagebiel JC, Zielinska B, Bishop GS, Stedman DH, Zweidinger RB and Ray WD (1996). Real-world automotive emissions-summary of Studies in the Fort McHenry and Tuscarora Mountain tunnels. Atmospheric Environment 30:2233–2256.
Pinkerton KE and Joad JP (2006). Influence of air pollution on respiratory health during perinatal development. Clinical and Experimental Pharmacology and Physiology 33:269–272.
Pohjola MA, Pirjola L, Karppinen A, Härkönen J, Ketzel M and Kukkonen J (2007). Evaluation of a coupled dispersion and aerosol process model against measurements near a major road. Atmospheric Chemistry and Physics Discussions 7:2819–2856.
Poloniecki JD, Atkinson RW, de Leon AP and Anderson HR (1997). Daily time series for cardiovascular hospital admissions and previous day’s air pollution in London, UK. Occupational and Environmental Medicine 54:535–540.
Ponka A and Virtanen M (1996). Low-level air pollution and hospital admissions for cardiac and cerebrovascular diseases in Helsinki. American Journal of Public Health 86:1273–1280.
Pope CA, Thun MJ, Namboodiri MM, Dockery DW, Evans JS, Speizer FE and Heath CW Jr (1995). Particulate air pollution as a predictor of mortality in a prospective study of US adults. American Journal of Respiratory and Critical Care Medicine 151(pt 1):669–674.
Pope CA, Burnett RT, Thun MJ, Calle EE, Krewski D, Ito K and Thurston GD (2002). Lung cancer, cardiopulmonary mortality, and long-term exposure to fine particulate air pollution. Journal of the American Medical Association 287:1132–1141.
Prescott G, Cohen GR, Elton RA, Fowkes FG and Agius RM (1998). Urban air pollution and cardiopulmonary ill health, a 14.5 year time series study. Occupational and Environmental Medicine 55:697–704.
Ptak TJ and Fallon SL (1994). Particulate concentration in automobile passenger compartments. Particulate Science and Technology 12:312–322.
Reponen T, Grinshpun SA, Trakumas S, Martuzevicius D, Wang ZM, LeMasters G, Lockey JE and Biswas P (2003). Concentration gradient patterns of aerosol particles near interstate highways in the Greater Cincinnati airshed. Journal of Enviromental Monitoring 5:557–562.
Reynolds P, Von Behren J, Gunier RB, Goldberg DE and Hertz A (2004). Residential exposure to traffic in California and childhood cancer. Epidemiology 15:6–12.

aiR QUaLitY in anD aRoUnD tRaFFiC tUnneLS
References | 179
Riediker M, Casclo WE and Griggs TR (2004). Particulate matter exposure in cars is associated with cardiovascular effects in healthy young men. American Journal of Respiratory and Critical Care Medicine 169:934–940.
Riley W, McKone TE, Lai ACK and Nazaroff WW (2002). Indoor particulate matter of outdoor origin: importance of size-dependent removal mechanisms. Environmental Science and Technology 36:200–207.
Rogers JF and Dunlop AL (2006). Air pollution and very low birth weight infants, a target population? Pediatrics 118:156–164.
Ruchirawat M, Navasumrit P, Settachan D, Tuntaviroon J, Buthbumrung N and Sharma S (2005). Measurement of genotoxic air pollutant exposures in street vendors and school children in and near Bangkok. Toxicology and Applied Pharmacology 206:207–214.
Ruidavets JB, Cournot M, Cassadou S, Giroux M, Meybeck M and Ferrières J (2005). Ozone air pollution is associated with acute myocardial infarction. Circulation 111:563–569.
Sagebiel JC, Zielinska B, Pierson WR and Gertler AW (1996). Real-world emissions and calculated reactivities of organic species from motor vehicles. Atmospheric Environment 30:2287–2296.
Salvi S, Blomberg A, Rudell B, Kelly F, Sandström T, Holgate ST and Frew A (1999). Acute inflammatory responses in the airways and peripheral blood after short-term exposure to diesel exhaust in healthy human volunteers. American Journal of Respiratory and Critical Care Medicine 159:702–709.
Samaras Z, Ntziachristos L, Thompson N, Hall D, Westerholm R and Boulter P (2005). Characterisation of exhaust particulate emissions from road vehicles (PARTICULATES), Final Publishable Report, European Commission.
Samet JM, Dominici F, Curriero FC, Coursac I and Zeger SL (2000). Fine particulate air pollution and mortality in 20 US cities, 1987–1994. New England Journal of Medicine 343:1742–1749.
Sandstrom T and Brunekreef B (2007). Traffic-related pollution and lung development in children. Lancet 369:535–537.
Sandstrom T, Cassee FR, Salonen R and Dybing E (2005). Recent outcomes in European multicentre projects on ambient particulate air pollution. Toxicology and Applied Pharmacology 207:261–268.
Savitz DA (1989). Association of childhood cancer with residential traffic density. Scandinavian Journal of Work and Environmental Health 15:360–363.
Schatzmann M, Frantz H, Grawe D, Leitl B and Müller WJ (2001). Do field data represent the truth? In: Proceedings of the 3rd International Conference on Urban Air Quality, Loutraki, Greece, 19–23 March 2001.
Schildcrout JS, Sheppard L, Lumley T, Slaughter JC, Koenig JQ and Shapiro GG (2006). Ambient air pollution and asthma exacerbations in children, an eight-city analysis. American Journal of Epidemiology 164:505–517.
Schins RPF, Lightbody JH, Borm PJA, Shi TM, Donaldson K and Stone V (2004). Inflammatory effects of coarse and fine particulate matter in relation to chemical and biological constituents. Toxicology and Applied Pharmacology 195:1–11.
Schmid H, Pucher E, Ellinger R, Biebl P and Puxbaum H (2001). Decadal reductions of traffic emissions on a transit route in Austria—results of the Tauerntunnel experiment 1997. Atmospheric Environment 35:3585–3593.
Schwartz J (2004). Air pollution and children’s health. Pediatrics 113:1037–1043.

aiR QUaLitY in anD aRoUnD tRaFFiC tUnneLS
180 | References
SEHA (Stockholms Miljöförvaltning and Vägverket) (1994). Mätningar av Luftföroreningar, Luftlöden och Trafik i Söderledstunnel; November—December 1993. (In Swedish)
SEHA (Stockholms Miljöförvaltning and Vägverket) (1995). Mätningar av Luftföroreningar, Luftlöden och Trafik i Söderledstunnel; Augusti—September 1994. (In Swedish)
SESPHU (South Eastern Sydney Public Health Unit and NSW Department of Health) (2003). M5 East Tunnels Air Quality Monitoring Project, SESPHU.
Shi JP and Harrison RM (1997). Rapid NO2 formation in diluted petrol-fuelled engine exhaust—
a source of NO2 in winter smog episodes. Atmospheric Environment 31:3857–3866.
Simpson RW, Williams G, Petroeschevsky A, Morgan G and Rutherford S (1997). Associations between outdoor air pollution and daily mortality in Brisbane, Australia. Archives of Environmental Health 52:442–454.
Simpson R, Williams G, Petroeschevsky A, Best T, Morgan G, Denison L, Hinwood A and Neville G (2005). The short-term effects of air pollution on hospital admissions in four Australian cities. Australian and New Zealand Journal of Public Health 29:213–221.
Sinclair Knight Mertz, Connell Wagner (2005). North-South Bypass Tunnel Phase 2—Feasibility Study. EIS—Chapter 9 Air Quality.
SLB-analys (2006). Södra Länken: effekter på luftkvalitet och hälsa. (In Swedish) ISSN 1400-0806.
Staehelin J, Schläpfer K, Bürgin T, Steinemann U, Schneider S, Brunner D, Bäumle M, Meier M, Zahner C, Keiser S, Stahel W and Keller C (1995). Emission factors from road traffic from a tunnel study (Gubrist tunnel, Switzerland). Part I: concept and first results. Science of the Total Environment 169:141–147.
Staehelin J, Keller C, Stahel W, Schläfer K and Wunderli S (1998). Emission factors from road traffic from a tunnel study (Gubrist tunnel, Switzerland). Part III: results of organic compounds, SO
2
and speciation of organic exhaust emission. Atmospheric Environment 32:999–1009.
Stemmler K, Bugmann S, Buchmann B, Reimann S and Staehelin J (2005). Large decrease of VOC emissions of Switzerland’s car fleet during the past decade: results from a highway tunnel study. Atmospheric Environment 39:1009–1018.
Sternbeck J, Sjödin A and Andréasson K (2002). Metal emissions from road traffic and the influence of resuspension—results from two tunnel studies. Atmospheric Environment 36:4735–4744.
Strand V, Svartengren M, Rak S, Barck C and Bylin G (1998). Repeated exposure to an ambient level of NO
2 enhances asthmatic response to a nonsymptomatic allergen dose. European
Respiratory Journal 12:6–12.
Sturm PJ, Pretterhofer G, Rodler J and Almbauer RA (2004). New emission data for ventilation design for road tunnels. In: International Conference on Tunnel Safety and Ventilation, 19–21 April 2004, Graz.
Sunyer J, Ballester F, Le Tertre A, Atkinson R, Ayres JG, Forastiere F, Forsberg B, Vonk JM, Bisanti
L, Tenías JM, Medina S, Schwartz J and Katsouyanni K (2003). The association of daily sulfur dioxide air pollution levels with hospital admissions for cardiovascular diseases in Europe, the Aphea-II study. European Heart Journal 24:752–760.
Svartengren M, Strand V, Bylin G, Jarup L and Pershagen G (2000). Short-term exposure to air pollution in a road tunnel enhances the asthmatic response to allergen. European Respiratory Journal 15:716–724.
Tatum AJ and Shapiro GG (2005). The effects of outdoor air pollution and tobacco smoke on asthma. Immunology Allergy Clinics of North America 251:15–30.

aiR QUaLitY in anD aRoUnD tRaFFiC tUnneLS
References | 181
Thiess John Holland (2006). Eastlink: tunnel ventilation system works approval application. Document No: TJ-G-APR-CO-0001–1-00.
TØI (Transportøkonomisk institutt) (2004). Veger til bedre bymiljø. Miljøundersøkelser Oslo Øst 1987–2002. Report 743/2004.
Tomei F, Ghittori S, Imbriani M, Pavanello S, Carere A, Marcon F, Martini, A, Baccolo TP, Tomao E, Zijno A and Crebelli R (2001). Environmental and biological monitoring of traffic wardens from the city of Rome. Occupational Medicine 51:198–203.
Tonne C, Melly S, Mittleman M, Coull B, Goldberg R and Schwartz J (2007). A case-control analysis of exposure to traffic and acute myocardial infarction. Enviromental Health Perspective 115:53–57.
Tønneson D (2001). Tunneler i Oslo. Luftkvalitetsberegning i forhold til Forurensningsloven. NILU Report OR 10/2001 (in Norwegian).
Touaty M and Bonsang B (2000). Hydrocarbon emissions in a highway tunnel in the Paris area. Atmospheric Environment 34:985–996.
Trasande L and Thurston GD (2005). The role of air pollution in asthma and other pediatric morbidities. Journal of Allergy and Clinical Immunology 115:689–699.
Tuhackova J, Caithaml T, Novak K, Novotny C, Mertelik J and Sasek V (2001). Hydrocarbon deposition and soil microflora as affected by highway traffic. Environmental Pollution 113:255–262.
Valberg PA (2004). Is PM more toxic than the sum of its parts? Risk-assessment toxicity factors vs PM-mortality ‘effect functions’. Inhalation Toxicology 16(Suppl 1):19–26.
Watkiss P (2002). Fuel Taxation Inquiry: the air pollution costs of transport in Australia: a report for the Commonwealth of Australia, Abingdon, UK: AEA Technology Environment, 551.510.42(94):621.43
Wedberg WC (2000). Simultaneous gravimetric and light scatter measurements of summer and winter aerosols inside a car tunnel. University of Bergen, Department of Physics, publication LM378, funded by the Norwegian Public Road Adminstration.
Weingartner E, Keller C, Stahel A, Burtscher H and Baltensperger U (1997). Aerosol emission in a road tunnel. Atmospheric Environment 31:451–462.
WA Department of the Environment (West Australian Department of the Environment) (2003). Research on health and air pollution in Perth. Morbidity and Mortality: a case crossover analysis 1992–1997, Perth, Australia.
Westerlund KG and Johansson PA (1997). Mätningar av Luftföroreningar och trafik I Klaratunneln 1991–1996. Stockholms luft-och bulleranalys (in Swedish).
WHO (World Health Organization) (2000). Air Quality Guidelines for Europe, 2nd edition, World Health Organization Regional Office for Europe.
WHO (World Health Organization) (2005). Air Quality Guidelines. Global update 2005. Particulate Matter, Ozone, Nitrogen Dioxide and Sulfur Dioxide, World Health Organization Regional Office for Europe.
WHO (World Health Organization) (2006). WHO air quality guidelines for particulate matter, ozone, nitrogen dioxide and sulfur dioxide: global update 2005, summary of risk assessment. WHO Press, Geneva Switzerland.
Williams DJ, Carras JN, Saghafi A, Manins PC, Hibberd MF and Hurley PJ (2000). Air quality impact of the emissions from the M5 East tunnel. Investigation Report ET/IR304R. CSIRO Atmopsheric Research. Report to the NSW Department of Urban Affairs and Planning.

aiR QUaLitY in anD aRoUnD tRaFFiC tUnneLS
182 | References
Wingfors H, Sjödin A, Haglund P and Brorstrm-Lundén E (2001). Characterisation and determination of profiles of polycyclic aromatic hydrocarbons in a traffic tunnel in Gothenburg, Sweden. Atmospheric Environment 35:6361–6369.
Wittmaak K (2007). In search of the most relevant parameter for quantifying lung inflammatory response to nanoparticle exposure: particle number, surface area, or what? Environmental Health Perspective 115:187–194.
Wong CM, Atkinson RW, Anderson HR, Hedley AJ, Ma S, Yuen-Kwan Chau P and Lam T (2002). A tale of two cities, effects of air pollution on hospital admissions in Hong Kong and London compared. Environmental Health Perspective 110:67–77.
Woolcock Institute of Medical Research (2006). Air Quality and Respiratory Health Study— The Lane Cove Tunnel Health Investigation. Prepared for NSW Health.
Yamazaki S, Nitta H, Ono M, Green J and Fukuhara S (2007), Intracerebral haemorrhage associated with hourly concentration of ambient particulate matter: case-crossover analysis. Occupational and Environmental Medicine 64:17–24.
Yang CY, Chen YS, Yang CH and Ho SC (2004). Relationship between ambient air pollution and hospital admissions for cardiovascular diseases in Kaohsiung, Taiwan. Journal of Toxicology and Environmental Health Part A, 67:483–493.
Yao X, Lau NT, Chan CK and Fang M (2005). The use of tunnel concentration profile data to determine the ratio of NO
2/NO
x directly emitted from vehicles. Atmospheric Chemistry and
Phyics Discussions 5:12723–12740.
Yao X, Lau NT, Chan CK and Fang M (2007). Size distributions and condensation growth of submicron particles in on-road vehicle plumes in Hong Kong. Atmospheric Environment 41:3328–3338.
Yeatts K, Svendsen E, Creason J, Alexis N, Herbst M, Scott J, Kupper L, Williams R, Neas L, Cascio W, Devlin RB and Peden DB (2007). Coarse particulate matter (PM
2.5–10) affects heart rate
variability, blood lipids, and circulating eosinophils in adults with asthma. Environmental Health Perspective 115:709–714.
Yu TS, Wong TW, Wang XR, Song H, Wong SL and Tang JL (2001). Adverse effects of low-level air pollution on the respiratory health of schoolchildren in Hong Kong. Journal of Occupational and Environmental Medicine 43:310–316.
Zanobetti A and Schwartz J (2002). Cardiovascular damage by airborne particles, are diabetics more susceptible? Epidemiology 13:588–592.
Zhu Y, Hinds WC, Shen S and Sioutas C (2002). Study of ultrafine particles near a major highway with heavy duty diesel traffic. Atmospheric Environment 36:4323–4335.
Zhu Y, Hinds WC, Krudysz M, Kuhn T, Froines J and Sioutas C (2005). Penetration of freeway ultrafine particles into indoor environments. Journal of Aerosol Science 36:303–322.
Zielinska B, Sagebiel JC, Harshfield G, Gertler AW and Pierson WR (1996). Volatile organic compounds up to C
20 emitted from motor vehicles; measurement methods. Atmospheric
Environment 30:2269–2286.
Zmirou D, Gauvin S, Pin I, Momas I, Sahraoui F, Just J, Le Moullec Y, Brémont F, Cassadou S, Reungoat P, Albertini M, Lauvergne N, Chiron M, Labbé A and Vesta Investigators (2004). Traffic related air pollution and incidence of childhood asthma, results of the Vesta case-control study. Journal of Epidemiology and Community Health 58:18–2