ngigi sophia wangarl date - university of nairobi
TRANSCRIPT

THE IM PI.ICA’I IONS OK IMPROVED WATER PROVISION ONLIVELIHOODS:
A < 'use of Mulilo Division
BY:
nc; k ;i s o p i i i a w a n o a i u
u n i v e r s i t y OF NAlKOMiI. » . $ . LIBRARY
Projet i Paper Submitted to the Institute for Development Studies in Partial
l-iiinimcnt of the Requirements of the Award of M aster of Arts degree in
Development Studies, University of Nairobi.
Institute for Developm ent Studies
University of Nairobi
C* W W W * I t r m y
iimi mm(M7W2 8
Novem ber, 2009

DECLARATION
This project paper is my original work and has not been submitted for examination in any other university.
Ngigi Sophia Wangarl Date
Ilic project has been submitted for examination with our approval as University
supervisors.
Date
Date
Institute for Development Studies, University of Nairobi
i

AC K N OW LF. DGEMENT
1 wish to express my heartfelt gratitude to all the people who have supported me and
contributed in various ways to make my studies and this project a success, first and
foremost 1 thank God who has given me life and everything including good people to
guide me through. I wish to recognize and appreciate in a special way my supervisors Dr.
Joseph Onjala and Prof. Mohamud Jama for their constructive guidance and support
tliroughout the project duration. 1 acknowledge that without their support. 1 would not
have reached this lar.
My gratitude also goes to the IDS fraternity in particular my lecturers and colleagues who
have journeyed with me for the last two years. In a special way 1 thunk Prof. Dorothy
McCormick and Erick Manga for journeying with us all through as w e w rote our project
papers. To my colleagues lor fostering unity for being there always ready to assist for
you ensured I had someone to recourse to.
1 also wish to appreciate my respondents in Mutilo Division who gave me their time and
freely answered my questionnaires. Special thanks in this regards goes to It . John
Munyoki for his assistance during my field research. My thanks extend to the I ittle
Sisters o f St. Joseph in Nrombe for hosting me and also to my research assistants for
their commitment and dedication throughout my field research. Equal thanks go to my
key informants lor availing themselves and their willingness to share the information that
they had.
My deep appreciation goes to my congregation o f the Daughters of Jesus the Good
Shepherd lor giving me the opportunity to pursue my studies. In a very special way I
wish to thank the Catholic Scholarship Programme o f East Africa for sponsoring me and
paying for my school fees. Not forgetting my mother, brothers and sisters and my friends
who have given me their support and encouragement in my studies. I can not thank all
enough but I believe the Good Lord will bless each one personally for the much you have
done to one o f his little one.
it

A B STR A C TThis study investigates the implication of improved water provision on livelihoods. It
focuses on Mutito Division as n case study. The study moves from the premise that
improved water provision will have an effect on the activities that people arc able to
engage in. I he study looked at water not just as a basic need for healthy growth hut also
as productive asset that can help people improve their living standards. 1 he objectives of
the study is to establish the main sources of water lor the residents o f Mutito Division and
to analyse the effects of improved water provision on the livelihoods o f the people living
in the urcu.
The data was obtained from both the primary and secondary sources. For the primary
data, structured questionnaires lor household heads were administered to ninety
respondents. The respondents were sampled from three sub-locations namely: Malotani,
Kawala and Kiloo sub-locations in Mutito Division, lou r key informants were
administered unstructured questionnaires and provided detailed information on key issues
in the study. The secondary data was obtained from books, articles, journals und reports
of similar studies carried out elsewhere. Both descriptive and inferential statistics were
computed using SPSS computer programme. The tables and figures generated were
explained and backed up with literature.
The findings indicated that the residents of Mutito Division depended on rivers, springs,
shallow wells, boreholes and sand dam as their sources o f water. Improved water sources
were found to have an effect on the livelihood activities that they were able to engage in,
Even with little water available, they were able to improve on the activities that they
engaged. Improved water provision was helping reduce the occurrence of water borne
diseases and with water more parents were able to finance the education of their children.
The study came up with some recommendations. Among them is the need to improve on
water provision in Mutito Division to help alleviate poverty. I here is need lor
corroboration in organisations working in water provision. Also need to improve
infrastructure and training to enhance livelihood activities in the area.
iii

TABLE OF CONTENT
DECLARATION............................................................................................................................ 1ACKNOWLEDGEMENT.................................................................................................... IIABSTRACT.................................................................................................................................. iiiTABLE OF CONTENT.................................................................................................................ivLIST OF TA BLES............................................................................................................viLIST OF FIGURES.........................................................................................................viiList o f Abbreviations...............................................................................................................viii
C HAFFER ONE
1.0 Introduction............................................................................................................................ 11.1 Backgroundol'theStudy........................................................................................................... I1.2 The Study Area................ •...................................................................................................... 41.3 Statement of the Problem..........................................................................................................5I 4 Research questions....................................................................................................................81.5 Objectives................................................................................................................................. 81.6 Study hypothesis.......................................................................................................................81.7 Rationale of the Study...............................................................................................................9
CHAPTER TWO
2.0 IntriKluctiim............................................................................................................................ 102.1 Literature Review.............................................................................................................. 102.2 Conceptual Framework...........................................................................................................172.2.1 The conceptual link between water resources access and livelihoods.................................. 172.2.2 Analytical Framework..........................................................................................................18
CHAR TER THREE
3.0 Methodology................................................................................... 213.1 The site description.................................................................................................................213.2 Sampling size and procedure.................................................................................................. 2 13.3 Data Source?* and collection techniques..................................................................................223.4 Data Analyst*.........................................................................................................................243.5 Definition and Operationalisation of variables of key terms...................................................25
CHAPTER FOUR
4.0. Findings and Discussions............................................................................................ 274.1 Introduction............................................................................................................................274.1.1 Background Information of live Respondent*......................................................................27
Iv

4.1.2 Education and Occupation of Respondent.......................................................................... 294.2 Sources o f Water in Mutito Division..............................................................................314.2.1 Sources of Water................................................................................................................ 314.2.2 Problems o f Water Access.............................................................................................344.2.3 Cost of Water................................................- ................................................................... 374.2.4 Ownership of a Private Water Source................................................................................. 394.2.5 Distance to the Water Point.................................................................................................404.2.6 Time Saved from Water Collection.................................................................................... 414.2.6 Wrater Collection..................................................................................................................434.3 Other Sources of Livelihood.................................................................................................444.3.1 Employment........................................................................................................................454.3.2 Remittances........................................................................................................................ 464.3.3 Food aid.... ........................................................................................ 474.5 household Income l evel................................................................................................... 494.3.4 Food consumption in Mutito division................................................................................ 494.8 Education of Children in Mutito Division..........................................................................524.10 Other Challenges Experienced in the Area......................................................................... 544.4 Effects o f Improved Water Provision on Livelihoods..................................................574.4.1 Water and livelihoods......................................................................................................- 564.4.2 Water use at household level...................................................................... 594.4.3 Livestock keeping............................................................................................................... 604.3.4 Crop fanning...................................................................................................................... 624.4.5 Increase in Income..............................................................................................................634.4.6 Involvement in small scale business................................................................................... 644.4.7 W'atcr Borne Diseases.................................................................................................- .....654.4.8 Ways of improving Water Provision in Mutito Division................................................... 674.4.9 Linking W'atcr Access with Livelihood Activities............................................................. 694.4.10 Hypothesis Testing...........................................................................................................71
CH APTER FIVE
5. RESEARCH CONCI IJSIONS A N D RECOMMEND A I IONS.................................... 735.1 Research Co n c l u sio n ......................................................................................................................735.1.1 Respondents Characteristics............................................................................................... 735.1.2 Sources o f W'atcr.................................................................................................................................... 735.1.3 Other Sources of Livelihood.............................................................................................. 745.1.4 Water und Livelihoods........................................................................................................“65.2 Recommendations............................................................................................................ 79
REFERENCES........................................................................................................................79
APPENDIX 1„............ ......... ..................... ........ ................................................................... 84
APPENDIX 2 .............................................. IHHIUmiHHUlHHHHIHmillHIHIItMHIHM .................. 93
APPENDIX 3 ............... ..................................................................... .....................................94
v

LIST OF TABLES
TABU: 3.1: DATA COLLECTION TECHNIQUES..................................................................... 2-1Tabll 4.1 Percentage distribution of people by their gender a n d m arital
STATUS........................................................................................................................................................... 28Table 4 .2 Frequency distributio n sh o w in g A ge-g r o u ps of r e spo n d e n t s ...........28T able 4.3: A Frequency distribution tabi f. show ing the i fvfi of ed u c a t io n .. 2‘> T abi f 4.4: A frfq ufncy table sh o w in g THE OCflTATION OF THF RESPONDENTS and
THFIR s p o u s e s ............................................................................................................................................ 30TABI E 4.5: A FREQUENCY DISTRIBirnON TABI f SHOWING THE VARIOUS SOURCES OFWATER FOR IIOUSFHOI DS........................................................................................................................32T able 4 .6: Cr o ss tabulation o f si r i o c a t io n s a n d s o u r c l o f w a t e r ................... 33T able 4 .7: A Cr o ss ta b u l a t io n whether water a c cess is a problem a n d what MAKES IT A PROBLEM................................................................................................................................35
I able 4 .8: C r o ss-tabulation of si b lo catio ns a n d timf spent queulno tor hie
w ater .................................... :.................................................................................................................... 37Table. 4.9: C r o ss-t a bu la iton table of s u b -lo cation a n d w here thi y r o u g h ]THE WATER FROM...................................................................................................................................... 37Table 4 .10: Frequency distribu iton table of the per c en ta g es of responden ts
a n d am ount of m oney spent w eekly on wa ter .....................................................................39Ta b u : 4.11: Frequency distribution ta ble of the percentage n u m b e r of
r espo n dents o w ning private w a ter so urce ........................................................................... 39T a ble 4 .12 : A Cr o ss- i me t w io n o f s u b lo catio ns a n d t h e dist \ n c e c o v er ed t oGET TO 1 HE RIVER......................................................................................................................................40I ARI F. 4.13: A CROSS T ABULA HON OF SUB LOCATION AND DISTANCE TO THE SHALLOWWEI.I............................................................................................................................................................... 41Ta bl e 4 .14: A frequency distribution table show w ho collect w ater for i hi
HOUSEHOLD AND THF PERCENTAGE 01 EACH..................................................................................43Ta bl e 4 . 15: a cross ta bulatio n of mi m ber s of h o u seh o ld w ho c ollect water
LN A DAY AND THE MEANS USFD TO CARRY III! WATER..............................................................44I ABLE 4.16: A CROSS TABULATION OF TYPE OF EMPIOYMLNI ENGAGED IN AND THF.
PROPORI ION Ol LIVELIHOOD COMING FROM EMPLOYMENT........................................................45Table 4.17: a C ross ta b u l a t io n of m aritai s t a g 's a n d whether they receive
REMITTANCES AND FROM WHOM.......................................................................................................... 47TABLE 4.18: A CROSS TABULA HON OF MARITAL STAG 'S AND WHETHER JULY RECEIVEfood A id a n d the proportion of their ljvei ihood from food A id ........................... 48
Ta ble 4 .19: a Cr o ss tabula iton oi so urce of water a n d how th ey r a it theirin c o m e .........................................................................................................................................................49Ta bl e 4 .2 0 a C ross tabulatio n of how water h a s e a s e d the problem oi io o ds e c u r it y ..................................................................................................................................................... 50I ABLE 4.21: A CROSS TABULATION OF WHAT DAILY MEAL WAS MAINLY COMPOSED
. OF AND IF THE FAMLY HAD GONE WITHOUT MEAL, HOWOFTEN.............................................................................................................................................................Ta ble 4 .22: Frequency distributio n ta ble o i whether the; children arl iaken TO SECONDARY SCHOOI AND WHO PAYS IOR I HEIR SCHOOL FEES...........................................52
VI

'•ABLE 4 .24: A CROSS TABULATION OK SUB LOC ATIONS AND WHETHER HUNGER IS A CHALLENGE AND HOW I T CAN RF ADDRESSED................................................................................55Table 4.25: Freq u enc y distributio n ta ble show ing the amount oi water spent
WATERINO GOA TS AND COWS,......................................................................................................59Ta b u 4 .26 C r o ss ta b u l a tion o f the to ea i. n u m ber o f family ml m bfrs a n d the
AMOUNT OF WATER SEEN I IN DOMESTIC WORK............................................................................. 60Taull 4.27: C r o ss ta bulatio n of thf crops g r o w n in thf a r fa . the proportion
of LIVEl WOOD AND THE PURPOSF FOR WHICH THEY ART GROWN......................................... 62T a b u 4.28: FkEQITNCY TABLE SHOWING THE BUSINESS ENOAGFD IN ANDTHE PERCENTAGES..............................................................................................................................................65Ta b u 4.29: Fr eq u e n c y distribu tion tari e of the w ater borne diseases
COMMON IN THE ARFA..............................................................................................................................67Ta ble 4.30: A Cr o ss ta b u l a i ion oi so u r c e o f wa i lr a n d ihf. n u m be r ok
LIVELIHOOD ACTIVITIES...........................................................................................................................71T aBI e 4.31: CHl-SQi :are Te s t ...........................................................................................................7 1
LIST OF FIGURES
I igurc 1.1: Kitui District Administrative Boundaries (2001).........................................5Figure 2.1 Analytical framework on how water impacts on livelihoods.....................................18Figure 4.1: Bnr graph showing the problems of water access.................................................... 32\ igurc 4.2: Bar graph showing the source of water and the whether there was time saved dial waspreviously used to collect the water............................................................................................ 41Figure 4.3: Bar graph showing the number of people who have increased llic number of livestockand the proportion of livelihood coming from livestock keeping................................................48Figure 4.4: Pie chan showing the activities done which have increased the income and thepercentage number of respondents in each activity..................................................................... 51Tigure 4.5: Bar graph showing the age of respondents and how they distributed theirincome. ....................................................................................................................... 56Figure 4.6: A pie chart showing the different ways o f improving water provision...........70
vii

CHAPTER ONE
1.0 Introduction
lliis study set out to investigate the implication o f improved water provision on
livelihoods. The study report has five chapters, Chapter one introduces the study by-
giving the background, the statement o f the problem and the objectives o f the study.
Chapter two reviews relevant literature related to the study and gives the theoretical bases
on which the study is based. Chapter three discusses the methodology employed in
conducting the study giving the study site, sampling procedure and methods of data
collection and analysis. Chapter four presents the findings giving both qualitative and
quantitative data and its interpretation. Chapter five presents the conclusion o f the study
and the suggested recommendations.
1.1 Background of the Study
Water is one of the most important resources lor the people in rural areas. Access to clean
water is central to healthy and productive lives o f the people. The problem o f lack o f
access to clean water is more pronounced for poor people in rural areas, l or t!»e rural
people, water is required for productive and consumptive uses, poverty reduction and
sustainable livelihoods. Hence, improving access to water in die rural areas can
contribute to greater food security, nutrition, health status, income and resilience in
income and consumption pattern (Moldcn, 2007). Water needs in rural areas arc not just
for a bucket of water to wash, clean and cook at home after a hard day in the fields. I he
supply is required to meet the ever changing and sometimes new usages especially non
farm activities to generate income. I his is because it is increasingly being recognised that
rural non-farm incomes arc a key component in the livelihoods of poor people. Safe and
secure water is essential not only for poor peoples’ survival and health, but it also plays a
wider role in poverty reduction and improving livelihoods especially in water scarce rural
areas (Moriartv and Butterworth, 2003, Hope and Gowing, 2003, GDI, 2002).

I here has been an increased concern on persistent poverty and Millennium Development
Goals (MDGs) have been developed as a renewed commitment towards eradication of
poverty. The MDGs hnve identified improving wulcr supply as a core element in poverty
reduction in the developing world (Shordf et-al, 2004). Water is essential in all areas of
life and hence for each of the goal, at least 30% o f it or more is directly dependent on
water. This has made the debate on improved water provision central in accomplishing
the MDGs (h'-iev •w\v\v.4$saap.vrg<docs/,mdys 2009). The diagnosis of world poverty has
been followed up in different forums. In particular, the World Water Development
Reports have constantly looked at the link between poverty and water access. According
to World Water Development Report of 2004, the problem o f poverty is undoubtedly
linked to that o f water, its availability , proximity, quality and quantity. This determines
how the poor people will use the water. It also has the potential to make major
contribution towards poverty eradication. Moriarty and Butterworth (2003) noted that key
measure of poverty reduction impact o f a new or improved water supply scheme is the
extent to which the scheme contributes to reduction in peoples' vulnerability to trends
and shocks, and increases in their resilience (i.e. when exposed).
At the beginning of the 21st Century over one billion people still luck this vital resource
(WWC, 2000, Hope and Gowing, 2003, Black. 2004). It is estimated that 1.1 billion
people worldwide do not have access to safe water. Also, an estimated 1.7-2.2 million
persons die from water borne diseases each year. Water borne diseases are among the
leading causes o f morbidity and mortality in the developing world (Centre for Disease
Control, 2003), Children in particular suffer poor health as a result of direct injury-
through hauling heavy water carriers commonly 15-20 litres over long distances and use
ol insufficient amount o f water to maintain adequate standards of hygiene (Carter und
HowSam, 1999).
In Kenya, it is estimated Unit about half of the population lacks access to safe drinking
water. This translates to 16 million people with 13 million of the affected people living in
the rural areas. Unlike in other countries like Tanzania, Kenya due to its problem o f water
scarcity has had the Ministry of Water focus more on water development especially for
2

domestic use. Statistics on water show liiat in 1972, only 9% o f the rural population had
supply o f ‘safe’ water schemes. By 1989. the numher rose to 20% and by the year 2000.
it rose to 42% (Huggins, 2003). By 2002. at least 46% o f the rural population had access
to water (World Bank. 2006). This was below Kenyan ambitious target o f ensuring that
by the year 2000. water was available to all. both in the rural and urban areas, at
reasonable distances (Murnma. 2005).
Combating poverty imd facilitating economic growth recovery is a dominant theme in
development policy in Kenya. The Kenyan national water policy has encompassed
poverty alleviation as its primary goal. This is because Kenya identifies safe water and
adequate sanitation as one of the pillars that can improve the quality o f life of its people
especially in the poor communities. Poor water supply and inadequate sanitation impede
economic and social development and strains government resources when water and
sanitation related diseases break out. Access to water lor human consumption, agriculture
and livestock use is a major problem in rural areas. The situation is severe in ASALs
region which occupies almost 80% o f the Kenyan land (WWAP, 2006). flic water
scarcity in this region prevents people from improving their livelihood as most of their
time is spent looking for water (Excellent, 2005). This makes water availability and use
to be a key issue in the development and sustainable use o f the ASALs which have
limited water sources that are poorly distributed and have low ground water sources
(WWAP. 2006).
l or Kenya to improve its economic performance and get to poverty reduction, it needs to
invest more on water infrastructure and improve on management of water resources. Hie
key sectors of the Kenyan economy are directly dependent on a reliable and adequate
supply o f good quality water. These include agriculture, manufacturing, energy,
livestock, environment and tourism. Despite this dependence on water for economic and
social well being of the people, there has been poor development o f infrastructure like
dams, pans, boreholes, pipelines, and rainwater harvesting for many years. The water
resources and water towers me poorly managed and unprotected and this worsens the
country's water situation. This makes water supply for economic activities to be
3

unreliable. I here is inappropriate allocation o f water access and the quality o f water is
compromised through pollution and degradation. This has more implication on the lives
of the poor people as their economic activities arc impeded. The I’RSP report of 2001-
2004 showed that the poor people link sustainable management o f water resources with
poverty. The document stated, “access to water for human consumption, agricultural, and
livestock use is a major problem in rural arcus. I he water supply situation in rural ureas
has deteriorated over the years to a point where demand cannot be sustained with current
systems. Access to piped water has not increased since 198‘> and those accessing other
water sources have increased Iron) 14 to 29% during the same period" (World Hank,
2004).
1.2 Tho Study Aroa
The study has been carried out in Mutito Division in Kitui District. Kitui District lies
between 400 m and 1800 m above sea level. I he climate is hot and dry. a characteristic
of ASAl.s with unreliable and erratic rainfall. The area experiences hi modal rain whose
amount is determined by the topographical features o f landscape and hills. Mutito
Division being down the hills receives 500-700 mm per year. The minimum temperatures
in this area are 18-22° C and a maximum o f 30-34°C (Kenya Republic of, 2001).
Mutito Division has three locations and twelve sub locations. The land is characterised by
scattered homesteads and irregular patches o f cropland inter-spread with areas under trees
or bush Indigenous trees together with occasional baobab, typify the hot. dry conditions
that prevail. Dissecting the plains arc winding valleys with wide sandy riverbeds and
branching tributaries to higher grounds. During rainy seasons, surface water may How
after which it sinks below the level of the sand. People arc accustomed to digging holes
in the sand and scooping out the water and as the dry season progresses, the water level
falls and become deeper hence it is difficult to get water for domestic use and for
livestock. Livestock keeping is a major economic activity given the arid climate of the
area. Forestry and agro-forestry activities arc practiced and it is also an important natural
resource base (Keny a Republic of. 2001).
4
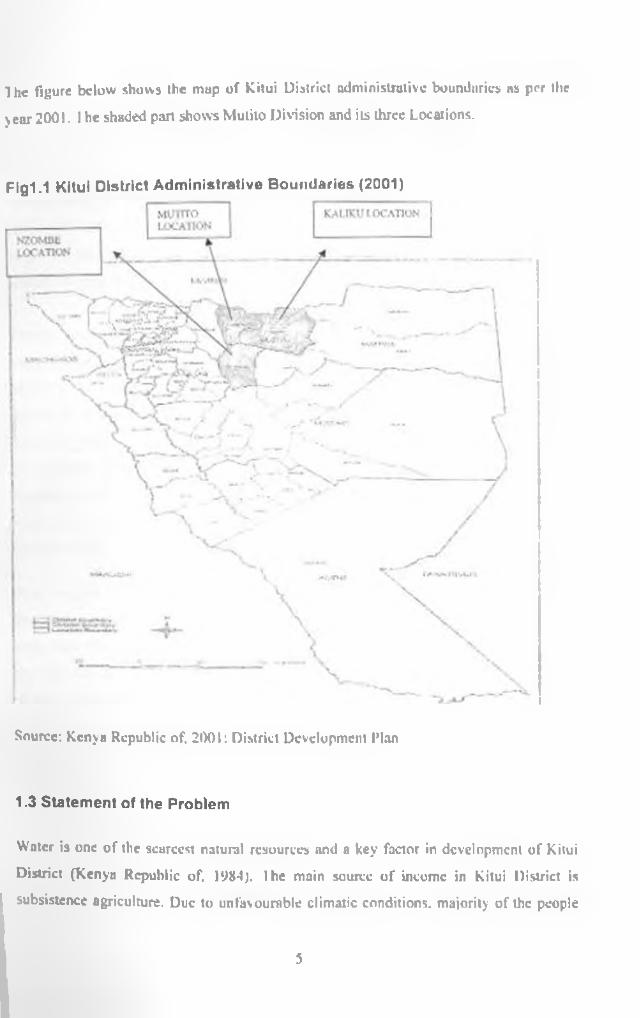
The figure below shows the map of Kitui District administrative boundaries as per the
year 2001. 1 he shaded part shows Mulito Division and its three Locations.
Fig1.1 Kitui District Administrative Boundaries (2001)
Source: Kenya Republic of. 2001: District Development Plan
1.3 Statement of the Problem
Water is one of the scarcest natural resources and a key factor in development of Kitui
District (Kenya Republic of, 1984). I he main source o f income in Kitui District is
subsistence agriculture. Due to unfavourable climatic conditions, majority of the people
5

in the area live below poverty line and experience frequent food shortage and water
scarcity (Speelmun ct at, 2006). I he district’s poverty level is at 65%, the poorest areas
being the divisions with erratic rainfall, such as Mutito Division at 71% (Kenya Republic
of, 2002). The situation is further aggravated by the underdeveloped water infrastructure
to avail water for both financial and non-tinancial livelihood benefits for the poor (01 >1.
2002; GDI, 2003; Speelman, 2006). By 2002, only 6.1%, that is, 6.319 household o f the
490, 729 people in the district had access to safe and clean piped water while 600
households (0.6%) had roof catchments (Kenya Republic of. 2002).
Though water is essential for life, health and human dignity. (WWAP, 2006) it remains a
major challenge especially in Mutito Division. I he people in this area depend on rainfall
which is unreliable and very little. The area lacks permanent rivers hence the people
depend on seasonal rivers which dry up during the prolonged dry season. The women
have to travel long distances to get water in the bigger rivers where it can still be found.
The children have occasionally to miss school to assist in water collection for the
household. The people of the area struggle to obtain water for domestic use and this
leaves them with less time to engage in productive activities for self sustenance and for
food security.
Over the past fifty years, various approaches have been tried on how to improve water
availability in Kitui District but the impact remains unknown. Most of these interventions
have been confounded due to land degradation and lack of sustainable measures to
maintain the water projects. The possibilities of improving w ater provision do exist, such
as harvesting rainwater from the roofs, digging shallow wells, boreholes, earth dams,
rock catchments, constructing barrages in sandy rivers and improving groundwater
recharge through better land use and conservation. With the high levels o f poverty, very
few Individuals in the area arc able to construct their own water reservoirs as majority
have little money to invest in water harvesting. This makes water a major challenge
facing the people in this area, l ew people have enough water to irrigate small gardens
and grow vegetables for local market, from time to time, famine relief has to be brought
in to sustain the population (Sasol and Maji na Ufanisi. 1999).
6

Due to harsh environmental conditions and absence o f industries, majority of young ami
able bodied men seek work outside and remit money to maintain their families and
educate their children. This leaves about 65% of the households to be female headed
(Sasol and Maji na Ufanisi, 1999). Ihc farming activities and livestock keeping are also
impaired due to lack o f water. The people have always to risk planting their crop and
hence do not invest much in crop farming. They also have to keep less livestock which
they can afford to water. The situation increases the levels o r poverty which can be
remedied with the supply of right quantities and qualities of water to ensure
sustainability. Lack o f water for use and the time and energy consumed in its collection
have great implications for nutrition, health and productivity o f people in a given area.
The distance to water points is a big concern with tire recommended convenient distance
being 1000 meters in rural areas (Macdonalf, 2003). Ihe challenge is when the safe water
source is far, the people are likely to keep fetching water from a surface water source
near their homes. It is shown from facts that when the distance to water point is more
than two kilometres, the consumption o f water goes as low a 3-4 litres a day. This is way
below the recommended 20 litres of water per day per person (Carter and Howsam,
1999). This leaves them prone to ill health associated w ith water access and use as they
are not able to have enough water for their consumption. This also has implications on
the economic activities that they arc able to engage in.
Different organisations including the government have come in to work with the residents
o f Mutito Division to make this crucial resource available to all at reasonable distances.
I his is because they realise that water insecurity affects the production, income and
consumption pattern o f the people (DFID. 2001). W ater availability could help offset
constraints associated with existing activities and provide options for new activities that
are eomp-atible with the preferred livelihood strategics (Moriarty and Uuttcrworth, 2003;
Nicol, 2000). Improved water provision has the potential for affecting livelihood but it is
not known the extent to which water availability in Mutito Division is affecting the
7

livelihoods o f the people. This study set out to fill a research gap on the extent to which
improved water provision affects the livelihoods o f the people in Mutito Division.
1.4 Research questions
The study seeks to address one overall research question and two specific questions. Ihe
overall question was to assess what implication improved water provision has on the
livelihoods of the households in Mutito Division.
Specific questions:
1. What arc the main sources o f water access for the residents of Mutito Division?
2. I low does the improved provision of water alleel the livelihoods of the people in
the area?
1.5 Objectivos
Ihe broaJ objective of the study was to investigate the implications o f improved water
provision on the livelihoods of households in Mutito Division.
Specific objectives:1. To establish the main sources of water for the residents of Mutito Division.
2. To analyse the effects o f improved water provision on the livelihoods o f the
people in the area.
1.6 Study hypothesis
The study hypothesis stales that there is no relationship between the source o f water and
the number of livelihood activities one is able to engage in.
8

1.7 R ationale of the Study
Waier provides directly and indirectly to the livelihoods o f the majority o f rural poor.
Different *tudics carried out in various parts o f the world have shown that access to water
U a key determinant of livelihood security by impacting on a broad range o f other
activities and assets. Moriarty and Butterworth. (2003) noted that water access not only
enhances domestic water use but it also enables the rural people to be able to engage in
different activities such as subsistence agriculture, livestock production, cottage industry,
brick making and serv ice provision w ithin their area. It also improves the health o f the
people by having adequate quality and quantity of water to use for their household needs.
Developing water infrastructure enables people to access water at reasonable distance and
hence use the time saved in other productive activities. This in turn helps the people
alleviate their living standards and be able to meet their needs. This makes water to be
highly considered as one o f the most important resources and one whose development
can lead to poverty alleviation especially in the poor regions. This study aimed at
assessing the effects of water provision on the livelihoods o f the people. The information
generated can be used to design the most effective method or water provision. It will also
show whether water docs help people to improve their livelihood strategies and how this
intum impact on their lives especially in meeting their basic needs such as food security,
education o f their children and their health. The study aimed at contributing to the debate
on water as one of the most important resources in the rural areas whose availability
could lead to poverty alleviation.

CHAPTER TWO
2.0 Introduction
I his section reviews literature on the key issues o f definition o f livelihoods and six
studies on water and its effect on livelihoods. Four of case studies were carried out in
K.enva and two arc ease studies carried out outside Kenya. The final pari has the
conceptual framework on which the study was based.
2.1 Literaturo Review
Chambers and Conway (1992:7) define I ivelihood to comprise, “capabilities, assets
(stores, resources, claims and access) and activities required for a means o f living. Singh
& Lawrence (1997) (quoted in http://www.waterandlivclihood.org) considered
•livelihood’ to consist o f the assets, activities and entitlements that enable people to make
a living Assets may consist o f natural resources, abilities, knowledge, skills, and
employment opportunities. Activities consist o f things that people do to earn a living, and
these will usually be based on available assets. Lntitlemcnts refer to those things that
people may rely upon because o f legal or customary rights.
I.ivelihood strategies recognise that most people do many things to secure their income,
food and other things they desire, and that they have clear strategies to achieve these
aims. These strategics include all the activities that people engage In as part o f making
their living. They include agricultural activities such as crop fanning and livestock
keeping, selling forest products and wage labour among others (Moriaity and
Bunerwonh. 2003).
Households engage in a number o f activities; the most obvious being cultivating field
crops and livestock keeping. This is mainly for both self- provisioning, lor barter and
cash income. They also engage in other additional sources o f food, income, support and
means of survival such as home gardening, common property resources, casual labour,
remittances, seasonal food for work among others (Chambers. 1997).
10

Considerable evidence indicate that making even small amounts o f water available lor
personal and productive uses to the poor people can transform their lives. Water is an
asset in productive processes at household level that is used for watering animals,
supplementing small plot irrigation, producing local drinks for sale or other cottage
industry products or even reselling for a profit to other households (Save the Sand
project. 2003; Nicol, 2000). Water access has positive impacts on the livelihoods of the
poor especially in the extensive semi arid areas of the developing world (Hope and
Gowing, 2003). The impact goes further than health benefits attributed to it (Moriaty and
Bulterworth, 2003).
I mpirical evidence shows that provision ol'water does not only improve health, but also
help people to engage in other productive activities. A study curried out in Ukamboni by
Speelman et al (2006) focusing mainly on Machakos and Makucnl Districts on
productive water uses at household level in rural Kenya showed that water availability
had k positive effect on the productive activities that people engaged in. I he study used
both qualitative and quantitative methodologies and carried out household survey and
focus group discussions. They found that on average the household spent two hours to
collect water. The distance to the water point ranged from 50m to 7km. They found out
that 80.7% of those sampled practiced fanning. The households generate income by using
water for selected productive uses like erop production (46%), livestock production
(40%) and water sales (5%). The rural communities in these regions view water as a
productive usset and hence engage in on-farm income related water activities. I ivcstock
and water sale contribution was found not to be significant but livestock contributed to
nutrition o f the household. Vegetable production generated the highest monthly income
making it the main component of cash income of many households. 1 he households
using a communal water source were more often limited in the amount o f water they use
for productive.activities und were at 51% compared 92% of those with private access.
The difference was explained by the cost ol water that made them not engage in
productive activities. They compared households participating in the water project
(Integrated Natural Resource Management in kkambani) with those not participating in
II

the project- They found that the average monthly income of those not participating was
luwcr than for those participating. The farmers felt they could benefit more if market for
their product was improved. They also found out that salaried employment was very
important lor the households.
Spcelman ct al (2006) study informed the study carried out in Mulilo Division to assess
how the improved water provision impact on the livelihoods of the people. It also helped
to relate several aspects such us time, distance, cost, water source ownership and use of
the water to livelihood activities. It applied similar research methodologies to collect and
analyse the data. The study being carried out in Mutito will go further by focusing on
other non farm livelihood activities such as micro enterprises carried out in the area. It
will also look at how that is reflected in the lives of the residents in terms of improving
their well being in food security, health and education o f their children.
A study carried out by two NGOs (Sasol and Maji na Ufanisi 1999) carry ing out water
interventions in Kilui District found out that water availability had an impact on the
tommuniiy well being, agriculture and on the environment They started their project
with provision of water in schools through shallow wells and ruin water storage. Later
they moved on to develop sand dams which they found would help maintain steady water
level for long and hence improve the availability o f water in the community. To collect
the report of their interventions, they relied on people's evaluation of the project and
collected their comments to gather the findings. I he women reported that they did not
have to queue for water or travel long distances in search of water. They saved time and
energy which they diverted to Other activities such as terracing their land. The girls were
not withdrawn from school to go and assist the parents to fetch water. Other women
noted the impact of the project on health as the risks of pollution were reduced. It was
also noted that tree nurseries were established near the sand dams and seedlings were
available for transplanting. The time saved was used in terracing their land and this lead
to conservation of rainfall which improved the production of their main food crops. I he
people were also engaged in production of vegetables near the sand dams and this
provided income and improved their nutrition.
12

I he study by Sasol and Maji na Ufanisi presents the situation on the ground in Kitui and
ho" water can help improve the situation and enable the people to live better lives. The
study used qualitative methods and relied on comments o f the beneficiaries. I he study
could have some bias os it was done by the same NGOs implementing the project. They
n1>o lacked a criterion o f selecting their respondents and didn’t have specific instrument
to collect the findings. Their findings were useful to this study us they helped in analysing
the benefits o f improved water provision to the beneficiaries. It will also help assess
activities being done with the provision of water and how the time saved is being used by
the households. The study carried out in MutilO Division differs in that it was done by an
independent person for academic purposes. Both qualitative and quantitative data were
obtained using questionnaires administered to household heads from a sample randomly
selected and from key informants.
A study carried out by BG Associates on Kenya Sweden Rural Water Supply (2002),
mennt to provide in-depth analy tical results o f SI DA activities in water provision
covering July 1995 to June 2000; showed that water projects do help improve water
access and greatly reduce incidences o f water related illnesses. They used both qualitative
and quantitative methodologies. The data was gathered using desk smdy, discussion with
key informants and rapid impact assessment through household surveys and focus group
discussions. The study covered the entire programme funded by SIDA in both the
highlands and in the semi arid areas.
One of the case studies done by BG Associates covered Tharaka Division in Eastern
Province which is a semi arid area where SIDA had started Tharaka Water and Sanitation
Project. They found that water projects improved water provision in the area. The project
provided piped water supply, borehole and roof catchments. They interviewed 67
household heuds and found out that most people obtained water from the piped water
system and the river followed by community borehole with surface pump while very few
people owned a private well. They found that the average distance covered to get to the
water source was 2300m and average time covered to get to the water source was 118.-I
13

min. Most people felt that the water was of good quality. Majority felt satisfied with the
water project and felt it helped in reduction of water borne diseases. Very few people felt
that water project helped them engage in income generating activities. In assessing the
diseases most prevalent in the area, they found the following water related diseases to be
the most prevalent in the area: Malaria, Amoeba/dysentery and typhoid.
f rom the focus group discussions, BG associates (2002) gathered that the people of
Tharaka Division were well prepared to take up die project. The groups also noted the
benefits accrued from the project among them being reduction of distance to water point,
availability o f clean and sale water for drinking, water borne diseases especially amoeba
had gone down, women saved fuel to boil the water and had more time to engage in
economic activities. Ihc children were able to attend the night preps and cleanliness in
homes had improved.
Another case study by BG associates (2002) of a SI DA project was done in Kimbulyu
location, Kibwczi Division in Lastcm Province on ‘Umani water supply and sanitation
project’. The findings showed that there was improved water provision with 93% o f the
residents being served by piped water supply. The distance to the water point was
reduced to 88m and average time taken was 31.8minitc$. Majority felt that the water was
of good quality and this led to reduction in water born diseases and they saw the need to
pay for the water. They noted that women were able to participate equally with men in
development activities as u result of gender empowerment within the project areas.
Ihcsc case studies covered broad areas from the wav the project was conceived,
community participation and household benefits from the water project. The project had
the resources from both S1DA and the Kenyan government and hence had a large
coverage urea and impacted on more people. This was significant in this study as it used
similar methodologies to collect and analyse the data only that the study was more
quuntitutivc while this study applied both the qualitative and quantitative methods. I hc
studies by BG Associates also measured variables such as distance, time, and reduction
of water borne diseases, income distribution and availability of time to engage in other
14
productive activities. Ibis study also examines similar variables. The difference is that
the study carried out in Mulito Division focused more on the livelihoods activities that
resulted from water provision and how this had impacted on the people.
Studies have also been carried out in other parts of Africa and in Asia on water access as
water remains a major problem in many countries. Water is seen to be one of the
interventions that can help break, the iniergcncralional poverty experienced especially
among the poor living in marginalised areas. This study will review a few cases on the
contribution of water to livelihoods in other pans o f the world.
A study carried out by Hope and Gowing (2003) in South Africa. Limpopo province
focusing on Luvuvhu catchment found that improved water provision had positive impact
on the livelihoods o f the households. They found that improved water provision is
positively associated with wealth and the distance to the water point falls with wealth.
They focused on the role that water plays in harvesting natural resources to capture the
inputs that water makes on livelihood. Six areas significant to the livelihoods of the
people were identified: water collection, livestock, non-edible forest product, edible
forest product, dry land agricultural fields and kitchen gardens. The data indicated that
women under 30 years o f age were the main collectors of water. On average two people
per household collected water taking 124 minutes per day. I he kitchen gardens were
found to he important as a rural livelihood strategy mainly in expenditure-saving. Water
collection was found not to be economically viable lor any group in terms of financial
inputs and opportunity cost on labour. This study was useful in assessing the implication
o f water to livelihoods in Mutito Division especially in examining the significant
livelihoods activities in the area, if the distance to the water point is dependent on wealth
and assessing who arc involved in water collection.
A study carried out in Amhara region of Ethiopia by DUD. (2001) revealed that access to
and use o f water is influenced by access to a wide range of household assets e.g. access to
labour and animals for collecting the water; money to purchase water, social capital for
securing customary rights to non-communal sources, or small irrigation schemes;
15

knowledge of alternative sources ns well as by physical access barriers to the water itself.
The household assets arc related to the water resource characteristic in terms of
reliability, quality, and yield, source as well as terrain of the lund, the distance to the
water point and the lime spent for queuing. Ihis study showed that households with
limited assets, and with limited physical access to reliable water sources and resources,
are the most water insecure. This study was useful in that it linked water access and use
to other factors such as assets, water resource characteristic and distance to the water
point. The study showed that poor household were more water insecure. The study also
focused on households as the unit of analysis and this study also focused on households.
11iis will be useful in this study in assessing how water access and use relate to other
factors such us food security, and how this influences livelihood asset especially for the
poor.
A study carried out in India by James et at. (2002) showed that in Gujarat. India,
improved water supply brought significant improvements on income. It helped save the
time which was combined with promotion of handicraft-based rural enterprises. Ihe
handicraft enterprises didn't significantly depend upon making productive use of
domestic water but better supply enhanced productivity through time savings. The project
illustrated not really the utility benefit o f water but the important message is that just
providing the utility was on its own less effective than doing so in conjunction with a
programme that supported the women in making use of the time saved. Ihis study aimed
at establishing whether water provision was enough or there is need to create other
activities to be done during the time used to collect the water. This study was useful in
tins study as it enabled the study to examine how the people o f Mutito Division were
using the time saved in a productive manner and what activities they engaged in during that time.
I6

2.2 C o n cep tu a l F ram ew ork
2.2.1 The conceptual link between wator resources accoss and livelihoods.
The mlc that water plays in livelihoods activities in the rural areas is manifold: health,
agriculture, domestic use. livestock, ceremonial etc. With land, it can be argued that
water is the most critical input into a sustainable livelihood in Africa (Moriarly and
Buttcrworth, 2003, Save the Sand project. 2003). Rural non-farm incomes arc
increasingly being recognised as being a key component in the livelihoods o f the poor
people. The actual impacts on poverty might be achieved by promoting productive uses
o f water but this will clearly depend on how other constraints faced by poor people are
addressed and by targeting o f water supply improvements. Some ol these constraints
include: availability o f labour, skills, infrastructure, equipment, lack of knowledge of
markets for products and services, transport and quality control standards. Water supply
projects can and should broaden peoples' focus to address some of these other
Constraints (Hope and Cowing, 2003).
Water provision plays a wider role in poverty reduction and improving livelihoods.
Improved domestic water supplies and improved institutions surrounding them bring
multiple benefits to the people. These include: reduced sickness, saving time for other
productive uses, income generation, and enhanced food security, strengthening of local
organisations and building cooperation between people. In rural areas, water resources
are seen as productive asset for the poor and an economic good, which, cun he combined
with other assets to generate financial and non-finuncial livelihood benefits (Nicol. 2000).
I ivelihood perspective has helped to draw out the relationship between water and food
security which is a concern especially in semi arid areas. It helps to look at how water is
combined with other assets to generate income e.g. watering livestock, small-scale
irrigation which can help improve food security and generate income for other activities.
However, there is greater integration of water supply activities with other aspects of
sustainable livelihoods, such as education provision, livestock production and small-scale
household cultivation and income-generation interventions (hup wwv !uc!ih.~ >d-.«-i )̂.
17

Adequate supply o f water improves the prospects o f new livelihood activities which act
as a key step out of poverty. It allows people to diversify their livelihood activities and
allows the children to benefit from education opportunities and eventually make a
transition from agriculture to more profitable activities.
2.2.2 Analytical Framework
The framework shows how improved water provision affects the livelihoods of the
people. The framework shows how improved water provision impacts on the distance, the
time, the cost and quantity of water accessed by a household. This in turn has implication
on the livelihood activities that a household can engage in The framework will help
examine the following variables: time taken to collect water: the quantities of water
consumed; die distance covered to get to the water point; cost o f water; other factors
improving the livelihood: agricultural activities practiced in the area, micro enterprises;
the episodes o f water related illnesses; ability to be food secure and ability to educate the
children.
Figure 2.1 Analytical framework on how wator impacts on livelihoods
Source: Own illustration

Water access is central to household daily activity nnd survival. Improved water
provision refers to the various sources o f water provided in the urea. This was assessed
in terms of its effects on the distance covered, the time taken to collect it. quantity and
the cost of water. The area will have un improved provision o f water if it will be reflected
in this factors. This factors determine how water is going to be used in the household. If
the distance covered to get to the water point is too far. then the household is likely to
engage most of the household labour in water collection. Distance goes hand in hand
with time so that most o f the the time will be spent to collect the water if the distance is
far and more time will be saved if the distance is near. The quantity of water available for
the household to use from a given water source will have an effect on what activities that
they can engage in with the water. The cost of water is also very relevant to a household.
If the water is made available at a cost, the consumption per household will be
determined by their income level. The quality is also important bacausc if the water
provided is of good quality and at a reasonable distance, the household will consume
good quality water and hence avoid frequent illnesses that impede their productivity.
The distance, time, cost quantity o f water available from the improved w ater provision if
favourable will lead to improved livelihood strategics for the people living in the area. If
the water is available to the household at a reasonable distance, the household is likely to
collect the right quantity lor domestic use and for other activities. The cost of water has
implication on how much water the household can access in the household and how they
use it in productive activities, f or any livelihood activity that they engage in, it must be
percievcd to be economically viable and he able to cover die cost of water, these factors
are interrelated and will influence peoples’ engagement in livelihood activities, improved
livelihood strategies include activities such as: farming activities like kitchen gardens,
growing vegetables for sale among others; livestock keeping; micro cntcrprices such as
small scale businesses, beer brewing, brickmaking, hotel among others. Other factors
such us being involved in wage labour, receiving remitances, food security and their
perception of their class also helps people improve their livelihood strategics and their
quality of life. Improved livelihood strategics increase the income of the household
through the sale of their products, it improves their food security, consumption pattern.
19

health and ability to educate their children. 'I his leads to reduction o f poverty as the
people will be able to improve their living condition.
Once the household has improved its livelihood strategies by performing better the
activities that they were previously engaging in before there was an improved water
provision, they will he able to move out of poverty by being able to meet their basic
needs. This will be a-flectcd in their ability to acquire daily meal for the household and to
afford a balanced diet for better health. Improved livelihoods will also be reflected in the
health o f the household. This will be assessed in terms o f the household ability to afford
medical treatment and occurrence o f water related illnesses. It will also be reflected in the
household ability to afford to educate their children beyond the primary level, he
research will analyse these factors and find out how improved livelihood activities impact
on the people.

CHAPTER THREE
3.0 M ETHODOLOGY
Hiis chapter describes the study area, sampling process, data collection techniques and
how the data was analysed. It also describes the challenges laced during the licld work.
3.1 The site description
Mutito Division is under Kitui District and covers an area of 614.45km5. The climate in
this region is arid and semi arid with erratic and unreliable rainfall whose reliability is
rated at 40% (Kenya Republic of, 2001). Due to limited rainfall and lack ol permanent
rivers, the surface water sources are scarce and dry up during the dry season. There arc
few dams and springs some of which also dry up during the prolonged dry season.
Underground water supplements these other sources though there are few boreholes. The
area is said to be endowed with minerals that ure yet to be fully exploited. The
government is supporting the attempts to search for coal in the area. Mutito Division has
three locations namely: Mutito, Nzombe and Kaliku and twelve sub locations. The area
experiences frequent droughts making food and water the major challenges that the
people encounter. The division lacks basic infrastructure such as electricity and feeder
roads to the interior parts hindering development o f other basic infrastructures such as
hospitals and learning institutions.
3.2 Sampling size and procedure
l he sample size was drawn from the entire division. The study sampled one sub location
from each location, The Sub-locations were randomly sampled by writing the names o f
the Sub-locutions in each location on pieces of paper. 1 he pieces of paper were then
folded and placed in three containers, one for each location. One paper was randomly
picked from each container. The study sampled Malatani Sub-location in Nzombe
Locution. Kawala Sub-location in Kaliku Location and Kitoo Sub-location in Mutito location.
21

The sample size was arrived at by gening the entire population statistics which had been
projected to be 29,101 by year 2008 (Kenya Republic of, 2001). Ihe total population was
then divided by the estimated average size o f each household which was 8 to get an
estimate of 3638 households. Since the area had 12 sub locations, the estimated
household were divided with the uveruge number o f households in each sub-location and
came up with 303 households in each sub-location. The study worked with 10% o f the
household in each sub-locution adding up to a sample size o f 90 from die three sampled
sub-locations. I he study intended to pick every 10u‘ homestead but this was only possible
in MaJatani sub-location us it had feeder roads to get to the homes and the homes were
not so sparsely distributed. For the Kitoo and Kuwulu sub-locations this was difficult for
the researcher due to poor transport network and it was not easy to find the household
heads in their houses. Due the drought diut the area was experiencing, most o f the
households were getting relict Food and were engaged in food for work programme. The
researcher then moved to the areas where they were working and sampled two household
heads from each village within llie sub-loealion. To ensure that the study didn’t end up
with people from the same social economic class, the study picked 23 households from
the food for work und sampled 7 other households from among those who were not in
food for work program. The studs also purposively sampled four key informants based
on their know ledge of water issues in the area.
3.3 Data Sources and collection techniques
Ihe data was collected from both primary and secondary sources. The primary data
included structured questionnaires administered to household heads, key informants
interviews and observation Ihe secondary data was from books, journal articles and
other publications in the internet. This provided useful information to ground the study
and understand the problem better and provided useful case studies of similar studies carried out in other areas.
22

The data examined various variables among them the household source o f wilier, whether
water access was a problem, the cost o f water, the distance and time spent in water
collection, the quantity o f water spent, the livelihood activities in the area, water borne
diseases in the area and the household ability to meet the basic needs like food and
education of their children. The primary data was collected using structured
questionnaires administered to household heads and unstructured questionnaires lor lour
key informant interviews. I he household questionnaires were written in English but
administered in Kiswahili and Kitcamba to enable the respondents understand the
information that was being sought. The key informants included the Division Water
Officer, Division Public Health Officer, and Water Technician from AMREF in charge
water projects in the Division and u businessman who has been living in the area for over
5 years. They provided useful information to the study on the sources of water in the
division and the livelihood strategics of the people living in the area. This information
was used to argument the information from other sources.
The following table was useful in relating a research objective with the method used to
collect data. It also showed the various variables that were to be examined to answer each
of the research objectives.
23

Table 3.1: D^ta Collection Techniques
R esearch Objectives:iT to establish the main sources of water for the residents of Mutito Division.
2. lo analyse the effects of improved water provision on the livelihoods o f the people in the area.
Source: Own Illustration
Method of Data Collection D ata needst . Interviewing household 1. Household source of
heads randomly selected water.using structured 2. Distance to water point.questionnaires. 3. Who collects the water.
2. Observation. •t. Time taken to get water.3. Key informant 5. Quantity of w ater
interviews. collected.6. The cost of water
I. Household interviews 1. Activities that people arewith the experiment and engaged in.control group 2. Quantity of water used in
the activity.2. Interviews with key 3. Contribution of each
informants activity to household•t. Food security.5. Ability to consume daily
meal.3. Observation 6. Occurrence of water
related illness.7. Ability to afford medical
treatment8. Ability to educate children.0. Economic status of the
household.
3.4 Data Analysis
I he field data was gathered using questionnaires which were first cleaned and the
quantitative data was coded. I he data was then entered into the SPSS and run to generate
both descriptive and inferential statistics. Descriptive narration has been used to analyse
data from key informants, observation of the researcher and issues from the household
heads. Descriptive statistics summarised frequencies, percentages, cross tabulation and
chi squire test from the primary data gathered from household heads.
fhc first objective on establishing the main sources of water for the residents of Mutito
Division has been analysed using descriptive narration o f the sources of water that were
found in the area and how the water gels to the household. Frequency distribution tables

and percentiles were used to represent the number of people using the various sources o f
water, the cost and the means of obtaining the water.
Rie second question on how improved water provision affects the livelihoods o f people
in the area has been analysed using descriptive statistics such as. frequency tables, cross
tabulation, bar graphs and pie charts lo represent the activities practiced in the area and
household ability to meet the basic needs in relation to water access. The chi-squire lest
was used to test the hypothesis of the study.
3.5 Definition and Operationalisation of variables of key terms
1 ivelihoods: This refers to a system of economic activities dial people engage in which
allow them to maintain and improve their quality o f life, these activities include both on-
I'arm and non-farm activities which generate income and also provide food security.
Improved W ater Provision: This refers to an access to an adequate amount o f water
from an improved source such as protected spring or well, borehole, rain water collection,
public stand pipe or a household connection (WHO/UNICEF, 2000, Shordl, 2004).
Household: th is refers to a home comprising of parcnt(s) and children who live together
and engage in some activities to earn their living. The activities can be done either in
their farm or they may be activities done outside their farm.
V 'atcr sourer: This refers to a place where water is obtained. The water can be either
trom: rain water, sand dams, boreholes, rock catchment, spring or fountain, shallow well,
water kiosk, tankers or front the river. It provides a point where people can be able to meet their water needs.

3.6 Challenges Faced During Field W ork.
[ here were a number o f challenges experienced while carrying out this study. The area of
study had not received rainfall for the last two years. 1 his led to low underground water
recharge and the area experienced severe drought. This affected the number of livelihood
activities that the people were able to engage in.
The other challenge was the transport as most of the interior places had no roads. The
researcher had to use a motorbike and walk to reach to the home. In household where the
heads were not at home, the researcher had to meet them at their area o f work mainly in
the food for work programme.
The other challenge was language barrier as the researcher was not very conversant with
the local language which is Kikamba. Ihc researcher had to use Kiswahili to interview
those that understood it understood it while a research assistant from the area helped to
interview those who only understood the local language.
20

CHAPTER FOUR
4. 0. Findings and Discussions
4.1 Introduction
This chapter presents and discusses the Findings o f the study in line with meeting the
study objectives. The issues will include sources o f water in the area and how it gets to
the household, the livelihood activities o f the people in the area and the ability of the
household to meet their needs. The results arc presented in frequency tables, cross
tabulations, pie chats, bar graphs and chi square test which arc discussed and related to
other literature done on similar issues bv other scholars.
4.1.1 Background Information of the Respondents
I he study focused on household heads vs ho often happen to be men but ended up w ith
more women than men. The sample had 62% o f the respondents being women and 37.8%
were men. This could l>c explained by the fact that due to drought, most men moved out
to look for employment outside to support their families Sasol and Maji na Ufanisi;
( I W ) had stated that 65% of households were female headed in a research carried out in
Kitui due to lack of industries and job opportunities tor many to support their families.
Njonjo (1997) also posits that due to the traditional African attitudes towards work, men
consider it degrading for them to engage in communal work und opt to move out to look
for salaried employment outside.
Most of those interviewed were married showing that marriage was a value in the
community. Seventy six point seven percent (76.7%) o f those interviewed were married,
o f those interviewed were married, 12.2% single and 10% were widowed while 1.1% of
those interviewed were separated/ divorced. I his shows that most of those married
maintained their marriages (sec the table 4.1).
27

Table 4.1 Percentage distribution of people by their gender and marital status.
Gender Frequency Percent34 .ITS
Female 56 6 2 2
1 * 4 — W 100.0
Status11 12.3
t 2 o 69 76.7'b i* u i< e v tsp ro u te d t 1 1
9 10,0
1**4 90 100.0
SOURCE: Research data. 2009
Most o f those interviewed were in their middle ages from 26 to 40. having a cumulative
percentage of 63.3%. I his shows that the community had young and active generation
who were bringing up their families and have the capability of engaging in different
livelihood activities to sustain their families. The table 4.2 below shows the percentage
distribution of their age groups.
Table 4.2 Frequency distribution showing Ago-groups of respondents.
" H o s ----------------------------F r e q u e n c y P e r c e n t < i i m i l l a i i * * I’e r e e n l
4 4 . 4 4 . 4
2 6 - 3 0 2 0 2 1 2 2 6 . 7
3 1 - 3 5I S 2 0 . 0 4 d .7
1 9 2 1 .1 6 7 . 8
4 1 - U7 7 . 8 7 j i
9 t o o * 5 65 1 - 5 5
3 3 .3 8 1 9
6 6 . 7 9 S .f tA h u v c 6 0
_ 4 4 4 1 0 0 0IO U I
< ( I I O r i i . . . . .LL_______ * > ____________
1 0 0 0
28

4.1.2 Education and Occupation of Respondents
Table 4.3 below shows the percentage distribution according to the level o f education.
Majority of the respondents had formal education even though to a lower level. More
lhan half (58.8%) of the respondents enrolled for primary education. Only 24.5% had
completed secondary school and a few (8.9%) proceeded to college. The situation can be
explained by high levels o f poverty in the area making it not possible for them to afford
high levels of education. Twenty four point four percent (24.4%) were not able to
complete primary school. I here were few secondary schools most o f which had been set
up after 1990's majority of which were boarding schools. The division ulso lacked
institutions for higher learning. However, it had some polytechnics focusing mainly on
tailoring and dressmaking for girls who do not make it to secondary schools. This was a
recent development and thus applied only to a few respondents.
Table 4.3: A Frequency distribution table showing the level of education
Level of education Frequency Percent| None 9 10.0. Primary Incomplete 22 24.41 Primary Complete 31 34.4| Secondary Incomplete 6 6.7[ Secondary Complete 14 15.6
College 8 8.91 olal
e n im n : . d____ u i....90 100.0
I nble 4.4 below shows the occupation of the respondents and their spouses, f ifty percent
(50%) were farmers while 33% o f their spouses were also practicing farming. I his show s
that farming whs the main activity in the area. The findings agrees with what Specimen et
al (2006) found out in a study in Ukumbani that most o f the residents (80.7%) practiced
forming, i louscwork followed w ith 17.8% of those interv iewed and 2 1.1% o f the spouses
being involved in housework. Ihis can be explained by the fact that accessing water was
a problem and most women had to spend most of their time collecting water for the
Also the households had an average o f 7 members and this increased the
29

household work especially feeding ihc family. Sixteen point seven percent (16.7%) of
those interv iewed and 8.9% of their spouses were in small scale business. Very few were
teachers or in formal employment making 7.8% o f those interviewed and 11.2% o f their
spouses. This was due to levels o f education of the people in the area and the fact that
there were few institutions to absorb the people into the formal employment in the urea.
Tablo 4.4: A frequency tablo showing the occupation of the respondents and their spouses.
Occupation Frequency PercentFarmer 45 50.0House wor* 16 17.51Business 15 167 I
r-TMcho. 5 66Formal employment 2 22
“Casual WorVeiu 4 44Other 3 3.3Total 90 100 0
Occupation of Spouses
Farm* 33 367 !Housmvort 19 21.1Business 9 89Teacher 5 56Casual worker 3 3.3Formal employment 5 56Other 1 1.1fVa 16 17.8Tow 100.0SOURCE: Research data. 2009
4 2 Sources of Water In Mutito Division.
This section presents findings related to the first objective of establishing the main
sources of water lor the residents of Mutito Division. Ihc discussion covers the various
S0Urccs o f water, distance and time to get to the winter source, the individual fetching the
*atcr and the mode of carry ing the w ater to the household.
K 30

4.2.1 Sources of Water
Ihc sources of water are important for determining how water will finally be used in the
household. This formed the bases o f the first objective o f the study as it sought to
establish the various sources ol water for the people of Mutito Division. The sources
were looked at in terms o f where the household collected the water and the issues
surrounding its delivery to the household. The studs also used key informants who
provided in-depth information on where the water actually came front to get the
distribution points like the Water Kiosk and the pipes.
Ihc study established that there were attempts by different organizations and government
to improve water provision in the urea. They focused on digging deep wells at the point
where two rivers join and pumping the water to big tanks for redistribution into the water
kiosks and piping to the households and institutions. There were protected shallow wells
mainly at the river banks dug by one organization for organized groups in the community
who own the shallow wells. There were also a few boreholes sunk in the area and the
w ater was pumped into a tank for redistribution. I here were ruin water tanks mainly in
schools to collect water for the schools. Also found in the area were also springs on the
Mutito hills where the water was collected in the dams and then piped to institutions for
the people around the specified radius. There was an earth dam to collect water in Kaliku
Location where the waters were saline making the area not suitable to drill the ground
water. However, these improvements had not reached to all the people and where there
were water kiosks; some could not afford to buy the water. Some areas were still solely-
depending on seasonal rivers, The people had to dig unprotected wells from where they
could scoop the water which was unsafe lor consumption. One also risked falling in the
well in the process of fetching the water. This agrees with Akong’a (1985) where he
noted that during the dry seasons of Kitui, there were very few sources o f water and
people have to scratch riverbeds to get trickles of water.
fable 4.5 below shows where households collected their water, the frequency and
Percentage number of household using the different sources of water in the area. Most
households had mure (han one source of water to meet their water needs. This could b«J
11

attributed to reliability of the source and the cost implication of the source in relation to
its use.
Table 4.5: A frequency distribution table showing the various sources of water for households.
Source of water Frequency PercentRiver 26 28.9Shallow well 4 4.4River and shallow well 28 31.1Water kiosk 4 4.4River and water kiosk 15 16.7Borehole 3 3.3Piped water, river 3 3.3River, shallow well, water kiosk 7 7.8Total 90 ioo.o
SOURCE: Research data. 2009
Table 4.5 above shows that the highest percentage (31.1%) depended on the river and
shallow wells as their source o f water supply. This can be explained by the fact that most
shallow wells were dug just next to » river and hence people used both sources. I hey
used the water from the shallow well mainly for domestic use and from the river lor
watering their livestock. This was followed closely by the river at 28.9% showing that
some areas had not yet experienced any improvement in water provision. River and water
kiosk had 16.5% ol'the sampled households. Water from kiosks was not free and so they
preferred using it for domestic purposes and that from the river for other activities like
watering livestock. Water kiosks were placed approximately three kilometres from each
other though this improvement had not reached some parts o f the division. In areas where
the river was nearer than the water kiosk, the respondents preferred the rivers despite it
being unsafe. Macdonall (2003) had noted that when the clean water source is tar. the
people will opt to collect surface water than walk to a far distance. This was the case in
Mutito Division os found in this study.
Improved water provision varied within the different Locations in the Division. This can
explained by the fact that some of the areas especially Kaliku Location, the water was
’ghly saline hindering development of underground water. Poor development o f
32

infrastructure especially roads also made it difficult to access the urea. Mulito Location
lacked water kiosks as the area had for a long time depended on springs catchments from
the hills for water provision. However, this covered mainly institutions like schools and
Divisional Head Quarters anJ those living within these surroundings. Unfortunately,
human encroachment to the hills and prolonged dry season had left most o f the springs
dry making people depend on seasonul rivers.
The table 4.6 below shows a cross tabulation o f the sources o f water for each sampled
sub-location.
Table 4.6: Cross tabulation of sub locations and source of water.
Sub-location Source of w ater tout
RiwS h a l lo ww i l l
R m * u n J
llu illu w w i l l
waftJuwi
K i v c i a n d
w i l d h iw d i
l * « l l VKWlt,
K » « f
W v » f , l lm lk iw
WCU. W *CT kK vjk
Malatani * : ) 2 1 0 > 10Kawala 10 0
2
* 1 H 0 0 1Kitoo 14 1 0 0 0 ) 1
_______d
| Total 26 * 2* J 15 5 7 _ _ 22JSOIJRCE: Research data. 2009
The table 4.6 above shows kitoo and Kawala as areas with the highest number o f people
depending on the river for their water. Malatani had the highest number o f people
depending on the river and shallow wells. This could be explained by the fact that one of
the NCiOs (AMREF) working on water provision in the division had its base in the Sub-
location and die rivers in the location were big w ith clean water making it possible for
them to develop shallow wells for many established groups in the area. Kawala Sub
location had the highest number o f people depending on the river and water kiosks. I his
was because most of the rivers in that area were saline and water kiosks provided clean
water. Most o f the rivers in this area were small and seasonal making people wait for
many hours lor it to recharge. However, they still used the river to Iced their livestock
which helped cut down on the cost of watering livestock. Very few people (3) sourced for
water from the borehole. This can be explained by the fact that there were tew boreholes
sunk in the area and the water from the borehole was not well distributed to the tanks lor
redistribution. Much still needed to be done to pipe the water to different areas. There
33

was also fear in organizations to sink boreholes in the area as some o f them turned out to
be saline and others lacked water. The government with assistance from JICA had sunk 3
boreholes in the area and only one had clean water, though not been properly distributed.
The springs were identified among the sources o f water but they did not seem to have
much influence on the interviewed household as the water was piped mainly to the
institutions and the household around them. According to Divisional Water Officer there
were three springs in Mutito hills; Ngulini springs which covered a radius of 5 km.
Muthua springs covering a radius o f 2 km and N/aa springs which covered Mutito Boys
and Mutito fiirls secondary schools and the Catholic Mission in the area. I lencc. very few
people in Mutito Location were able to access piped water from the springs Water tanks
for rain harvesting were meant mainly for schools but lack of rains had left them dry and
schools had to source for water elsewhere.
4.2.2 PROBLEMS OF WATER ACCESS
Most of the respondents (83.3%) felt that accessing water in the area was a problem while
only 16.7% felt that it was no longer a problem. Table 4.7 below shows the number o f
people and what they perceived to he the problem with accessing water from their
sources. I he main problem noted was the source drying up. Ibis could be attributed to
the fact that die area only had seasonal rivers and prolonged drought had left the sources
with no water recharge. Distance to the water point was also a problem with most people
having to walk over 2 km to get to the water point and still spend more time queuing for
the water. This was wav above the recommended distance o f 1 km to the water points in
the rural areas. Others sited salinity of the water as a major problem, l ew respondents felt
that buying water was a problem unless those who had to travel far and still buy the
water. This contradicted the results by BG Associates (2002) on Thuraku Division where
60% o f their sampled population felt that they should not pay for the water. These
showed that due to severity o f water problem, the residents o f Mutito were w illing to pay
for the water if only they could access it. The respondents understood why the cost had to
be introduced and bearing it did not matter as long as they got the water
34

Table 4.7: A Cross tabulation whether water access Is a problem and what makes it a problem.
Is w ater access a problem W hat makes it a problem Total
a does >!P
l a it dries up sold
itsfar
its far, sold
far.dries
dirty.does
saltyfar rYa
Yes 29 1 4 13 13 10 1 4 0 75"No o. _ o 0 0J 0 ____ 0
’0 .6 0 10
! Total 29 1 4 L j t i —!1 . 4 « J L oojSOURCL: Research data. 2009
figure 4.1 below represents the different sources o f water and the frequency of
respondents' response us to whether water access was a problem or noL Those who
obtained their water from the river fell that water access was really a problem as the
rivers were seasonal and scooping water on the sand was difficult. Those using piped
water and the river also said that water access was a pioblem despite it being so near to
them. I his w as because the source of the tapped water especially from the springs was
drying up and hence they were going lor many days without water. The shallow wells
were still found to be a problem because despite ensuring that people could access
protected water, it did not reduce the distance covered. Some of the respondents
collecting water from the water kiosks felt that water access was still a problem as some
had to walk long distances to get to the water kiosk and needed money to buy the water
which was a challenge for many to get. Those that obtained water from a borehole felt
that water access was not a problem. This is because the boreholes were not dying up and
always had water This could be an indication that boreholes could be more reliable as
sources of water.
35

Figure 4.1: Bar graph showing the problems of w ater access
_ W lW k M »Source of water
SOURCE: Research data. 2009
Queuing for the water was seen to be one o f the major problems o f water access for many
people in the area. This was mainly because water was available in little quantities and in
some areas they had to wait for the water to recharge. Other water points had many
people waiting to obtain the water from one source. litis mainly affected the areas where
there was little improvement in water provision. The table 4.8 below shows the sampled
Sub-locations and the time that was spent queuing for water. The table shows that the
residents Malulani sub-location spent the least time queuing for water. I his was because
there were more people more with protected shallow wells and water kiosks which were
distributed 2 km apart This agrees with what Sasol and Maji na I fanisi (1999) after
implementing their water project found that women who were the main people used in
household water collection did not have to spend long hours queuing to obtain water.
36

However, those in Kitoo and Kawala sub-locations spent long hours queuing for the
water. This was mainly because they depended on rivers which dried up and hence the
residents had to dig dipper and wait lor the water to recharge for them to scoop the water.
The water kiosks were also few and serving a wider area making people take more time
queuing for this essential commodity.
Table 4.S: Cross-tabulation of sub locutions and lime spent queuing for the w aterSublocution Mow long do you lake queuing for the w aler Total
lamthan30mln
30-40mm
40-SOmln
50-COmm
60-BOimi
80-100m.n
100-12Cmin
motothan120min iVa
MaW*r.l e 9 1 7 0 0 1 1 5 3o1Kawala 1 1 2 6 3 2 4 8 3 30Kitoo t 8 0 3 5 2 5 6 0
Total 8 18 3 16 8 4 10 15 8 90 [SOURCE: Research data. 2000
4.2.3 Cost of Water
Table 4.0 below presents the frequencies and number of respondents buying water from
different sources.
I able 4.9: Cross-tabulation table of sub-location and where they bought the water from
Sub-location iloyoiI Wtfet kiosk
buy water TotalWo«*r vendors Piped wator , Borahoia n/« ~ 1
Malatani r 9 4 0 3 !4 30_Kawala 17 5 0 0 8 30Krtoo 1 6 3 4 16 30
total 1 27 15 3 7 38 OOSOURCE: Research data. 2009
Most of the residents who depended on the water projects paid for the water. However,
those that depended on community shallow wells did not pay. At times, some had to get
water from the kiosks as the rivers dried up. Some respondents lacked funds to buy the
water. Thirty four point four percent (34.4%) o f the respondents bought water. 22.2%
bought the water sometimes while 43.3% did not buy the water and obtained it for free.
37
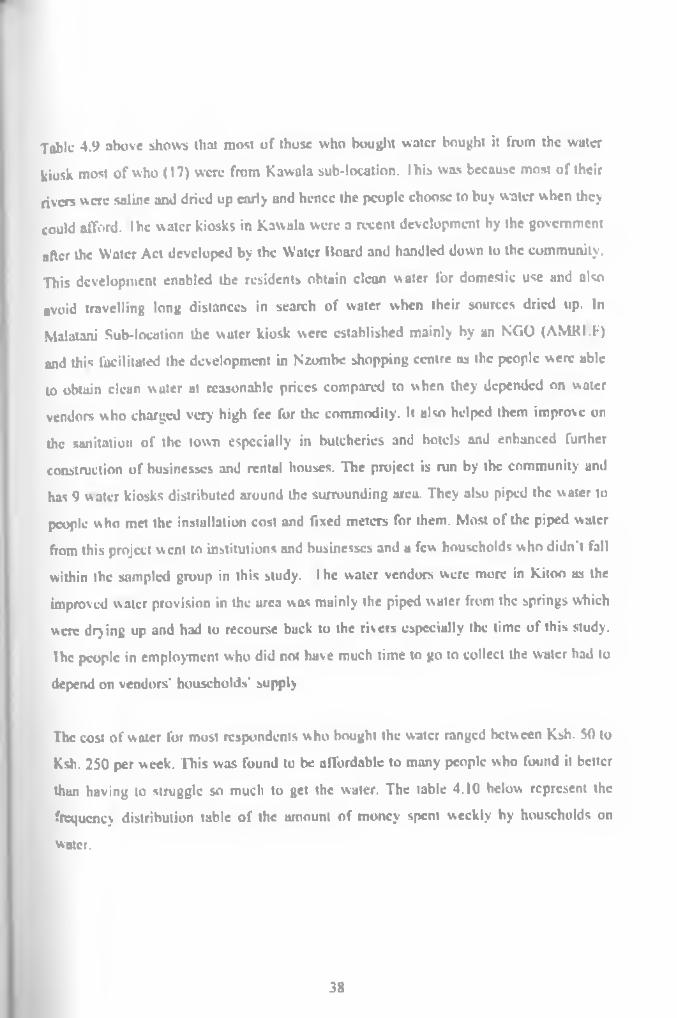
Tabic 4.9 above shows that most o f those who bought water bought it from the water
kiosk most o f who (17) were from Kawala sub-location. I his was because most of their
rivers were saline and dried up early and hence the people choose to buy water when they
could afford. I he water kiosks in Kawala were a recent development by the government
after the Water Act developed by the Water Board and bandied down to the community.
This development enabled the residents obtain clean water for domestic use and also
avoid travelling long distances in search of water when their sources dried up. In
Malatani Sub-location the water kiosk were established mainly by an NGO (AMRI.F)
and this facilitated the development in Nzombe shopping centre as the people were able
to obtain clean water ut reasonable prices compared to when they depended on water
vendors who charged very high fee for the commodity. It also helped them improve on
the sanitation of the town especially in butcheries and hotels and enhanced further
construction o f businesses and rental houses. The project is run by the community and
has 9 water kiosks distributed around the surrounding area. They also piped the water to
people who met the installation cost and fixed meters for them. Most o f the piped water
from this project went to institutions and businesses and a few households who didn't fall
within the sampled group in this study. I he water vendors were more in kitoo us the
improved water provision in the area was mainly the piped water from the springs which
were dry ing up and had to recourse back to the rivers especially the time of this study.
I he people in employment who did not have much time to go to collect the water had to
depend on vendors' households' supply
The cost o f water for most respondents who bought the water ranged between Ksh. 50 to
Ksh. 250 per week. This was found to be affordable to many people who found it better
than having to struggle so much to get the water. The table 4.10 below represent the
frequency distribution table o f the amount of money spent weekly by households on
water.
38

Tabic 4.10: Frequency distribution table of the percentages of respondents and amount of money spent weekly on water.
Amount Frequency PercentL*bs than Kin 50 e 67"k*h.51-150 23 256Tc«h.151-250 15 16.7~Kth251-350 •1 4 4' Ksh 351-450 2 22" K5h 451 -550 1 11rVa 39 43 3Total B0 100 0
SOURCE: Research data, 2000
4.2.4 Ownership of a Private Water Source
Most respondents of Mutilo did not own private water source as shown in table 4.11
below. Only 15.6% owned a private water source as compared to 84.4% who did not own
a private water source. Still out o f those who owned a private water source, 8.9% owned
unprotected shallow wells, which were dug at the rivers but they had exclusive rights to
use them but onee it rained, this wells were filled up with sand Only 1.1% owned a rain
water reservoir because they were not considered to be viable as the rains were less
frequent. Most water tanks in the area were constructed in schools. Majority o f the
respondents depended on community sources of w ater.
Table 4.11: Frequency distribution table of the percentage number of respondents owning private water source.
Source Frequency Percent.Protected shallow well 5 5.6.Unprotected shallow well 8 8.9Rainwater reservoir 1 1 1
jv 'a 76 84.4.Total 90 100.0
39

4.2.5 Distance to the W ater Point
The distance to the water point varied with the source. The river was the most common
source o f water for most o f the residents though few o f them happened to live near the
source. Only 7 respondents walked the recommended distance o f 1 km to get to the river.
The rest walked more than one kilometre showing that more developments were needed
to enable the residents obtain water ut reasonable distances. The table 4.12 below shows
the number o f respondents and the distance they cover to get to the water point. More
than half o f those interviewed covered more than 2.5 km indicating that the rivers were
few and hence far from most residents in the area, kawala sub-location wus the worst hit
und most o f the respondents had to w alk long distances. I his can be explained by the fact
that little has been done in the area to improve on water provision and the people rely on
water kiosks to obtain water for domestic use hut still go to the river to obtain water for
their animals to cut on the cost, litis was similar to what Speeiman et al (2006) found in
their study in Makueni and Machakos Districts whereby they found that their respondents
walked between 50 in to 7 km to get to the water point. I
Table 4.12: A Cross- tabulation of sab locations ami the distance covered to get to the river.
Sub-location Distance to the riverlesstnan200m
2C0nv1km 1-1 Skm 1 6-2km 2-2 5km 2 5-3km
3-4km
4-Gkm
Above•
Mataani 0 5. 4 4 . 1 2 3 3 :Kavrjia 1 0 1 3 2j 2 3 7Kitoo o '1 5 7 3 1 4 S 3Total 1 6 to 14 S L 14 9 11 12
SOURCL: Research data. 2009
I able 4.13 on the Sub-locations and the distance to the shallow well and to the water
kiosk showed that only 18 and 11 respondents respectively covered the recommended
distance to get to the water source. The shallow wells were dug at the river banks hence
people covered (he same distance to obtain water from them. It was only in Malalani Sub
location where they had managed to place water kiosks 2 km apart and hence only two
respondents walked for long distance to get to the water kiosk when their sources dried
40

up. Kitoo Sub-location remained with tew water kiosk and few shallow wells. This could
t>c attributed to the fact that it falls within the divisional headquarters and most ol' the
water improvement initiated in the area mainly from the springs is piped to institutions in
ihc area, l his could be contributing to human encroachment of die hills so as to obtain
water and start livelihood activities to meet their needs.
Table 4.13: A cross tabulation of sub location and distance to the shallow well
Sub-location Distance to the shallow well1km- 1.5- 2km- 2.5km 3km- 4km- Above
20Om-ikm 1.5km 2km 2.5km -3km 4km Ikm 5km iVaMaiaumi s 7 3 i I _ L 1 1 0 11 IKflwala 0 1 1 2 3 4 0 0 1 19Kite* " 1 A 2 1 0 0 2 i 1 19Totdt 6 121 7 5 5 1 ____*1 2 49
Distance to the water kiosklessthan 200m- 1- 1.5- 2- 2.5- 3- Above
200m 1km 1 5km 2km 2 5km 3km 4 km 4-5km 5km ni'aMatatani 3 2 1 1 0 O1 0 ! 0 2 21Kawata 0 2 3 2 '.I. 2 . 2 3 2 13KJloo 0 1 0 0 1 .0 0 o 29 ITotal 4 4 | 3 1 1 1 3 ____ U 3 4 63 |SOURCE: Research data. 200‘>
4.2.6 Time Saved from Water Collection
Some areas had experienced improvement in water provision and this helped save the
time that they previously spent looking for the water. Though the river was a
predominant source o f water, most people felt there was still an improvement in water
provision. Those that still depended on the river said that the organizations which had
come in the area had made them aware that by digging deeper in the river; they could get
tlie water and avoid walking for long distances to the bigger rivers where water could still
be found. Previously they acknowledged that they lacked this awareness and once they
couldn’t gel the water near the surface, they had to travel long distances in search of
water, fifty four point four percent (54.4%) o f the respondents fell that they saved the
time that they previously used looking for water while 45.6% felt that they were still
struggling to get water and hence did not save the lime that they spent in water collection.
41

figure 4.2 below shows the source of water and the respondents view as to whether they
saved the time that they previously used to collect water. Despite the fact that most o f the
shallow wells are sunk, just next to the river, they were seen to save time because it
enabled the people to always get water without having to wait for it to recharge as was
the case with the rivers. Water kiosks also enabled the people to save the time that they
previously used looking for the water. The same was true with the borehole and piped
water. I lovvcvcr. even with the improved water provision, some people felt that the water
provided did not help them to save on time. This is because most people combined the
sources and still went to the river either cut down on cost or because the sources were
unreliable us they dried up.
figure 4.2: Bar graph showing the souree of water and the whether there was time saved that was previously used to collcet the water.
AW
Key□ Yes
□ No
SOURCE OF WATER
SOURCE: Research data. 2009
In cases where there was an alternative source of water other than the river most
respondents said that they used the time saved to engage in other activities, these
activities included working on their farm 21.1%, domestic chores 33.3%, grazing their
animals 5.6%. resting 8.9%. doing casual work 13.3% and doing business 11.1%. I Iris
42

shows that the time saved was used for different activities but domestic chores took the
highest percentage 33.3%. This agrees with what James ct al (1992) found out in n study
carried out in India that there is need to provide an alternative activity to be done after an
improvement in water access to ensure that the time saved is used in productively
4.2.6 Wator Collodion.
Table 4.1-1 below shows that water was collected by women mainly the mother and the
girls. This was because the women in the African tradition bad the responsibility of
undertaking all the household chores and issues of water collection were pan o f the
chores. Hope and (.lowing (2003) came up with similar findings in South Africa where
they found that young women were involved in collecting water. Black (2004) also
described the task o f collecting water to invariably fall on women who have to walk long
distances to collect it. The study showed that men and boys were involved only in few
cases and also few were able to afford a hired worker to assist in water collection. In the
few cases where father were involved was mainly in cases where both the mother and the
father are in formal employment and have learnt to share responsibilities. This would
mean that with education, there was change in the perception o f responsibilities as both
men and women did engaged in similar household chores.
Table 4.14: A frequency distribution tabic show who collect water for the household and the percentage of each
W ho co llec t w ater Frequency PercentMother 40 444father mother 2 22
_ Gifts 8 89heed worker 9 10 0mother and girts 19 21 1girts and boys 3 3 3Mother children 7 7 8mother father hired worVer 2 2 2
TotAI 90 100.0SOURCL: Research data. 2009

The study also found out that in most cases. (66.7%) only one member o f the household
was involved in collecting water. This was contrary to a study carried out in South Africa
by Hope and Cowing (2003) where they found that at least two members of a household
were involved in water collection. This was because most people used donkeys which
could carry up to 80 litres o f w ater. Few households hud two or more household members
going to collect water. This was especially so for those who had to carry the water on
their back to get to their homes. The other methods o f ferrying water such as using a
wheelbarrow or using a cart were not as popular to many. This could be because they
require a higher cost o f obtaining them and the fact that they also required more energy
for pushing it hence it is hard to use them over long distances. Table 4.15 below shows
the number of people who collect water per day and the means they use to collect the
water.
Tabic 4.15: A cross tabulation or members of household w ho collect w ater in a day and the means used to carry the water.
Mom bora of a household collecting water Mean* of tarrying walor Total
Carr/ on my
_______________________l—bos*Use a Use a wl«el donkey barro*
Use a donkey, carry on my
backUse a cart *
One 12 42 2 3 0 1 608 5 2 2 1 0 1C
Three 3 3 o 2 0 0 £rva 0 4 1 1 0 0 0Total 21 54 5 8 1 1 DOSOIJUCL: Research data. 2009
4.3 Other Sources of Livelihood
The study found that the residents o f Mutito Division had various sources o f livelihoods.
Some arc directly related to water while others are indirectly linked to water. This study
looked at different activities that were carried out in the area and how water access
influenced them It also focused on how they met their basic needs such us food and
education of the children. The study also looked at how they looked at how they
perceived their income level in relation to where they collected water. This helped to
show the impact that water availability on people's quality of life.
44

4.3.1 Employment
Employment influenced people’s livelihoods as shown in table 4 .16 below. Sixty three
point three percent (63.3%) were involved in some employment while 36.7% were not.
Fifteen point six percent (15.6%) were in formal employment. 24.4% in self employment
and 23.3% in casuul labour. All those who engaged in formal employment felt that most
of their livelihood came from their employment. I his can be explained by the fact that
the area was a hardship area the residents depended more on buying most of their needs.
About half of those in self employment felt that most o f their income was coming from
their activities, litis can explained by the fact that business and self employment was not
always consistent in the market hence sometimes they are able to have a smooth (low but
get affected by the prevailing conditions such as drought. Most o f those on casual work
were getting little of their income was coming from their employment. This was because
casual work was not constant and due to low demand especially during the dry spell and
also very little was paid for the work done. Most o f the casual labour was related to
agricultural activities. This meant that if there was more water, they would Ik* more work
and thus more casual labour needed.
Table 4.16: A Cross tabulation of type of employment engaged in and the proportion of livelihood coming from employment.Proportion of livelihood from employment
Arc you engaged in employment II ves which one
formalemployment
casuallabour
selfemptovmftnt ru'a Total
most of it t4 e 10 30Total 6 10 30
Little o t ,tTotal
11 10 21~]11 10 21
hme cf rt yes 5 1 6rotoi 5 1 C
rvo no 33 33— Total 33 33SOURCE: Research data. 2009
45

4.3.2 Remittances
Another source of livelihood for some o f the residents was the remittances from the
children, relatives or friends. This was an external support mechanism to help the
families to meet their needs. Only 22.2% o f the respondents received remittances while
77.8% did not receive any remittances. Ihis shows that most o f the respondents depended
on their effort to sustain their families. The parents considered the remittances that they
received from their children to he significant. I he relatives also gave a significant
contribution and they had the highest number o f those who were giving remittances. This
show s that the community had good values of having those who are well o f support their
relatives who experience challenges in meeting their needs. Table 4.17 below represents
the marital status of different households and how they received remittances and from
whom. These who were in married status were noted be the only group that received
remittances from their children. This can be attributed to their earlier ability to educate
the children so that they can get a job and be able to support them. The children were also
in n better position to understand the situation for their parents and their siblings. Only
one single person received remittances from the relatives and this could mean that being
single was not well accepted state in the community. The widows and the married
couples received support from their relatives most o f which was focused on educating the
children. The married people arc the main ones who reported to be receiving little
assistance from friends showing they Imd strong social networks than any other category.
46

Table 4.17: A Cross tabulation of marital status ami whether they receiveremittances and from whom.
Source o f remittance Marital status D o you receive remittances Totalno
Children Married ' 7Total 7 7
R e iv e s Single 1 1Married 4 4Widowed 4 4Total 9 9
'Friends Married « 4Total < 4
life Single 10 10Married 54 54Divorcedi'Separated 1 1WkJowW s 5rotol 70 70
SOI ROE: Research dnta. 2009
4.3.3 Food aid
Another source o f livelihood in the area was food aid. Crop failure due to luck of rain had
occasioned drought which had hit many residents and their livestock were also affected.
Though this affected the whole area, not everyone was receiving food aid us the
programme considered those who had more challenges in the society, fable 4.18 below
shows the marital status, whether they received food aid and the proportion of livelihood
which comes from food uid. Since most people in the urea were married, the table shows
they had the highest number of people receiving food aid. I his was especially so with
families which had large family $i?e. Apart from one w idow in the sample, all the other
widows were receiving food aid. This could be a sign that the community supported the
widows and did not want them to suffer. A significant number o f the single people in the
sampled population received food uid showing dial most single people like the widows
were struggling to meet their needs. Thirty six (36) respondents felt that food aid was
only able to provide just a little o f what they needed while 6 respondents felt that most of
their livelihood came from food aid. Thirty lour (34) respondents felt that food aid
contributed very little of their livelihood. This shows that the food aid given was meant to
supplement and enhance what die people have and hence it was not enough to feed the
large family size, bach family received 42 kg of grain every month but they had to gel to
47

jod lor work programme to avoid having it for tree. Availability o f water would provide
solution to the problem o f food insecurity.
fable 4 .IX: A (.'rim tabulation of m arital status and w hether they receive food Aid md the proportion of their livelihood from food Aid.Proportion of livelihood from food ,ld
Marital StatusDo yuu receive food aid Total
1 ■■ i . i — — ___ . nopost Ot It Married S 5
Wtdoweu 1 1Total 0 C
fine of it SmG.e s 5Married 25 25Widowed 6 6Total 3C 38
*ery little of it S^gle 3 3Married 5 5
Divorced'S^rated 1 1Widowed 1 1
Total 10 10Single 3 3Mamed 34 34Widowed 1 1
total 38 38
4.5 HOUSEHOLD INCOME LEVEL
I he study also sought people's view on how they rated their income, this was to
establish whether they considered themselves to be poor, middle class or wealthy hs
shown in table 4.19 below.

Fable 4.19: A Cross tabulation of source of water ami how they rate their income
Source of water How do you rato your Income Totalw e a lt h y WxWe P o o r
R iv e r 0 9 17 2 6
’ shallow well 1 3 0 4’ Kiver and *h»llow wuil 1 19 1 0 30
Water k t o t k 0 4 0 4Riv<K and water Kiosk 1 4 1 0 1SB c r e h o lo 0 3 6 3P ip e d water, river 0 .3 0 . 3R iv e r , s h a llo w w e - ' w a t e r k io s k 0 5 0 5 A
T o t a l 3 50 37 soSOURCE: Research data. 20< 9
Those who purely depended on the rivers had the majority (17) being poor. This was
because they had to spend most o f their time in search o f water and thinking and w orking
for survival with fewer activities to engage in to raise their income. This agrees with what
Brooks, (2002) noted that, 'water scarcity menaces our well-being, jeopardizes our
livelihood, and sometimes endangering our lives’. Those depending on shallow wells
alone felt that they were in the middle and wealthy classes, 3 und I respectively. This was
because most of the shallow wells were privately owned and hence those who had some
resources could be able to dig a private well. The 4 respondents depending purely on
water kiosk were in the middle class as this were people who could afford to purchase the
water for their use. Most of those depending on the river and the shallow wells had most
(19) in the middle class as they were able to engage in more livelihood activities to
alleviate them lroxn poverty. Those depending on the boreholes and piped water and a
combination of shallow well, river and water kiosks were in the middle class as they were
able to pay for the water. Very few respondents (3) rated themselves to be wealthy. This
were mainly those had formal employment and felt they were above the average
members of the community. The source of water did not seem to influence their status.
4.3.4 Food consumption in Mutito division.
The ability of u household to meet its food requirements indicates its well being as food is
the most basic need which cannot be done away with. However, being a semi- arid
49

region, the food is usually bought, donated, harvested after good rains or grown under
irrigation. With water provision, it is expected that many people would be able to grow
ihcir own food but the vvutcr provided in Mutito Division was little for irrigation to take
place. This would make the area to be less reliant on food aid. Most o f it was intended to
provide households with water for domestic use and to help people grow vegetables.
Despite the hiccup, some of the respondents in areas where there was improved water
provision felt that water had helped ease the problem o f food insecurity. Table 4.20
below shows the number of respondents and whether they felt that water availability had
helped them improve their food situation.
Tabic 4.20 A Cross tabulation of how water has eased the problem of food security.
Has water provision eased the problem of food insecurity If yes how Total
have a kitchen qarden
growvegetables
11
easy to get vegetables
hrno to work for
cash
tune to wocV g# t
veoetactes n-'aYes 2 8 13 3 0 37
‘"no 0 0 0 0 0 40 40slightly 0 0 2 1 1 a 13
Total 2 11 10 14 4 49 90
SOUKC F Research data. 2009
Thirtv seven (37) respondents felt that water had helped them improve their food
situation while 13 respondents fell that lluit was slight improvement in water provision.
Forty respondents (40) felt that the water had not helped them improve on their food
security. This was because they were still struggling for the water and whut wits available
was used for domestic purposes. Ihirtccn (13) felt that water availability had helped them
case the problem o f food insecurity b> being able to growing vegetables or having a
kitchen garden, th is helped them to supplement their diet or for sale to gain income to
buy other foodstuff. Others (14) felt that water availability enabled them to have more
time to work to get money to buy food. I his was bccuuse they were able to save the time
that they used to spend looking lor water, fourteen (14) o f them felt that water had made
it easier lor them to obtain vegetables. This was because they were able to buy them from
their neighbours who were able to grow them and at an affordable price.
50

Obtaining a daily meal was a challenge to many households in the area. Seventy percent
(70%) o f those interviewed consented that at times they spent a day without receiving a
meal while only 30% said that they had never missed their meals. This shows that food
availability was still a challenge in the area. Table 4.21 below shows whether household
at limes went without meals and what their daily meal was mainly composed of I
Table 4.21: A cross tabulation of what daily meal is mainly composed of and if a family has gone w ithout meal and If yes how often.
Composition of the dnilv meal
lias your family 2 <>ne without food If yes him often Total
nevofjust cnce o»
tvwcaseveraltunes
manytimes
’'maize Yes 10 4 14Nc 0 1 1 j
Total 10 5 15 1maize, beans Yes 0 2 18 8 28
No 6 0 1 0 7Total 6 2 19 8 35
maize, beans, vegetables
Yes 0 8 7 2 17No 11 0 0 0 11Total 11 7 7 2 27
maze, beans, vegetable. meat
No e 8Total 6 8
maize peas vegetable
Yes1 1
Total 1 1maize vegetobloa Yes 2 1 y
Total 2 1 3SOURCF: Research data, 2009
I rom tuble 4.21 above, less than half of total the respondents (37) were not able to
consume a balanced meal. For most people, the main source of proteins was plant
proteins. Despite the fact that livestock keeping was their major preoccupation, few
households were able to consume animal proteins. I his was because the livestock kept
were meant for sale and the money obtained was used to meet other family needs. Only
40 households were uhle to regularly consume vegetables. This was because in many
areas they were not able to grow the vegetables and had to source for them outside This
51

was especially so in kuliku Locution and parts o f Mutito Location, the vegetables were
sold at a very high prize as they were sourced from other places. Thirty five (35)
respondents had maize and beans us their inuin food. This was the staple food of the
community and hence it was easily accessible in the market. Most o f the households who
were able to afford a balanced meal hardly went n day without meals. This means they
were had stable income to allord to buy balanced meal for their families. The households
who were not able to afford a balanced diet also faced the challenge o f having an assured
meal everyday. This explains why they couldn't go for a balanced meal as they had to
struggle to have a meal a day to keep them going.
4.8 Education of Children in Mutito Division
The ability to educate the children was also an indicator o f whether there was an
improvement in the area with an improved provision of water. I he focus was drawn to
the ability to take tire children to secondary schools as the government offered free
primary education and the cost for primary schools was relatively low. Table 4.22 below
shows whether the children were taken for secondary school and who paid for them
Table 4.22: Frequency distribution table of w hether the children are taken to secondary school and who pays for their school fees.
I>n you take your children to secondary school Frequency PercentYes 39 43 3No 27 30.0N.'A 2* 20 7
Total 50 1COO
Who pays tor their school feesSelf 27 300Relatives 1 1.1
_ScM sponsor 4 A AS»lf. r l̂otivos 7 7.eNA r>i 56 7Total _ 90 1COOSOURCE: Research data. 2009
52

Though area was a hardship urea, the parents were putting effort to educate their
children. Forty three point three percent (43.3%) o f the respondents were able to take
their children to secondary schools while 30% were not able to take their children beyond
primary' schools. Twenty six point seven percent (26.7%) had their children still in
primary schools and hcncc their ability to educate them through to secondary school and
colleges could not be stated. Most o f those (30%) who were able to take their children to
secondary schools financed their education Seven point eight percent (7.8%) of them
supported their children and were assisted by their relatives, 4.4% were supported by a
sponsor and 1.1% was supported by the relatives. This shows that despite all odds, there
were efforts towards education o f children especially by their parents. Also despite the
area being a hardship area, very little assistance was given to parents in terms of
sponsorship to educate their children.
fable 4.23 below shows where the parents who take their children to secondary school
got the resources from. Those who were in formal employment were able to take their
children to secondary school from their employment. Others still in formal employment
were boosted by the sale o f livestock. Sale o f livestock was contributing greatly to the
education of the children. This was mainly combined with oilier livelihood activities such
as casual labour, sale o f farm produce among others. This shows that livestock were
important assets in facilitating the education of the children. Casual labour made
significant contribution to education o f the children. Those in causal labour were able to
combine their casual labour gains with other resources to manage to pay the school fees,
farm produce especially when they had good rains was contributing capital to educate
their children. Frequent crop failure due to lack o f rains however made it difficult for
many to rely on the farm produce. This shows that with water availability would
contribute greatly to education o f children as people will be able to grow crops, there
would be more opportunities for causal labour and small scale business based on farming
would improve.
53

Table 4.23: A Cross tabulation of whether parents take their children for secondary schools and colleges and who pays for their school Tees ami if they pay how they acquire it
HOW DO YOU ACOUiRE THEiR SCHOOL FEES
DO YOU TAKE YOURCHILOREN TO SECONDARY OR TO COLLEGE IF YES. WHO PAYS FOP THEIR SCHOOL FEES Total
self Relativesself.
sponsor self relatives n/n“Foniial employment yes e l I 8
Total « . 8“Formal employment,
o le or Ivesiockyes 3 | 3
uTi— - Total 3 | 3 ICasual labour sale of westcc*
yos © 3 1 10Total © 3 1 te l
“Casual labour, sale ot livestock, sale of land, farm produce
2 1 3—
Total 2 1 3'Sole livestock, farm
Dfoduce. remittances.ye* 1 3 A
Total 1 3 4JSmall seal# business, casual labour
yes 1 1Total 1 r
Small scale business. M.o livestock, farm produce
yesa 1 5
total 4 1 5 1tv's yos 1 0 1
no 0 27 27rVa 0 24 24Total t 51 52
Harambuo. sulo of farm produce, sale of livestock
yes2 2
Total 2 2Sal# of form produce ye* 1 _JL |
Total 1 i lSOURCE: Research data. 2009
4.10 Other Challenges Experienced in the Area.
Besides the problem of water, there were oilier challenges that the people o f Mutito were
experiencing. Ihe main problem mentioned by most people was the problem of hunger
(89.9%). Most people experienced hunger due to erratic climatic patterns und this
hindered them from engaging in many livelihood activities. Most of the income which
could have been invested or saved for other needs was used to purchase food. There were
54

various suggestions from the respondents on how they fell the problem o f hunger can be
solved as shown in table 4.24 below. I he highest number (41) felt that the problem o f
hunger could be solved through provision o f food aid by government nnd other non
governmental institutions. This was especially the ease In Kawala and Kitoo Sub-location
where water access was still a challenge. In times o f drought, they mainly depended on
food aid and hence felt an increment in food aid would help solve the problem of hunger.
The residents o f Malatani sub-location on the other hand had most the respondents who
felt that provision o f water could help them solve the problem of water. This could be
because they had experienced more efforts toward improvement in water provision and
were able to practically see that they can solve the problem of hunger if they can get
more water from what they were doing with the little water made available to them.
I able 4.24: A cross tabulation of Sub locations and w hether hunger is a challenge and how it can be addressed.
Ways of addressing hungor Sub-location Is hungor a Chollongo TotalYes no
Need food aid Malatani 5 ] 5Kawala 2 l i 21Kitoo H f j ] 15
Total 41 41Need water Malatani 20 20
Kawala 6 6Kitoo 7 7
Total i i 33Need training to improve formlnq
Malatani t 1[ Kawala 2 2
Kitoo 3 3Total 6 6
N,'A Malatani 4 4 IKawala 1 1Kitoo 5 5 ,
j— --- ------- --------- Total L- - 10 10SOURCE: Research data. 2009
Other problems encountered in the area included poor transport network reported by
41.1% of the respondents. I he area had all weather roads and lacked by passes to get to
tlic interior. This hindered their further development hindering even the marketing their
produce and leaving them to be exploited by middlemen. Thirty percent 30% felt that
55

diseases were another challenge in the area. The area lacked enough medical facilities
and had only one public health centre which was far. They felt that the government needs
to set up more health centres and hove a general hospital so that they can avoid taking
their patient to far places like to Kitui or Mutomo for admission. This was leading to
many deaths for those not able to take their patients to those places for further treatment.
Obtaining school lees lor their children was mentioned to be a challenge lacing 26.7% of
the sampled population. This is because most of them depended on fanning and livestock
which were unreliable. They felt that if they could gel sponsorship of their children, most
of them could be able to study with case and later improve their standards o f living. This
shows that the people were still experiencing other challenges that equally needed to be
addressed though some would be solved as the water is provided like being able to take
their children to school, creation o f employment, food security, ability to afford medical
treatment and even others such us roads will be addressed as water projects help build
strong social capital necessary for local development. Hope and Gowing (2003) also
stressed that to effectively fight poverty, other challenges facing the rural areas need to be
addressed and water provision can aide in solving those other problem.
4.4 Effects of Improved Water Provision on Livelihoods
I his section sought to fulfil the second objective o f establishing the effect that water had
on the livelihoods o f the people in Mutito Division. The study sought to establish the
livelihood activities that people engage in and how water provision had enabled the
people improve on their livelihood activities.
4.4.1 Water and livelihoods
Water is essential for the people to engage in different livelihood activities. Water
provides a means through which poverty can be eradicated and a way through which
basic human rights can be guaranteed. Water availability for household use. farming and
other activ itic.s helps people improve their living standard and gives the poor people a
chance to increase their income. It helps them save the time and use it in productive
activities like farming and commerce (Waswa ct ul, 2007). This formed the basis of
56

investigation of this section. The study looked at water availability and the activities that
people are engaged in and how they arc eventually able to meet their basic human rights.
Ihe study established that the people o f Mutito Division engaged in different livelihood
activities. All the households interviewed were engaged in domestic work. Fifty two
point two percent (52.2%) kept cows. 68% kept goats. 26.7% were engaged in kitchen
garden. 10% were engaged in fruit farming, 24.4% were engaged in casual work, 45.6%
were engaged in charcoal burning, 17.8% in brick making. 11.1% in operating a hotel.
13.3% in selling a kiosk. 17.8% in vegetable growing and 95.6% were engaged in food
crops growing when they received the rains. Speelman ct al (2006) in u study carried out
in Ukambani came up with similar findings where 80.7% o f those interviewed in
Makucni and Maehakos District practiced farming. This shows that farming and livestock
keeping are the predominant activities in Ukambani region. Charcoal burning followed
closely especially in Maiatani Sub-location as the transport network was well developed
connecting the division to other parts hence they had market for their charcoal. I his has
negative effects to the environment especially by reducing the forest cover for rain
attraction and leaving the land bare thereby encouraging soil erosion. Though the
residents were aware of this danger, they kept to the practice due to economic hardships
experienced in the area. Ihis agrees with Chambers (1997) view that households engage
in different livelihood activities to meet their needs.
Water was one o f the main resources that facilitated performance of these activities.
Improvements in water provision had enabled 58.9% o f the respondents engage or
improve on their livelihood activities, but 41.1% felt it had not helped them. Those that
didn't feel water had helped them were mainly in the areas where they still relied on the
rivers and water kiosks where they had to pay for the water and this limited their ability
to put it into productive use. T wenty seven point eight percent (27.8%) o f those
interviewed had improved on cattle keeping, 50% on goat keeping. 14.4% on kitchen
garden and vegetable fanning. 11.5% in hotel. 11.1% in brick making. 5.6% in beer
brewing. 8.9% in kiosks and 6.7% had time to engage in casual work.
57

This shows that most people were able to improve on goat keeping than in any other
livelihood ac'ivity. This can be explained by the fact that goats do not require much for
their upkeep in terms o f feeding them and they also consume little amount of water as
shown in table 4.25 below. Cattle keeping followed but it was not as embraced by many
as the goats. This could be due to the cost of a cow and the fact that it consumes more
water and hence, when it is not free, the cost of maintaining a cow goes higher. Most of
those who kept the cows watered them from the source. These study findings were
different from another study finding conducted by Rukurc el al (1991) in Eastern Kajiado
District where they found that the people who lived far away from the water source kept
more cattle than those living near the water source. Ibis was because then: more feed
available for them as they walked to the water source. I his was not the case in Mulito
Division as the community in this region was an agricultural and did not devote much
time grazing the animals unlike the Mutisai who are pastoralisls. Contrary to the findings
in Eastern Kajiado, in Mutito Division, those who lived near the water source kept more
animals.
Table 4.25 below shows the amount o f water taken by goats and cows in each household.
Most of household that kept goats spent 20 litres and 40 litres o f water per day which was
a little amount that was easy to obtain. The goats do not consume more than SO litres
while the cows spent a minimum o f 40 litres. Most of the cows in 18 household were
watered at die river because they consume more water and it was tedious to fetch water
for them This was similar to what De Mruijn and Rhebcrgen, (2006) found in a study
carried out in Kitui that water use rate of livestock was 60 litres per household per day.
They also found that most livestock were watered at the river.
58

Table 4.25: Frequency distribution table shotting the am ount of water spent watering goats and cows.
A m o u n t u f w a t e r
c o n s u m e d Iw g o a ts Frequency Percent101 4 4.4201 26 28.9401 24 26.7
'801 9 10.0Take to the river 8 8.9n/a 19 21.1Total 90 100.0
A m o u n t o f w a t e r c o n s u m e d b v c o w s
40 1 4 4.4601 8 8.9801 4 4.41001 4 4.41201 4 4.41401 8 8.9l ake to the river 18 20.0n/a 40 444Total 90 100.0
SOURCE: Research data. 2009
Other livelihood activities such as fanning o f vegetables, fruits and the kitchen garden
were often done near the water source so that watered their crops by sprinkling mainly by
those people who lived near a water source. This confirms the finding of Save the Sand
project in South Africa (2003) where they found that given the water. 70% o f the people
engaged in fruit farming and 50% in backyard farming. Few households engaged in other
livelihood activities such as brick making, hotel business and butchery.
4.4.2 Water use at household lovol
Most of the water collected from the source and taken to the household was used for
domestic chores. Most of the families used 80 litres o f water per day. Compared to
another study carried out Shallow ct al (2005) in lower Nyando, the water consumption in
Mutito Division was quite low as the amount o f water collected was per household per
day in Lower Nyando during the dry season was 100 litres. The level of water
consumption in most o f the sampled households in Mutito was not to proportional to the
59

family size. This was due to the time spent collecting the water, distance, cost and
available quantity of water at the source that they had to spend to get the water home. I he
table 4.26 below shows the household size and the amount o f water that they consume
per day. Most households arc not able to consume the recommended amount which is 20
litres per person per day.
Table 4.26 Cross tabulation of the total number of family m em bers and the amount of w ater spent in domestic work.
Total num ber offamilN members Amount of water spent In domestic Chores Total
401 60 l 801 1001 1201 1GOI 20013 2 2 2 1 0 0 0 74 3. 0 4 0 1 0 0 85 3 0 3 1 0 0 0 76 3 2 7 2 2 0 0 167 1 2 6 1 0 1 1 12e 3 1 8 0 0 0 0 129 2 1 2 1 2 1 0 910 0 1 5 i 0 0 0 711 0 0 1 1 1 0 0 3"12 0 1 3 0 2 0 0 613 0 0 0 0 1 0 0 114 , ___ o_ 0 0 0 1 0 0 115 0 0 1 0 0 0 0 1
TotalV 10 42 8 10 2 1 SO
4.4.3 Livestock Keeping
Most people felt that water availability helped them to increase the number of livestock
that they kept, l ivestock keeping is a predominant activity in many semi arid areas as so
is in Mutito Division. This is because the area still had common land as the land was yet
to be allocated to individuals and hence the people were able to graze the animals on the
hush land and ulso livestock required less water compared to farming. Hie animal can
also be taken to the water point to take in the water even if the water point is at far
distance. Hence even those that had lacked improved water provision still kept livestock
“ d *1 contributed to their income though they were fewer than those who had improved
NVa'Cr provision as shown in the figure 4.3 below. Those that felt that water provision
60
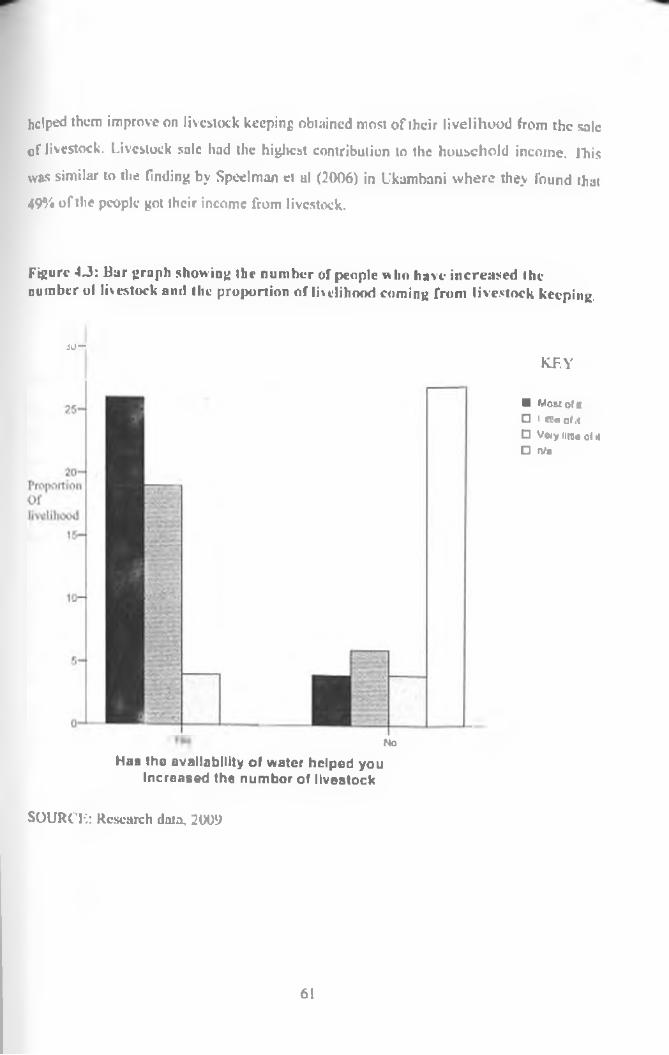
helped them improve on livestock keeping obtained most o f their livelihood from the sale
of livestock. Livestock sale had the highest contribution to the household income, litis
was similar to the finding by Sped man et al (2006) in Ukambani w here they found that
49% of the people got their income from livestock.
Figure 4.3: Bar graph showing the number of people w ho have increased the number ol livestock and the proportion of livelihood coming from livestock keeping.
•20—
N o
Has tho availability of water helped you Increased the number of livestock
KEY
■ Most Of it□ I t t l e o f it
□ Vwylltsoof.1□ n/a
SOURCE: Research data. 2009
61

4.3.4 Crop farming
The study uIm> found out most o f the residents (95%) was engaging in food crop farming.
These depended on rainfall and hence they were only able to plant and harvest if they
received enough rainfall. I able 4.27 below presents the types o f crops grown, the purpose
for which they arc grown and the proportion ol'livclihood that came from crop farming.
Most of the respondents (52.2%) grew food crops for home consumption while 44.4°.i
grew food crops for consumption and lor sale. Maize was the staple food and was grown
by all the respondents. Green grams and traditional crops like sorghum Hnd millet were
also adopted by many. This was because they were was suitable for the area am! they had
a ready market. I lowever. lack o f alternative source o f water hindered the people from
exploiting this potential. If water provision was improved especially also to harvest the
ruin water on the sand dams and on the rocks, the residents would have regular supply of
these crops and ease their problem o f food insecurity.
Table 4.27: Cross tabulation o f the crops grown in the area, the proportion of livelihood and the purpose for which they arc grown.
l*ropoi lion ul IkVfllblHMl from crop (arm in' I’urpmc of the
crop* ( n o n
food Crops jtrnviii
maize, beam, peat
maize, pern. green grant!, traditional
crop*
maize,peas.
pumpkuw
maize.greengram'.
pumpkins n a Totalj n n of n for coosumption 3 5 1 11
for consumption anJ '.lie 2 1 K IItotal 7 0 0 2 2
im k I>f It for CiMi'Umrtinn 2 8 13 9 I tlor consumption
nod sale 2 7 3 13 23
TdUl -1 15 Ih IS 351.iO i Itak ni M for consumption 1 1 5 | ■ s
—
lut uimumptkoo .mil mUc 0 0 2 2 4
Total 1 1 7 3 12tv* 3 3
— Total 3 3
Source: Research data 2009
62

4.4.5 Increase in Income
rhc study also sought to know if improved water provision helped people increase their
income. Fifty three point three percent felt that water availability had helped them
increase their income while 46.7% felt that it had not helped them improve on their
income. 1 his was because in some areas, little had been done for the people to get water
and most o f the efforts towards water provision focused on providing water for domestic
use. The figure 4.4 below presents the different activities that the respondents who felt
that they had helped them improve on their income. Twenty three point three percent
(23.3%) o f those interviewed had increased the number of livestock that they kept, 7.8%
had started grow ing vegetables. 6.7% said that water helped them to have time for other
activities, 5.6% were able to start a business, 6.7% were able to start business and to grow
vegetables at the same lime, 5.6% were able to engage in making bricks and brewing beer
w-hile 44.4% felt that they had not been able in increase income as they were still
struggling to get water. The percentages show that besides livestock keeping, very few
people were able to improve on other livelihood activities. This was because the other
activities required more water and capital in some eases but few were able lo acquire it.
However, despite the fact that the water that was made available was little in quantity,
more than half o f the respondents were able to increase their income. This shows that
with more efforts towards water provision, more people can be able to get this essential
commodity and cun be an effective tool toward poverty reduction. This support the
statement made in World Water Development Report (WWAP. 2003) states that “giving
the poor better access to better managed water can make a big contribution to poverty
eradication". Those who had an improved source o f water especially those who depended
on the river and the shallow wells were able to grow vegetables and have water lor
making bricks. Also with search for water for domestic being cased by the water kiosks,
more people were able to have time to engage in other productive activities and raise
their income.
63

Figure 4.4: Pit* churl showing the activities done which have increased the income and the percentage num ber of respondents in each activity.
KEY
[T| Irxreas* ivestock 23 3%
□ GfCM- vec«taMM7 Bfi Have tmw ter otter
t l i •cttvise* fl 7*£Xj Start a Suimoti 9 0%
Startad buwnoti nr>3 Q vegetable growing 6 7%
r i Make bfk»a ttin-M bee! U 56S,
SOURCE: Research data. 2iX)l>
4.4.6 Involvement In Small Scale Business
The study found that 35.6% of the respondents were involved in small scale business
while 64.4% were not involved in small scale business, fable 4.28 below shows the
frequency and the percentages number of people engages in different businesses, litis
business included selling vegetables at 11.1%, hotel 8.9 %. butchery 2.2%, beer brewing
2.2%, making bricks 7.8%, kiosk 2.2%, and a combination o f selling vegetable, bricks
and local brew had 1.1%. The rest 64.4% who were the majority were not involved in
business. This showed that very few people were able to engage in business. This could
be attributed to many reasons among litem lack of capital, lack o f skills and lack of
commodity for sale. Water was also contributing to less involvement in activities which
64

required much water such as brick making which was very viable activity in the area.
This confirmed what Excellent, an organization working in Kenya, in 2005 found dial the
Kenya's semi-arid areas experience water scarcity which makes them not able to improve
their livelihoods as most o f their time is spent looking for water (Excellent, 2005).
Table 4.28: Frequency table showing the business engaged in and the percentages.
Business engaged in Frequenev PercentSelling vegetables 10 11 1Hotel 6 89 _ IButchery 2 22fry* bfwtnq _ 2 22Making bucks 7 7.6Kiosk 2 22 Ivegetable sale. brick*, iocs) tr+* 1 11
L a 58 6.MTotal 90 100 0
SOURCE: Research data. 2009
4.4.7 Water Borne Diseases
The study also sought to investigate whether improved water provision had helped reduce
the occurrence o f water home diseases. Eighty two point two percent (82.2%) o f those
interviewed suffered from w ater borne diseases while 17.8% of those interv iewed did not
suffer from water borne diseases. The figure 4.5 below shows the source o f water and the
occurrence o f w ater borne diseases.
65

Figure 4.5: Bur graph shows the source of water uml the occurrence o f water borne
diseases.
**m k in k
M Y
■ Y«S□ No
WHERE DO YOU COLLECT YOUR WATER FROM
SOURCH: Research data. 2009
Figure 4.5 above shows that those who obtained water from the river had the highest
infection o f water borne diseases. This shows that the rivers were not a safe source o f
water. It also shows that the water was consumed without boiling or treating it. Akong'a
(1985) posits that scarcity of water in Kilui increases the health risks as people rarely boil
or filters the water once they obtain it This makes the majority of diseases experienced in
Kitui to be water borne diseases. Very few of those who depended on water kiosks, piped
water, borehole and also shallow well suffered from water borne diseases. This concurs
what MG Associates (2002) found in I harttka Division that improved water provision
greatly reduced the occurrence of water borne diseases. This shows that water from the
66

water kiosk was treated and helped people avoid water borne diseases. Whenever the
respondents combined the alternative source with the river, there was high water borne
disease infection as water from the river was highly unsafe for their consumption.
Table 4.29 below shows the diseases that were most prevalent in the area. A combination
of Malaria, typhoid and amoeba affected most households at 32.2%. Typhoid was the
most common disease in the area followed by amoeba. I hese diseases were directly
linked to taking contaminated water and can be remedied with provision o f clean water
and treating the water before drinking. In spite o f awareness campaigns given in the area
on the need to treat the water before consumption, most respondents were still gelling
these diseases. This shows laxity on their part to treat and seek for clean water. Diarrhoea
features as the le:ist common water borne disease in the area. This can be explained by
the fact that the waters in the area are not exposed to the surface for it to be contaminated.
Table 4.29: Frequency distribution table or the water Imrnc diseases common in the area.
W ater borne d isease Frequency PercentMalaria 11 12 2Typhoid 7 7 8Malaria, typhoid 12 133Typhoid amoeba 3 3 3Amoeba 6 6.7Malaria, typhoid, amoeba 29 32.2Typhoid, diarrhoea 2 2 2Typhoid, umoeba diarrhoea 2 2 2M'a 16 17 8Malaria, amoeba 2 2 2Total 90 100 0
Sl " R( I : Research data. 2009
4.4.8 Ways of Improving Water Provision in Mutito Division
1 hough there were attempts to improve water provision in Mutito Division, most people
(88.3%) still felt that water access was still a challenge. I he study therefore sought to gel
the respondents view on how they feel the problem o f water can he addressed. Figure 4.6
below represents the percentage number of people and their views on how best the
67

problem o f water tan be solved. Most o f the respondents (3.7%) felt that boreholes would
be the best solution to water problem. Though they were very few households who were
accessing water from boreholes, the few that were accessing water from the boreholes felt
that boreholes were solving for them the problem of water access. This was because the
boreholes do not dry as other sources do especially when there was a prolonged dry spell.
Other 22.2% felt that there was need for wells, dams and forcstulion. Carim, (1987) hud
noted that the major handicap in Kitui District is its climate which can be overcome by
provision o f water, proper cultivation and tillage methods and reduction in deforestation.
Charcoal burning was a predominant activity in the area und this was posing u threat to
tlic forested area in case it continues the water access problem would get worse.
Others 21.1% fell that if everyone had a private shallow well, they could be able to gel
enough water for their use and to use in other productive activities. This agrees with what
Spcclman et al (2006) found in Ukambani where they found that those who were using
private source were able to engage in more productive activities compared to those who
were using a private water source. Though sad dams could help retain water for longer,
few people felt that this could be a solution. This was because most of them had not seen
them and hence lacked know ledge o f how they operate. The least number o f respondents
(2.2%) felt that piped water was a solution to water problem. Unlike in urban areas where
everyone desires to have piped water, this was not the ease due to the cost attributed to it
and the fact that from their experience the piped water was not regular
68

figure 4.6: A pic chari showing the different ways of improving water provision.
KEY□ r*j dtvjIo *«iit far til□ Hav*
n nave water p.p«3 tor t e r o i
E. Wol», bor«N)>ct_ th»iowwwils w«t»r■ c.«cnmer»i,boreoo<es — werts. tiarm
f a r t u a t t o n
□ fcarth dorp i
SOURCE: Research data. 2009
4.4.9 Linking Water Access with Livelihood Activities
The above discussion shows that the area had a number o f livelihood activities. These
include livestock keeping, formal und casual labour others are in crop farming, vegetable
fanning, small scale business, charcoal burning, beer brewing, hotel, making bricks and
remittances. However livestock keeping was the most reliable activity that was able to
contribute to most o f the respondents* livelihood. I hough the area was suitable for
growing different crops, the contribution it made to the livelihood was limited as they
could only harvest when they received enough rains. Other activities such as vegetable
farming and brick making arc very dependent on water and this were only practiced in
areas where they had water being available for these activities.
69

Table 4.?0 below shows the source of water and the number o f activities that respondents
were engaged in. lh is shows that people with an improved water source like riser and
shallow wells were able to engage in many activities. Some were having up to seven
livelihood activities, lhis shows that water available opens opportunity for diversified
livelihood activities. Others were still depending on the river but were able to engage in
many activities. This could be attributed to their proximity to the river and other factors
such as availability of finances to start these activities. However the river had most o f the
respondents having two livelihood activities. Fhosc who depended only on water kiosk
could only engage in few livelihood activities and none went above three activities
However those that combined the river and water kiosk were able to engage in more
activities with the highest taking five activities, lh is was because they were assured of
water for domestic use and the water from the river and the lime that they previously
spent in search of water was used in these activities. Those depending on borehole for
their water supply had two and four activities. Rtis shows that there a potential in the
borehole providing reliable water to enable people undertake more activities. I hose
depending on the piped water and river had between two and five activities. 1 his also
shows an improvement in the ability to engage in different activities. Those that
combined the river, shallow well and water kiosk were able to have between one and four
livelihood activities. It would be expected that they could have more activities due to
different sources but it could be that the sources were used to supplement each other due
to scarcity o f water, fhis analysis shows that improved water provision was actually
helping the people engage in more activities than when they have to rely on unimproved
sources o f water.
70

Tabic 4.30: A Cross tabulation of source of w ater and the num ber of livelihood activities.
Source of w ater Number of livelihood activities TotalActivates .9 . 1 2 3 4 5 6 7
River 1 a i n 2 1 3 0 0 26Shallow « 1 0 o' 2 0 0 0 4River and snallcrw well 0 5 6 10 4 2 i 1 2 30
i Water kiosk 1 2 0 1 o 0 0 0 4River and water kiosk 0 4 7 2 \ \ 0 0 15Borehole 0 0 1 0 2 0 0 0 3Piped water river 0 0 1 0 1 i_L 0 0 3Rrver shallow wen water kiosk 0 1 1 2 1 0 0 0 5
Total 3 13 23. 24 11 3 1 2 SOSOURCE: Research data. 2000
4.4.10 Hypothesis Testing
Ibe hypothesis stated that there was no relationship between the source of water and the
number o f livelihood activities one is able to engage in. Table 4.31 below shows a chi-
square lest the source o f water and the number of livelihood activities.
Table 4.31: Chi-Square Test
Value df Asytnp. Sig. (2-sidcd)Peorson ChvSquare 59694(a) 49 141l ikelihood Ratio 56 720 49 209Linear-By-unearAssociation 1.423 1 233N o 1 Valid Cases
903 60 cells (93 8%> have expected count less than 5 The ramnium expoctod count is 03
SOURCE: Research data. 2009
The Pearson chi square test value was 59.694 and the significance level for the two tailed
test was 0.141. This test indicates that there was a very weak relationship between the
source o f water and the number of livelihood activities one was able to engage in. Ibis
means that there was no relationship between the source o f water and the number o f
livelihood activities hence the hypothesis was true. Ib is could he explained by a many
71

factors. Among them were the other activities that generated income for the people such
as employment, remittances, food aid and one*-, creativity and ambition to improve their
living conditions. The other challenges that the people experienced in the area such as
hunger, lack o f capital, poor infrastructures such as school, roads and hospitals among
Others. This could hinder them from taking up many activities as most o f their energy eet
spent mitigating these effects especially hunger. Akong’a (I9S5) argues that
psychologically, prolonged starvation leads to depression, apathy and loss of initiative.
This could hinder them from engaging in many o f these activities even w hen they have
an improved source of water.
72

CHAPTER FIVE5. RESEARCH CONCLUSIONS AND RECOM M ENDATIONS
5.1 Research Conclusion
From Ihc research findings, several conclusions were arrived at which were in line with
the study objectives and the research respondents.
5.1.1 Respondents Characteristics
From the research findings, the ninety respondents were both men and women of
different age groups. I lie women however were the majority though the study focused on
household head who nonnallv are men. This was the case because many men in the area
move out to go and look for employment opportunities outside the area to support their
family. Most o f those interviewed were in their middle age showing that the area has an
active generation who can engage in many activities if they have the necessary resources.
Ihc respondents had tin uvemge o f seven members showing that the people in the area
were not planning their family. Very few respondents were in formal employment. Most
them were farmers or engaged in housework.
5.1.2 Sources of Water
I he first objective was to establish the main sources o f water. Ilie study showed that the
main sources of water for the residents of Mutito division were rivers, shallow wells,
water kiosks, boreholes, springs and sand dam The rivers were the major source ol'water
which was distributed to the water kiosks. Most people in the area still relied on the
seasonal rivers to meet their water needs. This shows that there was need for more
intervention to enable more people access water safe and reliable water. The water kiosks
enabled people to access clean water for domestic use. Ilie water kiosks were placed 2-3
km apart and the water was obtained at a fee. I he piped water hud not reached many
73

households due to the cost of piping the water where it was possible the water was scarce
to pump in each household.
The distance to the water point varies but most people walked for more than a kilometre
to obtain water. This shows that more needs to be done lor the area to be said it has an
improved water provision. 'Hie study also showed that the donkey were the preferred
mode ferrying water. This was because a donkey could carry about 80 litres o f water and
save on time and energy. This also involved only one person per household. I he distance
impacted on the quantity o f water they w ould obtain for household use. Most o f the water
obtained was used for domestic chores and most households’ consumption was below the
recommended amount of 20 litres per person day per.
lhc lime spent in collecting water varied with distance covered and whether one had to
queue to get the water. Improved water provision helped them save the time that they
previously spent looking for water. However, most o f the saved time was used in
domestic chores. I his shows that there was the need to introduce people to other
activities that can enable them use the saved lime in a more productive way. Very few
households owned private water source. I his could be attributed to the physical attributes
of the area and economic well being o f the people.
5.1.3 Other Sources of Livelihood
Employment wus contributing greatly to household income with formal employment
being the most reliable form o f employment. Self employment was also embraced by
people and made significant contribution to the household. Casual labour was also
common though its returns were little to cater for the household needs.
Few people were relying on remittances be it from their children, relatives or friends, l hc
children from households where they had both parents were seen have the ability to help
their families. This ability can be attributed to the parents’ earlier ability to educate their
children and hence they are able to give back to them.
74

Food aid was also a common source o f survival for most people especially those who
were in extreme poverty. Ihc beneficiaries were engaged in food for work programme.
Though the quantity given was not enough for most families for the whole month due to
large family si/e. it did contribute to their survival. Most widows and single women were
in the food for work programme showing the society had a way o f taking care o f the
needy people among them.
In regard to how they rated their income, the study found that most household considered
they were middle income earners. Most o f those struggling to get water especially in the
areas where they had to walk long distances to get water from the river were the once
who easily identified themselves with poverty. This shows that water had the capacity to
uplift a community and draw them out o f poverty.
Availability of food was found to be a challenge to most people due to drought frequently
experienced in the area. Consuming a balanced diet was also a challenge to most
households who were able to mainly afford maize and beans. Those that were able to
grow vegetables were able often consume vegetables and those who lived in the
surrounding areas could obtain vegetables in the market at a reasonable price. Many
people attested that water had helped improve the food security in the area either by
being able to grow vegetables or being able to obtain them freely in the market.
Consumption o f animal protein was not common as many preferred to keep livestock for
sale.
The study found that most parents were gathering their resources together to take their
children to secondary schools. Only those in formal employment were able to pay for the
school fees from their salaries with fewer struggles. The others had to combine a number
of outputs to raise the school lees mainly from the sale o f livestock. If they had water to
enable them engage in more activities, they would easily raise the school fees for their
children to attend secondary schools and colleges.
75

Hunger was found to he a major problem facing the area due to unreliable rainfall. Other
problems included poor transport due to lack o f feeder roads, few medical facilities, lack
o f school fees, lack o f capital, lack o f electricity among others. Water was noted as key
resource in solving the problem of hunger while other felt that they needed more food
aid. A lot needed to be done in the area to especially to provide the basic infrastructures
in the area such ns roads, schools, hospitals, water, and electricity in the area.
5.1.4 Water and Livelihoods
The second objective was to analyse the effects of improved water provision on the
livelihoods of the people in the area. The study found that the main livelihood activities
in the area included: livestock keeping, kitchen garden and vegetable growing along the
water sources, charcoal burning, brick making, beer brewing, and growing food crops
during rainy seasons, fruit farming and small scale businesses such as hotel and kiosks
for household goods. Most o f this activities required water for their accomplishment
I ivesiock keeping was embraced by most people in the area and it contributed
significantly to the household. Most preferred to keep gouts as opposed to cattle as they
consumed less water, required less labour and have high chances of surviving drought.
Kitchen garden and growing vegetables for sale was also embraced by those who hail
access to water mainly those who lived near a river or near a shallow well. This also
contributed to the household food security tuid improved their income.
Charcoal burning was also embraced by a significant number of people. Though charcoal
burning had negative effects on the environment which the people are well aware, they
still engage in it due to poverty due to lack o f alternative sources of income.
Brick making was also found to be viable in the area but few people were engaged in it.
This was because brick making required u lot of water which was only accessible to a
76

few. Beer brewing was also embraced by few people as ii was considered an illegal
activity. The brew had many consumers but many brewers opted to do it secretly.
Being an agricultural community. Food crops growing was embraced by most people
only that it depended on the rains. I he main food crops grown included: maize, beans,
cow peas and pigeon peas, green grams, pumpkins, sorghum and millet. Few people were
able to engage in fruit farming though the climate is favourable for the fruits.
Most people who had improved water provision were able to improve on their income.
Ibis had more impact on increasing the number o f livestock that they kept. Others were
able to engage in small scale businesses mainly selling vegetables. Others had more time
to go for casual labour and this also increased their canting.
I he water home diseases were still prevalent in the area. The diseases were more
prevalent in areas where the people depended on the rivers. The areas with water kiosk
had clean water had less likelihood o f getting the water borne diseases. Improved water
provision showed that it had the potential to reduce the water home diseases. The most
common water home diseases in the area were typhoid, malaria and amoeba.
I he study showed that the boreholes would be the most reliable source o f water to ease
the problem of water access. Other sources such as private shallow wells, dams and sand
dams could also ease the problem o f water.
The study also found that household were able to undertake different livelihood activities
but a few were not in any activity to bring them income. The ability to engage in different
activities was found not to he related to the source o f water. Many factors could be
contribute to these such as the ability to raise the required capital, access to water,
household’s ambitions and if they have a stable source o f income.
77

5.2 Recommendations.
The study found that water provision was indeed an effective tool for enhancing
livelihood of the people and eventually alleviating poverty. With regard to the sources of
water, the study found that there were more potential sources of water which had not
been fully exploited. The boreholes were more consistent in providing water its they
hardly dry up. But there was need for more water kiosks to be set up in the area to make
water accessible to all at a reasonable distance. There was need to pump water from
boreholes to big tanks and then pipe it to the household and distribute it to the water
kiosks. Shallow wells for individuals as well as for groups needed to be increased along
the rivers to make clean water accessible to more people. Ihe springs also needed to be
protected so that they do not dry up. Hence the government need to enforce strong
measures to protect the springs from human encroachment. There also need to develop
sand dams especially in areas where the rivers are saline to save the rain water. To ensure
that the residents were able to get this commodity and avoid duplication o f activities,
there was the need for organisations und government to work together in water provision
so that they can combine their efforts and do a complete and thorough work in that area.
With regards to livelihood activities, there was the need for more training to be given to
the residents to enhance the activities that they had. There was the need to train them
more on drought resistant crops. I hey also needed above all to provide w ater for the
people and train them especially on how to practice some farming activities that utilize
less quantities o f water.
Other constraints such as poor markets, ways of food preservation, infrastructure needed
to be put in place, flic needed infrastructure would include electricity which would
especially bring down the cost o f pumping water and development o f other institutions,
roads also needed to be developed to have an easy access to the area.
There was need to educate the residents on the ways o f treating water for consumption to
reduce the occurrence o f water home diseases. The organizations providing water should
also look for ways of having the water treated before redistribution
7X

REFERENCES
Akong’a Joshua. 1985. Draught. Famine and Policy. The Kitui District o f Kenya.
Nairobi: University ol Nairobi
Ashley, C. and Carney, D. 1999. Sustainable livelihoods: lessons from early experience.
London: D1 ID.
A. van l oon and P. Proogcrs 2006. Water Evaluation and Planning System. Kitui -
Kenya WatManSup project in htlprwww/Avaep.org. Accessed on I?*1 Oct 2009.
B (j Associates. 2002. Kenya Sweden rural Water Supply and Sanitation Programme
(KSRWSSP) results analysis: July 1995 to June 2000. Nairobi: SIL)A
Brooks B. David. 2002. Water Local- Level Management. Ottawa: International
Development Research Centre.
Black Maggie. 2004. The No-Nonsense Guide to Water. London: New International
Publications.
Bukure s. dc Lceuw. PN grandin, BF. Neatc. PJM. 1991. Maasai Herding: Analysis of
livestock Product System ol Massai Pastoralist in Eastern Kajiado District. Kenyyn
International Livestock Centre for African Systems Study 4. Addis Ababa. In
http:w ww.iwmi.cgiar.org. Accessed on 17**' Oct 2009.
Carter R. and llowsum P. 1999. ‘Impact and Sustainability of community water Supply
and Sanitation programmes in developing countries'. Journal o f the Chartered Institution
o f Water and Environmental Management 13:292*296.
Carim, I nver (cd). 1987. Towards Sustainable Development: Nottingham: Pan0**Ltd.
79

Centre for Disease control. 2003. 'Safe Water initiatives'. Atlanta: World Health
Organi7ation
Chambers, R. 1997. Whose reality counts? Putting the last first. London: Intermediate
Technology Publications.
Excellent development limited. 'W ater in. http-y/www.excellenl/org.
Hope, K.A and Gowing J.W. 2003. Managing water to reduce poverty: water and
livelihood linkages in a rural South African context (Alternative Water Forum, May
2003>. In http: www !j\ clihuuds.oru lessons, case studic* lesson-V* ale r1 .litm! avccsscd
I lugglns, Christopher. 2003. Rural Water Tenure in Kenya a/ul Tanzania Changing
tenure Patterns. Legal Regimes and Community Responsibilities Addis Ababa: Ossreal
Development Report
James, A J. Vcrhagcn, Joep, Van Wijk, Christine, Nanavaty, Rccma. I’arikh, Mita, Bhatt,
Mihir. 2002. ‘ I ransforming time into money using water: a participatory study of
economics and gender in rural India'. Natural Resources Forum 26: 205-217(3).
Kenya Republic of. 19X4. Kitui District Development Plan I9R4-19SS. Nairobi:
Government Printer
Kenya Republic of. 2002. Kitui District Development Plan 2002-200$. Nairobi:
Government Printer.
Kenya Republic of. 2001. Kitui District PRSP Consultation Report fo r the period 2001-
2004. Nairobi: Ministry o f Finance and Planning.
80

Macdonalf, R. 2003. ‘Providing the world with clean water remains a complex problem
but time is running out'. British American Journal 327 (7429): 416-1418.
Vlcrrey. D. J. P. Drechsel, F.W.T. Penning de Vries. & II. Sally. 2001. Integrating
‘Livelihoods' into Intergraied Water Resources Water Resources Management Taking
the Jntergraied Paradigm to its Logical Next Stem fo r Developing Countries. Silvertoo:
International Water Management Institute (1WMI)
Mumma. A. 2005. Kenya s New Water Law: An Analysis o f the Implications fo r the
Rural Poor A Presentation during International Workshop on African Water Laws
Plural Legislative l-'ramcwork fo r Rural Water Management in Africa. Johannesburg
South Africa.
Moklen David (ed). 2007. Water fo r Food. Water fo r Life. A Comprehensive Assessment
o f Water Management in Agriculture. London: Earthscan,
Moriarty Patrick and John Butlerworth. 2003. ‘The productive use o f domestic water
supplies. How water supplies can play a wider role in livelihood improvement and
poverty reduction'. IRC International Water and Sanitation Center. In.
http;/Avww.ire.nl/content download1>189/53143'fiIc■ 1 ivcliIiockI.p*lf. Retrieved on 12th
Feb, 2009
Nicol, Alan. 1997. Findings o f the Water and Livelihoods Workshop in Harare. In,
http://www.lboro .ac.ukAvell/resources/publicaiion/lllheitwss'papcrs.'aps.scf 4%20l I
Nicol. Alan. 2000. Adopting a sustainable livelihoods approach to water projects:
implications fo r policy and practice Working paper 133. Overseas Development
Institute. London. In http w'ww.odi.org.uk/resourecs/odi-publitfations'working-
papers' 133-sustaimible livelihood index,him. Retrieved on 6th Feb 2009.

Njonjo A. 1997. Study o f Community Managed Water Supplies- Final report Case
Studies and Experience Exchange in World Bank RSWSG- FA 1994 Survey of
Community Water Supply Schemes Republic o f Kenya/JICA.
ODI. 2003. Secure Water? Poverty, Livelihoods and Demand-Responsive Approaches.
W ater Policy Programme. ODJ. W ater Policy Brief 4.
ODI, 2002 Poverty Reduction and Water: ‘Watsan and PRSPs' in Sub-Saharan Africa.
Water Policy Programme. ODI, Water Policy Brief 3
Sasol and Maji na Ufanisi. 1999 Where there is no Water. A story of community water
development and sand dams in Kitui District, Kenya. Nairobi: Sasol and Maji na Ufanisi.
Save the Sand project. 2003. Save the Sand Project. An Integrated Management Project.
Acomhock. South Africa. In.http: w-ww.nn.org/projectAvss-l WRM ReoortsVsavethcsand
unit 7pdf. Retrieved on 26th 1 cb 2009.
Shordt Kathleen,Christine van Wijk and Francois Brikki. 2004. Monitoring Millennium
Development Goals fo r H ater and Sanitation. A review o f experiences and challenges.
Delft: IRC International Water and Sanitation Centre, in. htnv.-Avww irc.nl page 12932.
Retrieved on 26th Feb 2009.
Speelmnn S. D’llaese L. Ochieng C. Vandermeulen V. 2006. Productive water uses at
household level in rural Kenya: Case study o f the Ukambani district. In
h ttp://ww\v.ageconsearch.urrin.cdu/bitsiream/25325/1/ppo602K6.pdf.retreived on 26U| Feb
2005).
'Sustainable livelihoods’ in hnp-. wAvu.synterandlivd iii Mxl org sust^in ihlc-
livelihoods and v u'.cr.pdl Retrieved on 26th Feb 2009.
82

UN Water Development Report (2003) H aler For People Water For Life United Nations
World Water Assessment Programme Paris: UNESCO.
UN Water WWAP. 2006. Kenya National Water Development Report. Prepared lor the
2nd UN World Water Development Report. ‘Water A Shared Responsibility. Nairobi: UN
Water.
Water and MDGS. (Imp: ■uww.issitac.org'docs md.:s 2000). Retrieved on 6th Feb 2009.
Waswn Fuchuna, Samuel Otor, Godfrey Olukoyc, Daniel Mugendi(ed). 2007.
Environment and Sustainable Development. A Guide fo r Higher Education in Keny a Vol
II. Nairobi: Kenyatta University. School o f Environmental Studies and Human sciences.
Waughray, D.K.. Lovell. C.J. and Mazhangara. F. 1998. "Developing basement aquifers
to generate economic benefits: a case study from south-east Zimbabwe". *World
Development' 26(10): 1903-1912.
World Health Organization/ United Nations Children's Fund. 2000. "Global Water
Supply and Sanitation assessment Report”. Geneva- WHO
World Water Council (WWC). 2000. A Water Secure World Vision fo r Water, Life and
the Environment (Commission Report).
World Water assessment Programme. 2006. Water A Shared Responsibility. The United
Nations World Water Development Report 2.
World Bank. 2006. Getting Africa on Track to meet the MDGs on Water am i Sanitation
A status Overview o f Sixteen African Countries. Nairobi: World Bank.
World Bank (2004) The Republic o f Kenya Towards a Hater-Secure Kenya. Water
Resource Sector Memorandum. Nairobi: World Bank.
83
APPENDIX 1
QUESTION AIRE 1
My name Is Sophia W. Ngigi. a postgraduate student at the Institute for Development Studies, University o f Nairobi. 1 am carrying out a study on 'The implications o f Improved water provision on livelihoods A case study o f MutHo Division'. This study focuses on how improved water provision helps the people improve their livelihood strategics. My interest is to learn from the residents o f Mutito Division what effect the water has had on their lives und improve their living conditions. I would highly appreciate your patience and time spent on answering the following questions. The information you will give will be treated with confidence.
Please answer the questions as honestly and openly as possible. There arc no “right" or “wrong” answers. Thank you in advance for your cooperation.
HOUSEHOLD QUKSTIONAIKK
DATE.........................................QUESTIONAIRES NO........................................
STUDY LOCATION...............................................
DE MOCRAP1IIC IN FORM AIK >N
NAME:Gender Age Marital
statusLevel of education
Householdmembers
Occupation Spouseoccupation
Male Under21
Single None Total No work No work
female 21-25 Married Primaryincomplete
Male Farmer Farmer
26-30 Divorced/separated
PrimaryComplete
female 1 larder Harder
31-35 Widowed Secondary-complete
House work House work
36-40 Secondaryincomplete
Business/Trade Business! radcr
41-44 Poly-technique
Teacher Teacher
45-50 College Civil Servant Civil Servant51-55 University NGO worker NGO w orker
55-60 Other Other
81

w u r n PROVISION9. Where do you collect your water from? 1. River
2. Shallow well3. Rain water Reservoir4. Water kiosk.5. Piped water6. Rock Catchments7. Borehole8. Tanker-truck9. Other Specify
10. Do you feel accessing water in this area is a problem?
1. Yes.2. No.
II. If it is u problem, what in your view makes it n problem?
12. Do you own a private water source? 1. Yes.2. No.
13. If y es, what is your private source of water? 1. Shallow well2. Rock Catchments3. Sand dam4 Rain water harvesting5. water kiosk6. Other (specify-)
14. Do you buy the water? 1. Yes2. No
15. If yes in the question above, where do you buy your water front?
1. Council2. Water tank3. Borehole4. Water vendors5. Tanker-truck6. Other (specify)
16. If Yes how much do you spend weekly on water.
7. l ess than Ksh. 508. About Ksh. 1009. About Ksh. 20010. About Ksh. 30011. About Ksh. 40012. About Ksh. 50013. More specify
17. If you at times obtain water from the river, what distance do you cover to get to the river?
1. Less than 200m2. 200m-1km3. 1km-1.5km4. 1.5km-2km5. 2km-2.5km6. 2.5km-3km7. 3km-4km8. 4km-5km

9. Above 5km
18. It you obtain water from a shallow well, whul distance do you cover?
1. Less than 200m2. 200m-1 km3. 1km-1.5km4. 1.5km-2km5. 2km-2.5km6. 2.5km-3km7. 3km-4km8. 4km-5km9. Above 5km
19. If you obtain water from an earth dam. what distance do you cover?
1. 1 css than 200m2. 200m-1 km3. 1 km- 1.5km4. I.5km-2km5. 2km-2.5km6. 2.5km-3km7. 3km-4km8. 4km-5km9. Above 5 km
20. If you obtain piped water, what distance do you cover?
1. Less than 200m2. 200m-1km3. 1 kin-1.5km4. I.5km-2km5. 2km-2.5km6. 2.5km-3km7. 3km-4km8. 4km-5km9. Above 5km
21. It you obtain water from a borehole, what distance do you cover?
1. Less than 200m2. 200m-1 km3. 1 km-1.5km4. 1.5km-2km5. 2km-2.5km6. 2.5km-3km7. 3km-4km8. 4km-5km9. Above 5km
122. If you obtain water from rainwater reservoir, what distance do you cover?
1. Less than 200m2. 200m-1 km3. 1 km-1.5km
86

4. 1.5km-2km5. 2km-2.5km6. 2.5km-3km7. 3km-4km8. 4km-5km9. Above 5km
23. Who fetches the water lor you? 1. Mother2. Father3. Girls4. Boys5. Hired worker6. Other specify
24. What do use to ferry the water home? 1. Carry on my back.2. Use a donkey.3. Use a wheel burrow.4. Use a bicycle.5. other (specify)
25. How many members o f your household go to collect the water in a day?
6. One7. Two8. Three9. More than
three( specify)26. 1 low often do you obtain the water? 1. Daily
2. After two Days3. After 3-4 days4. Weekly5. Other Specify
27. Do you queue to obtain the water'.' 1. Yes.2. No.
28. If yes above how long do you lake to collect the water?
1. Less than 30min2. 30-40min3. 40-50min4. 50-60min5. 60-80min6. 80-l00min7. I00-120min8. More than I20min
(specify)29. How long do you take to get to your water
source? (indicate time taken from each of your source)
1. Less than 3(>min2. 30-40min3. 40-50min4. 50-60min5. 60-80min6. 80-100m in7. 100-120m in8. More than I20min
X7

(specify)30. Do you sa\c the lime that you previously
used to spend looking for water?1. Yes.2. No.
31. If Yes in the question above, what do you do the time you used to spend fetching the water?
1. Work in inv farm.2. Rest.3. Domestic chores.4. Casual labour.5. Gra/c animals.6. Started a business7. Other specify
EFFECTS OF WATER ON LIVEL HOODS32. How do you use the water that you obtain
within the household?1. Domestic use.2. For livestock.3. For vegetable
growing.4. To make bricks for
sale.5. In hotel.6. To brew beer.7. other (specify)
33. What Activities docs your family engage in?
1. Domestic chores2. Collecting water3. Keeping cows 4 Keeping goats5. Kitchen Garden6. Fruit farming7. crop farming8. Deer brewing9. Water sale10. Operating a kiosk11. Operating a hotel12. Fomial employment13. Other specify
34. Do the activities that you engage in require water?
1. Yes.2. No.
35. It Yes what is your source o f water for these activities
1. River2. Rain water3. Own a shallow well4. Community shallow
well5. Borehole6. Sand dam7. Spring8. Rock catchments
88

9. Other (specify)36. Has ihc availability o f water helped you
engage or improve on the activities that you do? ~
1. Yes2. No
37. 11 yes in the above question, which activities are you engaged with improved water provision?
1. Keeping cows2. Keeping goats3. Kitchen Garden4. Fruit farming5. crop fanning6. Vegetable farming7. Beer brewing8. Water sale9. Operating a kiosk10. Operating a hotel11. Formal employment12. Other specify
38. How much water do you spend in these activities in litres? (Specify)
1. Domestic chores2. Watering cows3. Watering goals4. Kitchen Garden5. Fruit farming-6. Vegetable growing7. Small sculc business
(specify)8. Other specify
39. lias the availability o f water helped you increase the number o f livestock that you keep?
1. Yes2. No
40. What proportion of your livelihood comes from livestock keeping?
1. most of it2. little of it3. very little of it4. other
41. Do you grow food crops? 1. Yes2. No
42. If yes which crops do you grow? 1. Maize2. peas (Nzuu)3. Vegetables4. Tomatoes5. Onions6. Fruits7. Other (Specify)
43. Do you grow these crops for sale or for home consumption?
1. For consumption2. For sale3. For sale and
consumption

44. What proportion o f your livelihood comes from crop farming?
1. most of it2. little of it3. very little o f it4. other
45. lias the water available helped you improve on your income?
1. Yes2. No3. No Answer
46. How has it helped you to improve your income?
47. Has the availability o f water helped you engage in small scale business?
1. Yes2. No
48. If yes which business are you engaged in?
49. What proportion of your livelihood comes from small scale business?
1. most o f it2. little o f it3. very little o f it4. other
50. Are you engaged in any employment 1. Yes2. No
51. If Yes which one? 1. Formal employment2. Casual labour3. Other (Specify)
52. What proportion o f your livelihood comes from employment?
4. most of it5. little o f it6. very little o f it7. other
53. Do you receive any remittances? 1. Yes2. No
54. From whom do you get your remittances? 1. children2. relatives3. friends4. others (Specify)
55. What proportion o f your livelihood comes from remittances?
5. most of it6. little o f it7. very little o f it8. other
56. Do you receive food aid? 1. Yes2. No
57. About what proportion of your livelihood comes from food aid?
3. most of it4. little o f it5. very little o f it6. other
58. How is the distribution of your income? (1 torn the most to the least)
1.2.3.
90
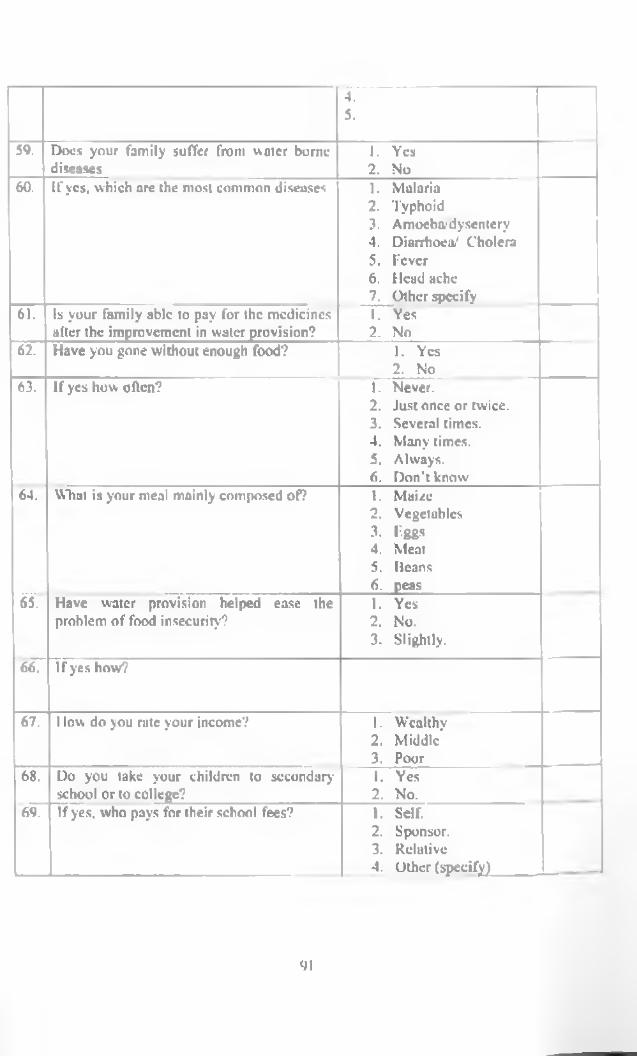
4.5.
59. Docs your family suffer from water borne diseases
1. Yes2. No
60. If yes, which arc the most common diseases 1. Malaria2. Typhoid3. Amoeba-dysentery4. Diarrhoea' Cholera5. Fever6. Head ache7. Other specify
61. Is your family able to pay for the medicines alter the improvement in water provision?
1. Yes2. No
62. Have you gone without enough food? 1. Yes2. No
63. If yes how often? 1. Never.2. Just once or twice.3. Several times.4. Many times.5. Always.6. Don’t know
64. What is your meal mainly composed of? 1. Maize2. Vegetables3. F.ggs4. Meat5. Beans6. peas
65. Have water provision helped ease the problem of food insecurity?
1. Yes2. No.3. Slightly.
66. If yes how?
67. 1 low do you rate your income? 1. Wealthy2. Middle3. Poor
68. Do you take your children to secondary- school or to college?
1. Yes2. No.
69. If yes. who pays for their school fees? 1. Self.2. Sponsor.3. Relative4. Other (specify)
‘>1

70. If you pay for ihcir school fees, how do you acquire it?
1. F ormal employment.2. Casual labour3. Retirement benefits.4. Sale o f livestock5. Sulcol'land.6. Remittances.7. Sulc o f agriculture
produces.3. Small scale business 9. Other (specify)
71. Can you suggest ways o f improving water provision?
72. VWiat other challenges do you face in this urea?
73. How can the above challenges he addressed?
92
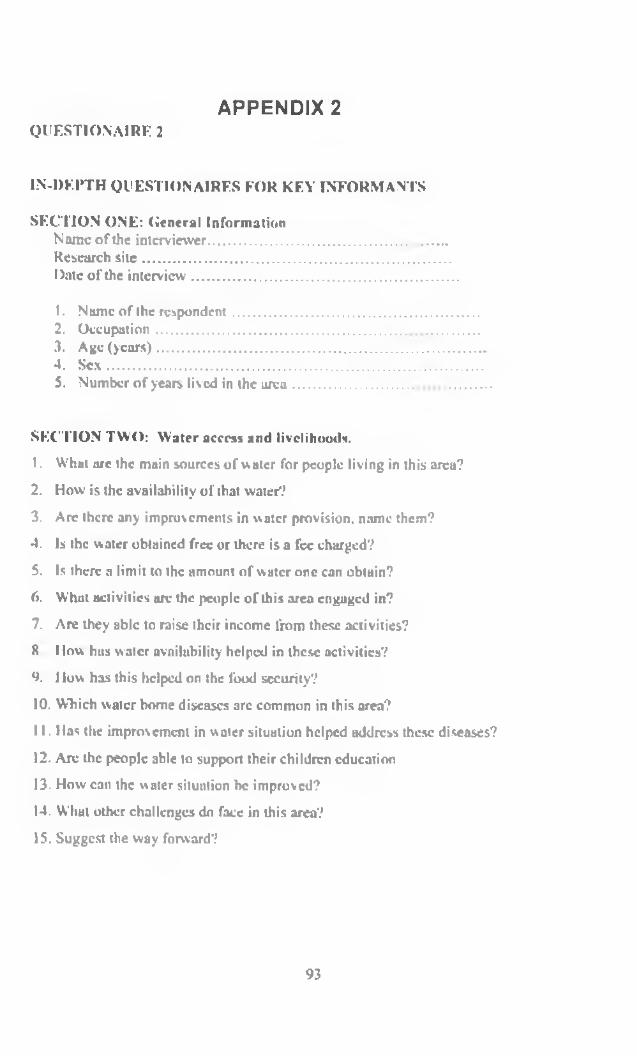
QUEST TON AIR V. 2
IN-DEPTH QUESTION AIRES FOR KEY INFORMANTS
SECTION ONE: (ieneral InformationName o f the interviewer.................................................................Research s ite ....................................................................................Date o f the interview.........................................................................
1. Name of the respondent...................................................................2. Occupation.........................................................................................3. Age (years)..........................................................................................4. Sex ......................................................................................................5. Number o f years lived in the a re a ......................................................
SECTION TWO: W ater access and livelihoods.
1. What urc the main sources o f water for people living in this area?
2. How is the availability of that water?
3. Are there any improvements in water provision, name them?
4. Is the water obtained free or there is a fee charged?
5. Is there a limit to the amount o f water one can obtain?
(>. What activities arc the people o f this area engaged in?
7. Are they able to raise their income from these activities?
8 I low has water availability helped in these activities?
9. 1 low has this helped on the food security?
10. Which water borne diseases arc common in this area?
11. Has the improvement in water situation helped address these diseases?
12. Are the people able to support their children education
13. How can the water situation be improved?
14. What other challenges do face in this area?
15. Suggest the way forward?
APPENDIX 2
93
APPENDIX 3
KKV INFORMANTS
1. Mr. Simba Mutunga Mathias----------- ------------ Public 1 lealth OfTiccr Mulito Division
2. Mr. Nicolas Muungami...............««■—
3. Mr. Simon K ithuku--------------------------------- Water technician Hxtention Olliccr(AMRF.F)
4. Joseph Mboya-------------- ---------------
9B T V E R S1T Y O F N A IRO H * I. » . S . L IB R A R Y
94