ng in apparel - capturing the gains apparel global value chains. the importance of quotas and...
TRANSCRIPT

ec in
1 Univ Email Captu ISBN
conomic a global pr
versity of N
l: jpickles@
uring the Ga
: 978-1-9072
and socialroduction
North Caro
@unc.edu
ains 2012
247-87-3
l upgradinn network
olina
ng ks
Econglobatrade John Nove
Wor
nomic anal value e policy
n Pickles
ember 20
rking Pap
nd socialchains:
s1
012
per 13
upgradipublic go
ing in apovernan
pparel ce and

2
Abstract
The Capturing the Gains research network assesses the relationship between economic and social upgrading in global production networks in four sectors; apparel, agro-foods, mobile phones, and tourism. This paper details the findings of the apparel sector research team, with a focus on public governance, specifically trade policy. The research network was funded by the Trade Department of the UK Department for International Development and is coordinated by the University of Manchester. Keywords: Apparel, textiles, value chain, trade policy, trade rules, governance
Author John Pickles is Earl N. Phillips Distinguished Professor of International Studies and Chair, Department of Geography, University of North Carolina.1 Acknowledgements This paper draws directly on field research reports of and comments from Capturing the Gains researchers Nazneen Ahmed, Dennis Arnold, Shamel Al-Azmeh, Jennifer Bair, Stephanie Ware Barrientos, Thomas Bernhardt, Gary Gereffi, Annelies Goger, Nguyen Thu Hang, Peter Knorringa, Will Milberg, Doug Miller, Mike Morris, Dev Nathan, Kelly Pike, Arianna Rossi, Cornelia Staritz, Meenu Tewari, Lan TU and Shengjun ZHU. I have tried to integrate their respective research contributions into the present report. The manuscript has benefited from careful review from my doctoral advisee group; Yousuf al-Bulushi, Amy Braun, Annelies Goger, Tu lan, Steve Larson, and Aron Sandell, who helped enormously in sharpening the key findings of the report. Stephanie Barrientos, Shane Godfrey, and Doug Miller provided extensive helpful comments on the text. The findings and views presented here do not represent those of Capturing the Gains funders or supporting organisations.
1 In collaboration with Nazneen Ahmed, Dennis Arnold, Shamel Al-Azmeh, Jennifer Bair, Stephanie Ware Barrientos, Thomas Bernhardt, Gary Gereffi, Shane Godfrey, Annelies Goger, Nguyen Thu Hang, Peter Knorringa, Will Milberg, Doug Miller, Mike Morris, Dev Nathan, Kelly Pike, Arianna Rossi, Cornelia Staritz, Meenu Tewari, Lan Tu, and Shengjun Zhu.

3
Preface: Capturing the Gains apparel sector research Apparel has been one of the most studied industrial sectors, especially in terms of wages, working conditions, and quality standards, as well as a smaller amount of research on the more difficult areas to study (the employment of children, migrants, women, and casual workers on contract). Many of those in the Capturing the Gains (CtG) apparel sector research team have contributed to the literature on these subjects. In designing this sectoral study, the apparel team identified a series of case study topics and countries in order to investigate the ways in which economic and social upgrading relate one to the other. Research focused on the role of governance, specifically forms of public, private, and public-private governance (Mayer and Pickles 2011). This paper focuses on the role of trade policies in economic and social upgrading and downgrading in apparel global value chains. The importance of quotas and quota-removal are, by now, relatively well known and their effects have been demonstrated by others (Gereffi and Frederick 2010; Lopez-Acevedo and Robertson 2012). The paper elaborates the consequences of post-MFA/ATC quota removal for social upgrading and then turns to an analysis of the effect of trade policy instruments that continue to shape global apparel manufacture and trade, particularly the role of regional trade agreements, preferential market access, rules of origin, duty and tariff rates. The paper draws on Capturing the Gains research projects carried out in or on 17 countries to examine the effects of these policies across four low-income regions; East Asia (China, Cambodia, and Vietnam), South Asia (Bangladesh, India, and Sri Lanka), North Africa and the Middle East (Morocco, Egypt, and Jordan), Sub-Saharan Africa (South Africa, Lesotho, Kenya, Mauritius, and Madagascar), and Central America and the Caribbean (Nicaragua, Haiti, and the Dominican Republic) (Table 1).
Table 1. Capturing the Gains apparel sector country case studies ____________________________________________________________________
Latin America South Asia East Asia North Africa/ Sub-Saharan Africa
Middle East ______________________________________________________________________
Nicaragua India China Morocco South Africa Haiti Bangladesh Cambodia Egypt Lesotho Dominican Republic Sri Lanka Vietnam Jordan Kenya
Mauritius Madagascar __________________________________________________________________ Seventeen country-focused projects were supported or partially-supported by the Capturing the Gains apparel sector programme. Team members also contributed several other related research papers produced for parallel and related projects. The main project themes are listed in Table 2 below and full details of the research reports are listed in the Appendices. Most will eventually be available at www.capturingthegains.org

4
Table 2: Apparel case studies and thematic contributions Country cases Thematic focus on upgrading Supporting research reports and
working papers
[Available at: www.capturingthegains.org/]
Asia China Role of state policies in economic
and social upgrading:
– Industrial policy
– Regional policy
– Labour contract law
Zhu and Pickles (2011; 2012)
Lan and Pickles (2011) Vietnam Managing the 2007 crisis Frederick and Staritz (2011c); Hang
(2009; 2011) Cambodia Role of ILO Better Work
Programme:
– wages and working conditions
– trade union effectiveness
– worker voices
– living wages
Frederick and Staritz (2011e); Arnold (2011a; 2011b; 2012); Catiia Gregoratti and Doug Miller (2010)
India Community partnerships (GAP/Mewat)
Child labour
Frederick and Staritz (2011b); Tewari (2012)
Bhaskaran, Nathan, Phillips, and Upendranadh (2010); Nathan and Phillips (2011)
Bangladesh Minimum wage legislation
Effect of export boom on safety
Ahmed (2012)
Miller (2010; 2011; 2012)
Frederick and Staritz (2011a)
Miller (2012d) Sri Lanka Ethical production initiative and lean
manufacture Frederick and Staritz (2011f); Goger (2011, 2012)
Africa and Middle East South Africa AGOA and regional competition
Staritz (2010)
Lesotho
Local embeddedness and skills
Pike and Godfrey (2011)
Godfrey and Pike (2012)
Morris and Staritz (2011) Kenya Retail multiples, standards Barrientos, Knorringa, and Pickles

5
convergence, and new markets
(CtG research in process)
Mauritius Madagascar Ownership and embeddedness Morris and Staritz (2011)
Staritz and Morris (2012) Morocco Standards and working conditions:
Fast fashion, state labelling, EU trade integration policy, and working conditions
Rossi (2010); Frederick and Staritz (2011i);
Plank, Rossi, and Staritz (2011) Egypt Export processing zones and
working conditions; role of migrant workers.
Al-Azmeh (2011)
Jordan Export processing zones and working conditions; role of migrant workers.
Al-Azmeh (2011)
CAFTA-DR Nicaragua Public-private partnerships
TPL and rules of origin
Gereffi and Bair (2010); Bair and Gereffi (2011)
Bair (2012) Honduras Regional integration Frederick and Staritz (2011g); Bair
(2012) Mexico Frederick and Staritz (2011h);
Frederick and Gereffi (2011) Haiti Trade policy directed production Dominican Republic Living wage initiative (Knights
Apparel, Alta Gracia factory) Pickles and Zhu (2012)
Non-regional specific Governance and standards Mayer and Pickles (2011) MFA phase-out Frederick and Staritz (2012) Crisis Cattaneo, Gereffi, and Staritz (2010) Trade patterns and upgrading Milberg and Bernhardt (2011);
Bernhardt (2012) Logistics CtG research in process. The value of time in value chains Pickles (2012) Industrial relations
Miller (2011a); Miller, Turner
CSR Miller (2011c) Labour costing models Miller (2011b; 2012a; 2012b; 2012c) Living wage Miller (2012b) Alta Gracia Pickles and Zhu (2012a) California Supply Chains Act Pickles and Zhu (2012b) Levi’s Terms of Engagement. Pickles and Zhu (2012c)

6
Abbreviations ACFTA ASEAN-China Free Trade Agreement ACP African, Caribbean, and the Pacific AGOA Africa Growth and Opportunity Act ASEAN Association of South East Asian Nations ATC Agreement on Textiles and Clothing BGMEA Bangladesh Garment Manufacturers and Exporters Association CAFTA Central American Free Trade Agreement CASDEC Cambodia Skills Development Center CBI Caribbean Basin Initiative CBTPA US-Caribbean Basin Trade Partnership Act CEE Central and Eastern European CGTC Cambodia Garment Training Centre CMEA Council for Mutual Economic Assistance CM cut-make CMT cut-make-trim DOT Bangladesh Department of Textiles DR-CAFTA Dominican Republic–Central America Free Trade Agreement EBA Everything but Arms ECOWAS Economic Community of West African States EPA Economic Partnership Agreements EPZs export processing zones EU-15 The 15 member states of the European Union (EU) as of December 31, 2003,
before the new member states joined the EU: Austria, Belgium, Denmark, Finland, France, Germany, Greece, Ireland, Italy, Luxembourg, the Netherlands, Portugal, Spain, Sweden, and the United Kingdom
FDI foreign direct investment FLA Fair Labor Association FOB free on board FTA free trade agreement GATT General Agreement on Tariffs and Trade GDP gross domestic product GSP Generalized System of Preferences GVCs global value chains HS Harmonized Commodity Description and Coding System IFA International Framework Agreement IFC International Finance Corporation ILBFTA Indo–Sri Lanka Bilateral Free Trade Agreement ILO International Labour Organization ITGLWF International Textile, Garment and Leather Workers Federation LDCs least developed countries LICs low-income countries MENA-4 Tunisia, Morocco, Arab Republic of Egypt, and Jordan MFA Multi-fibre Arrangement MFA/ATC Multi-fibre Arrangement/Agreement on Textiles and Clothing MFN most favoured nation NAFTA North American Free Trade Agreement NGO non-governmental organization

7
NIEs newly industrialized economies OBM original brand manufacturing ODM original design manufacturing OEM original equipment manufacturing OPT Outward Processing Trade ROO rules of origin SAARC South Asian Association for Regional Cooperation SADC Southern African Development Community SAFTA South Asian Free Trade Agreement SAPTA South Asian Preferential Trading Agreement SKU Stock-keeping unit SLAEA Sri Lanka Apparel Exporters Association SMEs small and medium enterprises SOEs state-owned enterprises SSA Sub-Saharan African T&G textile and garment TCF third country fabric TPL Trade Preference Levels TPP Trans-Pacific Partnership UN Comtrade United Nations Commodity Trade Statistics Database UNDP United Nations Development Programme USAID United States Agency for International Development USAS United Students against Sweatshops USITC US International Trade Commission WRAP Worldwide Responsible Accredited Production WRC Worker Rights Consortium WTO World Trade Organization

8
Executive summary: the apparel global value chain Global apparel exports currently total around US$350 billion and contribute substantially to national export earnings. Apparel production for export employs tens of millions of workers worldwide, particularly women in low-income countries. The globalization of apparel export production has also created poor working conditions and regional wage depression. Over time, the national structure of manufacturer-driven value chains has given way to increasingly fragmented production systems in globalized buyer- and retailer-driven value chains. Today, the apparel global value chain (GVC) is organized around five main segments.
Figure 1. The apparel global value chain
Trade policies and trade rules of one kind or another have shaped this geography. Throughout the 1980s and 1990s, the Multi-Fibre Arrangement (MFA) created a quota regime that encouraged the expansion of production in many low-income countries. With the final removal of quotas in 2004, mainland China was the main beneficiary, as well as South and Southeast Asian countries, such as Bangladesh, Cambodia and Vietnam. With each shift in sourcing, prior patterns of production and employment were disrupted, often resulting in profound regional economic declines and high levels of unemployment. Apparel is an important export earner for many lower-income countries, contributing 6.6 percent of total manufacturing exports in Asian countries, 7.3 percent in Latin America, and 9.9 percent in Africa. Apparel manufacture has also been an important generator of employment for women, especially in regions where waged work was formerly not available to them. Some argue that these jobs are ‘good’ compared with the alternatives and that they contribute to poverty reduction. Others see the

9
internationalization of the industry being driven by the need to manage low-skilled labour pools working for low wages, leaving in its wake regional economic unemployment where contracts have been withdrawn. Apparel workers have, as a consequence, been at the forefront of struggles for collective rights against long and irregular working hours, poor and sometimes dangerous working conditions, low wages and benefits and physical abuse and violence.
Economic and social upgrading in apparel GVCs after 2004
Capturing the Gains carried out research in 17 low- and middle-income countries in Africa, Asia and Latin America.2 The focus was on the relationships between economic upgrading and social upgrading in the apparel industry.3 This section highlights some of the findings relating to economic and social upgrading and downgrading after MFA phase-out and the ending of quotas.4 The shifting of orders from one region of the world to another has seen some firms improving their position in terms of value-added and productive capacity, and some workers are seeing improvement in the terms, conditions and remuneration of employment and respect for rights. But in other regions and other parts of the chain these gains are uneven; firms and workers have experienced economic downgrading, employment loss, declining wages and poor and uncertain jobs. For example:
• Bangladesh, Cambodia, China, India, Indonesia and Vietnam have experienced economic upgrading in terms of both increased export market share and export unit values.
• The ending of the MFA was partly mitigated in Sub-Saharan Africa by the introduction of the African Growth Opportunities Act (AGOA) in 2000, although Kenya saw declines in both market share and unit values of exports. Lesotho’s export market share also declined significantly.
• Because Mauritius has a fully integrated textile and apparel sector and produces higher-value products, it was able to recover quickly from the ending of the MFA by capturing residual contracts from the European Union – so, although its export market share decreased there was an increase in export unit values.
• Limited government support to the industry, weaknesses in the maquiladora export platform model (which locks manufacturers into simple assembly tasks) and a failure to diversify export markets beyond the US have all contributed to Mexico’s declining market position in a context of increased competition from low-cost Asian suppliers.
In terms of employment and real wage growth, some countries show clear-cut upgrading (China, India, Jordan and Nicaragua). China has recorded the highest increase in real wages (+88 percent) and Jordan the largest expansion in employment (+64 percent). Cambodia and
2 East Asia (Cambodia, China and Vietnam), South Asia (Bangladesh, India and Sri Lanka), North Africa and the Middle East (Egypt, Jordan and Morocco), Sub-Saharan Africa (Kenya, Lesotho, Kenya, Madagascar, Mauritius and South Africa) and Central America and the Caribbean (the Dominican Republic, Haiti and Nicaragua). 3 See Bernhardt, T. and Milberg, W. (2012).’International trade and the relation between economic and social upgrading’, Capturing the Gains Summit Briefing, 4 For a fuller account of these findings see Pickles, J. (2012). Economic and social upgrading in apparel global value chains: – public governance and trade policy. Capturing the Gains Working Paper.

Fig
NotGua
BangladesDominicanSaharan Aalso exper Trade agreproductionvalue activunderwritemanufactuworkers neincome co Effects o The growconsequencountries t2008 had nbenefited f
5 Bernhardtinsights fromToward BePalgrave/M
gure 2. Soc
te: Timespanatemala (200
sh have ren Republic hAfrican counrienced real
eements pla under rulevities to lo
e infrastructre, and witheeded for duntries have
f the 2008
ing dependnces. Our reo respond tnegative efffrom quota
t, T. (2012). m using a paetter Work: acmillan and
cial upgrad
ns covered a02-2008) and
ecorded inchas experientries have wage decli
ay a crucial es that favoow-income tural investhout workfodesign, brae few devel
8 global re
dence of esearch fouto the 2008 fects acrossphase-out
‘Economic aarsimonious Understand
d ILO. In prep
ding and do
re different fod Vietnam (2
creases in enced increseen declinines.
role in struour value ca
and low-wments and
orce and eduanding and lopmental p
ecession
global appund that pos
financial crs the regionand the ex
and social upmeasureme
ding Labour paration.
owngrading
or Banglade2005-2008).
employmeeases in reanes in both
ucturing the apture in th
wage countthe develo
ucational inmarketing
paths open t
parel trade st-MFA gainrisis. The ecn, but smallexpansion of
pgrading of dnt approach’in Apparel
g in the ap
sh (2005-200
ent but decal wages bemploymen
apparel GVhe major mtries. Withoopment of
nvestments and the coto them.
on valuens and lossconomic criser relative ef domestic
developing co’. In Rossi, A
Global Va
parel secto
08), El Salva
clines in reut declinesnt and real
VC. They paarkets and out strong national coto underwrionsumers t
chains hses amplifiedsis and dow
effects in Asmarkets. In
ountries in thA., Luinstra, Alue Chains.
or, 2004-20
ador (2004-2
eal wages,s in employ
wages. Sri
arse out thethe allocatstate inte
otton, yarn ite both the to drive dem
as importad the ability
wnturn in desian countrin fact, thos
he global apA. and Pickle London an
10
0095
008),
while thement. Sub-Lanka has
e phases oftion of low-rvention toand fabricknowledge
mand, low-
ant indirecty of specificemand afteres that hade countries
parel sector:es, J. (eds.).nd Geneva:
0
e -s
f -o c e -
t c r d s
: . :

11
that had weathered the ending of quotas better also weathered the crisis better than quota losers. By contrast, the countries most affected negatively by quota phase-out (African and most Central American and Caribbean countries) were also those that were most affected by the economic crisis. Research findings also suggest that private governance mechanisms (corporate social responsibility, etc.), while positive in their own terms, have been insufficient to counteract the negative effects of post-quota sourcing shifts and the recession. State intervention has been crucial, however; this is seen clearly in the success of the industry in Bangladesh, China, India and Nicaragua. Trends in apparel GVCs Quota removal has expanded the range of opportunities for footloose sourcing, which in turn has expanded employment opportunities in some low-income countries, but often at a cost of poor working conditions; low wages; use of child labour; lack of social protection; the feminization of work and gender discrimination in compensation and skill acquisition; and environmental damage from effluent discharge and the use of harmful dyes and chemicals. Today, apparel GVCs have squeezed wages to their limit, buyers have turned their attention to other ways to manage costs (particularly logistics and end-market selection) and more now recognize the increasing importance of the business case for investing in wages, working conditions and worker engagement. Findings and recommendations Post-MFA global value chain dynamics
• Over time, the national structure of manufacturer-driven value chains has given way to increasingly fragmented production systems in increasingly globalized buyer-driven and retailer-driven value chains. The lead firms that drive this international division of labour include retailers and brand owners and are typically headquartered in the leading markets (Europe, Japan, and the United States). These firms tend to perform activities in the apparel value chain to which most value accrues – design, branding, and marketing of products – and in most cases, they outsource the manufacturing process to a global network of suppliers in lower income countries.
• The final removal of MFA quotas in December 2004 expanded opportunities for ‘footloose’ sourcing and employment opportunities in regions that benefitted from the shift (such as China, Cambodia, Vietnam, and Bangladesh). These do not necessarily lead to better working conditions or social upgrading. However, a buyer-driven competitive market has led, in recent years, to a reassessment of the importance of social upgrading in apparel global value chains.
• Fragmentation of apparel value chains and the institutional and cost constraints placed on the equivalent development of yarn, fabric, and dyeing industries have substantially limited opportunities for social and economic upgrading in supplier factories. Yarn and fabric manufacturers in major markets have been able to shape national trade policies and rules

12
to protect their markets in increasingly global assembly chains, and to do so they have supported restrictive rules of origin in nearly all preferential market access agreements.
• The resulting apparel GVCs comprise interconnected and diverse production systems and working conditions. Trajectories of economic and social upgrading are correspondingly diverse, depending on a wide variety of variables such as firm size, capacities, product mix, buyer needs, and labour market conditions.
• Exploitation remains a problem both for workers within many assembly factories and for workers who have lost their jobs as sourcing has shifted location. Three points are particularly important:
o Apparel production has been disembedded from integrated textile and clothing
complexes, mature industrial labour relations, and strong health and safety state institutions. This has simultaneously fuelled exploitation and restricted opportunities for developing backward and forward linkages.
o Increased fragmentation and geographic dispersion of the value chain is compounded by the reduced length of contracts, high turnover of suppliers, and higher demands on them, often without any increase in the contract price.
o Responsibility for decent work has thus been distributed across a much broader range of actors, many of whom are ill-equipped to afford or facilitate social upgrading.
• At the same time, the increasing globalization of apparel assembly has led to new sources of employment in low-income countries, particularly for women, while wages and conditions of work for female workers generally remain poor, the wage effects on household budgets and poverty reduction have been important.
• In some regions and markets, and for some producers with particular product mixes, the race to the bottom (and its corresponding search for ever-decreasing wages) may be exhausting itself, with more emphasis being placed on:
o In order to manage reputation risk and improve quality, lead firms increasingly elect to shrink their supply chains and source from a smaller range of strategic partners who can offer a wider range of services;
o In order to manage market risk, fast fashion and guarantees on delivery times and dates have become more important considerations. The rise of Asian intermediaries and freight forwarding companies, and the expansion of the services and guarantees they offer is a great advantage to suppliers in their service area, and a disadvantage to suppliers and workers in other regions (such as Africa) where exporters with smaller volumes and longer delivery times are unable to benefit from consolidators, trans-loading, and air-sea freight combinations to the same extent.
• The overall lack of new facilities built in supplying countries suggests that post-quota shifting is giving way to a period of regional concentration; post-MFA the export industry is concentrating in fewer leading exporting countries. This globalization is currently also restructuring traditional north-south trading patterns, and increasing the south-south linkages, especially with the rise of the BICS.

13
Governance
• Attitudes toward state intervention more broadly are changing. Lead firms and suppliers, in particular, are increasingly arguing that many of the responsibilities and costs for social upgrading should be shared. Private governance alone cannot address the complexities of industrial relations in global value chains. In their view, the state, in particular, should play a larger role in creating a ‘supporting environment’, including functioning policies on infrastructural and finance support, health and safety regulation, minimum wage controls, business information and technology services, education, testing, and training programmes. Trade and professional associations, NGOs, and international standards organizations are also now recognized as having a much more important role than would have been conceded a decade ago.
• State policies have been of particular importance in some countries. In China and Vietnam the state invested heavily in infrastructure and workforce training. In Bangladesh early on the government created special financing and tax supports for the industry. In Cambodia the state collaborated with the ILO Better Factories Program, and in Sri Lanka public-private cooperation emerged around ethical sourcing initiatives.
• Countries have benefited the most in terms of social/economic upgrading in the apparel industry when they have enacted proactive governance and regulation policies (e.g., China’s labor reforms). However, policy recommendations that argue for state-supported mechanisms of governance and regulation must take into account the political and economic unevenness in the capacities of states to enact policies; it matters that China can enact more forms of governance than Guatemala.
Economic and social upgrading
• Both private and public social upgrading initiatives must take into account the policy environment in which trade policies often constrain integrated and sustainable regional production system, locking suppliers into lower value parts of the value chain.
• Social upgrading is constrained by the globalized and fragmented structure of GVC production. This fragmentation and the embedded limitations on the development of upstream and downstream capacities across the value chain are significant barriers to social upgrading.
• Integrated apparel factories (i.e., those that include yarn, fabric, dyeing and/or embellishment capacities) carry more advantages than disaggregated production networks, yet disaggregation will likely continue with “race to the bottom” cost reduction strategies and nomadic sourcing techniques.
• Supply chain concentration and the development of strategic partnerships between buyers and suppliers are seen, by buyers, to be essential to stabilize contracting, reduce uncertainty and upgrade the quality of product and work.
• Buyers’ demand for faster turn-around times has highlighted logistical advantages and disadvantages for suppliers based on geographic location and the enabling environment,

14
leading to the deployment of different technologies and strategies (i.e. air freight as opposed to ocean freight).
• A recurring theme in the country case studies of successful economic and social upgrading is the extent to which each apparel industry in a country was, or was not, able to mobilize upstream and downstream linkages (often supported by the state) to its benefit. In the absence of such linkages, the only option is often reliance on export and/or domestic markets.
Trade policies and trade rules
• Quota removal led to a “race to the bottom”: a structure of global apparel production, employment, and trade based on ‘nomadic sourcing’ in search of low costs. The result of squeezing contract price has benefitted lower-wage, higher-capacity suppliers (such as those in China) and has had disastrous consequences for workers in regions unable to complete on price or where price has been met by sweating labour and reducing investments in wages and working conditions.
• The impacts of trade liberalization and quota removal have been heavily mediated by unilateral and preferential trade agreements; RTAs, ROO, bilateral agreements, and differential duties and tariffs. The proliferation of agreements and the complexity of trading regimes and rules led to differentiated growth patterns in low-income countries, sometimes leading to production booms.
• Trade preferences remain critical for employment but do not guarantee decent working conditions:
o Preferential access can lead to growth booms (as in Bangladesh), but in some situations rapid growth is unregulated, leading to poor working conditions or disastrous unregulated factory over-building.
o Uncertainty around preference renewal and delayed renewal has been disastrous for suppliers whose orders are preference dependent but which must be placed six to eight months in advance.
o Social clauses (e.g., AGOA), supply chain transparency and early policy renewal are vital.
• Restrictive rules of origin in preferential market access agreements benefit textile exporters
but disadvantage apparel exporters. Locked into assembly-only contracting, options for economic and social upgrading are extremely limited.
• Uncertainty around changes in policy can lead to massive over-capacity in some regions threatening apparel worker livelihoods.
• End markets are crucially important for suppliers. Suppliers’ trade preference dependency on specific end markets can be a double-edged sword for the suppliers and their workers. For example, EU and US end market requirements differ significantly. Differences in the size of order, timing of delivery, the relative balance among timing of delivery, volume, quality, penalties for delays, and price, as well as differences between currency exchange rates are all important in shaping the practices of value chains.

15
• Dependency on rich country markets is highly concentrated geographically: Latin American producers (especially DR and Mexico) are heavily dependent on the US; and African producers are heavily dependent on Europe, except for AGOA preferences for the US market and the growing internal African market.
• Trade liberalization has not led to a more simplified global trade regime because of the many regional free trade agreements and bilateral agreements. With quota removal, a more complex, varied, and geographically uneven trade regime has emerged. Despite the conclusion that preferential access agreements had ambiguous effects globally and did not always benefit low-income countries (e.g., Sub-Saharan Africa), some examples of success have been the result of a rich country’s grant of political favour, either as humanitarian gestures (Haiti’sHOPE/HELP) or because of geopolitical interests (QIZ in Jordan and Egypt).
• Despite the recent shift of sourcing to South-East and South Asia, China remains the main beneficiary of post-MFA trade policy.
• The Trans-Pacific Partnership negotiations may put an end to two assumptions about global apparel trade:
o The support of, and protection for, the US textile industry is essential for apparel trade agreements to pass the Congress.
o Free trade agreements increase trade liberalization, which directly benefits the US. TPP Plan A will benefit every member and it will reduce guarantees for US suppliers and create large benefits for other members such as Vietnamese textile and apparel manufacturers.
1. Trends in apparel global value chains 1a. Background The apparel industry is one of the most globalized of all industries, global apparel exports currently total around US$350 billion and contribute substantially to national export earnings, and apparel production for export employs tens of millions of workers worldwide, particularly women in low-income countries. At the same time, the globalization of apparel export production has been one of the major triggers of poor working conditions and a significant cause of regional wage depression. In recent years, intensification of competition, increasing industry and governmental regulation, and expanded volatility and uncertainty in markets have combined to create new and important dynamics in the organization of global apparel industries. On the one hand, quota removal has expanded the range of opportunities for footloose sourcing, which in turn has expanded employment opportunities in some regions, but often at the cost of more widespread predatory employment practices, feminization of work, and depressed wages. For Tewari and Nathan (2010: 3):
…the garment industry is Janus faced. Its trajectories of upward mobility are shot through with systemic vulnerabilities and well known forms of exploitation. These include poor working conditions, low wages, persistent use of child labor, lack of social protection, gender-based discrimination in compensation and skill acquisition, and unbridled environmental

16
damage through toxic effluent discharge and the use of harmful dyes and chemicals. The sector’s industrial organization also encompasses the spectrum of organizational forms, from high-end corporate exporters at one end to small informal firms and unprotected home-based workers at the other. These opposite extremes are often intricately connected through complex webs of inter-firm linkages and overlapping production networks.
The marginal gains from squeezing labour costs are increasingly being reached geographically and socially in terms of to where and how low the floor wage can be pushed. As a result, many buyers and suppliers have shifted their attention to the relative costs of inputs, logistics, or distribution. Cost pressures remain and, for others, the consequence is to further squeeze wages and working conditions, often through the turn to higher levels of casualization and contracting for temporary or secondary workers. Suppliers striving for or being pushed to adopt high-road strategies are upgrading technology, improving management practices, design work, and working conditions. These low and high roads to competitiveness are occurring in parallel, often in the same region and certainly across regions. Precisely how these trends affect particularly suppliers and groups of workers depends in large measure on specific product types and buyers. Increasingly, global value chains are being customized for different products and buyers. In practice, there are many of these, but three illustrate the key differences:
• Lower quality, mass-market, price-driven, nomadic sourcing. • Fast fashion dependent on skills, speed, flexibility, quality, and compliance. • Luxury, technical, and brand sensitive products.
For those firms able to benefit from a high road strategy for competitiveness, changing consumer needs and competitive market pressures have led to a re-assessment of the importance of social upgrading and mature industrial relations in contemporary apparel global value chains. If the first two decades of globalizing apparel value chains were largely focused on managing costs through wages, there is increasing evidence that apparel GVCs have: (i) squeezed wages to their limit; (ii) turned the attention of buyers to other avenues of cost management (particularly logistics and end-market selection); and (iii) recognized the increasing importance of the business case for investing in wages, working conditions, environment-friendly production, and worker engagement. Today the industry is increasingly characterized by:
• Continued disaggregation of the production process; • Consolidated role of branded buyers and retailers; • Ever larger proportions of apparel trade taking place through global value chains; • High mark-ups and low manufacturing margins; • Highly competitive consumer markets; • Increasing input prices, energy costs, and upward pressure on wages; • Demands from buyers for expanded services and creation of strategic alliances between
buyers and suppliers to meet them; • Technical and organizational innovation in production; • Technological and organizational advances in global logistical services and retail
management; • Speed-up, fast fashion, and demand management, and the expansion of lean and quick
fashion manufacturing to former mass assembly suppliers;

17
• Increasing organizational and geographical concentration, with the world’s top ten exporting countries accounting for at least 85% of total exports, with China accounting for over one third of all apparel exports;
• Firm consolidation within domestic sectors; • The entry of new network organizers in the global South; • Growing influence of first-tier, full-service suppliers and intermediaries; • Increasing claims by states and workers on the rents generated from export production; • New opportunities for bargaining over, and reasons to invest in, social upgrading; • Expanding roles for state regulation of product standards and worker health and safety.
These patterns of global production, employment, and trade have been shaped by a wide range of industrial, regional and labour market policies at the national level and by trade policies at both national and international levels. Quotas, safeguards, anti-dumping measures, rules of origin and preferential tariffs have all been important in this process. Buyers and suppliers have responded to coordinate their activities in various ways under the resulting policy rules. Those buyers and retailers with the capacity to respond quickly and flexibly have been able to arbitrage their sourcing among supplier countries and firms. Suppliers have been buffeted in the process and, with the end of quotas, supply chains have become increasingly concentrated in particular regions and around specific types of firms, while less well-placed producers have seen orders and employment decline. In other regions sourcing has increased rapidly, resulting in expanded production and employment opportunities, along with changes in the social conditions of work. Countries such as China, Vietnam, Bangladesh, and Pakistan have seen export production and jobs for low-income women expand rapidly. In many communities, workers have benefitted from job growth, while in others the consequences of expansion have been disastrous (see Box 1.1). At the heart of these policies have been historically protected domestic textile industries and more mobile (and often poorly supported) apparel producers. The resulting outsourcing patterns that developed comprised intra- and inter-regional production networks and ever more important complex regional divisions of labour. In any one region, the apparel industry has always comprised low and high road firms, offering lower or higher wages in poorer or better working conditions. Any generalization must, as a result, be careful not to overlook the ways in which these low and high road strategies operate synergistically in the industry, usually in the same regional economy. More globally, apparel value chains have undergone several major organizational and geographical shifts in the past fifty years. As Gereffi (1999) and Gereffi and Frederick (2010) point out, all have involved Asia to some extent (Figure 1.1). In the 1950s and early 1960s, industrial production shifted from North America and Western Europe to Japan, with Western textile and apparel production being displaced by a sharp rise in imports from Japan. The second supply shift was from Japan to the ‘Big Three’ Asian apparel producers (Hong Kong, Taiwan and South Korea), which permitted the latter group to dominate the global textile and apparel exports in the 1970s and 1980s. As a result of MFA, the quota regime of the 1980s and 1990s encouraged a rapid expansion of production beyond the Asian Big Three to a large number of other developing countries. With the phase-out of the MFA in 2004, the subsequent principal shift was to mainland China, but also to Southeast Asian and South Asian countries, such as Cambodia, Vietnam, and Bangladesh.

18
_________________________________________________________________ Box 1.1. Karachi apparel factory fire On 12 September 2012 over 260 apparel factory workers died in one of Pakistan’s worst fires. For the entire four floor factory, only one door was unlocked and lower floor windows were barred. Commentators blamed the lack of regulatory enforcement, although SAI had certified the factory a few months prior. The underlying cause was the untrammeled expansion of export production in recent years. With rapidly expanded opportunities to capture rents from export markets, manufacturers in Pakistan and Bangladesh extended factories, added machines and workers, and increased their production in a largely unregulated manner. In 2011, apparel export production contributes 7.4 percent of Pakistan's GDP, employed 38 percent of the manufacturing sector workforce, and accounted for 55.6 percent of total exports.
_________________________________________________________________ On a regional scale, parallel processes were at work in all the major producing regions and markets. In Europe, the delocalization or regionalization of apparel production in Europe occurred at three scales. First, within nation-states (e.g., UK) the search for lower cost production locations led to the establishment of branch plant factories in peripheral regions such as Northeast England and Northern Ireland from the 1970s onwards. Second, between countries within Western Europe, a new international division of labour developed from the 1970s as labour-intensive activity was relocated to Southern Europe from the North. Third, and more recently within the wider European and Euro-Med region, outward processing custom arrangements (also known as outward processing trade (OPT)) enabled the development of assembly production networks in Eastern and Central Europe from the late 1970s and early 1980s on (Pickles and Smith (2011). At the heart of these inter-regional shifts are trading systems dependent on yarn and fabric from northern suppliers and buyers seeking out low-wage stitch-up in southern countries. The top ten exporters of textiles and clothing in 2010 were China, EU(27), India, Turkey, Bangladesh, USA, Vietnam, South Korea, Pakistan, and Indonesia, with these and lesser exporters organized into intricately enmeshed export-import relations that link relatively new centres of production in the global South and centres of consumption in the global North. The export-import networks that have emerged include:

19
Figure 1.1. Industrial upgrading by Asian economies in the apparel value chain
Source: Gereffi and Frederick (2010: 40).
• Triangular trade arrangements between the USA, Asian NICs and lesser developed Asian countries, and within Sub-Saharan Africa,
• Outward processing trade (OPT) between Western and Eastern European countries,
• Production sharing between the US and Mexico and Caribbean Basin Initiative countries.
As Table 1.1 illustrates, these broad regional patterns tie low-income exporting countries to high-value importing countries. As a result, the share of apparel exports as a percentage of total manufacturing exports for lower-income countries is very high; 6.6 percent for Asian countries, 7.3 percent for Latin America, and 9.9 percent for Africa and employment generation has been critical to individual livelihoods and national economies. At the heart of those patterns of production, employment, and inter-regional trade are a series of structuring trade policies.

20
Table 1.1. % share of clothing in trade in manufactures by region, 2010 – top four exporters and importers
__________________________________________________________________
Exports Imports Share in manufactures World 3.5 3.5 North America 0.8 4.7 South and Central America 7.3 2.2 Europe 2.7 4.2 CIS 1.3 5.8 Africa 9.9 2.4 Middle East 1.7 3.0 Asia 5.4 1.8 Australia, Japan and New Zealand 0.1 6.1 Other Asia 6.6 0.8
Note: Import shares are derived from the Secretariat's network of world merchandise trade by product and region.
__________________________________________________________________ 1b. Research issues The goal of this paper is to clarify the degree to which trade policies enable or limit economic and social upgrading and downgrading in apparel global value chains. A forthcoming paper will focus on private governance mechanisms and the ways in which competitive pressures and bargaining among different actors in and beyond value chains shape the patterns of economic and social upgrading. At the heart of the research are four main issues:
• Public governance and labour standards. Exploring how public governance initiatives such as changes in trade policy and the content of trade agreements, state initiatives, or the ILO’s Better Work programme can help improve working conditions in apparel global value chains. How can better labour standards be promoted through trade partnerships (e.g. the US-Cambodia Textiles Agreement)? What roles are emerging for governments in supporting suppliers and workers?
• Private governance and the changing role of buyers, retailers, suppliers, and labour. Examining how buyers (brands, traders and retailers) can deal more responsibly with suppliers in low-income countries. What strategies are needed to address falling prices and ‘just-in-time’ buyer requirements? What role for companies, civil society and international organizations?
• Rising Powers – Brazil, India, China, South Africa (BICS). What are the effects of the
emergence of the BICS as either new centres of production or consumption (or both)? What new roles are Asian-based regional intermediaries and agents playing in

21
concentrating control in poorer countries? Are emerging consumer markets likely to demand similar or different standards from suppliers in the new value chains? What are the implications for labour? What strategies can support decent work in new regional production networks in Africa, Latin America, and Asia?
• Crisis and adaptability. What are the effects of supply chain and market disruptions on
the organization and practices of the apparel sector? Specifically, what have been the effects of the financial crisis after 2007? Have countries with full cotton-textiles value chains emerged stronger from the crisis than those specializing solely in apparel manufacturing? How have currency fluctuations impacted on global production and trade?
By ‘governance’, we refer to institutions that constrain or enable market actor behaviour – both in the public sphere, in the form of governmental policies, rules and regulations, and in the private sphere, in the form of social norms, codes of conduct adopted by businesses, consumer demand for social responsibility, or other non-governmental institutions and social movements. Throughout, we have worked with the CtG definition of economic and social upgrading where economic upgrading refers to
the process whereby firms improve their position in terms of value-added and productive capacities within value chains. Social upgrading refers to improvement in the terms, conditions and remuneration of employment and respect for workers’ rights, as embodied in the concept of decent work (Barrientos et al. 2011).
Together these often refer to forms of inclusive growth which presuppose a kind of virtuous circle in which improvements in one leads to improvements in the other (economic upgrading leads to social upgrading or social upgrading leads to economic upgrading). This is the business case for CSR and other forms of workplace improvement. However, relationships between the two forms of upgrading are not always straightforward. In globally competitive markets, upgrading is always a relative indicator; thus, improvement in the economic or social conditions of one actor is always – by definition – a downgrading of the relative status of other actors, even those where conditions have not changed at all. Moreover, such relative improvements may give that actor added competitive advantage in contracting, leading directly to negative impacts on its competitors. In general, our research suggests that economic upgrading can but does not automatically or inevitably lead to social upgrading, and that economic upgrading can lead to social downgrading, and vice versa. We focused on four general aspects of social upgrading:
• Social upgrading in terms of quality AND quantity. How many jobs, but also of what type and how sustainable are they?
• Employment increases and whether they come at the expense of job loss elsewhere? Is this expanded production or regional shifting?
• What kinds of jobs are being created and whether these are legal/fulltime or part-time or temporary/contract jobs? In earlier work on Central and Eastern Europe researchers showed how expanded CMT jobs came at the expanse of the collapsing full-package fully-integrated industry, leading to job growth but lower aggregate wages. In this process, more limited industrial opportunities were achieved as inputs suppliers collapsed, technical skills

22
were lost, training centres closed, and regional integration was replaced by buyer-supplier contracting.
• Standards and code compliance are important, but not sufficient to capture whether the quality of work is improving or declining.
We suggest, therefore, that any assessment of the relative roles of economic and social upgrading in global apparel value chains must begin with five linked processes. First, the apparel industry has historically been an important generator of employment, often in regions where alternative forms of waged work were limited. It also often generated poor working conditions. Assumed to be a low-skill, predominantly female, low wage industry, it gave its name to the ‘sweatshop’, the production system dependent on the exploitative employment of women and children in despotic conditions of poor working environment and low, or non-, payment of wages. Despite the technical demands of industrialized systems of stitching and embroidery, and the physical demands of long, often overtime, hours in the factory, apparel work has traditionally been labelled as low-skill and low-wage, and has been the flashpoint for child labour and workplace abuses, generating what Doug Miller (2012) has recently described as ‘a sense of moral outrage at the super exploitation and gross undervaluation of garment assembly’ wages and work in an internationally outsourced multi-buyer make-to-order industry. The predominance of low barriers to entry, low start-up costs, and locational mobility in conditions of intensely anarchic market competition and aggressive sourcing and contracting practices has internationalized this model of low-pay, feminized workforces, and despotic control over production processes and labour time in the factory (see Wright 2006). The footloose and mobile nature of the industry has compounded this problem, leaving behind large-scale unemployment in regional economies from which manufacturing and contracts have been withdrawn. Second, apparel workers have historically been at the forefront of organized or sporadic struggles for collective rights against long and irregular working hours, poor and sometimes dangerous working conditions, poor wages and benefits, and physical abuse and violence. Organized garment worker movements have taken the lead in struggles over national minimum wages, standard working hours, and basic health and safety standards. Sporadic worker resistance has often been met with decision to relocate production to non-union regions, whether this was to non-union states in the American South or to new low-cost labour markets in the developing countries of the global South. Until recently, the process of apparel production has remained relatively standardized, technologies were easily transferred from one region to another, and machinery (mainly sewing machines) typically had a half-life that was double the working lives of its operators. Today, the industry is one of the most globalized labour-intensive manufacturing sectors. Third, apparel manufacture has also been an important generator of employment, particularly for women and especially in regions where waged work was formerly not available to women or where ‘male employment’ (mining, heavy industry, and other forms of manufacture) was dominant (Begg, Pickles and Smith 2003). Some argue that these jobs – the above conditions notwithstanding – are ‘good’ jobs compared with the alternatives. Certainly, there is some evidence that even the sub-living wages paid in the industry contribute to poverty reduction (see Yamagata 2006; De Hoyos, Bussolo, and Núñez 2008; Robertson et al. 2009). Lopez-Acevedo and Robertson (2012), in particular, stress the importance of the global apparel industry as an employer of female workers, arguing that:

23
The focus on women and women’s wages is especially important given that increasing female income improves survival rates for girls (Qian 2008). Furthermore, paid employment opportunities for women are particularly important for poverty reduction because, all else being equal, women are more likely to be poor than men. When women work, fertility rates fall and their talents contribute to GDP, generating efficiency gains and higher per capita growth rates.
Fourth, the globalization of apparel production and the geographies of trade that have resulted are driven by distinctly different inter-firm contracting arrangements. Apparel has been the archetypical global value chain led by buyer and increasingly retail lead-firms, in which inter-firm bargaining and contracting takes place within the bounded horizon of specific value chains. But, apparel has also been driven by thousands of smaller buyers and suppliers operating on individual contracts, sometimes renewal over time, sometimes as one-off orders. The interactional effects of these lead-firm-driven value chains and individual buyer-supplier contracting proliferate the economic and social conditions in the industry, and shape the opportunities for upgrading. In this sense, costs are always comparative in changing networks of actors. Fear of under-cutting is strong. And industry wide initiatives are extremely difficult to coordinate. Fifth, the growing dependence of global apparel trade on value chains has important indirect consequences. As Cattaneo et al. (2010: 9) have pointed out, recent work on global value chains and the economic crisis has suggested that one of the reasons that the 2008-09 crisis globalized so rapidly– as opposed to a primarily regional one, with some global implications in selected regions (e.g. the Asian financial crisis of 1997) – was due to:
the role of trade in the transmission of the economic crisis [which] was heightened by the predominance of business models based on global production and trade networks …. Specifically, GVCs [global value chains] can partially explain the apparent over-reaction of international trade to the financial crisis (Cattaneo et al. 2010: 9).
Global value chains and global production networks therefore highlight the heightened interdependencies in the global economy and as such have become transmission belts for the economic crisis globally. For all these (and other) reasons, the textile and apparel industry has also been among the most politicized of industries. National- and international-level lobbying by manufacturers and retailers has been intense, although not always coordinated. Textile manufacturers in particular have been very active in protecting national industries, while emerging economy governments have lobbied hard for preferential access to major markets. The resulting fragmented system of production, distributed across many countries, is both highly footloose and organized within strict constraints (trade conditionalities), with real consequences for the actual paths for economic and social upgrading available to many producing firms and countries. 2. Structure and dynamics of apparel global value chains The apparel value chain is organized around five main segments (Figure 2.1):
• raw material supply, including natural and synthetic fibres; • input supply, such as yarns, fabrics, buttons, thread, labels;

24
• manufacturer, including their domestic and overseas subcontractors, as well as embellishers (such as embroidery, printing, washing) as needed;
• export channels, sometimes managed by intermediary trading companies (such as Li and Fung) and always organized through logistics freight forwarding companies;
• marketing and retail.
Figure 2.1. Apparel production system
Source: Gereffi and Memedovic (2003) Over time, the national structure of manufacturer-driven value chains has given way to increasingly fragmented production systems in increasingly globalized buyer-driven and retailer-driven value chains (Gereffi and Frederick, 2010; Gereffi and Memedovic, 2003: 5). In the process, some lead-firms that control design, branding, and marketing have been able to exercise strong control over sourcing decisions, and hence over how, when, and where specific parts of the production process will take place. In so doing, lead-firms have been able to control where value is extracted and to whom profit accrues at each stage, essentially controlling how basic value-adding activities are distributed along the value chain (Fernandez-Stark, Frederick and Gereffi 2011). In other cases, buyers elect not to micro-manage their input sourcing, an intentional ignorance of upstream supply chains that allows them to avoid direct accountability. At the same time, yarn and fabric manufacturers in major markets have also been able to shape national trade policies to protect their markets in increasingly global assembly chains, and to do so they have supported restrictive rules of origin in nearly all preferential market access agreements. For Fernandez-Stark, Frederick and Gereffi (2011: 7) the apparel industry is:
the quintessential example of a buyer-driven commodity chain marked by power asymmetries between the suppliers and global buyers of final apparel products. In the buyer-driven value chain, global buyers determine what is to be produced, where, by whom, and at what price. In most cases, these lead firms outsource manufacturing to a global network of contract manufacturers in developing countries that offer the most competitive rates. The lead firms that drive this process include retailers and brand owners and are typically headquartered in the leading markets – Europe, Japan, and the United States. These firms tend to perform the most valuable activities in the apparel value chain – design, branding,

and ma glo
In this paphave beenmanufactuyarn and fassembly wupgrading functions, remaining North. Thimean – in of the valuof fabric, yfew opportregional trdevelopme
marketing oobal network
Fig
per, we argun producedring interesfabric forwawork that hin apparelocal supppartially or
is is importadifferent coe chain tha
yarn, and dytunities for rade agreeent of local y
of products k of supplie
gure 2.2. Pr
ue that the sd by such sts in the Uarding ruleshave globall in these pliers in lor entirely dant in underountries. Wt can be de
yeing proceregional ec
ements as yarn and te
– and in mors. (Figure
roducer-dri
Source: Ger
specific typebuyer-driv
US and EU s in trade aized and prlocations.
ow-income dependent orstanding w
Where theseeveloped locsses, limit oconomic upAGOA is
extile capaci
ost cases, t2.2)
iven and bu
reffi and Fred
es and geoven chains
through traagreements resents the With the countries
on input suwhat econome conditionscally, and thopportunitiepgrading. Ualso to indities.
they outsou
uyer-driven
derick (2010
graphies ofhave bee
ade policy. that both e
e greatest cconstrainedhave only
upply relatiomic and soc apply the r
he absence es for upgraUp to a poduce low-in
urce the ma
n value cha
)
f productionen tightly c
It is this rexplains the
challenge tod outsourc
y the advaons with tecial upgradiresulting coof the direc
ading to assint, the secncome cou
nufacturing
ains
n and emploconditionedresidual doe patterns
o economic ing of only
antage of extile exporng means –
onstraints onct and indiresembly prodcondary effeuntries to s
25
process to
oyment that by textileminance ofof stitchingand social
y assemblylow-wages,rters in the– and couldn the rangeect benefitsduction withect of suchsupport the
5
o
t e f
g l
y
e d e s h h e

26
Any evaluation of the changing processes of economic and social upgrading in apparel thus depends on an assessment of the effects of these historical shifts in both textiles and clothing as the industry moved away from vertically integrated manufacturing to the functional decomposition of production. Lead firms and network organizers currently play the dominant role in GVC dynamics and private governance, but textile manufacturers and national governments have historically dominated the specific forms of public governance and trade policies that underwrite the global apparel industry. Yarn and fabric suppliers and national governments regulate value capture through GVCs, but they also do so much more directly through the political struggle over rules of origin and the setting of tariff and duty rates on specific products. In this way, Gereffi’s account of the shift from the manufacturer-driven to the buyer-driven value chain is re-embedded in terms of the broader regulatory governance mechanisms that shape the particular forms of buyer-driven chain fragmentation and outsourcing. This geographical decomposition of production and the resulting expansion of trade have thus had several important contradictory impacts simultaneously leading to:
• Aggregate employment and wage growth (Millberg and Bernhardt 2011). • Reduced unit costs of export production allowing for greatly expanded circuits of
consumption in major markets, growing markets in the global South, but firm limits on wage growth in apparel assembly platforms.
• The disembedding of apparel production from integrated textile and clothing complexes, established industrial labour relations, and strong health and safety state institutions.
• Distributed responsibility for decent work across a much broader range of actors, many of whom are ill-equipped to facilitate social upgrading.
• The rise of publicly traded branded buyers and retailers with ever shorter financial horizons as the key lead-firm in the management of these circuits of trade and value.
• Limited or no local or regional capacity for the development of backward linkages into yarn and fabric manufacture.
• Limited capacities to capitalize on local cotton and wool production. As we assess changes in industry practices and trade policy we will need to explain how different organizational forms, patterns of ownership, and degrees of local and institutional embeddedness affect the opportunities for economic and social upgrading. 2a. Social consequences of the disaggregation and globalization of production The rise of the buyer-driven value chain is, at root, the disaggregation of formerly vertically integrated production systems and the allocation of tasks geographically and temporally to capitalize on regional cost differentials including labour costs, input prices, specialized skills, and/or services. As the proportion of trade conducted through value chains has increased, the complexity involved in managing this kind of disaggregated global sourcing has increased and lead-firms in the industry have become more visible and more strategically important. The ability to capture value in this way depends on the disaggregation and disembedding of value circuits within buyer-driven chains. It is the organizational and geographical separation of distinct value-adding activities that sustains the lead firm’s powerful role in the value chain (Gereffi and Frederick, 2010) (see Box 2.1). The ways in which part of the value chain is organized and by

27
whom has direct consequences for the creation and capture of value, and for the conditions of economic and social upgrading or downgrading that result.
Box 2.1. Value adding activities in global apparel value chains (Source: Gereffi and Frederick 2010)
(1) Research and development: This value-adding function includes companies that engage in
R&D, as well as activities related to improving the physical product or process and market and consumer research.
(2) Design: This stage includes people and companies that offer aesthetic design services for products and components throughout the value chain. Design and style activities are used to attract attention, improve product performance, cut production costs, and give the product a strong competitive advantage in the target market.
(3) Purchasing/sourcing (Inbound): This stage refers to the inbound processes involved in purchasing and transporting textile products. It includes physically transporting products, as well as managing or providing technology and equipment for supply chain coordination. Logistics can involve domestic or overseas coordination.
(4) Production/assembly/cut, make, trim (CMT): Apparel manufacturers cut and sew woven or knitted fabric or knit apparel directly from yarn. The cut-and-sew classification includes a diverse range of establishments making full lines of ready-to-wear and custom apparel. Apparel manufacturers can be contractors, performing cutting or sewing operations on materials owned by others, or jobbers and tailors who manufacture custom garments for individual clients. Firms can purchase textiles from another establishment or make the textile components in-house.
(5) Distribution (outbound): After apparel is manufactured, it is distributed and sold via a network of wholesalers, agents, logistics firms, and other companies responsible for value-adding activities outside of production.
(6) Marketing and sales: This function includes all activities and companies associated with pricing, selling, and distributing a product, including activities such as branding or advertising. These companies frequently do not make any physical alternations to the product. Apparel is marketed and sold to consumers (via retail channels), institutions, or to the government.
(7) Services: This includes any type of activity a firm or industry provides to its suppliers, buyers, or employees, typically as a way to distinguish itself from competitors in the market (e.g., offering consulting about international apparel businesses or fashion trends).

28
In this process, value in globalized value chains has increasingly been captured by input suppliers (primarily yarn and fabric), up-front and end-market services; research, development, design, marketing, and retail services (Figure 2.3). Actual assembly operations (primarily stitching and embellishment) and logistics costs have been squeezed and the main actors have had little positional or negotiating power vis-à-vis the lead firms (Frederick and Gereffi 2011). This fragmentation and globalization of each segment has prevented backward and forward linkages emerging in many low income countries. As a result, returns to capital have increased while returns to wages have generally declined. In this process, lead firms (and increasingly retailers and network organizers like Li and Fung) have played increasingly important coordination roles in managing production and delivery, and in turn have been able to capture a larger proportion of total chain value.
Figure 2.3. Apparel value chain and associated services
Source: Gereffi and Frederick (2010).
With hindsight, it was perhaps inevitable that global sourcing and value chain fragmentation would lead to loss of tight control over production and working conditions. As production was outsourced to ‘stitch-up’ shops work was deskilled and assembly firms were separated organizationally and geographically from other value-generating parts of the value chain (design, yarns, fabrics, dyeing, and marketing). Suppliers and their workers have, as a result, become the weakest actors in GVCs, increasingly trapped in conditions of input and order dependency, hand-to-mouth contracting, and subject to footloose sourcing practices. As secondary and tertiary sub-contracting expanded across many supplier networks in different countries, workplace conditions deteriorated. In this context, there are very limited opportunities for economic and especially social upgrading. Terry (2008) has argued that:
Apparel companies' relationships with contract manufacturers in low-cost countries have historically been transient. Deals sometimes last only a few months as brands continuously pursue the lowest cost. On average, one-third to three-quarters of an apparel company's contractor portfolio turns over every year.

29
The result was exploitative and, at times, despotic production practices. Opinions differ widely on the value of waged work of low quality in settings where other waged employment is lacking. However, few would disagree with Gereffi and Mayer (2006) that the emergence of global value chains resulted in a governance deficit with resulting difficult working conditions for many. The structure of GVCs has generated its own pressure for improved working conditions. Lead firms that emerged through chain fragmentation were also increasingly vulnerable to the behaviour of their suppliers and the concerns of their consumers. The archetype of this kind of dependent global lead firm was Nike. Born global as ‘the manufacturer without factories’, the Nike brand became increasingly visible in the market place, highly dependent on its brand reputation, and vulnerable to breakdowns in its supply chain. When serious problems arose in its supplier factories and these were made visible by student, NGO, and trade union groups, the consequences were very real. Nike’s own narrative as a ‘journey travelled’ charts this initial moment of external pressure and its own defensive reaction (Figure 2.4). Nike, like other lead firms in similar situations (e.g., Walmart, Levis, GAP, Tesco), became progressively more vulnerable to brand reputation and progressively more involved in re-thinking the relationship between its economic decisions and their social outcomes, quickly shifting its own thinking and practices from seeing social problems in its supply chain as a PR problem, or later as a risk to be managed, to attempts to develop a stronger business case for ethical sourcing (from CSR to new business models).
Figure 2.4. The journey travelled
Externalforces
Codes ofConductemerge
Debate overMonitoringbegins
Corporate Governance
AndTransparencydiscussion
Remediationand impactdiscussion
Defensive ReputationManagement
StakeholderEngagement
Internalleadership
Strategicintent
The moral case The business case New business models
CR is a PRissue
CR is a RiskManagement issue
CR is aBusiness issue
CR is a radar forthe business
CR helps us Perform better as a company
Source: Nike CSR Report 2004. Adapted by author.
The journey travelled is, as a result, a metaphor for broader shifts in the struggles to re-embed global value chains in functioning regulatory regimes and to upgrade the systems, organization, and relations of production in global value chains. Today large brand-sensitive firms are adjusting the organization of their supply chain, concentrating sourcing, working with strategic partners, and making increasing use of regional agents and larger suppliers to handle a greater range of capacities, introduce cost-saving practices, and provide inventory management and other services.
Working more closely with a smaller range of strategic partners with whom buyers have good and longer lasting relationships increases flexibility for both partners; suppliers can more easily negotiate bottlenecks and unforeseen input interruptions, while buyers are able to negotiate price against other formerly intangible or hidden needs of suppliers.

30
The resulting strategic alliances with emerging global value chains among textile and apparel firms, buying and producing firms, input suppliers and service providers and exporting producers generally enhanced buyer and retailer competitiveness and encouraged new suppliers to enter the industry and to compete for orders. Inter-firm, intra-value chain strategic alliances encouraged country and region-specific specialization, particularly around quota-driven CMT manufacture for export. That these alliances emerged within global value chains meant that CMT suppliers were generally very weak partners in the alliance, often being dropped as contracting, product, and cost needs changed. But it also meant that value chain participants (especially CMT suppliers) gained experience from assembly production that – in some cases – allowed spring-boarding into more complex tasks, production functions, and/or product mixes. Economic upgrading from input sourcing to product design, marketing, and shipping) added value in production and has allowed some firms to upgrade beyond the CMT business (Knappe 2002). The integration of clothing producers and workers in various parts of the world economy into export-oriented production networks has produced an extensive literature (see, for example, Begg et al 2003; Leslie and Reimer 1999; Smith et al. 2003; Bair 2005, 2009). As Bair (2005) notes, however, the earlier focus of much of this work on global commodity chains has more recently shifted towards analysis of the way that value chains are organized and governed, and a consideration of the implications for industrial upgrading (see Sturgeon 2009; Gereffi et al. 2005). In this later literature a primary focus has been on the mechanisms whereby firms and industries engineer a process of industrial upgrading within global value chains to capture additional functions in supply chains which generate higher value added. Humphrey and Schmitz (2002), for example, distinguish between four types of upgrading in global value chains: product, process, functional and chain upgrading.
functional (moving to higher-value functions); product (producing higher-value products); process (incorporation of more sophisticated technologies into production
and/or re-engineering production lines, such as in lean manufacturing); and chain (leveraging expertise gained in one industrial sector to enter a new
sector. Product and process upgrading involve firms retaining their position in a chain by enhancing productivity gains through adopting new production processes or new configurations of product mix (see Box 2.2). Functional upgrading involves a movement ‘up’ the chain into newer, higher value added activity, such as full package and own design/own brand manufacturing in the clothing sector. Chain upgrading involves a movement into new activity which may also imply higher skills and capital requirement and value added (see also Milberg and Winkler 2010). The shift has also led to the need to expand factor-based costing by taking a broader range of costs into account (including reputational costs and the costs of damaged or delayed product). Buyers in turn have been able to demand higher quality, faster turnaround times, and a wider range of services at the point of production while also driving down unit prices. Suppliers with lower unit costs, larger capacities, and broader range of services were generally able to out-compete those suppliers with higher fixed costs, weaker bargaining power over input suppliers and workers, and better service to buyers. Gereffi and Frederick (2010) have suggested that retail consolidation is further enhancing the ability of major global retailers, brands, and manufacturers to control their supplier networks. In this shift, supply chain management becomes much more centrally focused on the costs of delivery time, delay, inventory, lead-time, the percentage of blind-
31
buys,6 etc., and buyers have become much more interested in changes in supply chain management that maximize their abilities to control costs, improve quality and delivery times, and enhance flexibility throughout the process. To manage these new value chain demands lead-firms continue to expand in size, market dominance, and global reach. Major buyers such as Nike and GAP have been concentrating their supply chains around fewer, larger strategic partners who can offer more services and assist in their broader goals of managing costs and efficiency. The result has been a rapid reduction in the number of suppliers and an increase in the capacities of those remaining in the supply chain. Paralleling this concentration of supply chains around strategic partners is the careful management of a diversified portfolio of vendors and regions to reduce over-dependence on strategic partners and fewer suppliers. In this process of adjusting buyer-supplier relations around better work, the complex demands of global sourcing and the pressures for economic and social upgrading also mean that business attitudes towards state intervention in the industry are changing. If the 1970s-1990s were typified by calls for the withdrawal of the state from the economy and the privatization of codes and standards, these recent changes in the industry have led to a new consensus that private governance alone cannot address the complexities of industrial relations in global value chains and – by extension – that the responsibilities and costs of social upgrading must be shared, with the state assuming a greater role in the provision of essential common pool resources (such as energy and logistics infrastructure, workforce development, health and safety regulations, and labour dispute mediation). Since 2008, however, austerity measures have had a devastating effect on factory inspectorates which are often the first government services to be cut.
6 Blind buying occurs where orders are placed without clear knowledge of the actual market conditions at the time of sale. Given the vagaries of consumer markets, to some extent all orders are blind buys, although the degree to which buying is blind can be reduced by improved knowledge of market conditions, staged and geographically lagged placement of orders, careful inventory management, and by shaping market demand itself.

32
_________________________________________________________________
Box 2.2. Types of economic upgrading in global apparel value chains Functional upgrading: Functional upgrading refers to the organizational structure and capacities or functions a manufacturer is able to perform. Four main categories characterize apparel manufacture. 1. CM/CMT: ‘Cut and make’ or ‘cut, make, and trim’ are the two most basic forms of apparel production, particularly in off-shore contracts. Suppliers are contracted to stitch-up fabric and other inputs according to the specifications provided by the buyer. Apparel manufacturing operations are thus limited to cutting, sewing, embellishment and trim, and shipping the ready-made garment. Fabric and sometimes trim is supplied by the buyer on a strictly order-based production cycle. CM/CMT contracts have typically been common in export processing and free-trade zones, and have usually been driven by outward processing trade agreements and preferential tariffs. 2. OEM: Own equipment manufacturers offer a wider range of production capacities and services to buyers, including limited design, warehousing, and embellishment. They may also be responsible for sourcing upstream inputs (fabric, dyeing, and trim) either from designated suppliers or from their own suppliers. The supplier also assumes responsibility for some part of the logistics chain for the finished orders, either packaging ready for pick up at the factory gates, shipped to the port, or delivery to the distribution centre in the buying country, including air freighting of any late orders. With added capacities, own equipment manufacturers may become full package suppliers, carrying out the entire production process for a given order. The shift from CM/CMT to OEM and full package has important implications for the range and depth of supply networks in the local economy, with backward linkages developing for input supplies and services such as repair, software, and embellishment. 3. ODM: Own design manufacturers carry out all parts of the production process, including the crucial design functions that enable much greater control over ordering and timing of input supplies, development of new lines and construction of samples, selecting fabric designs, and hence managing the timing and costs of production much more directly. Full-package suppliers may also handle delivery to the final customer, as well as build independent labels for domestic markets. Not only does the expanded range of capacities allow full-package manufacturers to contract for higher prices on orders, they are also better able to manage production flows, avoid bottlenecks (and hence problems such as line speed-up, overtime, and temporary work contracts). Those also producing for domestic markets are also better able to maximize their capacities, regularize work flow, and manage order fluctuations. In principle, such practices might also lead to more stable industrial relations. 4. OBM: Own brand manufacturer further expands the capacities of the manufacturer and requires the addition of research and development, design, and marketing functions. Successful OBM manufacturers thus capture a greater part of the value chain, adding the higher value segments of the chain. They may also be able to leverage their domestic-market labels into regional or global markets. Product upgrading: Functional upgrading may also lead to product upgrading, as a manufacturer’s enhanced capacity enable it to produce more complex products requiring higher levels of skill, more technical processes, and specialized knowledge. In turn, these may allow a price premium for the manufacturer and a corresponding increase in wage rates as skill levels increase. The shift from low-value garments to higher-value technical or fashion garments thus has direct implications for contract prices, wage rates, and the opportunities for enhanced inter-firm linkages and regional upgrading. Process upgrading: Process upgrading focuses on organizational and/or technical changes in the production process to increase efficiency and/or productivity. Process upgrading usually requires new investment and a focus on skill development as new machines, production processes, or line operations are changed. Increasingly, lead firms are considering the ways in which social upgrading, such as worker consultation, quality circles, payment of higher wages, and provision of social services (crèches, transport, meals) can have similar effects on productivity that capital equipment is usually assumed to have. Chain upgrading: Apparel manufacturers often exist under extremely precarious conditions of contract uncertainty, intense competition, low prices, and increased input and labour costs. With shifts in the regional economy and in international sourcing patterns, some manufacturers – especially OEM, ODM and OBM manufacturers – have shifted their production away from apparel into other sectors and value chains. Such chain upgrading includes shifts into automotive supplies (such as seat covers) or technical textiles for non-apparel uses. Chain upgrading usually increases the value of production, often requires further workforce development, and may – in turn – open up new opportunities for capital investment and new market penetration.
_________________________________________________________________ Source: Adapted from Gereffi and Frederick (2010) and Frederick and Staritz (2012).
33
2b. Changing role of the ‘supporting environment’ and the state The need for a clearer understanding of these related processes has taken on greater urgency since the onset of the global financial and economic crisis in 2008. Restructuring in the global economy appears to be further consolidating the role of value chains and the importance of tight coordination of buyers and suppliers particularly as new actors, intermediaries, and new end markets emerge in lower-income countries and emerging markets (Staritz, Gereffi and Cattaneo, 2011). The recession has increased buyer interest in having back-up suppliers in their supply chain in case some of their supplier factories experience financial difficulties in the current crisis. Many major brands are currently experimenting with new ways to by-pass retailers to sell direct to consumers, opening their own retail outlets (especially in emerging markets) and using online retailing. To better manage risk and mark-down costs, large retailers’ and fashion-shops have also reduced the number of wholesalers from which they purchase and have demanded more comprehensive lines of clothing, accessories, and footwear from them Having managed costs primarily through sourcing costs at the point of production, retailers are now focusing much more on full-cost analyses, point-of-sale costs, and demand management, and this has resulted in an intensified concentration on vendors and suppliers who offer the most reliable service.7 In this process, trading companies (intermediaries) have emerged as network coordinators and full service providers to deliver many of the additional services more hands-on sourcing demands. Apparel brands are subcontracting design, development, manufacturing, and logistics to these third parties coordinators and, in some cases, the intermediaries are themselves buying the brands. Among these third parties, Li and Fung Trading is by far the most significant. For many lead firms, supply chain concentration reduces the transaction costs of sourcing across complex networks of suppliers and subcontractors, it allows for more control over quality, fewer delivery disruptions, and reduces reputational risk from supply chain failure. With the resulting increased dependency of buyers on their strategic suppliers, it also necessitates that lead firms become much more involved in the management of production. This involvement takes one of three main forms; heightened oversight and tight conditionalities on suppliers; strategic partnerships and increased cooperation between buyers and suppliers; or outsourcing supply chain management (and even some design, marketing, and services) to such intermediaries. As a result, each stage of the value chain has become increasingly dependent on what Fernandez-Stark, Frederick and Gereffi (2011) refer to as the ‘supporting environment’ of the chain (Figure 2.5). This includes: infrastructure and finance, government networks; business, information, and technology services; education, testing, and training programmes; trade and professional associations; and NGOs and standards.
7 As with retailers in developed countries, the South African formal apparel retail sector has similarly developed a very high level of concentration within the sector. The top six retailers (Mr Price, Edcon (Jet and Edgars), Pepkor (Pep and Ackermans), Woolworths, Foschini and Truworths) account for 70 percent of the market share (Morris/Einhorn 2008).

34
Figure 2.5. Apparel value chains and supporting environment
Source: Gereffi and Frederick (2010).
These changes in the management of global sourcing have important implications for which actors in the chain have power, how that power is exercised, and to what end. To the extent that value chain jobs do become disengaged from lead firms, new jobs and opportunities for value capture arise in emerging economies. Some of these jobs require specialized skills and pay good wages. Expanded services in production also contribute to greater levels of stability in supplier contracting, with direct potential effects on the regularity of work, payment of wages, and quality of work. However, the distancing of lead firms from the production process and the administration of quality controls, workplace standards, and labour management to intermediaries and suppliers may have important consequences for workers. Apparel manufacturers and jobbers are notorious for their dependence on casual and flexible labour engaged in the low-skilled manual tasks associated with poor working conditions and low incomes. Currently the ability of governments in major exporting countries to regulate working conditions and payment of wages is limited. As a result, the effects on social upgrading of any recomposition of value adding activities and their allocation to new actors in the value chain remains an important question. How these processes will play out for workers embedded in these value chains is not yet well understood, but they may crucially affect the scope for promoting decent work in the new arena of global development. In this process, the analytical focus has shifted from an earlier emphasis on the significance for economic development of the difference between buyer-driven and producer-driven commodity chains (Gereffi 1994), to one oriented towards understanding the mechanisms whereby industrial upgrading can be achieved and to exploring the developmental implications of upgrading (Gereffi et al. 2005; Bair 2005, 2009; Tokatli 2007a, 2007b; Cattaneo et al. 2010). The concern for the developmental implications of economic upgrading is thus, in part, a question about the social effects of global value chains. To what extent do GVCs contribute to improve social welfare of workers and their communities, and to what extent are they exacerbating the problems of low-wage, highly mobile, and despotic working conditions? Much of the framing of these concepts of economic and social upgrading was developed in the context of research on the clothing sector and on the roles of different actors in the shifting economic geographies of the industry (Gereffi 1999; Begg et al. 2003; Smith 2003). More attention
35
is now directed to the variety of possible upgrading, downgrading and restructuring strategies at work in the industry; moving the debate away from a singular focus on upgrading (see Pickles et al. 2006; Smith et al. 2008; Pickles and Smith 2011). As Plank and Staritz (2009: 66) have argued, attention is required beyond the black box of the firm to consider also who benefits from upgrading: ‘Even if firms gain rewards for their upgrading efforts, the rewards may not be passed on to workers in the form of higher wages, greater job security or improved working conditions. Firm upgrading may even be based on deteriorating working conditions’. In this report, we understand social upgrading to refer to improvement in the quantity and quality of jobs and the work people are asked to perform, as well as the sustaining environment of rights and entitlements workers are able to exercise as social actors (Barrientos et al. 2011). The ILO core definition of ‘decent work’ places emphasis on the availability and enactment of rights and the existence of decent working conditions. Quality of employment comprises measurable standards that can be observed during factory visits and social auditing, including wage levels, payment of wages and social security, health and safety standards, working hours, and security of employment. Enabling rights are more difficult to measure and quantify, but they include freedom of association and collective bargaining, the right to freely choose or leave employment, non- discrimination and freedom from harassment. These rights and conditions of work are tightly connected to the structure of the GVC. Our findings strongly suggest that the effectiveness of social upgrading initiatives, whether private or public, is constrained by the globalized and fragmented structure of GVC production. Private initiatives by lead firms and public initiatives by civil society groups and national or international agencies to improve the conditions of work can only occur and be sustained within the broader determining context of international and national trade policy, much of which produces and/or reinforces the fragmented structure of GVC production and sustains systemic limits to what social upgrading can be achieved. In the next section, we turn to the role of trade policies and the extent to which different forms of trade policy encourage the integration of national apparel industries and economic and social upgrading, or the extent to which the rules of origin that protect national industries in northern markets continue to produce CM and CMT low-wage assembly platforms at the expense of any real opportunities for economic and social upgrading. 3. Governance and trade policy in apparel global value chains The globalization of apparel production and the emergence of global value chains as the primary organizational structure for the industry were driven by (i) the disaggregation of production and the geographical allocation of parts of production to specific sites and labour pools; and (ii) trade policy. These two processes were closely related. For buyers, suppliers, and workers in global value chains, the sourcing, production, and consumption of clothing is shaped as much by a myriad of complex and often technical details embedded in trade agreements, tariff structures, and customs regulations, as it is by the direct management of inputs supply, assembly, and shipping. It is through these preferential access, tariff and duty levels, and rules of origin that the politics of textile and apparel manufacturers and buyers are played out. Indeed, the textile and apparel industry has also been among the most actively involved in shaping national and international trade regulations. But it is also in these

36
bargaining arrangements that the conditions and possibilities for economic and social upgrading are developed. Three primary drivers of bargaining shape trade policy.
(1) Defensive: Textile (yarn and fabric) and apparel manufacturers in industrialized countries have fought hard to retain their primary markets, textiles as input suppliers to apparel manufacture, and apparel manufacturers as suppliers of domestic markets. As the quota system and the subsequent further liberalization of trade encouraged the outsourcing and off-shoring of apparel assembly, these stakeholders mobilized politically to ensure that US and EU textile manufacturers retained their initial advantages and remained the primary input suppliers for the sewing operations that were being relocated off-shore. The result has been a complex series of quantitative limits, safeguard actions, rules of origin, duties, and tariffs on imports exercised often differentially by the importing countries at the product and exporting country level.
(2) Competitive:
By contrast, retail and buyer associations, as well as consumer groups, have fought equally hard to liberalize trade to reduce their costs of production, maintain or reduce retail prices, and enhance competitiveness. They have been joined by manufacturers in low-income countries keen to develop their own apparel industries. Thus, while fabric and yarn manufacturers pressed for protection guarantees, buyers and retailers pressed for low-tariff and duty-free access to markets, often with the support of the governments in low-income countries seeking preferential and expanded access to major markets.
(3) Persuasive/coercive:
Government agencies and civil society groups committed to various developmental or peace agenda have also pressed governments to ensure that trade policy and market access are leveraged for broader economic and social ends. Some of these involve positive conditionalities in trade agreements, linking regulations and access to side agreements on labour or human rights, working conditions, or product and environmental standards. Other measures have been punitive responses to human rights or labour abuses, product dumping, currency manipulation or unfair trading practices.
These defensive, competitive and persuasive/coercive uses of trade policy and regulation have resulted in a complex regulatory landscape in which specific policies have been hammered out of compromise. Separately and in combination they shape the decision-making process of lead-firms in global apparel chains and determine – in large measure – how and where rents are captured. This section first outlines this landscape of diverse trade policies and their resulting quantitative limits, rules of origin, tariffs, and duties. Second, it outlines the changing country patterns of economic and social upgrading, particularly after the end of MFA quotas. Third, the section turns to selected country cases to explain how elements of trade policy have shaped national industries, and what effect these policies have had on opportunities for economic and social upgrading in them. Finally, the section concludes with a series of recommendations about needed policy changes that would enhance opportunities for economic and social upgrading in the apparel industry in less developed countries.

37
3a. Multi-fibre Arrangement (MFA) and the Agreement on Textiles and Clothing (ACT): quota phase-out and removal The most important change in apparel trade policy over the past 40 years has been the imposition and subsequent phased-removal of quantitative quotas on imports into the major markets of the EU, US, and other industrial economies (such as Canada, Japan, and Australia). Quantitative limits on imports into major markets protected well-established national industries, supported the growth and enhanced the competitiveness of new lead firms in increasingly buyer-led global value chains, allowed low-income countries to enter into export production and build national industries, and provided post-colonial and post-imperial metropolitan states with important geopolitical instruments (Table 3.1). In 1957, to appease US textile manufacturers concern about growing imports, Japan imposed voluntary export restraints (VER) on the export of cotton textiles to the US. This became a model for the 1961 ‘Short Term’ Arrangement Regarding International Trade in Cotton Textiles and the 1962 Long-Term Arrangement Regarding International Trade in Cotton Textiles and Substitutes under the auspices of the General Agreement on Tariffs and Trade (GATT). In turn, these arrangements led to the creation of the quota system subsequently extended in the Multi-fibre Arrangement (MFA) implemented in 1974 (ILO, 2005), which itself was replaced in four phases by the Uruguay Round Agreement on Textiles and Clothing (ATC) between January 1995 and 31 December 2004. The MFA/ATC quota regime operated through complex product-specific constraints on imports, rules for the continued use of US and EU fibre, yarn, and fabric inputs, and special levels of market access for producers in lower income developing countries (for a detailed assessment of these effects in Bangladesh, Cambodia, Honduras, India, Mexico, Morocco, Pakistan, Sri Lanka, and Vietnam see Lopez-Acevedo and Robertson 2012; see also Cattaneo, Gereffi and Staritz 2010). The resulting geographies of quota-driven export production led to rapid expansion of low-wage employment in export platforms, border zones, special economic zones, and green-field factories, while more traditional centres of fully integrated national production disintegrated and employment declined. Average apparel wages were squeezed down and new forms of labour management emerged, including the deepening of dependence on young female workers, tight control over behaviour, precarious work contracts, non-payment of wages, and enhanced dependence on cross-regional and trans-national migrant workers.8 Between 1995 and 2005 the Agreement on Textiles and Clothing integrated selected groups of quotas on certain products into the GATT, thereby removing preferential access to specific segments of the main markets and allowing producers in other parts of the world quota-free access to those markets. For most countries, the integration of quotas occurred in four phases, but with most quota categories in the main import products back-loaded to 2005 (Table 3.2). As a result, 1 January 2005 marked the beginning of a major shift in production, employment, and trade in
8 The rise of maquila production and the proliferation of child labour and sweatshop working conditions in second and third tier suppliers have been well documented. Gereffi and Mayer (2006) argued that this form of globalization created a global ‘governance deficit’, with all the attendant problems that the lack of regulatory oversight can create. Non-state actors and, in the global South some states, responded by trying to fill the gap with new governance capacities (Gereffi and Mayer 2006), what Mayer and Pickles (2011) have called a proliferation and surfeit of governance mechanisms. We document these mechanisms elsewhere and a forthcoming paper deals with their effects on private governance within global value chains. Here we focus exclusively on public governance mechanisms and trade policy.

38
Table 3.1. Trade regimes, GPN structure, geographies of production, and employment consequences
Type of agreement
Examples Multilateral agreements MFA, WTO Agreement on Textiles and
ClothingRegional trade agreements CAFTA-DR and NAFTA treaties, US African
Growth and Opportunity Act (AGOA), EU Economic Partnership Agreements
Bilateral trade agreements US-Cambodia Textile Agreement, US-Haiti HOPE agreement
Trade regime Effects on GPN structure
Geographies of production
Employment consequences
Multilateral agreements Long-Term Arrangement Regarding International Trade in Cotton Textiles and Substitutes 1962
Consolidates Northern textiles lead-firms.
Enables initial outsourcing.
Downward pressure on apparel wages in the North, employment shifts from North to South.
Multi-Fibre Arrangement
1975-1995
Regional and colonial production networks.
Fragmentation and regional production networks.
Industry decline in major markets, shift into higher-value products and processes, and employment expansion in many new entrant regions.
ATC quota phase-out
1995-2005
Collapse in quota-based national industries and consolidation of value chain.
Global Asia and regionally proximate producers.
Competitive and cost pressure on smaller-scale producers, especially in Africa, Central America, and Oceania.
Regional trade and preference agreementsCAFTA-DR and NAFTA treaties
Lead-firm concentration and proliferation of nomadic sourcing by small firms.
Sustained markets for textile manufacturers in the US and EU.
Regionalization of sourcing and trade.
Increased regional trade in intermediate goods.
Sustained regional employment (e.g. CAFTA-DR, HOPE II Haiti).
Expansion of China +2 sourcing (e.g., Vietnam, Cambodia, Bangladesh).
Lack of workforce development in CMT (e.g. Jordan).
Enhanced workforce development where
US African Growth and Opportunity Act (AGOA) EU Economic Partnership Agreements

39
Shift from export to domestic markets; regional protectionism (e.g., safeguards, bilaterals).
local backward linkages are possible (e.g. Egypt).
Bilateral trade agreements US-Cambodia Textile Agreement
Lead-firm concentration and proliferation of nomadic sourcing by small firms.
Sustained markets for textile manufacturers in the US and EU.
Shift from export to domestic markets; regional protectionism (e.g. safeguards, bilaterals).
Regionalization of sourcing and trade.
Increased regional trade in intermediate goods.
Sustained regional employment (e.g. CAFTA-DR, HOPE II Haiti).
Expansion of China +2 sourcing (e.g. Vietnam, Cambodia, Bangladesh).
Lack of workforce development in CMT (e.g. Jordan).
Enhanced workforce development where local backward linkages are possible (e.g. Egypt).
US-Haiti HOPE agreement
Source: Author/JP. Table 3.2 Four phases of quota integration into the Agreement on Textiles and Quotas
Phase Starting date Share of export volume Integrated
Number of HS products integrated
I Jan 1, 1995 16 318II Jan 1, 1998 17 744II Jan 1, 2002 18 745IV Jan 1, 2005 49 2,978
Notes: The first four columns were common to all signatories. The final column refers to products integrated in the US case. For countries with less than 1.2 percent of the importing countries total quotas in 1991 quota growth acceleration was advanced one phase. Source: OTEXA.
clothing and a rapid expansion in the numbers of countries worldwide that could export to the major markets. New producing country investments created expanded opportunities for accessing untapped sources of cheap production, driven often by the marshalling of cheap, often migrant, labour pools in export processing, free trade, and border industry zones. Sourcing patterns shifted rapidly. The unit prices of goods imported declined and wages in apparel factories were squeezed down worldwide.
40
Adhikari and Yamamota (2008: 184) describe the effects of quota phase-out particularly clearly:
Even during the heyday of the quota system, characterized by a distorted global market for T&C products, entrepreneurs in countries restricted by quotas found ways to exploit the system. They established factories in countries with low levels of quota utilization and in some instances even helped in the industrialization process of those countries. For example, Korean companies established factories in Bangladesh, Caribbean and Sub-Saharan Africa, Chinese companies established factories in several Asian and African locations, Indian companies in Nepal and even relatively minor players in the global market such as Sri Lankan and Mauritian businesspersons established factories in the Maldives and Madagascar, respectively, to overcome quota restrictions. While the indigenization of this industry took place in some countries (e.g. Bangladesh, Nepal) due to the entry of the local entrepreneurs, in other countries (e.g. Maldives) the industry itself got wiped off the industrial map once the foreign investors pulled out. (Table 3.3)
These global shifts have been disruptive for textile manufacturers. Their capital investments are larger and more embedded in networks of input suppliers, service industries, skilled labour markets, and communities. While locally-based apparel producers aligned with textile and worker interests on trade policy to protect national industries, more footloose brands and large-box retailers supported trade liberalization as a path to cost reduction, and in that they were supported by suppliers in export-oriented emerging economies. Contract prices were squeezed even further as competition among producers and buyers increased and as lead-firms and brands expanded their operations. As buyers intensified and expanded their reliance on global supply chains their suppliers were caught in increasingly uncertain webs of competition. Unregulated second- and third-tier subcontracting became increasingly common and working conditions and labour standards deteriorated. Scholars, activists, and workers and their organizations began more systematically to point to the ways in which global apparel production networks were creating an increasingly generalized race to the bottom in wages, labour rights, and workplace and environmental standards. The increasingly visible effects of the race to the bottom soon led to increased civil society and consumer pressure for oversight on product and work standards. As the role of buyers and retailers in value chains has increased, the expanded reputational risk they face from management failure across the chain made trade policy more vulnerable to pressure for enhanced standards and compliance. Trade agreements have, as a result, become more responsive to these concerns and to political pressures. With new regulations (such as the California Supply Chain Transparency Act) buyer responsibility for their entire supply chain has been clarified.

41
Table 3.3. Clothing exports of selected regions and economies by destination, 2010.
Billions of US$ and percentages Value
Share in region's exports
Share in world exports
Annual percentage change
2010 2005 2010 2005 2010 2005-10 2009 2010 World 351 100.0 100.0 100.0 100.0 5 -13 11 Asia
World 200 100.0 100.0 48.6 57.0 8 -11 19 Europe 65 27.2 32.5 13.2 18.5 12 -8 17 North America 63 36.4 31.4 17.7 17.9 5 -9 22 Asia 41 24.1 20.6 11.7 11.7 5 -8 12 Commonwealth of Independent States (CIS) 11 5.4 5.6 2.6 3.2 9 -45 26 Middle East 8 3.1 4.2 1.5 2.4 15 -1 14 South and Central America 7 1.9 3.3 0.9 1.9 20 -19 64 Africa 5 1.8 2.4 0.9 1.4 15 1 27
China World 130 100.0 100.0 26.8 36.9 12 -11 21 Europe 39 23.7 29.9 6.4 11.1 17 -9 21 Asia 33 33.3 25.7 8.9 9.5 6 -7 10 North America 31 24.7 23.7 6.6 8.8 11 1 25 Commonwealth of Independent States (CIS) 11 9.5 8.4 2.5 3.1 9 -45 27 Middle East 6 3.5 4.8 0.9 1.8 19 -2 19 South and Central America 6 2.9 4.4 0.8 1.6 21 -21 73 Africa 4 2.4 3.1 0.7 1.2 18 3 32
Other economies in Asia World 71 100.0 100.0 21.7 20.1 3 -12 16 North America 32 50.9 45.6 11.1 9.2 1 -17 19 Europe 26 31.5 37.2 6.8 7.5 7 -7 13 Asia 8 12.8 11.1 2.8 2.2 0 -13 21 Middle East 2 2.6 3.1 0.6 0.6 7 0 1 South and Central America 1 0.7 1.3 0.2 0.3 15 -4 23 Africa 1 0.9 1.0 0.2 0.2 6 -5 3 Commonwealth of Independent States (CIS) 0 0.4 0.6 0.1 0.1 9 -24 12
Europe World 115 100.0 100.0 36.4 32.8 3 -15 2 Europe 98 83.8 84.7 30.5 27.8 3 -13 1 Commonwealth of Independent States (CIS) 5 3.3 4.3 1.2 1.4 8 -33 3 Asia 5 4.0 4.2 1.5 1.4 4 -18 10 North America 3 4.9 3.0 1.8 1.0 -7 -30 6 Middle East 2 1.6 2.1 0.6 0.7 8 -9 -9 Africa 1 1.3 1.2 0.5 0.4 1 -2 -5 South and Central America 0 0.2 0.3 0.1 0.1 10 -16 13
South and Central America World 11 100.0 100.0 4.7 3.1 -3 -22 12 North America 9 91.3 84.8 4.3 2.7 -5 -18 12 South and Central America 1 5.6 12.3 0.3 0.4 13 -41 9 Europe 0 2.2 2.2 0.1 0.1 -3 -35 5 Asia 0 0.2 0.5 0.0 0.0 12 -16 17 Africa 0 0.1 0.1 0.0 0.0 7 -25 -22 Middle East 0 0.1 0.1 0.0 0.0 -12 -15 6 Commonwealth of Independent States (CIS) 0 0.0 0.0 0.0 0.0 -18 -83 97
Source: WTO: International Trade Statistics 2011, Merchandise trade: http://www.wto.org/english/res_e/statis_e/its2011_e/its11_merch_trade_product_e.htm 3b. Post-MFA economic and social upgrading and downgrading 9 Despite the enormous volumes of data collected on apparel trade, there are severe limitations on what they can tell us about economic and social upgrading. The most readily available sources are import/export statistics, national employment data, and in some cases wages. In their research
9 This section draws on Bernhardt and Milberg (2012) and Bernhardt (2012).
42
Milberg and Bernhardt (2010) and Bernhardt (2012) have made strenuous efforts to use these data to assess the effects of MFA quota phase out after 2004. Their unit of analysis is the country and data are presented to show how selected supplier countries have fared after quotas, and what have been their individual economic and social upgrading and downgrading trajectories. To operationalize these concepts, Bernhardt (2012) specifies economic upgrading and social upgrading each in terms of two conditions: Economic upgrading occurs when:
• there is an increase (or at least no decrease) in its world export market share, reflecting international competitiveness of its exports, and
• there is an increase (or at least no decrease) in the export unit value, implying the production of higher-value products.
Social upgrading occurs when:
• there is an increase (or at least no decrease) in sectoral employment, and • there is an increase in sectoral real wages.
Using a 2x2 matric for each, and then a combined 2x2 matrix for economic and social indicators, Bernhardt located selected countries in terms of their overall upgrading trajectories (Figure 3.1). Countries in the upper right quadrant have seen gains in their export market share and increases in their export unit values. Those in the lower left-hand quadrant are considered clear-cut economic downgraders with declines in both their export market shares and their export unit values between 2004 and 2009. The countries in the other two quadrants experienced increases on one variable and decreases on the other variable.10 With these four measures, Bernhardt assessed: (1) patterns of economic upgrading and downgrading, (2) patterns of social upgrading and downgrading, and (3) the relationship between economic and social upgrading and downgrading. His country selection was designed to overlap substantially with our own major case studies.
10 Bernhardt (2012) calculates the composite indicator for each measure of upgrading, by assigning a weight of 50% each to the percentage change of both variables (e.g., in “economic upgrading” this would be export market share and the percentage change in export unit value). The underlying formulas for the calculation of upgrading/downgrading are:
Economic up/downgrading = 0.5 * (%-change in market share) + 0.5 * (%-change in export unit value)
Social up/downgrading = 0.5 * (%-change in employment) + 0.5 * (%-change in real wages) When both indicators are positive or negative the composite index will reflect upgrading or downgrading on both variables. Where the two indicators differ in sign, where the absolute value in the increment of one indicator exceeds the absolute value in the decrease of the other indicator, the composite index will have a positive sign – signaling (economic or social) upgrading.

3bi. Econo Post-MFA experiencicountries productionthanks to (Frederick
Figure
Note: In ordthree-year aSource: Ber China andexplicit indbackward and across
11 South Afsmall propoCharacterizsocial upgra
Figure 3
omic upgra
upgrading ng economsampled a based on the Hemispand Gereff
e 3.2: Econ
der to even oaverages, i.ernhardt (2012
d India werdustrial pollinkages ins firms in ap
frica is an inortion of Soutzing the expoading measu
3.1. Milberg
ading and d
has been cmic upgradiand this is
its duty-frepheric Oppofi 2011).
omic upgr
out year-on-ye. we calculat2) based on
re the expeicies (inclu
nto a well-dpparel clust
nteresting outh Africa’s aport sector aloures.
g/Bernhard
downgradi
concentrateng were Alargely an
ee access tortunity thro
rading and
year fluctuatited the percedata from U
ected beneding infraseveloped teters, heavy
utlier in this cpparel sectorongside much
dt model of
ing after 20
ed in Asia (Asian) (Figun artefact oto the US ough Partn
downgrad
ions and to mentage chanN Comtrade
eficiaries of structure invextile indusinvestment
chart and por actually exph more signif
f upgrading
004
(six of the sure 3.2). Hof its start market andership for E
ing in the a
minimize the ge from 2003.
quota remvestments),stry, economt in equipm
oses a cruciports productficant sector
g and down
seven counaiti is the from virtu
d the more Encouragem
apparel sec
impact of da3-04 to 2008
moval. Each, establishemies of scaent leading
al methodolot. Most is fors is thus pro
ngrading
ntries from texception
ually zero wliberal rule
ment Act –
ctor, 2004-
ata outliers, w8-10.
h had beneed domestiale internal g to process
ogical challer domestic c
oblematic. T
43
the sampleamong thewith exportes of originHOPE Act
2009 11
we used
efitted fromic markets,to the firm
s upgrading
enge. A veryconsumption.his is true of
3
e e t
n t
m ,
m g
y . f

44
and productivity growth, skilled yet cheap labour, strong management capabilities, a diverse export product mix, and the diversification of end markets into the dynamic domestic market and emerging regional markets (Frederick and Gereffi 2011; Frederick and Staritz 2011d). Prior to 2005, Bangladesh, Cambodia and Vietnam were not expected to benefit and upgrading was not expected prior to 2004 because each was dependent on quota for their market access (Goueva Abras 2012; Staritz 2011). In practice, each was able to take advantage of low labour costs. Bangladesh and Cambodia also benefitted from preferential market access (particularly to EU markets through its Everything but Arms (EBA) initiative for least developed countries (LDCs)), and Vietnam benefitted from the Generalized System of Preferences (GSP) scheme and its 2007 WTO accession. Bangladesh and Vietnam also benefitted from proactive government programs that supported the development of backward linkages into the textile industry, resulting in reduced costs, higher quality, faster delivery times and enhanced competitiveness (see Fernandez-Stark et al. 2011; Frederick and Staritz 2011a, 2011b). In Cambodia, while government support and product and functional upgrading were limited, trade preferences (EBA), the ILO’s Better Factories Cambodia (BFC) program for those factories that joined the program, and the reputation for ethical sourcing played an important role in the survival and even success of the apparel industry post-MFA (Brown et al. 2011; Frederick and Staritz 2011c). Sri Lanka has experienced both functional and product upgrading and exports have shifted from lower-value to more complex higher-value products, especially lingerie articles (Frederick and Staritz 2011e), mirrored in the increase in export unit values, but a loss in world market shares as exporters shifted away from high volume low-value products. In Sub-Saharan Africa/Indian Ocean, Mauritius is similar to Sri Lanka. Foreign-owned firms (mainly from Hong Kong) supplying US markets under quota withdrew as quotas were lost. This in turn allowed local and other foreign-owned firms producing higher-value products to capture residual contracts from the EU and expand exports. The result was a decline in market share, but an increase in export unit values. By contrast, Kenya saw declines in both market share and unit values of exports as it suffered quota loss and the erosion of AGOA benefits. In South Africa textile and apparel production was always geared largely to domestic markets. These are increasingly being penetrated by Chinese imports. The local industry is incapable of penetrating export markets and the smaller export oriented market that did exist has been largely undercut by lower-cost regional producers such as Lesotho. Lesotho’s apparel industry has similarly struggled post-MFA. With suppliers concentrated in low-value CM and CMT production and lacking the ability to add stages of production or other services that are increasingly being demanded by global buyers, Lesotho’s apparel exports declined after 2004 as lower-value marginal producers were ‘shed’. Loss of competitiveness – especially against low-cost Asian exporters – had been aggravated by low productivity growth, lack of backward linkages, and infrastructural challenges (particularly logistics, distance, and poor access to ports). As a result, the relative costs of production in Lesotho increased, export volumes declined, and the unit value of the residual—and more competitive -- exports increased. As some Taiwanese-owned firms closed and left, South African apparel manufacturers expanded their investments aimed largely at South Africa markets. Suppliers integrated in these South African-owned supply chains produce comparatively more complex and higher-value articles which are then exported to South Africa. The surge of these exports and the relative increase in importance of South Africa as an end market contributed to higher aggregate unit values of Lesotho’s exports (Morris and Staritz 2011; Staritz 2011). In Latin America and the Caribbean, the dominance of US markets is crucial. The Dominican Republic is wholly dependent on US markets and on strict CAFTA-DR rules of origin that require

45
the use of relatively high-cost US-made fabric (Frederick and Gereffi 2011). In Mexico increases in export unit values do not reflect product upgrading, but are a result of rising production costs. Labour and energy costs are relatively high and the costs of inputs have risen, partly because of production sharing arrangements that also require that fabrics and textiles are imported from the US. Limited government support, the lack of broad upgrading among suppliers, the limitations of the maquiladora export platform model (which locks manufacturers into simple assembly tasks and provides few opportunities to develop more advanced full-package capabilities) and the failure to diversify export markets beyond the US have all contributed to Mexico’s declining market position in a context of increased competition from low-cost Asian suppliers (Frederick and Staritz 2011f). 3bii. Social upgrading and downgrading after 2004 Figure 3.3 presents the relationship between changes in employment and real wages as an initial proxy for social upgrading or downgrading. Some countries show clear cut upgrading on both measures (China, Jordan, India, and Nicaragua). China recorded the highest increase in real wages (+88 percent) while Jordan saw the largest expansion in employment (+64 percent), although largely in poorly treated migrant worklers. Others improved on employment or real wages, but saw declines in the other (Cambodia, Indonesia, Vietnam, and Bangladesh recorded increases in employment but declines in real wages, while Dominican Republic, El Salvador, and Mexico experienced increases in real wages but declines in employment). Sub-Saharan African countries in particular saw declines in both employment and real wages, while Sri Lanka also experienced real wage declines. The data on social upgrading are even clearer in distinguishing between upgrading and downgrading by country, although caution is needed in interpreting small and new entrants into the market, such as Jordan, where the export industry has emerged recently and has grown rapidly under US Qualifying Industrial Zones Policy (QIZs), tied to the Peace Process. The results are reflected in both employment and wage growth. More generally, Asian countries (China, India, Bangladesh, Vietnam, and Indonesia) experienced increased employment, a shift that has also resulted in the expansion of domestic markets (Figure 3.3). The economic crisis and downturn in demand after 2007 had negative effects across the region, but with smaller relative effects in these particular countries. Indonesia is an interesting case where expectations from the prospect of quota removal resulted in lost orders and job loss between 2000 and 2004. After 2004 employment increased with orders, at least until the crisis of 2008. By contrast, in general the poorest social performers (African and most Central American and Caribbean countries) were also those that were most affected by the economic crisis. Job loss was particularly acute in the Dominican Republic, Mexico and South Africa where employment declined throughout the decade; by 2009 over half of all jobs had been lost in these industries. In El Salvador and Mauritius, employment also declined albeit more slowly. In Guatemala, Kenya and Lesotho the apparel sector added jobs in the early 2000s (in the latter two countries spurred by the inception of AGOA) but the trend was reversed as quotas were loss. That is, it appears to be the case that post-MFA gains and losses amplified the ability of these countries to respond to the 2008 financial crisis, with winners weathering the crisis better than expected and quota losers experiencing deeper than expected effects after 2008.

Fig
Note: Times(2002-2008 3biii. Econ By combinthe relation
ure 3.3: So
spans covere8), and Vietna
nomic and
ning the indinship betwe
Figure
ocial upgra
ed are differeam (2005-20
social upg
ices for ecoeen econom
e 3.4. Proto
ading and d
ent for Bangl008). Source:
grading and
onomic and mic and soci
otype matri
downgradin
ladesh (2005: Bernhardt (
d downgra
social upgrial upgradin
ix of ‘overa
ng in the a
5-2008), El S(2012).
ding after
rading Bernng and down
all upgradin
pparel sec
Salvador (200
2004
nhardt (2012ngrading (F
ng/downgr
tor, 2004-2
04-2008), Gu
2) was ableFigures 3.4,
rading’
46
2009
uatemala
e to analyse3.5).
6
e

Figu
Note: For HSource: Aut Economic upgrading economic Bangladesshare and together wgrowing rewith 37 pefrom workeeconomic value segmincreasing Social dow2009 only and KenyaKenya, Lehave beenlesser exteemployme In their WArrangeme
12 Bernhardagreement
ure 3.5. ‘Ov
Haiti, the meathors’ own ill
upgrading has been upgraders
sh, Cambodincreased t
with Jordan aeal wages. Iercent of thers, and incand social ments, sucly on workfo
wngrading htwo countra), but six sotho, Mau
n more effeent the Cennt and real
World Bank ent, Lopez-A
dt (2012) teamong the m
verall upgra
asure of ‘Socustration; da
was fairly wmore difficbut only f
dia, China, Htheir export and Nicaragndeed, dure global to
creasing deupgrading.
h as brandorce upgrad
has been cies lost ma
experiencuritius, Soutctive in bot
ntral Americwages.
study of tAcevedo an
ests the conmodels.
ading and d
cial Upgradinata sources a
widespread cult to achfour social Haiti, India, unit values
gua, which ring this pertal in 2011mands on q. Producerding and deding to enha
common market share ed increasth Africa, ath economiccan and Ca
he employnd Robertso
nsistency of
downgradi
g’ is based sas indicated a
among thehieve. Bern
upgradersIndonesia,
s. China andall combine
riod, China . Upward quality, timinrs in Sri Laesign (Fabrance compe
ainly becauand saw thing employ
and Sri Lanc and sociaribbean cou
ment and on (2012) co
these findi
ng’ in the a
solely on the above.
e countries hardt was
s.12 The ecand Vietna
d India are ed an expanemerged apressure ong, and add
anka have aric Red), anetitiveness.
use of stagnheir unit valyment with nka). At thal upgradinguntries in o
wage effeconfirm these
ngs in three
apparel sec
%-change in
in Bernhardable to ide
conomic suam of whichalso amongnsion in apps the larges
on wages aded capacitalso been und in these
nant real wues decline
rising reae regional g, but Afric
our sample
cts of the e findings (T
e different m
ctor, 2004-
n real wages
dt’s sampleentify seveccess stor
h gained expg the social parel emplost exporter nd workingties on suppupgrading ie cases su
wages. Betwe (Dominicaal wages (G
level, Asiancan countriehave seen
end of theTable 3.4).
models, find
47
-2009
s.
e, but socialn clear-cuties includeport marketupgraders,
oyment withof clothing, conditions
pliers drovento higher-ppliers rely
ween 2004-an RepublicGuatemala,n countrieses and to adeclines in
e Multi-fibre
ding general
7
l t e t
h , s e -y
-c
s a n
e
l
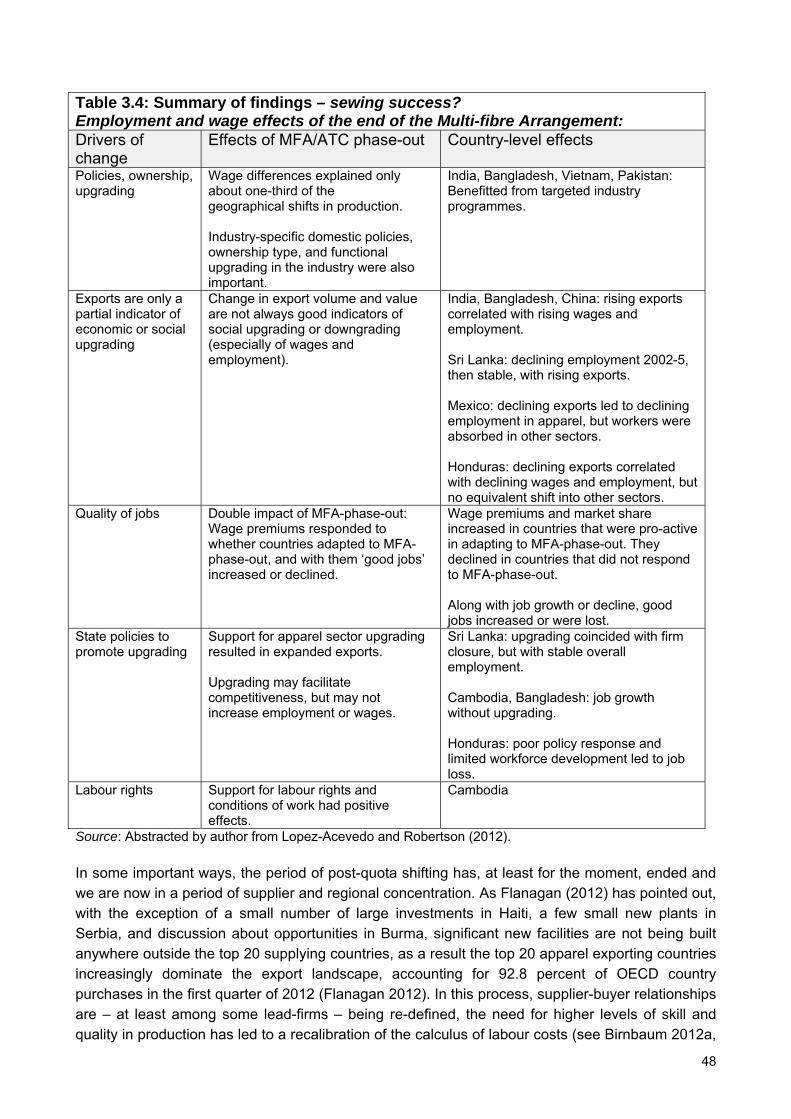
48
Table 3.4: Summary of findings – sewing success? Employment and wage effects of the end of the Multi-fibre Arrangement: Drivers of change
Effects of MFA/ATC phase-out Country-level effects
Policies, ownership, upgrading
Wage differences explained only about one-third of the geographical shifts in production. Industry-specific domestic policies, ownership type, and functional upgrading in the industry were also important.
India, Bangladesh, Vietnam, Pakistan: Benefitted from targeted industry programmes.
Exports are only a partial indicator of economic or social upgrading
Change in export volume and value are not always good indicators of social upgrading or downgrading (especially of wages and employment).
India, Bangladesh, China: rising exports correlated with rising wages and employment. Sri Lanka: declining employment 2002-5, then stable, with rising exports. Mexico: declining exports led to declining employment in apparel, but workers were absorbed in other sectors. Honduras: declining exports correlated with declining wages and employment, but no equivalent shift into other sectors.
Quality of jobs Double impact of MFA-phase-out: Wage premiums responded to whether countries adapted to MFA-phase-out, and with them ‘good jobs’ increased or declined.
Wage premiums and market share increased in countries that were pro-active in adapting to MFA-phase-out. They declined in countries that did not respond to MFA-phase-out. Along with job growth or decline, good jobs increased or were lost.
State policies to promote upgrading
Support for apparel sector upgrading resulted in expanded exports. Upgrading may facilitate competitiveness, but may not increase employment or wages.
Sri Lanka: upgrading coincided with firm closure, but with stable overall employment. Cambodia, Bangladesh: job growth without upgrading. Honduras: poor policy response and limited workforce development led to job loss.
Labour rights Support for labour rights and conditions of work had positive effects.
Cambodia
Source: Abstracted by author from Lopez-Acevedo and Robertson (2012). In some important ways, the period of post-quota shifting has, at least for the moment, ended and we are now in a period of supplier and regional concentration. As Flanagan (2012) has pointed out, with the exception of a small number of large investments in Haiti, a few small new plants in Serbia, and discussion about opportunities in Burma, significant new facilities are not being built anywhere outside the top 20 supplying countries, as a result the top 20 apparel exporting countries increasingly dominate the export landscape, accounting for 92.8 percent of OECD country purchases in the first quarter of 2012 (Flanagan 2012). In this process, supplier-buyer relationships are – at least among some lead-firms – being re-defined, the need for higher levels of skill and quality in production has led to a recalibration of the calculus of labour costs (see Birnbaum 2012a,

49
2012b; Miller 2012a, 2012b), and buyers, suppliers, and workers have become increasingly more insistent that each alone cannot solve the challenge of global production and that some aspects of infrastructural provision, workforce development, and health and safety regulation must be managed by international agencies or the national state (see Mayer and Pickles (2011) on these governance responses and Fernandez-Stark, Frederick, and Gereffi (2011) on workforce development). In practice, buyers seek out suppliers who have located in relatively remote labour markets because of the cost advantages they offer, but typically they refuse to pay a logistics premium that those locations require. In regard to workforce development, while manufacturers repeatedly argue that they are suffering from a shortage of skilled workers, in most cases they are doing no training themselves and they are not prepared to pay for additional skills. In regard to health and safety regulations, manufacturers in these locations are also the very ones who have either ignored local regulations or lobbied for their weakening as part of their investment agreement. The notions of an infrastructural deficit, a skills shortage and the need for workforce development, or the need for state regulation of health and safety rules are, as a result, complicated issues that require much more attention to who is making this claim, what do they actually mean by such needs, and what specifically is their target audience? In particular, it will be important going forward to better understand the ways in which these claims are ways of maintaining the costs of production while increasing local capacities; in this case, by off-setting those costs on the state. 3c. Regional trade agreements, preferential market access, and rules of origin The post-quota trading regime stimulated the development of regional trade agreements resulting in the rapid expansion in the number of RTAs with MFA phase-out (from 1995) (Figure 3.6). As quotas were removed buyers were nominally able to source from producers in any county. Suppliers competed vigorously for orders and prices were driven down. It might be thought, therefore, that the removal of quotas, the liberalizing of trade, and the concentration of sourcing would simplify the decisions that have to be made in sourcing product, particularly insofar as it creates an open field across which the consequences of differential factor costs can more easily be worked out. This was far from the case. The global trend towards trade liberalization was mediated by these additional unilateral trade agreements and preference schemes with specific apparel and textile clauses that came into effect during the MFA/ATC phase-out period. RTAs, bilaterals, ROO, differential duty and tariff rates, and varying demands of particular markets all combined to produce ever more complex regulatory landscapes.

50
Figure 3.6. Cumulative growth of FTAs 1958-2003
Notes: The data source is WTO’s report of Regional Trade Agreements Notified to the GATT/WTO by Date of Entry into Force for the 1958–2003 period. Source: Jung Hur (2012).
RTAs that are particularly important for low-income apparel exporters include the CAFTA-DR Tariff Preference Levels (TPL) agreement between the United States and Nicaragua13; the African Growth and Opportunity Act (AGOA) in which the United States provides temporary relief to sub-Saharan African producers; and the EU’s Generalized System of Preferences (GSP) scheme ‘Everything but Arms’, which provides for duty free imports from certain least developed countries to the EU, amongst others (Table 3.5). The US RTAs provide preferential market access to producers in small countries and protection for the U.S. textile industry in the face of low-cost fabric and yarn alternatives from Asia.14
13 This TPL agreement was established in 2004 and will phase out in 2014. 14 AGOA third-country fabric provision gives to least developed countries in Africa duty-free access to US markets for apparel made from fabric imported from other countries. The agreement initially had a phase-out date of September 2012, and uncertainty about its future has had negative consequences for apparel exporters in Africa who have seen their orders withdrawn or withheld as buyers hedge their bets on renewal (Frederick and Gereffi 2011). In June 2012, the US Senate Finance Committee approved extension of the third-country fabric provision until September 2015. The Senate Committee also modified some of the CAFTA-DR rules of origin provisions to facilitate use of a wider range of inputs for selected final goods.

51
Table 3.5: Rules of origin for textiles and apparel for US and EU Trade agreement
Rules of origin Key sources
CBI Caribbean Basin Initiative NAFTA Triple transformation process: Over 50 percent of
the final apparel export product seeking preferential treatment must be produced in the NAFTA region using yarn made in a NAFTA country. • In the case of cotton and man-made fibre spun yarn, the fibre must originate from North America, namely the NAFTA area.
NAFTA agreement: http://www.nafta-secalena.org/DefaultSite/ index_e.aspx?DetailID=78. Rules applying to trade in textiles and apparel goods between NAFTA countries are set out in annex 300-B. All specific rules of origin are detailed in annex 401.
ATPA Andean Trade Preference Act
CAFTA-DR Central American Free Trade Agreement
QIZ Qualifying Industrial Zones schemes for Jordan and Egypt
The African Growth and Opportunity Act (AGOA) - general regime
• AGOA provides quota-free and duty-free treatment for apparel assembled (and/or cut) in one or more beneficiary sub-Saharan countries from US fabrics, which in turn are made out of US yarn. Apparel articles assembled from fabric produced in beneficiary sub-Saharan African countries from US yarn or originating in one or more beneficiary sub-Saharan African countries are allowed only in an amount not to exceed an applicable percentage25 (sec 112). • AGOA allows for diagonal cumulation with respect to other SSA beneficiary countries (sec 112) • Apparel imports made with regional (African) fabric and yarn are subject to a cap of 1.5 percent of the aggregate square metre equivalents of all apparel articles imported into the United States in the preceding 12-month period (section 111), growing proportionally to 3.5 percent of overall imports over an eight-year period. The amendments to AGOA signed in 2002 (AGOA II) double the applicable percentages of the cap. • The AGOA Acceleration Act (AGOA III), signed in 2004, increases the de minimis rule from its current level of 7 percent to 10 percent. This rule states that apparel products assembled in Sub-Saharan Africa which would otherwise be considered eligible for AGOA benefits but for the presence of some fibres or yarns not wholly formed in the United States or the beneficiary sub-Saharan African country will still be eligible for benefits as long as the total weight of all such fibres and yarns is not more than a certain percentage of the total weight of the article. AGOA IV – the Africa Investment Act of 2006, renewed September 2012 to 2015, adds an abundant supply provision, designates certain denim products as being in abundant supply, and allows low-income SSA countries to export some
Signed into law on 18 May 2000 as Title 1 of the Trade and Development Act of 2000. Amended as AGOA II on 6 August 2002 as section 3108 of the Trade Act of 2002. AGOA Acceleration Act (AGOA III) signed on 12 July 2004. Legal texts: http://www.agoa H..611 Tax Relief and Health Care Act of 2006. Title VI – African Growth and Opportunity Act.

52
textile products under AGOA.
AGOA special regime for lesser developed countries
Under this provision, simple transformation using fabric and yarn sourced from third countries still qualifies for AGOA preferences. The special regime for LDCs was set to expire on 30 September 2007. It was renewed by Congress until September 2012, and has again been extended until September 2015.
Sec 112 of the 8 AGOA legal text
EU’s GSP/ Everything But Arms EBA and African, Caribbean, and Pacific partnership agreement under the Cotonou (formerly Lome) Conventions
EU rules of origin for apparel require production from yarn. This requires that a double transformation process take place in the beneficiary country, with the yarn being woven into fabric, which is then cut and made up into clothing. • Product-specific rules of origin for textiles and apparel under EBA and Cotonou Agreement are the same. • There are differences between the cumulation schemes of the EBA and the GSP and those of the Cotonou Agreement. Under the latter, there is full cumulation among African countries, so that regional fabrics can be used without loss of originating status. Under the GSP there is more limited partial or diagonal cumulation that can occur within four regional groupings – ASEAN, CACM, the Andean Community and the South Asian Association for Regional Cooperation – but not amongst ACP countries. Therefore, LDC members of the Cotonou Agreement that are also eligible to export to the EU under the EBA may, and often do, prefer to continue exporting under the Agreement, partly because of the more liberal RoO under the latter. • The Cotonou Agreement attaches extensive conditions to cumulation with non-ACP countries as well as South Africa (see annexes IX-XI to protocol 1 of the Cotonou Agreement). However, diagonal cumulation under the GSP is constrained by the requirement that the value added in the final stage of production exceed the highest customs value of any of the inputs used from countries in the regional grouping (article 72a).
The EBA initiative amended the EU GSP system as Regulation EC 416/2001. Adopted 28 February 2001. http://trade.ec.europa.eu/doclib/docs/ 2004/october/tradoc_111459.pdf RoO under the EU GSP schemes are defined by Articles 66 to 97 and annexes 14 to 18 and Annex 21 of Regulation (EEC) No.454/9327, as amended by Regulations Nos. 12/97, 1602/2000 and 881/2003. ACP Partnership Agreement signed in Cotonou on 23 June 2000: http://eurlex.europa.eu/LexUriServ/ site/en/oj/2000/l_317/l_31720001215en00030 286.pdf RoO under the ACP Partnership Agreement are detailed in protocol 1, "Concerning the definition of the concept of origination products and methods of administrative cooperation" and its annexes.
EU-Turkey Customs Union
European Association agreements
OPT preferences for re-imported goods (OPT) from Bulgaria and Romania)
Stabilization and Association Agreements with Western Balkan countries
OPT preferences for re-imported goods
Euro-Mediterranean Association Agreements
Algeria, Morocco, Tunisia, Israel, Palestinian Authority, Egypt, Jordan, Lebanon, and Syria.
Source: Adapted from Alberto Portugal-Perez (2008). and Munir Ahmad. (2007). The outcome has been an increasingly complex trading regime with a large number of apparel trade agreements with distinct and specific rules (see Figures 3.7, 3.10, 3.13). These have created highly differentiated patterns of employment growth and decline in low-income countries. In some cases, low entry barriers in apparel, combined with guaranteed market access, led to booming
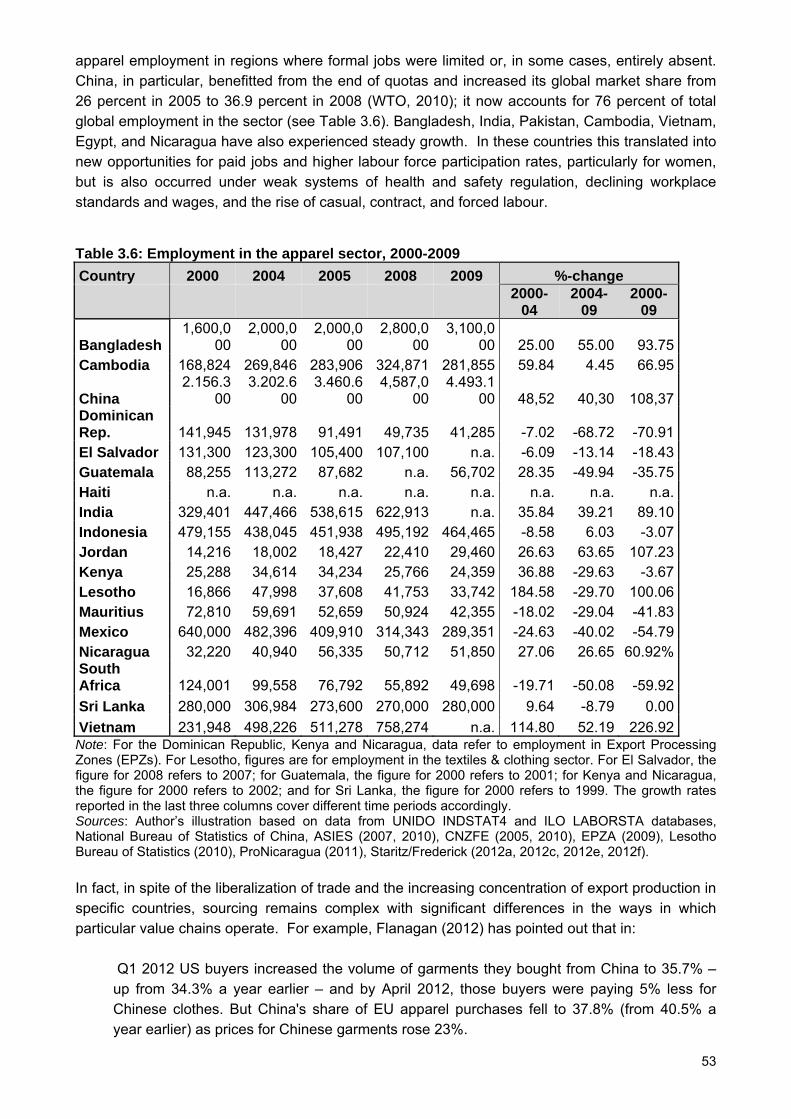
53
apparel employment in regions where formal jobs were limited or, in some cases, entirely absent. China, in particular, benefitted from the end of quotas and increased its global market share from 26 percent in 2005 to 36.9 percent in 2008 (WTO, 2010); it now accounts for 76 percent of total global employment in the sector (see Table 3.6). Bangladesh, India, Pakistan, Cambodia, Vietnam, Egypt, and Nicaragua have also experienced steady growth. In these countries this translated into new opportunities for paid jobs and higher labour force participation rates, particularly for women, but is also occurred under weak systems of health and safety regulation, declining workplace standards and wages, and the rise of casual, contract, and forced labour.
Table 3.6: Employment in the apparel sector, 2000-2009 Country 2000 2004 2005 2008 2009 %-change
2000-
042004-
09 2000-
09
Bangladesh 1,600,0
00 2,000,0
00 2,000,0
002,800,0
003,100,0
00 25.00 55.00 93.75Cambodia 168,824 269,846 283,906 324,871 281,855 59.84 4.45 66.95
China 2.156.3
00 3.202.6
00 3.460.6
004,587,0
004.493.1
00 48,52 40,30 108,37Dominican Rep. 141,945 131,978 91,491 49,735 41,285 -7.02 -68.72 -70.91El Salvador 131,300 123,300 105,400 107,100 n.a. -6.09 -13.14 -18.43Guatemala 88,255 113,272 87,682 n.a. 56,702 28.35 -49.94 -35.75Haiti n.a. n.a. n.a. n.a. n.a. n.a. n.a. n.a.India 329,401 447,466 538,615 622,913 n.a. 35.84 39.21 89.10Indonesia 479,155 438,045 451,938 495,192 464,465 -8.58 6.03 -3.07Jordan 14,216 18,002 18,427 22,410 29,460 26.63 63.65 107.23Kenya 25,288 34,614 34,234 25,766 24,359 36.88 -29.63 -3.67Lesotho 16,866 47,998 37,608 41,753 33,742 184.58 -29.70 100.06Mauritius 72,810 59,691 52,659 50,924 42,355 -18.02 -29.04 -41.83Mexico 640,000 482,396 409,910 314,343 289,351 -24.63 -40.02 -54.79Nicaragua 32,220 40,940 56,335 50,712 51,850 27.06 26.65 60.92%South Africa 124,001 99,558 76,792 55,892 49,698 -19.71 -50.08 -59.92Sri Lanka 280,000 306,984 273,600 270,000 280,000 9.64 -8.79 0.00Vietnam 231,948 498,226 511,278 758,274 n.a. 114.80 52.19 226.92Note: For the Dominican Republic, Kenya and Nicaragua, data refer to employment in Export Processing Zones (EPZs). For Lesotho, figures are for employment in the textiles & clothing sector. For El Salvador, the figure for 2008 refers to 2007; for Guatemala, the figure for 2000 refers to 2001; for Kenya and Nicaragua, the figure for 2000 refers to 2002; and for Sri Lanka, the figure for 2000 refers to 1999. The growth rates reported in the last three columns cover different time periods accordingly. Sources: Author’s illustration based on data from UNIDO INDSTAT4 and ILO LABORSTA databases, National Bureau of Statistics of China, ASIES (2007, 2010), CNZFE (2005, 2010), EPZA (2009), Lesotho Bureau of Statistics (2010), ProNicaragua (2011), Staritz/Frederick (2012a, 2012c, 2012e, 2012f). In fact, in spite of the liberalization of trade and the increasing concentration of export production in specific countries, sourcing remains complex with significant differences in the ways in which particular value chains operate. For example, Flanagan (2012) has pointed out that in:
Q1 2012 US buyers increased the volume of garments they bought from China to 35.7% – up from 34.3% a year earlier – and by April 2012, those buyers were paying 5% less for Chinese clothes. But China's share of EU apparel purchases fell to 37.8% (from 40.5% a year earlier) as prices for Chinese garments rose 23%.

54
Over the same period, EU buyers sourced a slightly larger proportion of their apparel from more proximate suppliers, whereas US buyers sourced smaller amounts from CAFTA-DR. The differences in the ways in which US and EU buyers source their imports is instructive. For American buyers sourcing in Asia, China is the closest point to US ports, whereas for European buyers everywhere else in Asia is closer than China. For EU buyers, shipping time and costs favour sourcing from Bangladesh and Sri Lanka, but for US buyers they favour China:
EU and US buyers also differ in the size of their orders, and this has had important implications for the kinds of services they have been able to leverage from their suppliers. EU buyers – even major companies such as Inditex and H&M typically contract for smaller volumes across a larger number of SKUs than do similar-sized US buyers. This has significant impact on the kinds of suppliers buyers can work with and the range and cost of services they can offer .
Differential currency exchange rates play a crucial role in these broad sourcing decisions (Goger and Pickles 2010).
Between the first quarter of 2011 and the first quarter of 2012, the euro devalued twice as fast against the Chinese yuan as the dollar, but increased its value against most other garment producing currencies, like the Indian rupee or the Bangldeshi taka. So China is now more expensive for people trading in euros than for people trading in dollars. The case for moving production out of China is stronger for Europeans than for Americans (Flanahan 2012).15
Duty rates also play an important role in differentiating the behaviour of EU and US importers. While EU import duties from most Asian countries are lower than for imports from China, US duty rates do not differ significantly among Asian exporters. US and EU rules on duty-free access are different and these differences have important effects on the way supplier industries develop. US preferential access rules often have strict rules of origin that require either suppliers to use US-spun yarns (which add to cost) or follow complicated application procedures from US Customs and Border Control for dispensation to source from Asia when ‘competitive supplies’ are not available regionally (which allow lower cost fabric inputs, but may add to time to the production process). By
15 These differences in the ways in which global value chains are organized have important consequences for the effects of public policy interventions, with the same policy potentially have different results for different value chains. Flanagan (2012) gives the example of US and EU responses to Madagascar’s and Sri Lanka’s poor records of political rights; at the end of 2009, the US withdrew its duty-free access for imports from Madagascar, and in 2010 the EU withdrew its preferential access concession for goods from Sri Lanka (see Morris and Staritz 2011; Goger 2012). Two years later, the volume of US apparel imports from Madagascar is about 80 percent lower, whereas EU imports from Sri Lanka have actually increased. The situation is complicated by the ways in which differential duty levels also affect sourcing decisions (US duty levels are generally higher than those for EU imports). Sri Lankan exports are heavily focused on lingerie which carries even lower than normal duty levels, but EU imports were also affected by the devaluation of Sri Lanka’s currency during this period. Goger (2012) has also found that the main reason that GSP+ removal did not affect exports was because of the strategic partnerships with buyers and their shift to lean manufacturing. The higher technical demands of lingerie production and the new lean systems also meant that the devaluation of the rupee reduced labour costs in the final product compared to Madagascan costs (Staritz and Frederick 2011). By contrast, the devaluation of the Bangladeshi taka had negative effects on exports to the EU; the extra cost of imported inputs outweighs the reduction in the hard-currency value of wages.

55
contrast, EU rules of origin allow suppliers to source from a wider range of input suppliers and offer positive inducement for suppliers to establish local or regional backward linkages.
Some of these effects derive directly from the content of specific policies. Some derive from uncertainty and timing of policy change. In some cases, policy changes have been long-term and both buyers and suppliers have had many years to adjust to the new conditions and requirements. In other cases, the political pressures brought to bear on national and international administrations have resulted in significant and rapid policy changes for which industry participants have had little time to prepare. One such policy shift was the imposition of US and EU safeguards on imports from China after the full integration of quotas in 2004; the so-called ‘bra wars’. Following the removal of quotas on 31 December 2004, exports of many apparel products from China to the US and EU increased rapidly (in some case by 100 percent or more). This led the US and EU to trigger the safeguard clause in China's WTO accession agreement which allowed importing countries to restrict import growth to 7.5 percent per year for up to three years after 2004. Negotiations resulted in an agreement between China and the EU to limit the rate to 10 percent for three years, while the US unilaterally imposed import safeguards limiting growth to 7.5 percent. The situation was compounded by the fact that upon announcement of the EU safeguards, Chinese manufacturers and their EU buyers accelerated the shipping of the goods using up a full year's quota almost immediately. The result in August 2005 was that 75 million items were held in European ports, and as Yearman and Gluckman (2005) argued at the time, ‘millions of garment workers worldwide stand to lose their jobs with this year’s changes in global textile trade rules’.
Safeguards were an integral part of the protections advanced industrial countries built into trade liberalization policies to protect national industries from dumping. In some cases, policy shifts have come swiftly and without warning. In 2008, pressure from US-based sock manufacturers, led US Customs and Border Protection to announce that planned to impose a six-month 5 percent tariff on cotton socks from Honduras. On 24 January 2008, US Customs also announced a plan to eliminate the ‘first sale valuation’ rule used by importers to reduce their duty costs.16 Prior to the new rule, instead of paying duty on the customs value of an imported product measured by the price the importer paid to the vendor, the ‘first sale rule’ allowed importers to declare the customs value based on the lower price the vendor paid to the manufacturer.17 My point here is not to dispute the merits of the rule or the proposal, but to illustrate some of the ways in which the timing of changes in trade policy and Customs regulations can create significant disruptions in production chains which have consequences for buyers and suppliers shipping and delivery schedules with real effects on their compliance obligations which in turn may have real effects on workers. With the phased removal of quantitative quotas on imports into major markets, apparel sourcing has focused even more intensely on controlling and reducing factor costs of production, with specific attention paid to either squeezing labour costs or increasing the productivity of workers. This enhanced emphasis on cost reduction has also affected the relative attention buyers and suppliers give to other parts of their value chain. An increasing number of companies are focusing greater effort on input costs, through approved vendors and local sourcing by supplier firms. Expanded global sourcing has driven down the costs of sourcing to such an extent that the marginal gains from squeezing labour costs have been reduced significantly in recent years. As a
16 US Customs and Border Protection. 2008. Proposed Interpretation of the Expression ‘‘Sold for Exportation to the United States’’ for Purposes of Applying the Transaction Value Method of Valuation in a Series of Sales (73 Federal Register p. 4254, January 24, 2008). 17 The use of the first sale rule is described in: US International Trade Commission (2009). US Customs and Border Protection ended its effort to change the ‘first sale rule’ in September 2010 (Edmonson 2010).

56
result, supply chain managers have focused increasingly on the relative costs of inputs in the FOB price of products. Accounting for as much as 60-80 percent of factor costs, input management emerged as an important focus of attention. In countries like China and Mexico, integrated factories with fabric and dyeing capacities have advantages over disaggregated and horizontally networked production networks. For some lead-firms, these advantages have been institutionalized through the designation of approved input vendors where quality and price guarantees are matched by the payment of marginally higher FOB prices. 3ci. Preferential access rules of origin and the limits to economic upgrading From the 1980s, major importing countries regulated the volume and content of imports through special customs arrangements (807b and OPT programs and (in the 1990s) NAFTA) (Bair and Gereffi 2011). These programmes allowed US and European companies to export their textiles to be sewn into garments using lower-wage workers, and re-import the garments. High value added yarn and fabric segments of the industry were retained in major markets, while low-value assembly operations were off-shored. Duty on the re-imported goods was charged only on the value added (mainly the cost of the labour in assembly). The policies drove a two decade long search for low-cost labour and simple stitch-up contracting. It transformed formerly full-package producers into suppliers of labour for stitch-up, cut-and-make, and cut-make-and-trim. And it transformed US and EU manufacturers into suppliers of inputs and trading companies. European outward processing trade (OPT) involved shipping fabric, trim, and – in some cases – cut pieces to nearby low-wage economies to be sewn and shipped back to the sending company for sale. Duty was paid only on the value added; the cost of the sewing labour. OPT was initially developed by German companies outsourcing to state socialist countries (Begg et al. 2003). In time, companies in all EU countries entered into OPT contracting with countries across central and Eastern Europe and North Africa (especially Tunisia and Morocco; see Begg et al 2003; Rossi 2010). The US 807 trade law (now clause 9802) – was instituted in 1984 under the Caribbean Basin Initiative (CBI). Although not explicitly addressing textiles and clothing, under the 807 programme companies were able to export inputs and re-import finished garments paying import duties on only the value added; the US content of the garment was exempt. The tariff savings on 807 re-imports were large and drove the rapid expansion of maquiladora production in Central America during this period. In 1986, the programme was revised (807-A) to increase quota access for re-imported goods and to allow for bilateral negotiations to increase quota levels outside and well above the MFA limits. Ahmed (2012: 6) has pointed out that ‘For the US textile industry, it produced spectacular results so much so that, by 2004, some 53.3 percent of all US textile mill product exports were destined to the CBI countries and Mexico, versus a mere 18.9 percent in 1990’. Both OPT and 807(a) were the original forms of preferential access agreements based on “local content requirements”, where local content referred to inputs from European and US manufacturers. Through them, advanced industrial countries offered increasing levels of access to developing country assembly industries in return for expanding markets for textiles, in effect encouraging assembly subcontracting networks in hemispheric proximate countries (referred to in the Americas as ‘maquila’ production). The rules of transformation and cumulation are spelled out in Table 3.7 below.

57
Driven by defensive politics, these ROO protect markets for textiles in northern industrial markets. As cost pressure increased these rules acted to encourage offshoring of wage sensitive assembly operation but constrained the equivalent offshoring of capital intensive and higher wage parts of the value chain. With the almost universal offshoring of only low-wage assembly parts of the value chain from the EU and US, the opportunities for regional economies to develop backward linkages and industrial spill-over effects in any one country were extremely limited. The type and limits of economic upgrading that are possible under these conditions will always be constrained, as will be the quality and sustainability of jobs that can be generated.
Table 3.7: Rules of origin: terms and rules
EU Outward Processing Trade
Tariff OPT ‘Tariff OPT’ suspended tariffs on the re-import of goods from the OPT-
partner country into the EU when raw materials (such as yarns and fabrics) are temporarily exported from the EU country for processing undertaken in the OPT country and re-imported into the same EU country as partially or fully finished goods.
Economic OPT ‘Economic OPT’ granted additional quota for the import into the EU of specific products produced from EU-originating materials.
Wholly-obtained or produced criteria
Prevents the use of second-country inputs.
Substantial transformation criterion
Allows second country inputs, but requires specified levels of processing for the garment to be designated as from that country, and hence eligible for preferential access and duty/tariff relief.
Cumulation and the sourcing of inputs in manufacturing for export
Bilateral cumulation
Allows inputs to be sourced from the preference giving country for re-export.
Diagonal cumulation
Countries in the same program can source inputs and share processing. Applies only to products originating in these countries. Its official country of origin is designated by the country where the last significant transformation occurred. In some programs, labelling has been explicitly designated as not fulfilling this ‘substantial transformation’ rule.
Regional cumulation
Only exists under GSP and among specified countries in a particular region.
ASEAN, SAARC (South Asian Association for Regional Cooperation) Full cumulation
All processing carried out within the specified countries counts as qualifying content for preferential access. Full cumulation allows for more expanded regional integration among producing countries that may not contain the full range of industrial processes.

58
Algeria, Morocco, Tunisia USA Free-Trade Agreements Yarn (or fibre) forward Imports qualify for duty relief only if the garment is made from fibre/yarn
forward within the free trade area.
Triple transformation: fibre, yarn, assembly. Tariff Preference Levels (TPLs)
Specified quantities are allowed to qualify for import under the duty relief program even with inputs from countries outside the program.
Commercial necessity Inputs may be sourced from non-program countries when it can be demonstrated that no commercially available inputs are currently available from qualifying countries.
Non-reciprocal preferential agreements: local content requirement
Duty relief on imports from qualifying countries if the majority of inputs are sourced from the US.
CBI, AGOA, ATPA QIZs (Qualifying Industrial Zones)
Provides tariff and quota free access to US markets. Supercedes any other free trade agreements in place, and offers higher levels of access.
Jordanian QIZs: “the product must be a substantially transformed good, with at least 35 percent of its value added generated in Israel, a Jordanian QIZ or the West Bank/Gaza. Of that 35 percent, a minimum of 11.7 percent must be added in a Jordanian QIZ, 8 percent in Israel, and the remaining 15.3 percent can come from a Jordanian QIZ, Israel or the West Bank/Gaza” (Ahmad 2007: 13).
Egyptian QIZs: “ industrial products, including textiles and apparel, are authorized duty-free entry into the US if these products comply with rules of origin requirements. The required rules state that 35 percent of the commodity’s value must be manufactured in an Egyptian QIZ, with a minimum of 11.7 percent of Israeli inputs. The Israeli content requirement is fulfilled if a factory’s cumulative export in each quarter satisfies the agreed-upon ratio” (Ahmad 2007: 13).
No termination date and Congressional renewal not needed.
Designated to support the peace process in the Middle East.
Egypt, Israel, Jordan. Source: Adapted by author from Ahmad (2007). At the regional level, North-South RTAs structured the conditions under which ‘the economy’ of the global value chain emerged, creating complex regulatory and governance landscapes of opportunity and constraint for firms and countries.18 Transformation and cumulation rules prevented the globalization of textile manufacture. Instead, they protected yarn and fabric
18 The more recent development of South-South RTAs is not considered here, but is particularly important in SSA for textiles and clothing. The interests and lobbying behind these agreements are much different.

59
manufacturers in the US, EU, Korea and Taiwan. For example, Ahmad (2007: 13) showed that 76 percent of imports to the US under the Caribbean Basin Initiative depended on US inputs. In other regions, the local content rule has had much less effect, for example in AGOA and Andean countries where levels of exceptions to local content rules have been very high. In this sense, we can argue that these content rules (that is, inputs sourced from the preference-giving country) produced the global value chain and the fragmentation of production activities on which it is predicated. This was a division of labour that has been extremely beneficial to EU and US fibre, yarn, and fabric manufacturers and has outsourced not only US and EU apparel stitching jobs, but assembly work that has only ever had limited opportunities to upgrade economically or socially. Preferential market access (whether through quota allocation or special outward processing arrangements) certainly allowed many developing countries to rapidly expand their apparel industries, to add employment and to achieve levels of export earnings that were previously possible only with primary resource and agricultural commodity exports. In the post-World War II period, this form of apparel-led industrialization was leveraged in Japan, Korea, and Taiwan into backward linkages into textiles and yarns, establishing each as a major textile and clothing producer. For most MFA and post-MFA apparel exporters, such backward linkages have been prevented by rules of origin requirements embedded in trade agreements, and their industrialization has been constrained to low-wage assembly work for export. It is in this highly constrained context that the question of upgrading will now be addressed through a series of country case studies. 3d. Regional Trade Agreements and upgrading
3di. RTAs, export processing platforms, and the importance of embeddedness: trade preferences in Egypt and Jordan19 Two of the newest entrants into the apparel global value chain are the export processing zones of Jordan and Egypt. Driven by its concern for the Middle East Peace Process, in 1997 the United States reached an agreement with Jordan to extend the US-Israel free trade agreement to industrial zones in Jordan. These were the Qualified Industrial Zones (QIZ). Under the agreement goods produced in these qualified zones receive duty-free access to the American market provided they meet certain rules of origin requirements; a minimum of 35 percent of the exported good’s value must be composed of local content, 11.7 percent of this must be Jordanian and 8 percent must be provided by Israeli manufacturers (7 percent for high-tech products). The remainder up to the 35 percent value-added requirement can come from Jordan, the US, Israel, and/or or the West Bank and Gaza. In 2004, a similar arrangement was created between Egypt, the United States, and Israel, with the share of required Israeli input increased from the 8 percent to 10.7 percent. The structure and growth of the export-oriented part of the apparel sector in Jordan and Egypt were shaped by the QIZ agreement (and the subsequent free trade agreement between Jordan and the United States, signed in 2000). The preferential access provided by QIZ was not limited to the apparel sector, but because U.S. duties on apparel were disproportionately high the greatest advantage of the agreement was in that sector. The result was a rapid expansion in apparel production, particularly readymade garments. In Egypt, 585 firms out of the total 733 firms registered in the QIZ protocol in 2008 were from the readymade garments industry (Al-Azmeh 2011). In Jordan virtually the entire industry was created by the QIZ. Domestic firms in the two
19 This section is adapted from Shame Al-Azmeh. 2011. Working Conditions in Egypt’s and Jordan’s Garments Industry. A Scoping Report for the Capturing the Gains Project.

60
countries were either set-up or relocated into the qualified zones while foreign firms flocked into these zones to benefit from the preferential market access they offered. QIZ has had different effects in each country. In Jordan, the QIZ programme created the industry. When the Jordanian QIZ was signed in 1996, Jordanian apparel exports totalled US$ 16 million, of which US$550,000 went to the United States. Subsequently apparel exports increased rapidly, almost entirely for US markets. Today, the US accounts for more than 90 percent of Jordanian apparel export. Egypt began with a more diversified and more vertically integrated industrial base as a result of earlier import-substitution policies. QIZ reoriented only a part of the industry toward US export markets. In contrast to Jordan where export processing zones with CM and CMT manufacturers dominating, Egyptian firms, both private and state-owned, are more deeply engaged with full-package production for domestic and regional markets. QIZ also had differential effects on labour markets and working conditions in the two countries. Because the QIZ agreements was unpopular in Egypt, the government argued that the agreement would save thousands of jobs in textiles and apparel; jobs that were about to be lost as quotas were withdrawn. It also limited the number of foreign workers than could be hired in apparel firms. Jordan, by contrast, had only a limited labour supply and little historical experience in the industry. Accordingly, the government did not restrict the entry of foreign workers into QIZ firms. The result was a massive influx of Chinese and South Asian workers. The Jordanian industry is a model of the new single market, export-processing enclave dominated by foreign firms staffed at managerial and shop-floor level with migrant contract workers and with few linkages with or direct employment effects on the local economy. The Egyptian industry has been longstanding, is linked to both domestic and export markets, and has resulted in an accumulation of individual and organizational skills. Threatened by global shifts resulting from quota loss, the QIZ agreement provided preferential access to the US market and a lifeline to the industry. Preferential access encouraged foreign producers to relocate to or expand in Egypt, but in a context of a more complex mix of firm types and capacities and end markets, particularly domestically and in Europe. 3dii. Morocco: OPT, shared production and fast fashion20 Morocco is an interesting contrast to both Jordan and Egypt. There, EU buyers have taken advantage of geographical proximity, short lead times, and preferential tariff and duty rates under OPT arrangements to expand sourcing from Morocco to such a degree that the Moroccan industry is now heavily dependent on EU-15 markets. Among the MENA-4 (Middle East and North Africa) countries, Morocco ranks second behind Tunisia and before Egypt and Jordan in terms of global as well regional exports to the EU-15 (Figure 3.7). Investments in Morocco’s export-oriented apparel sector began in the 1980s and were under-written by preferential market access and tariff rates under the EU program of Outward Processing Trade (OPT). OPT agreements became the key driver for the expansion of CM and CMT manufacturing in Morocco. Under preferential market access agreements and reduced import duties, Moroccan exports to the EU grew using inputs (e.g. yarns and fabrics) from the EU. In 2000, OPT preferential market access switched to duty-free access and double transformation rules of origin (ROO) under the Euromed Association Agreement. Given the strength of OPT sourcing relations with EU textile suppliers and the tight controls exercised over sourcing by buyers 20 This section is indebted to Frederick and Staritz (2011i), Rossi (2012), and Plank et al. (2012).

61
such as Inditex, the new more flexible rules for input sourcing have had little effect and few backward linkages in Morocco have emerged. Since 2005, FDI to produce denim textiles has occurred, driven by special government incentives.
Figure 3.7. MENA preferential trade agreements
EU’s trade policies were a double-edged sword for the industry. On the one hand, they secured a steady flow of orders under the (OPT) production-sharing agreements, earlier largely originating with European branded manufacturers and later with retailers (Frederick and Staritz 2011i). On the other hand, they tied the industry to OPT assembly and severely limited opportunities for functional upgrading and the development of backward linkages into input supply and services. As elsewhere in OPT countries, production sharing policies protected EU fabric and yarn manufacturers, created a deep-seated division of labour, and bound Moroccan suppliers to assembly or CMT manufacturing, with direct consequences for the kinds of work and levels of wages that have emerged. With MFA quota phase-out, Morocco’s stitch-up and CMT functions and its close proximity to Spanish and French markets resulted in expanded contracting as the role of fast-fashion retailers grew, particularly from Spain (particularly with Inditex/Zara and Mango). Recent work by Planck, Rossi, and Staritz (2011) and Rossi (2010) demonstrate that the importance of Morocco in this fast

62
fashion model of sourcing, combined with social programme of the Moroccan ‘Fibre Citoyenne’, which established a national code of conduct for firms and a labelling initiative. The result is an interesting case of an industry dependent on expanded low-wage employment now under pressure from consumer demands for higher working standards and increased industry demands for workforce training and development to meet the demands of fast fashion. In Jordan, Egypt, and Morocco preferential access and rules of origin have been important determinants of value chain economic and social upgrading. Without preferential access to major markets, many exporting countries would have no effective export industry. Rules of origin may thus be a necessary stimulus to preferential access and tariff reduction, but they may also limit the opportunities for backward linkages into national or regional textile manufacture, or they may limit access to lower-cost yarns and fabrics available on world markets. In Jordan, trade preferences created the industry and its associated jobs, but they exist in export processing platforms and employ mainly foreign migrant workers. In Egypt the same trade preferences allowed the deepening of an already strong and integrated national production chain. Expanded export production offered more, not fewer opportunities for industrial and social upgrading. In Morocco, trade preference transformed the relatively small national industry into a major export industry. It resulted in the creation of large numbers of jobs but at the cost of its own textile industry. In recent years, increasing pressure for fast turnaround to meet the uncertainties of EU consumer markets has both enhanced Morocco’s position in the value chain but at the expense of intense pressure on working conditions. In other cases, preferential market access may have indirect consequences for workers. It is to these indirect consequences on workers lives that we now turn in considering the case of Bangladesh. 3d iii. Trade preferences, rules of origin, state intervention, and upgrading: the case of Bangladesh21 Like Jordan, Egypt, and Morocco, Bangladesh has benefitted greatly from preferential quota free and tariff free access after the removal of quotas. In many ways, it is a model for a country benefitting from RTAs as a means to stimulate export apparel industries and create jobs. Particularly through GSP since the early 1980s and from the Everything But Arms (EBA) initiative since 2001, Bangladeshi export production has expanded and the contribution of apparel exports to total exports has also risen year over year (Figure 3.8; Table 3.8). As a result the number of apparel factories and the number of employed workers increased year over year (Figure 3.9). Preferential trade policies have certainly been important for the success of Bangladesh’s apparel export industry. Ready-made garments (RMG) from Bangladesh mainly go to the USA and European Union (EU) markets. Together they absorb more than 90 per cent of Bangladeshi apparel exports; woven RMG products to the US, knit RMG to the EU. Knitwear generates high local value added (75 percent), whereas wovens are heavily dependent on imported raw materials and add much lower local value (usually less than 25 percent). These inputs are heavily sourced from China and other East Asian producers, although apparel accessories (zipper, buttons, packaging, labels etc.) are mainly produced locally. New EU GSP rules and recent South Asian regional trade liberalization policies are expected to result in the near future in a larger proportion of fabric inputs for woven apparel being sourced from India.
21 This section is indebted to Frederick and Staritz (2011a) Ahmed (2012), and Miller (2012).

63
The trade story is, however, more complicated. Currently only about one half of Bangladesh’s apparel export products make use of these preferential access facilities. Many products do not use the preferences because of the demands of fulfilling double transformation rules of origin (ROO), mainly in knit goods, whose fabric inputs can be sourced locally. This, while utilization rates for knit products (HS 61) are around 90 percent, for woven apparel (HS 62) take-up rates are only around 16 percent.22 Figure 3.8: Bangladesh’s apparel exports to the EU-15 and the US
Source: Staritz and Frederick (2011a). Data source: UN Comtrade; Imports reported by partner countries; Retrieved 4/3/2011. Table 3.8. Bangladesh Ready-Made Garments (RMG) at a glance Fiscal year (July –June)
No. of garment factories
Employment (mill
workers)
Export of knit RMG (mill US$)
Export of woven RMG (mill US$)
Total Export of RMG (mill
US$)
Total export of
Bangladesh (mill US$)
% of RMG to
total export
2005-06 4,220 2.2 3816.98 4083.82 7,900.80 10,526.16 75.08
2006-07 4,490 2.4 4553.60 4657.63 9,211.23 12,177.86 75.64
2007-08 4,743 2.8 5532.52 5167.28 10,699.80 14,110.80 75.83
2008-09 4,825 3.1 6429 5918.51 12,347.77 15,565.19 79.33
2009-10 Nearly 6,000 with knitwear
Nearly 4 million with
knitwear
6483.29 6013.43 12,496.72 16,204.65 77.12
2010-11 9482 8432.40 17,914.46 22,923 78.15
22 Regional cooperation agreements are also important, the most important of which is the South Asian Association for Regional Cooperation (SAARC), with others being important for specific products and firms (including the South Asian Preferential Trading Agreement (SAPTA), the Bay of Bengal Initiative for Multi-Sectoral Economic Cooperation (BIMSTEC) involving Bangladesh, India, Myanmar, Sri Lanka, Thailand, Nepal and Bhutan and since 2004 the South Asian Free Trade Area (SAFTA)). Nonetheless, the take-up of regional quotas has been limited. (For further discussion see Staritz and Frederick (2011a).
EU-15 USA Rest of the World
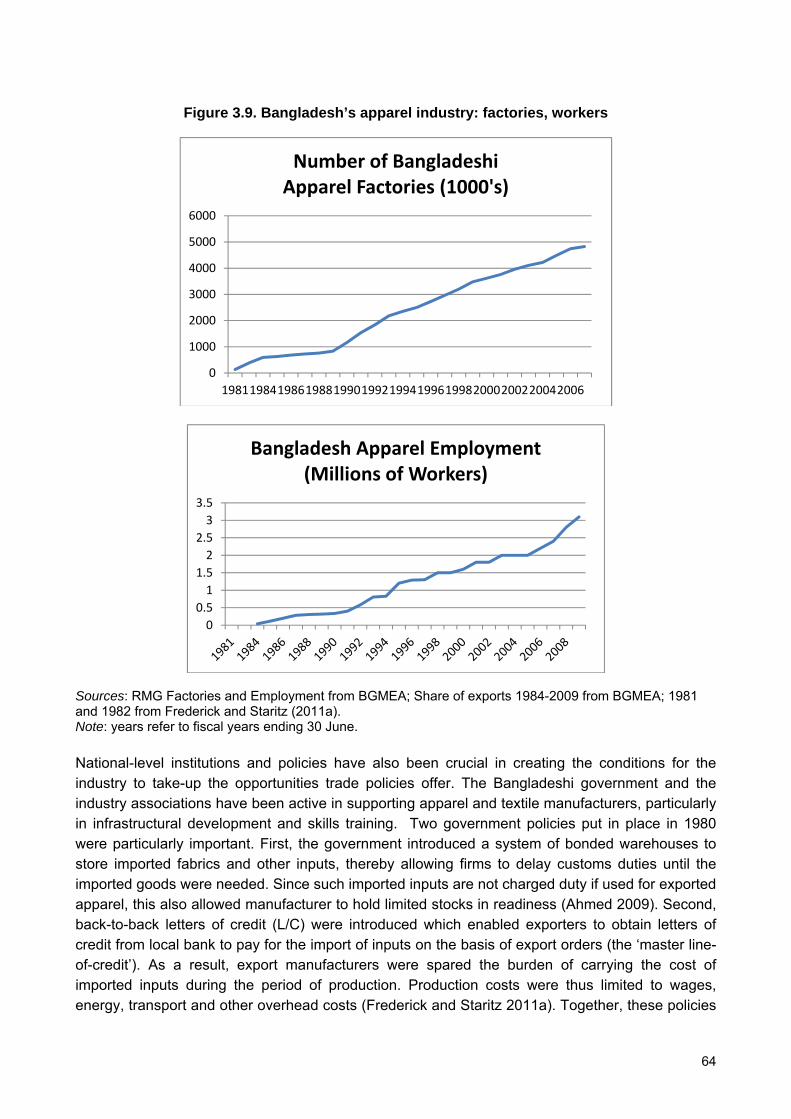
64
Figure 3.9. Bangladesh’s apparel industry: factories, workers
Sources: RMG Factories and Employment from BGMEA; Share of exports 1984-2009 from BGMEA; 1981 and 1982 from Frederick and Staritz (2011a). Note: years refer to fiscal years ending 30 June. National-level institutions and policies have also been crucial in creating the conditions for the industry to take-up the opportunities trade policies offer. The Bangladeshi government and the industry associations have been active in supporting apparel and textile manufacturers, particularly in infrastructural development and skills training. Two government policies put in place in 1980 were particularly important. First, the government introduced a system of bonded warehouses to store imported fabrics and other inputs, thereby allowing firms to delay customs duties until the imported goods were needed. Since such imported inputs are not charged duty if used for exported apparel, this also allowed manufacturer to hold limited stocks in readiness (Ahmed 2009). Second, back-to-back letters of credit (L/C) were introduced which enabled exporters to obtain letters of credit from local bank to pay for the import of inputs on the basis of export orders (the ‘master line-of-credit’). As a result, export manufacturers were spared the burden of carrying the cost of imported inputs during the period of production. Production costs were thus limited to wages, energy, transport and other overhead costs (Frederick and Staritz 2011a). Together, these policies
0
1000
2000
3000
4000
5000
6000
1981198419861988199019921994199619982000200220042006
Number of Bangladeshi Apparel Factories (1000's)
00.51
1.52
2.53
3.5
Bangladesh Apparel Employment (Millions of Workers)

65
were particularly instrumental in allowing new firms to emerge in the sector (Staritz and Frederick 2011a). With the prospect of order declines with the 2004 MFA phase out, the Bangladeshi government adopted a new series of pro-active measures to support the industry. Based on a 2003 Ministry of Commerce report on industrial adjustment, fourteen strategic recommendations relating to human resource development, infrastructure development and governance were implemented through the National Coordination Council (NCC). The NCC 2005 recommendations became the basis for sectoral development in the subsequent post-MFA years (Table 3.9). Table 3.9. Apparel and textile specific projects in Bangladesh: post-MFA
National Coordination Council (NCC)
Sponsor: Government Timeline: 2005-2015
Recommendations for implementation: • Enterprise debt-to-equity ratios should be fixed at 70/30; or any rate considered
favorable • Weaving, dyeing, and finishing sector investments should be given priority to
bank loans • Textile investment interest rates should be fixed at 9% by state-owned and private
banks • Currency conversion rates (US dollar and taka) for exported products should be
restricted within a maximum range of 50 paisa. • Imported spare parts/machinery, dyes, chemicals, and sizing materials used in
the textile sector should be available duty- and tax-free. o Customs duties on imported textile fibers, yarns, and fabrics have been
reduced from five levels (0%, 5%, 15%, 25%, and 37.5%) to (0%, 5%, 12%, and 25%). Import duties on textile machinery, the majority of spares and accessories, dyes, chemicals, and raw cotton have been reduced to zero.
• In lieu of duty drawback and bond facilities, cash assistance rates should increase to 10%
• Technical skill shortages in the textile sector should be addressed by (i) setting up more technical and vocational institutes, (ii) upgrading the Bangladesh College of Textile Engineering and Technology (CTET) to a textile university, (iii) opening textile facilities in all technical universities, and (iv) including textiles as a subject in the curriculum of all technical schools, colleges, and technical institutes (see table on government skill projects below).
• Textiles and apparel should be the priority sector for establishing high-tech industrial parks, apparel villages and EPZs, all with the necessary infrastructural facilities.
• The scheme for tax holidays should be continued • Environmental protection should be encouraged and achieved by setting up
effluent treatment plants (ETPs) facilitated by: duty-free provision of equipment/parts, low-interest bank loans, formation of a committee from government departments and associations to encourage clustering of industrial regions, and VAT exemptions for electricity and gas charges, together with carriage, freight and insurance.
Government Post-MFA Action Program (PMAP)
Sponsor: Government, Ministry of Commerce (MOC) Timeline: 2005-2010
• Skill and Quality Development Program (SQDP): Training is given in several areas such as compliance, quality management and marketing in order to improve the performance of the sector; to target about 22,000 workers.
• Displaced Workers Rehabilitation Program (DWRP): to assist and retrain those who might lose their jobs ($15 million)
• Small Enterprise Capacity Enhancement Program (SECEP): This has two sub-components – (i) to assist capacity enhancement of smaller producers by helping them form strategic partnerships, mergers, and productivity improvement program, and (i) a Technological Capacity Development Program, to help SMEs in the apparel and textile sector to access improved technology to enhance their competitiveness ($3 million).
• Support and capacity building in Primary Textile Sector (PTS) to improve quality and reduce costs ($4 million).

66
• Support to Handloom Sector: to make them more competitive by setting up separate design and development centres for both handloom and PTS ($4 million).
• Support to Forward Linkage Industries (SFLI) to enable them to provide better service to the apparel sector, including trade facilitation as well as marketing tools.
• Support to New Market Opportunity (SNMO) Bangladeshi government support measures
Sponsor: Government Start: 2006
• Provision of bonded warehouse facilities to defer customs charges • Technological upgrading (concessionary duty rates and tax exemptions for the
import of capital machinery) • Cash subsidies for the use of local fabrics as inputs for exporting apparel firms • Export Credit Guarantee Scheme covering risk on export credits at home, and
commercial and political risks occurring abroad • Support of market promotion efforts of apparel exporters • Subsidies for utility charges • Market Diversification (2008): Bangladesh and India MOU allows Bangladesh to
export 8 million pieces of Bangladesh-produced garments to India duty-free per year. This is a small amount in the total exports, but it is viewed as a means to begin to reduce dependence on the traditional U.S. and EU markets.
• Apparel exporters receive small cash incentives for exports to new destinations (outside of the EU, the US and Canada) in the period 2009 to 2012
BGMEA strategy to increase apparel exports
Sponsor: BGMEA Timeline: 2008-2013
BGMEA persuades domestic manufacturers to: • increase labour productivity • diversify product lines and export markets • invest in R&D and human resources • place renewed emphasis on product quality • strengthen CSR policies
The strategy also involves lobbying the government to improve domestic infrastructure—including gas, electricity, and roads—and implement policies to encourage domestic and foreign investment in the textile and apparel industries. BGMEA also supports efforts to enter new markets by sending missions to South Africa and Brazil and inviting missions from Japan.
Source: Staritz and Frederick (2011a). Two particularly important outcomes are worth noting. First, as we have noted, preferential access to major markets combined with long-standing government supports and ease of entry into the industry led to a boom in factory development, expansion, and employment. However, there were indirect consequences of this rapid expansion of production and employment. As Miller (2012d) has shown rapid growth led to unregulated factory construction leafing to fires due to faulty electrical installation and building collapse due to shoddy construction management. Second, expanded employment with low-level investment also resulted in increased pressure from workers for improved wages and working conditions, and from buyers to improve working conditions and wages in order to achieve higher product standards and productivity. In 2006 and again in 2010, the Bangladeshi government introduced new minimum wage rates by worker grades (Table 3.10, 3.11). As Miller (2012) has also shown, these minimum wage rates continue to fall woefully behind rising living costs and are driving individual lead-firms, such as Marks and Spencer, to experiment with new collaborative agreements with suppliers to guarantee higher contract prices if wage rates are increased substantially.23
23 The minimum wage includes basic wage (Tk2000for grade 7 workers, house rent allowance at the rate of 40 percent of basis wage which come to Tk 800 for grade 7 workers and medical allowance of TK200). In addition to the minimum wage, the workers can earn overtime benefit. No system of social protection or unemployment benefit system is prevailing in Bangladesh. Also there is no system of inflation adjusted wage rate. There is a system of 10 percent in increase in the basic wage annually, which is not practiced in all factories. See the “Cost of Stuff” video discussion of these issues between Doug Miller and Fiona Sadler, Head of Ethical Trading at Marks and Spencer. http://www.northumbria.ac.uk/sd/academic/scd/whatson/news/listen/stuff/costofstuff/

67
Table 3.10. Minimum wage (in current value of Taka) Grades of workers
Wage in 1994 Wage in 2006 Wage in 2010 % change between 1994 to 2006
%change between 2006 to 2010
Grade 1 4700 5140 9300 9.4 80.9Grade 2 3400 3880 7200 14.1 85.6Grade 3 2100 2449 4218 16.6 72.2Grade 4 1710 2250 3861 31.6 71.6Grade 5 1450 2046 3553 41.1 73.7Grade 6 1320 1851 3322 40.2 79.5Grade 7 930 1662.5 3000 78.8 80.5 Table 3.11. Inflation adjusted minimum wage Year Actual minimum wage rate
per month (in Taka) Inflation adjusted wage rate that would keep the real wage to the previous level
1994 930 2006 1662.5 1526.92010 3000 2242.6Note: Inflation adjusted wage rates have been calculated by adding each years average inflation rate with previous years value 3d iv. TPL, ROO and regional integration in Central America: Haiti, Dominican Republic, and Nicaragua Preferential access agreements and their associated rules of origin are important for exporting countries, but the degree of their importance is less clear and their effects on economic and social upgrading can be ambiguous. In examining firm-level responses to CAFTA-DR market access rules and tariff restrictions between 2002 and 2009, the World Bank (2010) found that tariff reductions had positive effects, allowing exporters to sustain markets who otherwise might have withdrawn or been excluded from export contracts. But, in both cases, the effects were relatively small. Our research on Central America suggests that duty-free trade preferences do not always lead to economic and social upgrading. We turn next to the examples of Haiti and Nicaragua. Haiti and the problem of policy complexity The complexity of trade agreements is a crucial issue for low-income newly industrializing countries, especially where governmental and firm-level capacities to negotiate complex requirements and associated paperwork may be limited. Nowhere is this more clearly illustrated than in Figure 3.10.
In 2010, the U.S. Government Accountability Office (GAO) analysed the effects of the Earned Import Allowance (EIA) Programme implemented to support Haiti’s apparel industry (GAO 2010). Introduced in 2007 as part of HOPE II (later the HELP Act), EIA relaxed the yarn and fabric restrictions for manufacturers in Haiti. Prior to 2007, manufacturers exporting garments to U.S. markets qualified for duty free status only if they used 100 percent yarn and fabric inputs from US sources. HOPE II allowed those exporters previously using U.S. yarns and fabrics to source up to

68
25 percent (later raises to 33.3 percent) of inputs from any source without loss of duty free status, provided they registered declarations for credits with the U.S. textile administration (OTEXA). In
Figure 3.10. Trade agreements signed and under negotiations in the Americas
Source: Adapted from Estevadeordal LAIA (2002: 5). Source: http://web.idrc.ca/openebooks/414-7/
Figure 3.11: Complexities of the EIA Process as amended under the HELP Act
Source: GAO (2010: 6).
69
practice, the complexity of the HOPE II arrangements meant that by 2010 no single company had used the provision, preferring instead to use a less complicated parallel HOPE II provision allowing limited duty free access for woven garments using any or all inputs from non-U.S. sources. By contrast to EIA take-up, exports to the U.S. under this parallel provision expanded rapidly. The GAO report also found that Haitian manufacturers exported T-shirts outside the HOPE II access preferences, instead preferring to use the even simpler and better known access provisions from the 2000 Caribbean Basin Trade Preference Act (CBTPA), even though rules of origin under CBTPA still require the use of US yarns. 3d v. CAFTA-DR and the Nicaraguan Textile-Apparel Complex24 In their work on Nicaragua, Bair and Gereffi (2010, 2011) demonstrated the central role played by preferential trade access to US markets in the competitiveness of export production in the export processing zones, and the ways in which this preferential access is under-writing an expansion of facilities, exports, economic upgrading, and possible social improvements in the conditions of work. Like EU OPT trade preferences (discussed above), the 807 trade law (now clause 9802) provides preferential access to U.S. firms importing clothing assembled offshore from fabrics supplied from the United States, with duty assessed only on the value-added abroad, (the cost of assembly). A 1986 amendment of the 807/9802 clause, known as 807A, further benefitted some countries in the western hemisphere by giving them virtually limitless quotas known as Guaranteed Access Levels (GALs) if they exported apparel assembled from fabrics both cut and formed in the United States. When it was created in 1986, the 807A revision applied to the countries of the Caribbean Basin, and was known as the “Special Access Program”. It was extended to Mexico’s maquiladoras in 1988 under the name of the “Special Regime”. The effect of such programs has been clear; while it extended employment into low-income countries, their direct incentives were to minimize assembly costs to limit the value-added pegged duties on re-import. The effects were maquila-style export processing platforms, few incentives for economic upgrading, and downward pressure on wages and investments in workforce training and development. In the 1990s, the 807 production/maquila model was gradually replaced by new regional agreements. The 1994 North American Free Trade Agreement (NAFTA) liberalized free trade among Canada, the United States, and Mexico while maintaining restrictive rules of origin that required that yarn and fabric inputs were sourced only in the signatory countries. The resulting special access to US markets increased Mexico’s profile as one of the leading suppliers of apparel to the US and the leading supplier in the late 1990s. Export manufacturers in other Caribbean and Central American countries were still subject to the value-added tariff and, as a consequence, they mobilized for “NAFTA parity”. In 2000 the United
24 The research on Nicaragua draws on Gary Gereffi and Jennifer Bair. 2010. Improving Competitiveness in the Textile-Apparel Industry in Nicaragua and the United States. A Capturing the Gains research report commissioned by USAID/CARANA and the National Free Zones Commission (CNZF/Government of Nicaragua) and Jennifer Bair and Gary Gereffi. 2011. Better Work in Central America: Assessing the Opportunities for Social Upgrading in Nicaragua’s Apparel Sector. Paper presented at the ‘Workers, Business, and Government: Understanding Labour Compliance in Global Value Chains’ Conference, 26-28 October 2011, International Finance Corporation, Washington DC.

70
States–Caribbean Basin Trade Partnership Act was passed and in 2004 the Dominican Republic-Central America Free Trade Agreement (CAFTA-DR) was enacted.25 CAFTA-DR restored parity with Mexico for Central America and Caribbean exporters, but with uneven consequences in the region. Exports to the US from the Dominican Republic and Costa Rica declined, being offset by growth in exports from Honduras, Guatemala, and Nicaragua. One result was that while the Dominican Republic was responsible for over a third of the region’s apparel exports in 1995, by 2009 its share of the region’s total had fallen to 10 percent. In both 2005 and 2009 Honduras ranked first among CAFTA exporters to the United States, with El Salvador, Guatemala and Nicaragua ranking second, third and fourth respectively. However, most exporting countries from the region were unable to increase the value of their exports during this period. Only Nicaragua did so, increasing from 8 percent of the region’s apparel exports to the United States in 2005 to 15 percent in 2009 (Table 3.12). But increased market share came at the expense of decreasing export unit values. Firms are mainly engaged in assembly and export expansion has largely been in low-value garments. Nicaragua’s post-MFA partial success has been driven by CAFTA-DR preferential access to US markets and by the less strict rules of origin it has received (Fernandez-Stark et al. 2011). Within Nicaragua, there are two competing apparel GVCs: one is Asian-based and the other is US-based. The Asian suppliers are predominantly concentrated in the knitwear sector, and they make the lowest-priced goods coming out of Nicaragua. The US-based companies are mainly involved with woven goods (e.g., denim jeans and khakis), which are more expensive on a unit price basis. A major US textile mill that was being built in Nicaragua by Cone Mills (part of the International Textile Group) opened in 2008, but was subsequently closed, limiting the country’s woven exports to what could be supported with imported textiles. Thus, Nicaragua’s drop in unit values is a product of the composition of its exports in which cheaper apparel items made by the Asian-based chains have expanded (Table 3.13).
Table 3.12. US Apparel imports from CAFTA-DR, 1995-2009
Value (in US$ millions) % of CAFTA-DR Market share
Country 1995 2000 2005 2009 ‘95 ‘00 ‘05 ‘09 CAFTA-DR 4,745 8,973 9,104 6,145
Honduras 919 2,323 2,622 2,032 19 26 29 33 El
Salvador 582 1,583 1,619 1,298 12 18 18 21 Guatemala 682 1,487 1,816 1,103 14 17 20 18 Nicaragua 74 336 716 893 2 4 8 15
DR 1,731 2,425 1,849 613 36 27 20 10 Costa Rica 757 819 482 206 16 9 5 3
Source: US Department of Commerce, Office of Textiles and Apparel (OTEXA): MFA Category 1: All apparel imports.
25 Participating countries include the United States, Costa Rica, Dominican Republic, Honduras, Guatemala, El Salvador, and Nicaragua. Each ratified separately and at different times. Nicaragua enacted CAFTA-DR in April 2006.

71
Table 3.13: US apparel imports: regional and Asian suppliers, 1990-2009
Partner Value (in US$ millions) % of world total market share
1990 1995 2000 2005 2009 ‘90 ‘95 ‘00 ‘05 ‘09World 21,937 34,649 57,232 68,713 63,105 China 2,739 3,518 4,499 15,143 23,503 12 10 8 22 37CAFTA-DR 1,434 4,745 8,973 9,104 6,145 7 14 16 13 10Vietnam 0.0 17 47 2,725 5,068 0 0 0 4 8Bangladesh 429 1,067 2,116 2,372 3,410 2 3 4 3 5Mexico 508 2,566 8,413 6,078 3,391 2 7 15 9 5Cambodia 0.1 0.5 808 1,713 1,871 0 0 1 2 3Total 23 34 43 54 69
Source: US Department of Commerce, Office of Textiles and Apparel (OTEXA): Imports by Country by MFA Category: Category 1: All Apparel.
Note: % represents a country or region’s market share of the total value of US imports of apparel from the world in a given year.
In 2009, 83 percent of Nicaragua’s exports to the United States entered the country duty-free under a variety of different special trade regimes. Over a third of exports (35 percent) entered under the regional rules of origin established by CAFTA and 47 percent were imported under the Tariff Preference Levels (TPLs) granted to non-originating exports (Box 3.1). Only 1.3 percent of exports were eligible for duty-free treatment under the short supply list, and less than 1 percent of Nicaragua’s exports used the cumulation provision of the CAFTA. The TPLs granted to Nicaragua under CAFTA-DR have been critical to the industry’s growth since 2006, and Gereffi and Bair (2010) found that all but one knit manufacturer interviewed relied on TPLs for some part of the fabric they purchase. Currently the TPLs are set to expire in 2014. Given long planning cycles, some companies will begin to make future location decisions based on TPLs as early as 2012. In the struggle over renewal, the one-to-one rule (i.e., equal content from CAFTA-DR and non-CAFTA-DR sources) will be useful in articulating the beneficial nature of U.S.-Nicaragua trade. As one manufacturer said to our researchers, “if the TPLs go away, so does the one-to-one rule. If you don’t extend the TPLs, then you won’t be able to make us buy your fabric” (Bair and Gereffi interview 2010). Although some US yarn and fabric mills have opposed the extension of TPLs to allow non-originating fabric to be used in imported garments qualifying for duty-free access to the US market, it is not clear that opposing the non-originating extension is in their best interests. Apparel exporters in the Americas are far more likely than Asian apparel exporters to use US-made fabrics and the TPL plus one-to-one rule ensures that US fabric inputs are sourced at the equivalent volume and rate of fabrics sourced from Asia. Nicaragua imports $14 million of US fabric, making it the United States’ third largest import market for woven fabric behind Mexico ($148 million) and Guatemala ($18 million) (Table 3.14). More importantly, Nicaragua is the only CAFTA country whose imports of US textiles increased between 2005 and 2009. In 2005, Nicaragua’s imports accounted for 1 percent of the total value of woven fabrics CAFTA countries imported from the US. At the same time, Nicaragua’s $14 million of imports in 2009 represented 36 percent of the total imports of woven fabric by all CAFTA countries. This growth in Nicaragua’s imports is occurring in

72
the context of an overall decline in imports by the region, where US exports of woven fabric peaked in 2004 at $128 million. By 2009, total exports to the region had fallen precipitously to $39 million (Table 3.15). Table 3.14. US exports of cotton denim woven fabric, 2000-09
Country/ region
Value (mil)2000 2001 2002 2003 2004 2005 2006 2007 2008 2009
World 506 455 445 437 559 443 388 285 235 214Mexico 348 316 326 284 362 302 229 126 131 148CAFTA-DR 11 12 17 67 128 78 89 118 75 39 Guatemala – 1 3 44 115 69 34 38 27 18
Nicaragua – –- – – 2 1 6 5 5 14 DR 7 9 10 16 9 1 2 10 6 5 Honduras – – 2 4 1.6 5 26 40 34 2 Costa Rica – – – 1 – 2 22 26 4 –
Colombia 2 3 2 19 24 34 46 18 12 12Canada 53 45 43 38 27 15 12 12 6 6Philippines 4 3 6 6 7 8 4 4 4 1Other Top 10 18 3 1 1 2 1 – – – 2
Hong Kong – 2 1 – 3 – 2 2 1 –Belgium 65 66 45 17 – – – – – –
Source: UN Comtrade: US Exports: HS-5209.42 as reported: CIF value. Note: Top 10 countries by year; (–) indicates country not in top 10 in given year. Table 3.15. US exports of cotton denim woven fabrics to CAFTA-DR, 2000-09
Country/ region Year2000 2001 2002 2003 2004 2005 2006 2007 2008 2009
CAFTA-DR world share 2 3 4 15 23 18 23 42 32 18
Country share of CAFTA-DR total (%) Guatemala 7 9 18 66 90 88 37 32 35 45Nicaragua – – – 1 2 1 7 4 6 36DR 60 77 62 23 7 2 2 8 8 11Honduras 4 5 14 7 1 6 29 34 45 6El Salvador 20 8 5 1 0 0 0 0 1 1Costa Rica 8 1 2 2 0 2 25 22 5 0Source: UN Comtrade: HS5209.42 as reported; CIF value. Note: (–) indicates the US did not report exports to Nicaragua 2000-2002. CAFTA countries are also an important market for exports of knit fabrics from the US; in 2009, CAFTA’s imports of $365 million made it the second largest recipient of US textiles, behind Mexico ($367 million) (Table 3.16). Unlike in woven fabrics, Nicaragua is not among the major CAFTA importers of US knit fabric. Nicaragua’s $20 million of imports put it in last place among CAFTA countries. However, while imports from countries such as El Salvador and Honduras appear to have fallen in recent years, Nicaragua’s imports remained steady.

73
__________________________________________________________
Box 3.1. Trade policy effects under CAFTA-DR
Rules of origin: The rule of origin for CAFTA are yarn-forward. CAFTA countries enjoy preferential access to the U.S. market for all apparel that is sewn in a member country from fabric either woven or knit from yarn extruded within the CAFTA region. De minimus: The yarn-forward rule of origin allows preferential access to qualifying apparel articles that contain materials which are not from the CAFTA region provided that the weight of the non-qualifying material does not exceed 10% of the total garment by weight. Tariff Preference Levels (TPLs): Given the lower cost, greater availability, and in some cases better quality of Asian fabrics, an additional provision of CAFTA allows Nicaragua to receive preferential access to the U.S. market for a certain quantity of apparel sewn in Nicaragua from materials that do not meet CAFTA’s rules of origin. Nicaragua was the only CAFTA country to receive these co-called Tariff Preference Levels (TPLs), and the maximum amount of non-originating garments that are permitted to enter the United States under the terms of CAFTA is equivalent to 100 million square meters (SME) per year. The CAFTA also specified that TPLs would be granted for a 10-year period, meaning that they are due to expire in 2014. This preference has been extremely important for Nicaragua, given the absence of domestic textile production in the country and the limited availability of cost-competitive fabrics being produced in the Americas. The "one to one” rule: To ensure a benefit in return for its concession on the TPLs, the United States added an additional condition to the TPLs for trousers made of woven fabrics. This condition is known as the “one-to-one” rule. Under this rule, each shipment of pants made from woven fabrics (either cotton or man-made fiber) that is imported under Nicaragua’s TPL allowance must be matched with a shipment of pants made from fabric woven in the United States from yarns extruded in the United States. The quantity of pants subject to the one-to-one rule has grown over time, and in 2009 it applied to the first 50 million square meters equivalent. Any shortfall in the commitment is then charged against the TPL for the succeeding year, thus reducing the volume of garments made from non-originating fabrics that can be given duty-free access the U.S. market. In 2009, the fourth year after the CAFTA-DR agreement, the shortfall was 761,138 SMEs. However, the shortfall for 2010 is expected to be an order of magnitude greater, which will negatively impact the availability of TPLs in 2011. Cumulation: The mechanism of cumulation with Mexico and Canada allows garments made in Central America or the Dominican Republic from fabric woven in these countries to qualify as originating under the CAFTA. The amount of Mexican- or Canadian-made fabric that can be used in CAFTA-qualifying garment is limited to 100 million SMEs, although the provision allowed for the possibility that this cap could be increased to 200 million SMEs, contingent on growth in CAFTA trade volumes. Commercial Availability Provision (also known as short supply): This mechanism allows the apparel and textile industry to petition for duty-free access for garments that do not meet the CAFTA rules of origin on the grounds that the fabric or yarn used in the garment cannot be supplied in the region adequate and timely manner or is unavailable from regional suppliers in sufficient quantity. Source: Adapted from Bair and Gereffi (2011).
_________________________________________________________________

74
Table 3.16. US exports of cotton knitted fabric 2000-2009
Country/ region
Values (mil)
2000 2001 2002 2003 2004 2005 2006 2007 2008 2009World 807 949 1,101 1,419 1,659 1,808 1,638 1,679 1,554 911Mexico 344 356 332 365 542 622 618 630 566 367CAFTA-DR 93 252 517 787 839 867 728 771 749 365 El Salvador 18 81 153 266 272 281 231 235 253 138 Honduras 27 87 244 340 351 380 317 340 338 107 DR 31 45 71 124 152 134 108 118 87 55 Costa Rica 13 17 30 34 37 31 28 32 27 24 Guatemala – 19 16 16 24 31 33 27 22 22 Nicaragua – – – – – 11 – 20 23 20Canada 196 182 141 146 146 130 111 86 75 63Hong Kong 26 20 21 25 24 21 16 – 17 12Dominica – – – – – – – 21 15 10Haiti –- –- – 11 26 60 35 22 – –Japan 15 13 10 – – – – –- – –France 11 – – – – – – – – –U.K. 11 11 8 12 8 – – – – –Germany – – –- – –- – 17 – – –-
Source: UN Comtrade: US. Exports: HS60 as reported: CIF value. Note: Top 10 countries by year; (--) indicates country not in top 10 in given year. In recent years, with the rise of full-package providers in China and Vietnam, US buyers have increasingly asked that their suppliers provide more services. Smaller country producers, such as Nicaragua, can benefit from this demand for additional services if they are able to develop more capacities in-country or in their region. In recent years, Nicaragua has been attempting to do just this by investments in a regional textile base. The ability to source inputs regionally or from lower-cost producers in Asia is an important part of this effort, but the ability to do so has depended on government policies to ensure credit availability and regional suppliers of fabric, particularly Honduran knit fabric suppliers (Bair and Gereffi 2011, 15) (Figure 3.12).

Figu
Source: Ge
3e. Trade 3e i. PostAfrica (SS Trade poliThe MFA qSub-Saharnumber of SSA appapercent anbetween 2percent, 2apparel ex15 percenhave beenEU importsimports asby 6 perce
26 This sectisummary re
ure 3.12: M
ereffi and B
agreement
t-MFA quotSA) apparel
cy and prequota regimran Africa (Sf firms all dearel exportinnd by a fur2004 and 225 percent xports to thet and in Sw
n further decs of appare
s a result ofent in 2008,
ion is abstraceports from S
apping Nic
Bair (2011).
ts and regi
ta loss, AGl 26
ferential mame led to siSSA). Quoeclined afteng countrierther 20 pe2008 (Tableand 30 pee US declinwaziland byclines in exel from Chif the global 20 percent
cted from Sta
Shane Godfre
caragua’s a
onal down
GOA, and th
arket accesgnificant ge
ota removal er 2004 (Taes. From 2rcent from e 3.18). Bercent in Kened by 3 pey 10 percenports assocna, and moeconomic in 2009 an
aritz (2010a;ey.
apparel ind
ngrading
he problem
ss have noeographicaldevastated
able 3.17). 2004-2006
2004-2008etween 20enya, Lesoercent in 20nt and 15 pciated with tore importacrisis. The d 10 percen
; 2010b), Sta
dustry: key
m of embed
ot always be expansion
d it; productiIn 2005, aptotal SSA , exports to04 and 200tho and Sw
005 and 200percent, resthe abolitionntly, with retotal value nt in 2010.
aritz and Mor
y actors and
ddedness in
enefitted lo of the appion, exportspparel expoapparel exo the U.S. 08, total exwaziland re06, in Lesotspectively. n of safegueductions inof SSA ap
rris (2012), a
d relations
n Sub-Saha
ow-income eparel exports, employmeorts fell in axports declideclined b
xports declespectively.tho by 25 p Since 200ard quotas n US and Eparel expor
and internal p
75
ships
aran
economies.industry in
ent and theall the mainned by 15y one thirdined by 12 In Kenya,
percent and08/09 thereon US and
EU apparelrts declined
project
5
. n e n 5 d 2
d e d l
d

76
Table 3.17. SSA apparel exports to the world (values in $US millions) 1995 2000 2004 2005 2006 2007 2008 2009 2010
World total value 152,532
193,669
251,337
268,431
290,596
318,533
338,119
299,415
326,254
SSA total value 1,137 2,089 3,235 2,796 2,765 2,995 2,826 2,271 2,040Growth rate (%) 13.2 46.1 12.4 -13.6 -1.1 8.3 -5.7 -19.6 -10.2Share of world (%) 0.7 1.1 1.3 1.0 1.0 0.9 0.8 0.8 0.6
Woven value 537 999 1,354 1,198 1,150 1,239 1,183 972 876Knit value 599 1,091 1,880 1,598 1,616 1,756 1,642 1,299 1,164Woven share (%) 47.3 47.8 41.9 42.9 41.6 41.4 41.9 42.8 42.9Knit share (%) 52.7 52.2 58.1 57.1 58.4 58.6 58.1 57.2 57.1Source: Staritz (2010b) using UN COMTRADE; apparel represents HS92 61+62; exports represent world imports; retrieved 2/5/2012. Table 3.18. SSA top five apparel export markets by year Partner country
Value ($US mil) Share of total (%) ‘00 ‘02 ‘04 ‘05 ‘07 ‘09 ‘10 ‘00 ‘02 ‘04 ‘05 ‘07 ‘09 ‘10
World 2,089
2,288
3,235
2,796
2,995
2,271
2,040
USA 791 1,175
1,865
1,541
1,362 965 829 37.
9 51.4 57.6 55.1 45.5 42.5 40.6
EU-15 1,037 849 1,01
1 919 1,156 943 801 49.
6 37.1 31.3 32.9 38.6 41.5 39.2
Botswana 44 55 72 62 74 90 97 2.1 2.4 2.2 2.2 2.5 4.0 4.8South Africa 24 29 27 39 69 85 97 1.2 1.3 0.8 1.4 2.3 3.7 4.7
Canada 18 14 29 28 26 26 29 0.9 0.6 0.9 1.0 0.9 1.2 1.4
Top 10 2,028
2,215
3,161
2,728
2,869
2,163
1,917
97.1 96.8 97.7 97.6 95.8 95.2 94.0
Source: Staritz (2010b) using UN COMTRADE; apparel represents HS92 61+62; exports represent partners' imports; retrieved 2/5/12. Within this overall general decline in SSA apparel exports there are important differences in the roles played by producer resilience to crisis, patterns of ownership, and US and EU end markets, with important effect on the main SSA apparel exporting countries. These patterns of resilience and the focus on specific end markets is partially shaped by ownership patterns, histories of contact and sourcing, and the degree of firm and manager embeddedness in the local community and regional economy. Gibbon (2002, 2003) pointed out the importance of end market segmentation for Mauritius and South Africa, arguing that apparel firms export either to the EU or the US depending on the end market and buyer requirements. Asian-owned firms in South Africa and Mauritius tended to export to the US market, whereas locally or European-owned firms tended to export to EU markets. The differential role of end market is even more pronounced in Lesotho, Swaziland and Kenya, where Asian-owned firms export almost exclusively to US

77
markets, whereas South African-owned firms producing in Lesotho and Swaziland export more to South Africa (Morris and Staritz 2011). In Madagascar Asian firms export to the US while European and Mauritian owned firms export mainly to the EU and recently also the South African market. For Morris and Staritz (2011) and Staritz (2010a) end market segmentation is related to social and linguistic networks. Firms oriented exclusively or mostly to the US market are Asian-owned (largely Hong Kong in Mauritius, Taiwanese in Lesotho and Swaziland, and mixed in Kenya and Madagascar). Generally, these investors also have other plants which had already supplied the US market before they came to SSA. They know the U.S. market and their global strategies are geared to it. In the only three significant exporters to the EU market strong historical, cultural and language ties seem to be important - South Africa to the UK, Mauritius to the UK and to France, and Madagascar to France. In particular French investors in Madagascar are part of French networks making access to, and maintaining close relationships with, French buyers and other actors in the industry possible. In the case of the South African market, South African apparel manufacturers relocating all or part of their operations to Lesotho and Swaziland have maintained close supplier relationships with South African retailers. Mauritius apparel exports peaked in 2003 and decreased by 17 percent from 2004-2006 but Madagascar’s apparel exports only declined by 4 percent in 2005. Overall exports to the US declined by 14 percent from 2004-08 but exports to the EU increased (Table 3.19). Table 3.19. Top six SSA apparel exporters by year
Exporter Value ($US mil) Share of total (%) ‘00 ‘02 ‘04 ‘05 ‘07 ‘09 ‘10 ‘00 ‘02 ‘04 ‘05 ‘07 ‘09 ‘10
Total 2,089
2,288
3,235
2,796
2,995
2,271
2,040
Mauritius 960 902 958 807 959 817 769 45.9 39.4 29.6 28.9 32.0 36.0 37.7Madagascar 368 240 561 539 696 578 378 17.6 10.5 17.3 19.3 23.2 25.4 18.5Lesotho 153 348 494 422 414 303 318 7.3 15.2 15.3 15.1 13.8 13.4 15.6Kenya 50 140 307 297 270 213 223 2.4 6.1 9.5 10.6 9.0 9.4 10.9South Africa 396 428 477 335 312 166 174 19.0 18.7 14.7 12.0 10.4 7.3 8.5Swaziland 37 102 191 170 143 100 99 1.8 4.5 5.9 6.1 4.8 4.4 4.8
Top 10 2,062
2,247
3,177
2,732
2,930
2,238
2,009 98.7 98.2 98.2 97.7 97.8 98.6 98.5
Source: Staritz (2010b) using UN COMTRADE; apparel represents HS92 61+62; exports represent partners' imports. Retrieved 2/5/12. There are also important differences in sourcing practices between EU and US end markets themselves. Buyers have different expectations of suppliers’ functions and capabilities. EU buyers seem to be more interested in flexibility and versatility and expect suppliers to contribute to design and product development (Gibbon 2008). US buyers emphasize the ability to produce to buyers specifications. They nominate specific fabrics and other input suppliers, mostly from Asia, and are generally not interested in suppliers’ contributions to design. Supplier firms stated that production for the EU market brings an overhead structure that is uncompetitive for the US market (Gibbon 2003, 2008). Moreover, there is a difference in the size of orders. US buyers demand high volumes in particular in the basic segment. European markets are not unified as in the US but are quite segregated and each country has its own retailers and chains with few large cross-border retailers. This translates into smaller orders. Orders from South African retailers are often even smaller than

78
average European orders although there are important differences between retailers such as Mr. Price servicing the lower to middle mass market segment and retailers such as Truworths aimed at the upper fashion market segments. Fulfilling these smaller orders is challenging in particular for transnational producer plants that are geared towards long run basic production for the US market. Regional trade agreements and preferential access: Trade regulations and Preferential Trade Agreements are central to understanding these differential patterns of end markets and the ways in which SSA economies have, or have not been integrated into apparel GVCs. Major preferential market access schemes can be divided into two types of agreements. These are regional and bilateral trade agreements, and the Generalized System of Preferences (GSP) (Staritz 2010a for detail). Developed countries, in particular the EU, Japan, and the US, have negotiated regional trade agreements to further regional production networks. Developing countries have also increasingly negotiated regional trade agreements, including the Southern African Development Community (SADC), the East African Community (EAC), the Common Market for Eastern and Southern Africa (COMESA), and the Economic Community of West African States (ECOWAS). However, negotiations and implementation have been slow, and apparel and textile products are often found on negative lists. In addition to regional agreements, countries have increasingly negotiated bilateral trade agreements, with the EU and the US being most active in this regard. With the removal of quotas and safeguards, tariffs remain and play an important steering role in apparel trade. Within the GSP, some major importing countries have negotiated preferential access for lower-income countries, such as with the Everything but Arms (EBA) and the GSP+ initiatives and the Lomé Convention and its successors, the Cotonou Agreement and the Economic Partnership Agreements (EPAs) by the EU and the Africa Growth and Opportunity Act (AGOA) by the US. Canada and Japan have also improved preferential market access for least developed countries (LDCs) in their GSP in the early 2000s (Figure 3.13). Preferential market access in these agreements is governed by more or less restrictive rules of origin (ROO), which have a crucial impact on outcomes. Most Favoured Nation (MFN) tariffs on apparel imports are around 11% for the EU and the US. However, these tariffs vary considerably for different product categories. In the US, tariffs on apparel products vary between 0 and 32 percent, with duties on cotton products ranging on average between 13 and 17 percent and duties on synthetic products ranging on average between 25 and 32 percent. In the EU, tariffs on apparel products vary between 0 and 12 percent; there are no systematic differences between cotton-based and synthetic products. In South Africa, the apparel (and textile) sector was protected by high tariffs until 1995. Since 1995 the sector has been liberalized reducing tariffs on yarns to 15 percent, on fabrics to 22 percent and on apparel to 40 percent in 2002 but then increased to 45 percent in 2010. In addition, 27 developed countries have provided tariff preferences to over 100 beneficiary countries through the GSP. However, tariffs for apparel products are only marginally reduced in the standard EU and US GSP.

79
Figure 3.13. AGOA, ACP, and EBA in Africa and the Caribbean
Tariffs notwithstanding, preferential market access to the EU and US has been crucial for manufacturers in SSA. Generally preferential market access to the EU requires fulfilling double transformation Rules of Origin (ROO). However, this changed with the EUs Economic Partnership Agreements (EPAs). Thus, for countries which signed interim EPAs in 2008 and 2009, including the five main SSA apparel exporter countries, ROO requirements changed to single transformation. Only South Africa has not signed an interim EPA and still has to fulfil double transformation ROO. For the US, AGOA was signed in May 2000 and came into effect October 2000. It has subsequently been extended and modified three times (from AGOA I to AGOA IV) and the current program extends until 2015. The principal element of AGOA is an enhanced set of trade preferences with increased commodity coverage beyond that of the US GSP (additional 1,800 tariff lines). Apparel and textile exports are not automatically eligible under AGOA as countries need to fulfil additional requirements. AGOA ROO requirements state that apparel has to be made 85% from yarns, fabrics and threads from the US or produced in AGOA beneficiary countries. However, a special rule - the Third Country Fabric (TCF) derogation - applies to lesser developed countries allowing them duty free access for apparel made from fabrics originating anywhere in the world. The TCF derogation was initially granted until September 2004 but then extended twice, ending in September 2012. Only South Africa requires triple transformation to qualify under AGOA.27 27 Besides varying ROO (in the past), an important difference between US and EU trade preferences is the value of the duty-free access which is lower in the case of the EU – for two reasons: First, as duty levels on certain apparel products, in particular synthetic-based products, are higher in the US than in the EU, and second, as EU preferences are accessible for all ACP countries and LDCs, thus, also some large Asian apparel producer countries, including Cambodia and Bangladesh; AGOA in contrast is only accessible for SSA countries.

80
Exports from Mauritius to the US declined by 12 percent between 2007 and 2009 and by 24 percent to the EU. Exports from Madagascar to the US declined by 27 percent and to the EU by 18 percent. Swaziland, Lesotho and Kenya accounted for export declines to the US of 30 percent, 28 percent and 22 percent from 2007-2009 respectively. As a result, the South African market has increasingly been penetrated by imports from Asia (particularly China, India, and Bangladesh) (Table 3.20). But the South Africa market has also become more important for Mauritius, Lesotho, and Swaziland, where duty free access has played an important role. Being part of SACU, Lesotho and Swaziland have duty-free market access to South Africa. In these countries export growth to South Africa has been largely driven by relocations of South African owned firms from South Africa to Lesotho and Swaziland due to labour costs advantages where the South African manufacturers have continued to supply their ‘local’ market from Lesotho and Swaziland (Morris et al 2011; Staritz/Morris 2011) (Table 3.21). The elimination of duties on apparel imports within SADC at the end of 2005 was important for Mauritius and Madagascar exporters, who have been successful in meeting the SADC double transformation ROO requirements given their (locally or regionally) vertically integrated textile and apparel sector. Table 3.20: Top six apparel exporters to South Africa by year Partner/ country
Value ($US millions) Share of world total (%) 2000 2002 2004 2006 2008 2010 2000 2002 2004 2006 2008 2010
World 192 177 564 1,016 895 1,248 China 95 96 419 798 543 920 49.6 54.5 74.4 78.5 60.7 73.7Mauritius -- 2 4 21 47 69 -- 1.0 0.7 2.1 5.3 5.5India 20 11 30 41 50 60 10.5 6.2 5.3 4.0 5.6 4.8Bangladesh -- -- -- 7 39 40 -- -- -- 0.7 4.4 3.2EU-15 16 12 21 25 26 25 8.5 6.6 3.7 2.5 2.9 2.0Madagascar -- -- -- -- -- 18 -- -- -- -- -- 1.5SSA total 24 29 27 52 80 97 12.6 16.2 4.9 5.1 8.9 7.7Top 10 180 166 537 965 800 1,183 93.6 93.6 95.2 95.0 89.4 94.8Source: Staritz (2010b) using UN COMTRADE; apparel represented by HS92 61+62; exports represented South Africa's imports from partner countries; retrieved 2/5/12. Notes: Other Asia describes areas in Asia not classified in UN COMTRADE; in practice, this primarily represents Taiwan. Intra-SACU trade (i.e. imports from Lesotho, Swaziland, Botswana and Namibia) are not or underreported in UN COMTRADE. Table 3.21. Lesotho and Swaziland apparel exports to South Africa by year 2005 2006 2007 2008 2009 2010 Lesotho HS 50-63 Rand m 7 19 34 161 299 410HS 50-63 US$ m 1 3 5 19 35 56HS61-62 Rand m 6 17 6 110 239 335HS61-62 US$ m 1 2 1 13 28 46Swaziland HS 50-63 Rand m 30 25 80 137 239 524HS 50-63 US $ m 5 4 11 16 28 72HS61-62 Rand m 11 10 45 96 133 432HS61-62 US$ m 2 1 6 11 16 59Source: Staritz (2010b) using South African Revenue Service (SARS). Notes: (1). According to SARS the accuracy of data for 2005 and 2006 should be treated with caution. (2). The Lesotho HS 61-62 data for 2007 does not correlate and is likely to be the result of a misclassification.

81
In 2010, exports stabilized again or increased – in Mauritius total exports increased by 19 percent, in Kenya by 4 percent, in Lesotho by 1 percent and in Swaziland total exports declined by -1 percent. In Madagascar however exports declined dramatically by 74 percent in 2010 due to the loss of AGOA status. In 2011, exports from the top five SSA US apparel exporters increased by 14 percent. The largest increase was recorded by Mauritius (31 percent) and Kenya (29 percent) followed by Lesotho (12 percent). In Swaziland exports continued to decline by -17 percent and in Madagascar by -27 percent related to the loss of AGOA. Exports from the top five SSA EU exporters increased by 7 percent in 2011. The largest increase was recorded by Ethiopia (479 percent), which however started from a very low level followed by Madagascar (22 percent) and Cape Verde (10 percent). Mauritius and South Africa recorded reductions of 7 percent and 11 percent. Regional exports to South Africa have increased for some countries, in particular since 2006 when duty-free market access was granted for apparel exports to the South African market within SADC. China still strongly dominates South African apparel imports accounting for 74 percent in 2010 after declining shares in 2008 and 2009 related to the imposition of quotas on Chinese apparel and textile imports in 2007 and 2008. India (5 percent) and Bangladesh (3 percent) are other important Asian apparel importers but reaching shares far below China. Mauritius increased its share from 0.7 percent in 2004 to 5.5 percent and Madagascar accounts for 1.5 percent of South African apparel imports, which is small but it has experienced large growth from virtually nothing in 2004 (and might be underreported as discussed below). Exports to South Africa from Lesotho and Swaziland also increased which is however not shown in UN COMTRADE data due to non-reporting of intra-SACU trade. Data from the South African Revenue Service (SARS) shows an important increase in apparel exports from Lesotho and Swaziland to South Africa since 2006. Kenya as a non-SADC member still faces duties of up to 45 percent and exports to South Africa are therefore nearly non-existent. Preferential access to major markets under the African Growth and Opportunity Act (AGOA) has been crucial in sustaining the remnants of the industry. It has maintained some jobs and these have been crucial to household and regional economies. But, the jobs it has sustained have been increasingly CMT assembly low-wage jobs. Rules of origin requirements have caused economic downgrading as high value-added segments of the industry have collapsed, and existing local or regional input and service suppliers have been unable to survive. As a consequence, the industry is now dominated by foreign-owned quota-hopping firms dependent on preferential trade agreements (PTAs), and any residue of the former South African and Kenyan fully-integrated full-package textile and apparel industry is rapidly disappearing. Kenya Like South Africa, Kenya had a domestic textile and apparel industry well in to the 1990s, supplying the domestic market and neighbouring countries. The industry was supported through import substitution development policies and from the 1960s textiles and apparel were among the most protected strategic manufacturing industries. By the mid-1980s the industry was in decline and suffered from thorough-going structural adjustment programmes. In the early 1990s Kenya liberalized its trade policies and emphasized export-oriented manufacturing platforms. Between 2000 and 2004, total apparel exports increased from $50 million to $307 million. With the ending of quotas, exports dropped to $297 million in 2005 and continued to decline to $213 million in 2009. In 2010 exports increased to $223 million and again in 2011 to over $261 million, largely due to increased orders from the US in 2011. The US is now Kenya’s largest market accounting

82
for over 90 percent of its apparel exports. Kenya does not register in the top five Sub-Saharan African exporters to the EU and – because it is not part of SADC– it is not one of the top six exporters to South Africa. Since the 1990s, Kenyan export apparel producers have been affected by trade policy in a new and different way. With liberalization Kenya’s domestic market for clothing was lost to the rapid influx of second-hand clothing (mitumba). The effect was to weaken local producers who became increasingly dependent on export contracts. The effects ran throughout the supply chain, leading to the closure of not only apparel producers but also textile mills, yarn spinners, and cotton ginners, as well as the collapse of the cotton farming sector. From the late 1990s on only the export industry survived and with the creation of EPZs it expanded. This industry is mainly expatriate-owned, although there is some partnering with Kenyans taking place, and exports are largely U.S. focused. The second-hand clothing market is a global value chain in its own right, with an intricate distribution system in Kenya (Figure 3.14). As a result, mitumba distribution and sale is now a big employer in its own right. In turn, this has generated strong opposition to efforts to place duties on second-hand clothing imports. The imported mitumba derives from public donations from charities and NGOs, community groups, and commercial collections banks, mainly from the US and Europe. These groups sell the clothing to commercial reclamation merchants and in-textile recycling plants to raise their own funds or for profit. The clothing is sorted, graded, washed, mended and baled, and shipped in containers (about 500 bales per container) to a low-income country importer. The importer stores and sells on the clothing by the bale to local traders and tailors for repair or alteration, and then to market stall holders for sale to the customer. Some goes directly to local trader for direct sale on their market stalls. In Kenya, there is a further step in the chain. The main chain would typically end at the big markets in Nairobi, but in some cases local traders also supply regional distributors who distribute the clothing to markets in outlying towns and rural areas. Many of these distributors are young and mitumba is, for them, an important source of income. This value chain also creates or maintains some ‘tailoring’ jobs which have functioned in small degree to absorb those workers shed from the formal industry. Mitumba rapidly captured Kenyan markets, destroyed demand for local production, and in that it is also shifting dress habits away from African cloth to imported, often branded, second-hand clothing it is undercutting markets for Kenyan textiles. Loss of both domestic and export markets led to the collapse of the domestic textile industry, so that only one yarn and fabric mill remains. This firm is about 35 years old, it supplies both US and EU markets, and is a fully integrated spinning, weaving and assembly operation. Its main plant is in Nakuru (fully integrated weaving operation) and it has a plant in Nairobi (fully integrated knitting operation). 80 percent of Bedi’s garment output is exported to the US and EU, with the remaining 20 percent going to COMESA countries and a small amount to local markets. It is a MUB programme beneficiary.

83
Figure 3.14: The Kenyan second-hand clothing value chain
Mauritius The apparel sector in Mauritius is fully dependent on preferential market access. It has always focused on exports, with its top twenty companies exclusively exporting their production. Given its small internal market, preferential access to European and American markets has been critical to the country’s industry. Mauritius became a member of the WTO on January 1995 and is also a member of the ACP group of states. At the regional level, it is a member of the AEC, the SADC FTA and COMESA Customs Union. Its membership in COMESA and SADC enables duty-free trade with their member states. Mauritius has duty-free access to the European market as a result of the Cotonou Agreement (and before that the Lomè Convention) and, with the replacement of the Cotonou Partnership Agreement (CPA), by the Economic Partnership Agreements (EPAs) between the between the European Union (EU) and the African, Caribbean and Pacific (ACP) states. Mauritius also benefits from duty-free and quota-free access to US markets as a result of AGOA. Historically, the apparel sector was primarily focused on the European market because of duty-free access and “also the high returns compared to other markets” (The RATES Center 2005: 1). Its main market is the United Kingdom followed by France, Belgium, Italy, and Germany, then the US, and to a lesser extent, SADC countries (especially South Africa). Apparel exports from Mauritius peaked in 2003 and decreased between 2004 and 2006. Exports to the US declined by 12 percent between 2007 and 2009 and by 24 percent to the EU (Staritz and Morris, 2012: 4), although AGOA renewal created new opportunities for exports to the United States, and exports stabilized in 2010 and increased in 2011.28 There are approximately 33 apparel companies, and one spinner that sells yarn to denim weavers. The industry is vertically integrated, and apparel firms source yarn from the domestic market. Because it is not classified as a lesser developed country, Mauritius does not benefit from third country fabric derogation under the AGOA, thus the closing of one of the two weaving mills in 2006
28 In 2011, Mauritius was third (after Lesotho and Kenya) with 17.3 percent of the share of SSA total.

84
– crucial suppliers of fabric to the apparel industry to meet rules of origin requirements – has forced the expanded use of imported yarns. The elimination of duties on apparel imports within SADC (at the end of 2005) was particularly important coming at the very time that exporters were experiencing declining orders from the EU and US buyers. Exporters have been successful in meeting the SADC double transformation ROO requirements given their (locally or regionally) vertically integrated textile and apparel sector. The SADC Trade Protocol thus opened up the SA market to Mauritius and regional trade is increasingly important for Mauritius. The East and Southern African regions are important both in terms of market and also as a potential source of imports, and with the decline of its own input suppliers Mauritius has a much stronger interest in processes aimed at regional harmonisation and integration. Lesotho An expatriate-owned apparel sector emerged in Lesotho in the 1990s. Primarily an MFA quota-hopping strategy by Taiwanese companies, these assembly firms benefitted from added incentives from AGOA after 2000. As a result, the industry has grown rapidly and remains predominantly Taiwanese owned. Quota loss resulted in some decline but, at the same time, South African-owned manufacturers dealing with rising labour costs in South Afirca relocated to Lesotho largely to supply South Africa markets, . This led to some recovery in the post-MFA period although not to previous levels of employment and output. Both the Taiwanese- and SA-owned firms are part of triangular manufacturing arrangements. The Taiwanese-owned firms have head offices in Taiwan, factories in Lesotho (and other countries) and supply the US. Many of the SA owned manufacturers in Lesotho are CMTs, either working via a head office in SA or via a ‘supplier’ or design house in SA that deals with the retailer and contract manufacture to the Lesotho-based CMT. Some Taiwanese-owned firms have cut their direct links with Taiwan or China and are now more locally ‘embedded’. The owners (usually a family) have become either SA or Lesotho citizens and, instead of operating as subsidiaries of Taiwanese-based firms, they now operate at arms-length from their original parent companies and work through agents. Fabric for both Taiwanese and South Africa manufacturers is sourced primarily from China. The capacity to source from South African textile mills has declined, although accessories are sourced from SA as well as Asia. There is only one textile mill in Lesotho – a denim mill owned by large Taiwanese group that supplies jeans to Levi and the South African market. They still supply US markets but are actively looking at the growing South Africa market and are trying to establish links with South African retailers. Lesotho joined the WTO in 1995 and is a member of the ACP group. At the regional level it is a member of the EAC, the SADC Trade Protocol and SACU. It is covered by AGOA and benefits from special dispensation for sourcing yarn and fabric as a LDC. It is a signatory of the interim SADC Economic Partnership Agreement with the EU which gives it duty and quota free access to EU market. It is part of the SACU-EFTA Agreement and the SACU-MERCOSUR Preferential Trade Agreement. It also benefits indirectly as part of SACU from duty free goods imported to into SA under the EU-SA TDCA AGOA is now critical for the Taiwanese owned firms and SACU is important for the SA owned firms, although Lesotho’s lower labour costs are also important. Both give duty free access to their respective markets. AGOAs special rules of origin dispensation for less developed countries allow Lesotho to source yarn and fabric globally and, thereby, to reduce input costs. This special

85
dispensation is critical for the survival of the industry and was recently extended until 2015. If Lesotho-based exporters had to meet the triple transformation rules of origin all Taiwanese-owned firms would close. If it was changed to double transformation then only the jeans manufacturers would be able to survive in Lesotho, because of the local denim mill. AGOA is a double-edge sword for Lesotho. On the one hand, the rules of origin dispensation sustains export contracts and local employment. On the other hand, Lesotho’s need to attract greenfield investment depended on significant tax concessions and the provision of industrial, logistical and energy infrastructure. The overall result has been that firms were attracted at high cost to provide low paid jobs. Apparel workers in Lesotho do not earn enough to stimulate the economy through consumer spending, they are not developing their skills, indigenous management and ownership is further emerging, but only very slowly and in small numbers and the country is not earning enough from taxes to be able to make significant investments in development. Any hopes for the development of backward linkages regionally with South African fabric manufacturers diminished as the industry there declined (see Godfrey and Pike 2012). South Africa South Africa is not part of any typical apparel GVC. Despite, AGOA, SA-EU FTA, Southern African Customs Union (SACU), and the Southern African Development Community (SADC), South African firms have been unable to develop export markets in the US and EU. It has historically exported only a very small proportion of its apparel output (less than 10 percent), mainly to the UK and EU. Thus, while preferential access agreements benefitted neighbouring countries, they disadvantaged South African apparel firms. In particular, AGOA triple transformation requirements have not benefitted the industry as it has in Kenya and Lesotho (except for a short period in about 2001/2 when the Rand devalued steeply and South Africa qualified as a Less Developed Country). Since then South Africa is the one country in Sub-Saharan Africa that has not been so classified and, as a result, it is subject to the triple transformation rule. With little benefit from AGOA, South Africa has lost its US-directed export industry. South Africa manufacturers are now starting to ‘export’ to the SSA region through the expansion of South African retailers into the region, but much of this regional apparel trade is the re-export of imported clothing. Historically, South Africa had a large integrated textile and apparel industry. This collapsed in the 1980s and was marginalized even further in the 1990s by government policies (especially GEAR) and their commitments to hi-tech industries. There are now few spinning and weaving firms still operating. Knitting firms have survived, but most of these have shifted from clothing to producing home textiles and industrial textiles, which have higher margins. The vast bulk of apparel fabric is now imported from China (and other Asian countries), despite the 22 percent import duty (import duties on apparel imports are 45 percent). This is seen by some in the apparel sector as key to its uncompetitiveness, resulting in pressure on the government to remove the duty on textiles, a move that would effectively abandon the residual textile industry in order to save the apparel sector. The counter argument is that a successful apparel sector needs a local textile sector. At present there is no indication that government will remove tariffs, but few local apparel firms are sourcing textiles from local manufacturers and the vast bulk of woven fabric is imported from China and other Asian countries. The domestic market has always been the critical market for SA manufacturers. It is dominated by six very big retailers (Edcon, Truworths, Woolworths, Foschini, PEP, Mr Price).29 From early in the
29 Pick and Pay is a major multiple retailer that also sells apparel, but in smaller volumes compared to these six.

86
2000s these retailers started sourcing offshore and now about 70 percent or more of the domestic market has been lost to mainly Chinese imports. At present the South African domestic market is the main regional market for apparel manufacturers. The South African Customs Union allows manufacturing by South African-owned firms in Lesotho and Swaziland to ‘export’ back to South Africa duty free. The SADC Trade Protocol has also resulted in Mauritius and Madagascar increasing duty free exports to the SA market. But markets in the region are potentially opening up to South African manufacturers because of expansion of SA retailers into the region. The failure to integrate South African textiles and apparel into AGOA has been a major constraint on upgrading in the industry in sub-Saharan Africa. Low-income countries have been able to attract only assembly operations and, without access to low-cost local yarns and fabrics, few have been able to leverage any additional operations beyond CM and CMT work. Regional backward linkages have not emerged and, as a result, the once fully-integrated South African and Kenyan production systems have declined and fragmented. With the rise of regional value chains and new consumer markets, the industry is in a weak position to supply retailers and imported clothing especially from Asia dominates the retail sector. 4. The future of apparel trade policy 4a. Trans-Pacific Partnership (TPP) In recent years, the Trans-Pacific Partnership (TPP) has emerged as an important arena of trade policy discussion. TPP includes 20 chapters relating to harmonization of customs, cross-border services, telecommunications, government procurement, competition policy, and cooperation and capacity building. It currently includes Australia, Brunei Darussalam, Canada, Chile, Malaysia, Mexico, New Zealand, Peru, Singapore and Vietnam, and offers reciprocal tariff arrangements to provide access to each other’s industrial goods, agriculture and textiles markets. David Birnbaum (just-style.com 3 May 2012) has recently suggested that the current TPP discussions will bring to an end a two decade period during which negotiations for US apparel-related free trade agreements have been governed by two assumptions.
1. The support of, and protections for, the US textile industry is essential for apparel free trade agreements to pass in Congress.
2. Free trade agreements increase trade liberalisation, which directly benefits the US. The first assumption has meant that negotiations for preferential access and tariff and duty reductions for exports to U.S. markets have been subject to permanent struggles and compromise to ensure that textile manufacturer markets are protected, often against the interests of importers and their suppliers. The resulting restrictive rules of origin maintained access for US yarn and fabric manufacturers to offshore production in at least three ways:
1. To qualify for duty-free access apparel imports must be produced in the free trade area, from fabric woven (or knitted) in the free trade area which, in turn, was produced from yarn spun in the free trade area – the yarn forward rule.
2. To qualify for duty-free access, apparel imports must be produced using US-made thread. 3. To qualify for duty-free access, apparel imports must be produced using US-made pocket
lining (Birnbaum 2012).

87
The second assumption has been that trade liberalization and more open markets expand competition, increase the efficiency of allocation decisions, minimize factor costs of production and reduce retail clothing prices, with benefits for consumers while reducing inflation. Certainly, the phase-out of quotas reduced quota rents and unit prices generally declined as production increased from China, Bangladesh, and Vietnam. For Birnbaum (2012):
[T]he Trans-Pacific Partnership (TPP) has brought us to the end of the line, where these assumptions no longer make any sense. 1. Compromise to build consensus with the US textile industry is out the window. TPP
includes Vietnam, the US's second largest supplier of garment imports, after China. No-one believes that the US textile industry will support a trade agreement granting duty- free access to made-in-Vietnam garments.
2. Regional free trade agreements as a source of trade liberalisation leading to lower prices is flushed down the toilet. Imports account for 97 percent of all garments sold in the US. As a result, regional free trade agreements are now zero-sum, where exporters in the free trade zone take market share from exporters outside the zone – which has no effect on FOB prices or inflation.
Thus, TPP introduces an entirely new principle into US trade policy. While traditional preferential access agreements were designed in part to protect national textile manufacturers, TPP Plan A will benefit every member. The result will certainly be a loss of direct or one-plus-one guarantees for U.S. yarn and fabric suppliers. Vietnam will be the main direct benefactor of this arrangement and other signatories will benefit indirectly from their access to its lower cost yarns and fabrics. Whether the U.S. Congress will support TPP remains unclear. Birnbaum (2012) argues that:
The TPP negotiators on both sides must come to terms with the new reality. They must recognise that arguing about the yarn forward rule versus the fabric forward rule is as irrational as standing on the deck of the sinking Titanic, watching your fellow passengers fighting to get on the life-boats and feeling happy because if they leave, you stand a better chance to win tomorrow's shuffle-board tournament. Instead, TPP provides the perfect opportunity for change…. For the first time in 20 years we are in a position to create a new strategy which will change forever the way the US Government views garment free trade agreements.
At the global level over this period, major international governance institutions have focused primarily on trade facilitation, marketization, and property rights (most notably the IMF, WTO, World Bank, and the World Intellectual Property Organization). Their commitments to the liberalization of trade and investment underwrote the spread of production to poorer economies where state governance capacities were weak. In other places, global governance institutions and their structural adjustment programs had the direct or indirect effect of weakening national labour protections and rights, especially in special economic zones (SEZs) and export processing zones (EPZs). Only recently have these organizations integrated core labour rights into their programs.30
30 The International Finance Corporation integrated core labour standards into its lending in May 2006 and the World Bank did so into its infrastructural project funding in December 2006. http://www.ituc-csi.org/world-bank-takes-major-step-on.html

88
Notwithstanding recent linking of labour provisions to trade agreements, the integration of labour standards into the policies of the Bretton Woods institutions, and the emergence of new regulatory institutions in the global South, significant obstacles remain to the development of effective inter-governmental regulatory or distributive governance capacities at the international or global level. For the moment, at least, although it is very weak in some countries the national state remains the main actor in the provision of public governance capacities, whether through laws, occupational regulations, or monitoring institutes of labour or health and safety. Despite the erosion of state-level governance mechanisms, Lopez-Acevedo and Robertson (2012: 2-4) have shown that domestic policies targeting the apparel sector, ownership type, and functional upgrading in suppliers play an important role in explaining the shift in production for export among countries, while wage differentials explain only about one third of the shift. Countries that gained the most (including Bangladesh, India, Pakistan and Vietnam) were those with governments that implemented proactive policies for the industry. Although many state efforts have focused on industrial policy and economic upgrading, some emerging economies have also begun to adapt their existing state institutions and develop new governance capacities to regulate production processes and expand protections for workers in export industries. Thus, Piore and Shrank (2006: 2) report that:
Brazil, Chile, Costa Rica, and the Dominican Republic have rededicated themselves to labour law enforcement in recent years. And potentially more fundamental reforms are underway from Argentina, where they are motivated by domestic party politics, to Central America, where they are a product of transnational pressure emanating from the campaign for a US-Central America FTA.
Similarly, in Bangladesh, deep social unrest driven by low wages and poor working conditions led in 2010 to a coalition of major apparel buyers – including Walmart, Tesco, H&M, Zara, Carrefour, Gap, Metro, JCPenney, Marks & Spencer, Kohl’s, Levi Strauss and Tommy Hilfiger – joining labour advocates in pressuring the government for a major increase in the minimum wage for apparel workers. In response, Bangladesh increased its minimum wage in the apparel sector by 80 per cent. The cases of institutional reforms in post-socialist states may also be instructive. In these countries, the roles played by former state socialist institutions have changed quickly in recent years. Planned economies were deregulated quickly after 1989, state institutions were weakened, and manufacturing industries suffered massive retrenchment, with the loss of long established CMEA markets and trade. Export-oriented industries declined, employment was shed rapidly, and plant and capital were redirected into private hands, sold, or abandoned.31 But most post-socialist states retained the working (albeit weakened) institutions of state socialism (labour inspectorates, health inspectorates, working hours law, overtime regulations, insurance and pensions requirements, etc.), and by the late 1990s and early 2000s some governments (such as Bulgaria and Slovakia) were providing them with additional support and funding to ensure that basic working conditions were better regulated. While many cases of workplace abuse and hyper-exploitation 31 By the mid-1990s, the delocalization of European and US clothing manufacture had revitalized the industry throughout the region around stitch-up, CM and CMT contract manufacturing, structured largely by international buyers and manufacturers. As a result, the industry re-emerged quickly, but largely under the radar of the state authorities. These remained weak and the institutions of the state continued to be under-funded and under-incentivized (see Begg, Pickles and Smith 2003).
89
have been reported (most notably in Bulgaria by Clean Clothes Campaign), in general the legacies of labour inspectorates, health and safety inspectorates, respect for working hours, child labour laws, and wage payments and contract conditions, remained important partial regulators of predatory business practices (Pickles et al 2006; Smith et al 2008).32 Bangladesh also benefitted from early state intervention in the provision of bonded warehousing to delay customs payments and the introduction of back-to-back credit systems that were the necessary conditions for local manufacturers to be in a position to take advantage of the boom in export contracting that followed quota removal. More recently, Nicaraguan government investments in basic infrastructure and workforce development, along with commitments to regional integration with neighbouring Honduras fabric manufacturers, have proven beneficial to its continued improvement in export performance. South Africa is a study in contrast in this regard; until recently lacking direct state policies relating to textiles and clothing, the industry collapsed and possibilities for regional integration of South African fabric suppliers with Lesotho-based apparel manufacturers were absent. A rescue package has been introduced in the past 18 months and there is some evidence that it is helping. Perhaps the best known of the new state-led initiatives is the labour reform movement in China. In 2007, in response to the increasing deficits carried by state-owned enterprises, social unrest among the rapidly growing number of factory workers in export processing zones, and international pressure from NGOs, trade unions and some major buyers concerned about brand reputation, the Chinese government initiated far-reaching reform in its labour laws. These were already signalled in 2005 with the state-sanctioned naming of the Chinese Year of Corporate Social Responsibility, a commitment to harmonious work and society that has been consolidated and expanded in subsequent years (see China CSR 2010). In January 2008 the new Chinese Labour Contract Law came into force.33 It was developed partly in response to growing public concern about the mistreatment of employees, the growing numbers of cases where managers failed to pay proper wages and the rapid increase in seasonal and temporary (often migrant) workers that followed from the collapse of state-owned enterprises and the loss of guaranteed employment. It was also developed as part of a broader strategy of industrial upgrading attendant on the goal of offshoring lower value production. The law aimed to re-assert the basic values of labour protection in state policy and to deal with some of the ways enterprises were getting around the existing labour laws. With increasing financial pressure on state-owned enterprises and weak regulations for private firms, employers were increasingly avoiding payment of benefits. They employed workers on probationary contracts, or they avoided offering permanent contracts by employing workers on a series of short-term repeating contracts. Under the new law, employees were given formal term contracts; they can only be terminated with cause; and after a maximum of two term contracts, the employee must be given an open-ended permanent contract, which ends only with the employee terminating his or her contract, termination for just cause, or retirement. Under the new law, individual workers and the worker’s union are also able to go to court to enforce their rights.34 One
32 For documentation of abuses in Bulgarian supply chains, see Ivanka Laleva and Bettina Musiolek’s (1999) account of the “Conditions in the Savina factory”. For discussion of the consequences of state socialist institutions on post-socialist working conditions, see Pickles and Smith (2011). 33 For a more detailed discussion of the origin and impacts of the law see Lan and Pickles 2011. 34 The Shanxi black brick kiln slavery incident of 2002 and the abuses suffered by workers there resulted in language being appended to the Labour Contract Law making the relevant government bodies, the employing units, and their staff each liable if workers come to harm by their failure to carry out their duties, or if the government bodies or their staff violate the law in the exercise of their powers.

90
provision of the new labour law required negotiations between workers and companies over the terms and conditions of work and, while independent trade unions were still not allowed, more significant roles were assigned to the All China Federation of Trade Unions (ACFTU) in China’s labour relations system. Questions about implementation and the independence of the judiciary remain, but labour law reforms have had important consequences for workers in China and, by example, for workers elsewhere (Global Labour Strategies 2008). The labour law has encouraged workers to fight for their rights, with a rapid increase in the number and strength of labour disputes. In 2007, China’s labour dispute arbitration committees accepted 350,000 cases, an increase of 10.3 percent from 2006 (CLB 20008, 14). The same survey revealed that the average number of workers in disputes had risen to 28.6 in publicly-owned enterprises and 51.3 in privately-owned enterprises. During the first quarter of 2008 alone, the labour courts in Dongguan, Shenzhen and Guangzhou (the three industrial cities in the Pearl River Delta) accepted more than 10,000 cases, double the number over the same period the year before (Wang et al. 2009: 492). Labour costs have risen and manufacturers have responded with layoffs, increased labour contracting, “tricking the contract”, and – in more extreme cases – relocating factories to provinces or countries with lower costs (Zhu and Pickles 2013). The result is an increase in the cost of labour in some factories, the stabilization of working conditions for core working, and the increased level of precarity for millions of low-wage temporary contract workers throughout the country, particularly with the rise of non-renewable three month contracts. The Labour Contract Law also changes the ways in which multinational companies must deal with worker organizations, leading to sourcing shifts as buyers manage risk by complementing orders from China with orders from other low-cost regional producers, such as Indonesia, Vietnam and Cambodia.35 5. Trade policy and gender upgrading and downgrading in apparel global value chains Current trade policies are structured around two main assumptions; (i) compromise can only be achieved if the interests of fabric and yarn manufacturers in the industrialized countries of the EU and US are protected; and (ii) trade liberalization is a mechanisms for pushing down prices of consumer goods and controlling inflation. Both policies have important implications for the availability and quality of women’s work. Rules of origin that require fabric and yarn imports consign many suppliers to cut, make, and trim operations. Combined with low contract pricing generated by competition from suppliers in other export platforms, the type of jobs that are available to low-income countries remain constrained to low-wage, low-value added, and low skill levels. Workforce development initiatives are, as a result, limited to protecting access to low-wage labour pools and marginal increases in skills training to allow minor changes in production process as the demands of buyers for fast fashion, quick turn, or improved quality press on to suppliers. Given the preponderance of female workers in the industry, particularly in CMT production, preferential market access has created and/or sustained jobs for women in conditions where there might not have been paid work available. Their incomes have contributed small amounts, but marginally crucial amounts, to family income and – given that most of the wage is spent on household reproduction – to the regional economy. However, the jobs are low-wage and often
35 Author interviews, 2007, 2008 and 2009.

91
difficult, there is little training and few opportunities for workforce development, and suppliers are often so dependent on contract deadlines and penalties that overtime (paid and unpaid) is common. In some countries, such as Jordan, migrant workers and casual employment have become the mainstay of the industry. Several key findings can be noted:
• MFA quota trade expanded job opportunities in many developing economies. These jobs were largely CM and CMT assembly work, often in export processing zones, and nearly always employing predominantly female workers.
• The expansion of women’s apparel employment in developing economies resulted in job
loss and negative effects on women’s apparel employment in traditional manufacturing regions in OECD countries.
• The jobs created in apparel global value chains have been predominantly characterized by
low wages, strenuous work, poor working conditions, work intensification, anda a high degree of control over labour.
• The feminization of apparel work in conditions of limited opportunities for economic upgrading has had serious consequences for the ability of workers to deal with generalized downward pressure on wages.
• The period of employment is also often interrupted as younger cohorts are employed. For
example, “In China, the Ministry of Labour found that three-quarters of textile [and apparel] factories would only employ women between 18 and 26 years old” (Korinek 2005: 15). Where factories hire older workers, the additional costs associated with families, housing, health care, family leave have increased pressure on wages (UBS 2004).
• Nonetheless, for women who previously lacked access to waged work, many gained
greater levels of economic independence and benefitted from expanded household income and stronger positional power in household decision-making (Korinek 2005: 14). For many young female migrant workers, apparel employment was an opportunity for upward mobility.
• However, with large labour pools of unskilled workers and limited skill demands on the part
of producers, wages remained significantly below those in other manufacturing sectors (especially those employing higher proportions of men) and the gender wage gap seems not to have narrowed.
• In some locations, the expansion of employment opportunities in other manufacturing and
service sectors, such as electronics and tourism, has resulted in tightening labour markets in areas formerly thought to be characterized by large surpluses of potential unskilled workers. Long hours, poor working conditions, and limited opportunities for advancement have resulted in young women switching jobs, while in better working conditions (such as in China and Vietnam) your women and men have been found to increasingly see apparel employment as either a source of short-term income to invest in other activities later, or a kind of internship in which skills are learned that allow workers to springboard into better paid and more upwardly mobile occupations.

92
• This is compounded by the geographical separation of functions that resulted from the
disaggregation of textile and apparel manufacture has further impacted the nature of women’s work. By separating higher-skilled and higher-paid occupations in textile manufacture, design, and marketing from assembly stitching-jobs, export-oriented apparel jobs have been heavily characterized by low skill, low education, and low wages. Many suppliers have had little incentive to upgrade jobs and buyers and retailers have captured value by squeezing contract prices. As a consequence, turnover rates in apparel jobs are high, which in turn reduces opportunities for both workforce development and labour organizing.
• CtG researchers have found evidence in some countries of a sea-change in attitudes
towards workers in the apparel industry. This sea change has emerged differentially across different value chains. In low-road, low-price mass goods sectors of the industry, predatory sourcing and work practices are still common and regional labour markets dependent on them continue to face series challenges for workforce protection and upgrading. In high-road, higher value, more specialized markets strategic partnerships between buyers and suppliers have been more common in order to sustain the more demanding requirements of quality, delivery time, and flexibility in managing orders. In these situations, skill development and improved work organization and working conditions have been stressed. In other contexts, such as China, national legislation has nominally increased the ability of workers to redress workplace abuses. In both settings workforce development is, as a result, a crucial aspect of firm strategy (Fernandez-Stark, Frederick and Gereffi 2011).
• Some research suggests that upgrading the quality of women’s work and expanding their
responsibilities in the production process yields higher productivity, but only if wage levels and job opportunities are commensurate. Research on supplier initiatives in Nike, Marks and Spencer, and Knights Apparel supply chain all point to the reciprocal relationship between workforce development and productivity gains.
6. Regional trade agreements, costing time and the growing importance of logistics The success of preferential market access policies in generating economic and social upgrading outcomes depends increasingly on the ability of suppliers to source inputs and ship final goods in an increasingly competitive logistical environment. In their early experiments with global sourcing, many EU and US buyers paid little attention to the full-costs of sourcing from distance locations. In part because rules of origin required specific inputs, globalized trade policy driven sourcing was focused on managing factor costs (particularly wages). More recently, as buyers and producers have gained more control over input sourcing, major buyers and logistics firms have focused much more attention on a broader range of actual costs of sourcing across globalized supply chains. These include the costs associated with delivery times and delays (including direct costs of shipping, storage costs during border delays, and reputation costs to suppliers whose deliveries are regularly delayed), reverse sourcing, insurance for goods in transit, and ‘frozen’ capital, capital at risk, and the length of lead-time in ordering in extended supply chains. Each has become increasingly important in sourcing decisions and supply chain management, with direct implications for the kinds of contract regularity and price buyers are willing to offer to suppliers in different regions.

93
Large global apparel buyers manage risk in supply chains across long distance in a variety of ways. These risk management strategies involve two primary strategies. First, they focus on diversifying sourcing patterns to ensure that their orders do not become captive to bottlenecks, labour unrest, and pricing policies in major producing regions. Thus, while Chinese manufacturers have certainly squeezed out many smaller producers because of their comparative advantages in factor costs, especially labour costs, the rise of China is more complicated and has, in turn, stimulated an expansion in sourcing from other regions. To counter-balance the risk of disruption resulting from supply chain concentration major buyers in Japan, for example, source “China+1”,2 with Indonesia, Cambodia, Vietnam, and other southeast or south Asian producers balancing the dominance of Chinese supply. Similarly, many major US buyers have adopted ‘China +2’ or ‘+3’ sourcing strategies. These changes are predicated on rapid upgrading of infrastructural and logistics services in these regions in recent years. Second, buyers deploy risk management strategies by sourcing from proximate suppliers whose lead-time for orders and delivery time for product is much shorter. While factor costs of goods sourced in the US from Central American and Mexico generally exceed those of Chinese and Southeast Asian producers, specific products with higher quota and tariff costs from Asia and differential logistics costs generated by longer supply chain actually mean that relative real costs may favour sourcing suppliers from these regions. Lead-times are shorter, delivery times can be as low as one or two days, and hence buyers are able to manage supply and demand in ways that reduce costs. In both cases, current sourcing patterns both drive and are driven – in part – by changes in logistics and the timing and efficiency of delivery. Buyers have become more focused on the real costs of shipping and policies that directly affect trade (such as quota and tariff costs), in addition to factor costs such as labour. As labour and input costs have each been squeezed to their practical limits, supply chain management has become an increasingly important focus of attention, particularly where the costs of delivery time, delay, inventory, lead-time, the percentage of blind-buys, etc., continue to offer opportunities for extracting value and enhancing competitiveness. In this context, buyers have become much more interested in changes in supply chain management that maximize their abilities to control costs, improve quality and delivery times, and enhance flexibility throughout the process. Asian suppliers are well aware of this shift in focus and the potential it has to reduce their cost effectiveness. They have responded in two main ways. One is to expand their investments in and close to major markets, buying into warehousing facilities in Eastern Europe, production platforms in Jordan or Central America, or buying textile and garment factories in new EU member states or Mexico. The second response has been to press the state and trade associations to invest more directly in facilities that will allow them to manage their own lead-times and delivery times in increasingly flexible ways, reduce their time to delivery, and expand the integration of road, rail, port, sea, and air transport in ways that enhance their capacity to manage inventory and supply in ways that reduce costs and increase their responsibilities to buyer needs. These investments have improved physical infrastructure and reduced port and delivery times rapidly in recent years. These are particularly important considerations for ‘just-in-time’ production and retailing models that are becoming increasingly important for apparel buyers and retailers. But, the increasing turn to just-in-time in apparel creates problems for sourcing and shipping based on more common

94
average freight costs instead of actual costs, failing to account for the specific needs, timing, and full cost of delivery of different products. In a recent interview, John Quarmby, Chairman/VP of Schenker (Thai) Co. Ltd noted that “just-in-time does not have many friends in the logistics business. They [buyers] calculate it on a perfect model that rarely works, and costs to cover mistakes are massive.”36 Losses, thus, seem to be borne as ‘cost-of-business’ expenses out of gross margins, an unsustainable situation if just-in-time emerges predicated on the assessment of the specific costs of logistics and timing of delivery. Managing costs in global production networks and value chains thus always means ensuring supply and managing time. The techniques for managing time involve the entire production process and GVC, and in particular they involve the management of logistics. Apparel time is money, and the cost of apparel time always has consequences for the struggles over and distribution of value. As time horizons shorten, suppliers may become more effective in competition with suppliers in other reasons, employment becomes more secure and/or increases, and the technical demands of just-in-time production may increase skill levels, wages, and the pressures on work-time. For those whose infrastructural and logistical capacities remain limited, the effects of a ‘logistics deficit’ can be devastating for firm viability and job sustainability, often with the consequence that unit values of production decline, orders are increasingly restricted to low-value CM and CMT production, and contracts become more uncertain. Since the 1970s, the globalization of supply chains and the emergence of new centres of production for world markets have depended upon new technologies of transportation and the expansion of port facilities in new exporting economies. Inter-regional competition among low-cost producers, along with international and national policies supporting trade facilitation, have stimulated competition and innovation across the logistics industry and driven down the costs of delivery to major markets. As a result, the global logistics industry is rapidly integrating new technologies and management strategies in road, rail, shipping, and air freight systems to decrease delivery times, reduce cost, and increase the services they provide to global buyers. This has been compounded by the rise in recent years of fast fashion sourcing. As response and delivery times become more important, poor trade logistics can be detrimental to the competitiveness of manufacturers. Complicated border crossings and customs requirements often lead to long and uncertain delays, and the costs associated with time and distance can add greatly to the cost of production. As a result, producers in some reasons must bear additional cost premiums solely because of the direct and/or indirect costs of shipping from their location to their major markets. The following three tables use World Bank Doing Business data for 2012 to illustrate the relative costs and time to import a 20-foot container for apparel. In Sub-Saharan, North Africa, and the Middle East, cost-premiums depend in large measure on distance from primary markets. Morocco. Mauritius, and Jordan have advantage in shipping time over sub-Saharan African and even over East Asian producers, but only Morocco has cost advantages that are even close to those of China and Vietnam (Table 6.1).
36 He went on to state that’ just-in-case’ is more accurate than just-in-time. Interview, 27 November 2009, Bangkok, Thailand. Among other positions, Mr. Quarmby is a steering committee member of the Greater Mekong sub-region Business Forum.

95
Table 6.1. Time and cost of trading across borders in African case study countries (May 2012)
Economy
Cost to import a 20-foot container (US$)
Time to import (days)
Cost to export a 20-foot container (US$)
Time to export (days)
Trading across borders – rank
Mauritius 689 13 737 13 21 Morocco 950 16 577 11 43 Jordan 1,335 15 825 13 58 Kenya 2,190 24 2,055 26 141 South Africa 1,795 32 1,531 30 144 Lesotho 1,665 35 1,680 31 147 Uganda 3,015 34 2,880 37 158 China 545 24 500 21 60 Vietnam 670 21 580 22 68
Given their proximity to their primary input suppliers and major markets, Latin American suppliers also have distinct time advantages over China and Vietnam in their ability to import and export apparel products. However, these time advantages are not sufficient to overcome the actual costs of trading across borders, particularly with infrastructural investments and organizational innovations in freight forwarding in East Asia; Latin American exporters bear a 100 percent (or in the case of Mexico a 150+ percent) cost premium over their East Asian competitors (Table 6.2). Table 6.2. Time and cost of trading across borders in Latin America/Caribbean case study countries (May 2012)
Economy
Cost to import a 20-foot container (US$)
Time to import (days)
Cost to export a 20-foot container (US$)
Time to export (days)
Trading across borders –rank
Dominican Republic 1,150 10 1,040 8 45 Mexico 1,780 12 1,450 12 59 Nicaragua 1,220 23 1,140 24 83 Honduras 1,420 22 1,242 18 103 Haiti 1,545 31 1,185 33 145 China 545 24 500 21 60 Vietnam 670 21 580 22 68
Investments in rail, road, port, and airport infrastructure, and innovations in freight handling in East Asia and Vietnam also mark off these countries from those of South and other Southeast Asian apparel exporting countries (Table 6.3). South Asian importers and exporters bear a 50 percent premium over Chinese, Hong Kong, Taiwanese, and Vietnamese importers and exporters, and the number of days to import and export are also significantly higher. The Port of Hong Kong claims to be able to unload and re-load a ship for sea within 24 hours, and with new port investments coming

96
on line in the Pearl River and Mekong River deltas, these differences will be further exacerbated (JP Interviews Hong Kong 2007, Ho Chi Minh City 2008). Table 6.3: Time and cost of trading across borders in Asian case study countries (May 2012)
Economy
Cost to import a 20-foot container (US$)
Time to import (days)
Cost to export a 20-foot container (US$)
Time to export (days)
Trading across borders – rank
Hong Kong SAR, China 565 5 575 5 2 Taiwan, China 720 12 655 12 23 Sri Lanka 745 19 715 21 53 China 545 24 500 21 60 Vietnam 670 21 580 22 68 Pakistan 705 18 660 21 75 India 1,070 20 1,095 16 109 Bangladesh 1,370 31 965 25 115 Cambodia 872 26 732 22 120
6a. New trends in logistics: diversion in transit, bypass, and trans-loading strategies With increased market uncertainty and global supply chains, buyers need, and freight forwarders try, to reduce the time product spend in shipping. As days are taken out of the supply chain, buyers are able to reduce lead-times and match orders more closely to highly volatile consumer demand. Four new trends are particularly important in allowing importers to adjust their orders and attune delivery to demand more quickly. One innovation in freight forwarder has been the rise of consolidators who gather shipments from several suppliers, consolidate them in one container, and ship them directly to the end customer. Distribution centres based in the importing country are, as a result, by-passed and product is shipped directly to the end market. The opportunity for consolidators to provide targeted shipping services allows apparel buyers trying to manage long lead-times to better match supply with volatile and often unknown demand. The increased use of on-demand packaging has allowed more targeted shipping practices, decreased damage rates, and more cost effective management of shipping cubes. Partly because of the emergence of consolidators and with the development of RFID product and batch-level tracking there is a growing use of in-transit reallocation and diversion of goods to reduce delivery time and adjust delivery to changing end market demand. RFID tagging of apparel is currently the largest and fastest growing application of RFID in retailing and related industries (IDTechEx 2011). According to IDTechEx (2011) about 100 companies are now tagging apparel in trials and rollouts, two companies have already indicated that combined they will order 500 million tags each year, and forecasts for the industry as a whole are that 20 billion RFID tags will be used annually by 2021.

97
Trans-loading to inland ports for customs clearance has also become a useful way to reduce congestion and delays in clearing customs. Here ocean-borne containers are loaded directly from the ship onto domestic trailers to be transported as sealed containers to inland ports for Customs clearance. The increasingly competitive demands of fast fashion have resulted in the increased use of air freight. Formerly used primarily to avoid penalties for delivery delay, air freight is increasingly being used in combination with ocean freight by fashion-forward apparel companies. By staging delivery on fashion items, air freight is used to meet initial demand, while replenishment stocks follow by sea at lower price points (Terry 2008). The result has been a rapid increase in the use of air freight. For example, apparel importers into Europe airfreighted 28 percent more clothing in the first ten months of 2010 than a year earlier, despite the fact that total apparel imports from outside the EU grew by only 1.4 percent (Clothesource 2011).37 These logistics trends have several direct consequences for workers. First, the demand to reduce delivery time increases pressure on workers in the logistics chain. The Port of Hong Kong now unloads and reloads full container ships in 24 hours, a speed-up that places much higher time demands and responsibilities on port workers (Pickles, Interview 2007). Second, the expansion of fast fashion in global apparel value chains also requires fast response time and tight delivery schedules from suppliers (Planck et al. 2011). The consequences for workers are an expanded set of demands on their time and skills, but often in conditions (such as Morocco) of decreasing contract pricing. Third, the dominance of Asian intermediaries and freight forwarding companies in these new practices further disadvantages suppliers and workers in other regions of the world. African exporters with lower volumes and longer delivery times are unable to benefit from consolidators, trans-loading, and air-sea freight combinations to the same extent that Asia exporters currently are.
7. Findings and recommendations Trade policies play crucial roles in promoting or inhibiting economic and social upgrading in low-income countries. This report focused on the roles played by trade policy in three ways:
• Policy drivers of current geographies of apparel production and employment, • Effects of specific policies (especially rules of origin, cumulation requirements, and tariffs)
on the fragmentation of global value chains, • Opportunities and constraints faced by buyers, suppliers, and workers in trying to achieve
economic and social upgrading under preferential market access rules, The fragmentation of apparel value chains has been fostered by defensive trade policies in major markets. One consequence has been the distribution of low-value assembly work across an increasingly wide range of countries. With the end of quotas, apparel sourcing shifted rapidly with
37 In their discussion, Clothesource focus on the environmental impact of these practices. Citing a UK Ministry of Agriculture (DEFRA) report, they point out that “a kilogramme transported 10,000 km by air emits 44 times more carbon as the same kilogramme seafreighted. With surface intercontinental transport accounting for just 7 percent of garments’ energy use, the abrupt switch to airfreight means Europe’s garment importers almost quadrupled their total carbon emissions between 2009 and 2010 – more than wiping out any beneficial effect of their widely promoted and booming sustainability programmes.” Clothesource concludes that retailers and consumers show little concern for the real costs of sourcing. From our perspective, the environmental effects of new sourcing practices have real effects on generalized conditions of people’s lives.

98
some countries gaining orders and expanding employment, while other countries saw their quota-based industry decline and jobs were lost. China, in particular, emerged as the largest exporter of clothing, with 37 percent of the global total in 2011, but export production and jobs also increased rapidly in Vietnam, Bangladesh, and Indonesia. In this process, prices and wages were driven down across the industry, setting a new norm that for many was below social reproduction costs and living wage levels. In turn, the resulting competitive pressures and race to the bottom generated their own limits. Pressure from workers, consumers and buyers for economic and social upgrading increased across the chain, and – whether to manage business risk in high-value consumer markets or to protect worker safety in second and third tier subcontracting factories – the industry has struggled to create conditionalities in trade agreements to ensure that claims by workers for higher returns to wages, larger investments in social wages, and investments in workplace safety (social upgrading) can be achieved in sustainable fashion provided they are linked to parallel increases in productivity (economic upgrading). The result is a complex landscape of economic and social upgrading and downgrading, in which the fortunes of manufacturers and workers in low-income countries have varied greatly (Figure 7.1). Producers in countries such as China, Sri Lanka, Turkey, and India are upgrading into higher-value segments of the value chain by adding new functions (such as branding and design), diversifying their markets (particularly into domestic markets), and creating either backward or horizontal linkages in the production process. As a result, these suppliers rely increasingly on skills upgrading and training, but these are achievable only by increases in direct wages, social wage payments, and/or increased rights for workers. Skills and wages are increasing, and regional labour markets are tightening. Producers in countries that have not been able to upgrade production systems or capture higher value segments of the market, such as Morocco, are adapting their production to buyer demands for fast turn and fast fashion. The results for these countries are mixed. Contracts have expanded and employment has increased (at least until the effects of the 2008 recession were felt). But workers were exposed to production line re-organization aimed at speed-up and flexibility. Their benefits were restricted to more stable jobs and higher workplace and product standards, but at low-levels of pay and under increasingly tight production deadlines. In other countries, such as Jordan, preferential market access agreements such as QIZs lock suppliers into low-wage assembly production using imported fabric and migrant workers, generating few if any backwards linkages, employment effects, or spill-over effects into the local economy. Producers in former quota-driven export platforms, such as Lesotho, Madagascar, and Kenya, continue to struggle to sustain markets and have become increasingly dependent on preferential access to major markets (such as AGOA and CAFTA DR). The uncertain status associated with the renewal of these programs has had negative effects particularly in AGOA countries. For the most part, workers in these factories face uncertain employment, low wages, and often despotic working conditions where non-payment of wages, forced overtime, and hazardous and – at times harassing work environments prevail. The prominence of China as the source of product for many lead-firms has also emerged as a weakness. Many lead firms continue to source the majority of products from China, but they also

99
seek to diversify into other countries. Korean manufacturers benefitted from early adoption of either a China +2 strategy of diversified sourcing or a ‘no China’ sourcing strategy, sourcing instead from Indonesia and Vietnam (Zhu and Pickles 2013). The Japanese government has openly stated its interest in reducing reliance on China. This could have major impacts since Japan is the world’s second largest clothing importer, and Southeast Asia and Bangladesh currently only account for 7 percent of imports. Japan’s plan could double or triple the total current exports from these countries, putting price pressure on European and US Asian importers (just-style.com 2008; 2009. The rise of strategic partnerships between buyers and suppliers is also part of a broader recalibration of sourcing logics as production costs and future Figure 7.1. Trajectories of economic and social upgrading and downgrading Trajectory x-axis y-axis Regional examples 1 Social upgrading Economic upgrading China, India, Vietnam2 Social upgrading No economic upgrading Bangladesh, Cambodia,
Indonesia 3 No social upgrading Economic upgrading Nicaragua 4 Social downgrading Economic upgrading Jordan 5 Social downgrading No economic upgrading or
downgrading El Salvador
6 Social upgrading Economic downgrading 7 No social upgrading
or downgrading Economic downgrading Sri Lanka, Haiti, Mauritius
8 Social downgrading Economic downgrading Lesotho, Kenya, South Africa, Dominican Republic, Guatemala, Mexico
Note: This diagram and table is largely diagnostic, rather than analytical. Its goal is to illustrate the diversity of upgrading and downgrading trajectories that are occurring, as well as to point to the limits of upgrading and downgrading logics and methodologies. The results are, nonetheless, indicative. uncertainties increase in China. Making use of multiple supply chains, balancing global sourcing from Asia with quick turn local production with regionally proximate production has now become the norm for major brands and retailers, offering them both a greater level of supply stability along with reserve capacity to meet unexpected demand. At the same time, the needs of retailers for volume, quality, flexibility, and timing have become more important and these have changed the power dynamics in global value chains, allowing suppliers to take on many more functions and operate with more freedom than was the case even a few years ago. Thus, as supply chains have become more footloose and flexible for some companies, for other lead firms they have become more concentrated and focused on strategic alliances and partnerships. 7a. Post-quota value chain concentration and consolidation Terry (2008) suggests that:
Apparel companies' relationships with contract manufacturers in low-cost countries have historically been transient. Contracts for product sometimes last only a few months as

100
brands continuously pursue the lowest cost. On average, one-third to three-quarters of an apparel company's contractor portfolio turns over every year (Terry 2008).
However, the problem with such arms-length and mobile sourcing practices is that order flexibility and quality may suffer, compliance problems invariably arise, and reputational risk increases.
Large brand sensitive firms are adjusting the organization of their supply chain, concentrating sourcing, working with strategic partners, and making increasing use of regional agents and larger suppliers to handle a greater range of capacities, introduce cost-saving practices, and provide inventory management and other services. Working more closely with a smaller range of strategic partners with whom buyers have good and longer lasting relationships increases flexibility for both partners; suppliers can more easily negotiate bottlenecks and unforeseen input interruptions, while buyers are able to negotiate price against other formerly intangible or hidden needs of suppliers. . The resulting strategic alliances with emerging global value chains among textile and apparel firms, buying and producing firms, input suppliers and service providers and exporting producers generally enhanced buyer and retailer competitiveness and encouraged new suppliers to enter the industry and to compete for orders. Inter-firm, intra-value chain strategic alliances encouraged country and region-specific specialization, particularly around quota-driven CMT manufacture for export. That these alliances emerged within global value chains meant that CMT suppliers were generally very weak partners in the alliance, often being dropped as contracting, product, and cost needs changed. But it also meant that value chain participants (especially CMT suppliers) gained experience from assembly production that – in some case – allowed spring-boarding into more complex tasks, production functions, and/or product mixes. Economic upgrading from input sourcing to product design, marketing, and shipping) added value in production and has allowed some firms to upgrade beyond the CMT business (Knappe 2002). The shift from factor-based costing to a consideration of a broader range of costs (including reputational costs and the costs of damaged or delayed product) is paralleled by a shift in apparel supply chains from price-based sourcing to full-costing and demand-driven accounting. Buyers in turn have been able to demand higher quality, faster turnaround times, and a wider range of services at the point of production while also driving down unit prices. Suppliers with lower unit costs, larger capacities, and broader range of services were generally able to out-compete those suppliers with higher fixed costs, weaker bargaining power over input suppliers and workers, and better service to buyers. Frederick and Gereffi (2010) have also suggested that retail consolidation is further enhancing the ability of major global retailers, brands, and manufacturers to control their supplier networks. In this shift, supply chain management becomes much more centrally focused on the costs of delivery time, delay, inventory, lead-time, the percentage of blind-buys,38 and buyers have become much more interested in changes in supply chain management that maximize their abilities to control costs, improve quality and delivery times, and enhance flexibility throughout the process. A key emerging research question is the extent to which sourcing, and with it economic and social upgrading, is being shaped by the Fast Fashion model. Most Fashion retailers have adopted the ZARA model and, as Pickles and Smith (2008) and Planck et al (2012)
38 Blind buying occurs where orders are placed without clear knowledge of the actual market conditions at the time of sale. Given the vagaries of consumer markets, to some extent all orders are blind buys, although the degree to which buying is blind can be reduced by improved knowledge of market conditions, staged and geographically lagged placement of orders, careful inventory management, and by shaping market demand itself.

101
have shown some manufacturers have restructured their production model to integrate it with a ZARA model of point of sales driven manufacture and delivery. To manage these new value chain demands lead-firms continue to expand in size, market dominance, and global reach. Major buyers such as Nike and GAP have been concentrating their supply chains around fewer, larger strategic partners who can offer more services and assist in their broader goals of managing costs and efficiency. The result has been a rapid reduction in the number of suppliers and an increase in the capacities of those remaining in the supply chain. The quid pro quo for such changes is the need for and ability to agree to much greater levels of supply chain transparency. Nike has published its supplier lists across three time periods, and so consolidation can be tracked through those reports. This may also be possible for Puma, Adidas, Levis, and Timberland. Paralleling this concentration of supply chains around strategic partners is the careful management of a diversified portfolio of vendors and regions to reduce over-dependence on strategic partners and fewer suppliers (Sauls, 2008). The recession has increased buyers’ interest in having back-up suppliers in their supply chain in case some of their supplier factories experience financial difficulties in the current crisis (Barrie and Ayling, 2009). Some have predicted that the recession would lead to more local sourcing, but the evidence to dissociate regional sourcing as a more general strategy from regional sourcing as a crisis-driven strategy is not yet available. Many major brands are currently experimenting with new ways to by-pass retailers to sell direct to consumers, opening their own retail outlets (especially in emerging markets) and using online retailing. To better manage risk and mark-down costs, large retailers’ and fashion-shops have also reduced the number of wholesalers from which they purchase and have demanded more comprehensive lines of clothing, accessories, and footwear from them (Barrie and Ayling, 2009; Euromonitor, 2009). Having managed costs primarily through sourcing costs at the point of production, retailers are now focusing much more on full-cost analyses, point-of-sale costs, and demand management, and this has resulted in an intensified concentration on vendors and supplier who offer the most reliable service.39 In this process, trading companies (intermediaries) have emerged as network coordinators and full service providers. Apparel brands are divesting themselves of more design, development, manufacturing, and logistics to these third parties coordinators. Among these third parties, Li and Fung Trading is by far the most significant. They are now buying brands and incorporating them into their network, as well as providing full package service to other brands. And they are working with their supply chain to increase supplier capacities and (ostensibly) compliance.40 The resulting landscape of constraint and opportunity results in a wide range of upgrading and downgrading patterns. The risks of downgrading are ubiquitous in global value chains as competition over price, quality, delivery, and sustainability pushes buyers and producers to innovate (either in technical, organizational, or geographical terms), innovations which in turn downgrade the relative position of other firms. 39 As with retailers in developed countries, the South African formal apparel retail sector has similarly developed a very high level of concentration within the sector. The top six retailers (Mr Price, Edcon (Jet and Edgars), Pepkor (Pep and Ackermans), Woolworths, Foschini and Truworths) account for 70 percent of the market share (Morris/Einhorn 2008). 40 The recent hiring by Li and Fung of the former head of Nile Compliance may be such an indication.

102
7b. Social upgrading in the value chain The outsourcing of production, the extension of global production networks, and the excesses of nomadic sourcing provoked strong responses by workers and consumer organizations aimed at re-regulating working conditions in factories supplying global markets. Opposition by labour groups, NGOs, and consumer and student groups to the squeezing of labour costs and the proliferation of poor working conditions in global factories, highlighted the fact that garment worker salaries were generally at or below minimum wages, in some countries despotic and sometimes armed barracks had emerged to maintain labour control, and in an increasing number of new areas of assembly work contract and informal migrant workers were being drawn into factories under appalling conditions. One consequence was that international and national struggles for workplace monitoring expanded and efforts to re-regulate conditions of decent work proliferated. China has been a particularly good example of the effects of the China Price in driving down contract prices, labour costs, and firm profitability, while also generating social dislocations in the migrant labour markets on which the industry depends. The prevalence of audit fraud strongly suggests that social upgrading is unattainable at the contract price and broader economic conditions set by buyers in China. The result has been a series of parallel and linked industry-state adjustments to relocate westward and outsource to south-east Asia low-cost contracting while increasing core capacities, contract prices, and wages and labour protections in the major coastal production areas. Another change in value chains is the turn to a full-costing model. This has direct implications for profitability and for how value is distributed and shared across the supply chain. Buyer-driven GVCs still operate through one-to-one sourcing and work with regional agents to source across hundreds of factories in their supply chain, but the emergence of strategic partners alongside these other sourcing arrangements indicates a different approach to dealing with the needs to manage demand and inventory. Such strategic partners offer flexibilities in the timing of orders, some offer warehousing and other inventory management services, and each organizes production in ways that seek to increase both productivity and compliance while maintaining standards of quality and delivery time. This shift in strategies to manage productivity and competitiveness, and the restructuring of production and supply chains, have direct and indirect implications for the conditions of work and forms of compliance and monitoring that can take place in supplying factories and across the supply chain. Companies are experimenting with shifts in their strategic partnerships from externally imposed monitoring and compliance to forms of embedded compliance where quality, timing, and cost are integrated into a firm’s business model. In such a model, the goal of compliant workplaces is that they are organized, managed, and sourced in ways that contribute to cost, quality, and timing. The turn to lean manufacture and just-in-time delivery systems is one example of this effort. These shifts in thinking about demand management may, in time, have ever more important implications for firm compliance, workplace conditions, worker organization and ‘buy-in’ and remuneration. The nature of end markets is also important in this regard. Some suppliers have increased exports to one or more of the three major markets (1) EU, (2) Japan, and (3) the United States, while experiencing declines in others. For example, Indonesia increased its market share in the United States and Japan, but experienced a decrease to the EU-15. Conversely, Sri Lanka has increased market share to the EU-15 and lost in the United States. Lesotho has experienced a small increase

103
in market share to the EU-15 (since 2005), a decreasing market share to the United States (since 2004), and an increased share of its exports to South Africa. End markets are important for the ways in which they influence possibilities for upgrading. Patterns of ownership and degree of local embeddedness are also important determinants of social upgrading. Gibbon (2003, 2008) has pointed to the importance of end market segmentation for Mauritius and South Africa, arguing that apparel firms export either to the EU or the US depending on the end market and buyer requirements. Asian-owned firms in South Africa and Mauritius tended to export to the US market, whereas locally or European-owned firms tended to export to EU markets. End market segmentation is even more pronounced in Lesotho, Swaziland and Kenya, where Asian-owned firms export almost exclusively to US markets. South African-owned firms producing in Lesotho and Swaziland export more to South Africa, with exports increasing since 2005/06 (Morris and Staritz 2011). In Madagascar Asian firms export to the US while European and Mauritian owned firms export mainly to the EU and recently also the South African market. EU and US end markets differ in their sourcing practices and buyers have different expectations of suppliers’ functions and capabilities. EU buyers are more interested in flexibility and versatility and expect suppliers to contribute to design and product development (Gibbon 2008). US buyers emphasize the ability to produce to buyers’ specifications, often nominating specific fabrics and other input suppliers, mostly from Asia, and typically exhibiting little interest in supplier contributions to design. On the other hand, supplier firms find that the expanded demands and responsibilities that come with production for the EU market also create additional overhead costs that reduce a firm’s ability to compete for US orders (Gibbon 2003, 2008). Even the size of orders is different in crucial ways. US buyers demand high volumes, particularly in basic segments of the market. European markets are more segmented and each country has its own retailers and chains. As a result, with few large cross-border retailers, orders tend to be smaller and require greater levels of specialization and longer-set-up times. Orders from South African retailers are even smaller than average European orders although there are important differences between retailers such as Mr. Price servicing the lower to middle mass market segment and retailers such as Truworths aimed at the upper fashion market segments. But here, there are also important input cost differences, with South African buyers allowing suppliers to source more of their fabric from Asian sources, thereby lowering their costs. Fulfilling these smaller orders and sourcing inputs from different suppliers is challenging, particularly for small transnational producer plants that are geared towards long run basic production for the US market. Staritz and Morris (2012) argue that the GVC literature on the apparel industry has focused more on how buyers and their governance structures impact on economic and social upgrading prospects of supplier firms and countries, but much less on the role of the ownership characteristics of suppliers and how they relate to economic upgrading. They suggest that this inattention may result from the privileged attention given to lead firms in buyer-driven value chains, where the focus is more generally on non-production related activities such as design, branding and retailing while manufacturing processes are outsourced to suppliers. The importance of the role of ownership in GVC analysis is clear in recent case studies analysing these dynamics in Lesotho and Swaziland (Morris and Staritz 2011;. In their case studies, Morris and Staritz assess the role “ownership” plays in shaping the ways in which supplier firms are linked to global production and distribution networks. Different kinds of ownership affect the levels of a firm’s local embeddedness which in turn affects its ability to make decisions locally, and hence to add value and take advantages of potential linkages. Most firms in Lesotho and Madagascar are foreign

104
owned, and these differ with regard to their origin (high-income versus middle-income country), location (regional versus global) and their degree of integration/internalization versus specialization/externalization. Each has direct implications for the firm’s ability to upgrade in any specific location (Staritz and Morris 2012). The extent of internalized versus externalized production varies depending on which activities firms consider to be part of their core competencies, and on the constraints of trade agreement set by their end markets. 7c. Policy led outsourcing, off-shoring, and the ‘race to the bottom’ Trade agreements structure the mode of entry, distribution, and organization of the elements of the global value chain. They set the conditions for entry by country and hence shape the geographical distribution of various types of work and opportunity. The resulting distribution of value chain operations favours value capture in the major markets and the allocation of low-value activities to low income and low wage countries. Under some preferential access agreements such as AGOA and NAFTA, the development of local textile manufacture is encouraged. But, without strong state intervention to underwrite infrastructural investments and the development of national cotton, yarn, and fabric manufacture, and without workforce and educational investments to underwrite both the knowledge workers needed for design, branding, and marketing and the consumers to drive demand, low-income countries have few developmental paths open to them. In these cases, economic upgrading is restricted to some limited forms of functional, process, or product upgrading, and social upgrading is constrained to struggles over wages, working conditions, and worker rights. In this context, apparel sourcing is as much about managing free trade agreements, tariffs, and customs regulations, as it is about managing production and shipping. Trade policies governing apparel imports (MFA/ATC, 807b, OPT, NAFTA, etc.) were designed to encourage the outsourcing of apparel and to protect US and European textiles markets for sewn garments. Because the customs agreements charged duty only on the cost of the labour in assembly, these programs further encouraged a two decade and longer search for low-cost labour and simple stitch-up contracting, in the process transforming formerly full-package producers into suppliers of labour for stitch-up, cut-and-make, and cut-make-and-trim, and transforming US and EU manufacturers into suppliers of inputs, and design and marketing trading companies. The result was a structure of global apparel production, employment, and trade based on ‘nomadic sourcing’ and the allocation of low-value segments of the value chain to low-income countries. The ‘race to the bottom’ was, in effect, produced by the disaggregation of the value chain, the specific policy framework that guided imports into major markets, and the competitive pressures to lower costs and squeeze FOB prices. The creation of the global value chain was a highly structured geo-economic process of allocating segments of the production process to minimize overall costs. Many leading brands and retailers were caught up in this global shift, and some received intense media coverage as the extreme forms of this process. In practice, small and large companies were drawn into the process. The ‘race to the bottom’ became, therefore, both a search for the lowest wage costs and a global driving down of work standards. One consequence was that nomadic sourcing undercut manufacturers in the North and placed real limits on the possibilities for upgrading in the newly industrializing countries. With the phased removal of quantitative quotas on imports into major markets, apparel sourcing after 2004 focused even more intensely on controlling and reducing factor costs of production, with specific attention paid to either squeezing labour costs or increasing the productivity of workers. Expanded global sourcing has driven down the costs of sourcing to such an extent that the

105
marginal gains from squeezing labour costs have been reduced significantly in recent years. When wage levels were driven below subsistence costs, and could not be driven any further down, buyers and suppliers sought out savings in other areas of the value chain (input costs, transaction costs, logistics, coordination costs, demand management, etc.). As a result, supply chain managers have focused increasingly on the relative costs of inputs in the FOB price of products. Accounting for as much as 60-80 percent of factor costs, input management emerged as an important focus of attention in restructuring the relations between stitch-up and input suppliers, a fact not lost on textile manufacturers in the US and EU. Rules of origin, double and triple transformation rules, and 1+1 requirements were all developed to protect markets for these yarn and fabric firms. With the gradual opening of input supply options, some countries, such as Turkey, Romania, Egypt, Bangladesh, Vietnam, and China, further integrated their textile and apparel industries. All (except Romania) did so because of different forms of state industrial supports or policies. Romania also benefitted from earlier state socialist investments in a fully integrated textile and apparel sector and, more recently, from Italian outsourcing investments under-written by a large-scale investment by Italian banks (Sellar 2007). In these countries integrated factories with yarn fabric, dyeing, and assembly operations have certain comparative advantages over disaggregated and horizontally networked production networks. The focus on input supplies and costs has consequences for both the upgrading of input suppliers and the conditions of work in textile and yarn factories, and for the opportunities for regional economic upgrading in apparel. In a post-quota world tariffs also play a central role in global apparel trade. Average Most Favoured Nation (MFN) tariffs on apparel imports are around 11 percent for the EU and the US. However, these tariffs vary considerably for different product categories. In the US, tariffs on apparel products vary between 0 and 32 percent, with duties on cotton products ranging on average between 13 percent and 17 percent and duties on synthetic products ranging on average between 25 and 32 percent. In the EU, tariffs on apparel products vary between 0 and 12 percent; there are no systematic differences between cotton-based and synthetic products. In South Africa, the apparel (and textile) sector was protected by high tariffs until 1995. Since 1995 the sector has been liberalized reducing tariffs on yarns to 15 percent, on fabrics to 22 percent and on apparel to 40 percent in 2002 but then increased to 45 percent in 2010. That is, preferential market access has a substantial impact on global apparel trade patterns. Major preferential market access schemes can be divided into two types of agreements. These are regional and bilateral trade agreements, and the Generalized System of Preferences (GSP) (Staritz 2011; Frederick and Staritz 2012). Twenty-seven developed countries provide tariff preferences to over 100 beneficiary countries through the GSP. However, tariffs for apparel products are only marginally reduced in the standard EU and US GSP. Within the GSP, some countries have negotiated preferential access for lower-income countries, such as with the Everything but Arms (EBA) and the GSP+ initiatives and the Lomé Convention and its successors, the Cotonou Agreement and the Economic Partnership Agreements (EPAs) by the EU and the Africa Growth and Opportunity Act (AGOA) by the US. Canada and Japan have also improved preferential market access for least developed countries (LDCs) in their GSP in the early 2000s. Preferential market access in these agreements is governed by more or less restrictive rules of origin (ROO), which have a crucial impact on outcomes. With ever more fragmented supply chains, oversight requirements, standards, and regulations on apparel imports have increased. More recently security and tracking concerns have also become

106
important. Together these add substantially to the costs, uncertainty of delivery, and levels of risk in the supply chain. Trade regulations have, at times, compounded these problems, particularly when policies have been changed suddenly or renewal issues have not been resolved or dealt with at the last minute. Particularly because they are fundamentally political instruments, shifts in trade policy or customs requirements can be swift and without warning. The clearest example of the significance of rapid policy shifts was perhaps the imposition of US and EU safeguards on imports from China after the full integration of quotas in 2004; the so-called ‘bra wars’. Following the removal of quotas on 31 December 2004, exports of many apparel products from China to the US and EU increased rapidly (in some case by 100 percent or more). This led the US and EU to use China's WTO accession agreement which allowed importing countries to restrict import growth to 7.5 percent per year for up to three years after 2004. Negotiations resulted in an agreement between China and the EU to limit the rate to 10 percent for three years, while the US unilaterally imposed import safeguards limiting growth to 7.5 percent. The situation was compounded by the fact that upon announcement of the EU safeguards, Chinese manufacturers and their EU buyers accelerated the shipping of the goods using up a full year's quota almost immediately. The result in August 2005 was both terrifying and comical; 75 million items held in European ports. But, as Yearman and Gluckman (2005) argued at the time, “millions of garment workers worldwide stand to lose their jobs with this year’s changes in global textile trade rules.”
Similarly, in 2008, pressure from U.S. based sock manufacturers, led U.S. Customs and Border Protection to announce that it planned to impose a six-month 5 percent tariff on cotton socks from Honduras. On January 24th 2008, U.S. Customs also announced a plan to eliminate the “first sale valuation” rule used by importers to reduce their duty costs.41 Prior to the new rule, instead of paying duty on the customs value of an imported product measured by the price the importer paid to the vendor, the ‘first sale rule’ allowed importers to declare the customs value based on the lower price the vendor paid to the manufacturer.42 Such changes in trade policy and customs regulations can create significant disruptions in production chains with consequences for buyers and suppliers shipping and delivery schedules with real effects on their compliance obligations which in turn may have real effects on workers. 7d. The changing role of the state in public governance Institutions of private governance have expanded their reach over the past decade. In particular, codes of conduct and certification arose at a particular moment at which market power was heavily concentrated among branded buyers sensitive to the concerns of consumers and NGOs largely located in developed countries. As the market power shifts to firms and consumers in developing countries, this form of private governance needs to be extended and adapted. However, while the financial and reputations costs of auditing and monitoring have become of great concern to value chain managers and compliance officers, the effectiveness of audits in dealing with non-compliance have been questioned. Lead firms are increasingly arguing that they cannot manage global value chains without support from state governments to ensure basic regulatory protections (labour rights, health and safety,
41 US Customs and Border Protection. 2008. Proposed Interpretation of the Expression ‘‘Sold for Exportation to the United States’’ for Purposes of Applying the Transaction Value Method of Valuation in a Series of Sales (73 Federal Register page 4254, January 24, 2008). 42 The use of the first sale rule is described in: U.S. International Trade Commission (2009). US Customs and Border Protection ended its effort to change the “first sale rule” in September 2010 (Edmonson 2010).
107
minimum wage legislation, etc.). In turn, governments are also concluding that their desire for economic upgrading need not come at the expense of abandoning their regulatory and social protection functions. While many governments over the past twenty years were convinced of the necessity of deregulating state institutions to enable the free-flow of foreign direct investment, some lead-firms, NGOs, and states are increasingly recognizing that workplace standards and enforcement mechanisms may be essential elements of productivity and value chain upgrading. In this regard, the strengthening of state governance capacities in the emerging market economies of China, India and Brazil is highly suggestive. In this view, developing more sustainable global value chains in apparel will require hybrid and complementary institutions of governance, public and private, operating on multiple levels – global, national and local. How far these trends are likely to go, however, will depend in part on the extent to which governments are, in the end, responsive to domestic social pressures, and in part on their leverage vis-a-vis global market actors. Clearly, what might be possible for China because of its size might not be possible for Guatemala, for example, and so it will be necessary to develop scale-dependent metrics of effective governance institutions and practices. Drawing on case studies from Costa Rica and El Salvador, Feinberg et al (2012) argue that responsible labour practices generate potentially significant benefits for employees and firms, and that in turn these have important impacts on national competitiveness. While the benefits of such labour practices are not always easily or widely accepted by lead-firms or suppliers, there is – they suggest -- a clear case to be made that it is in the public interest to have government articulate official incentives to promote the adoption of responsible labour practices.43 Implementation of such a wide ranging approach to governmental policy is, however, extremely difficult especially in conditions in which state apparatuses are weak and may be internally competitive or conflictual with each other. However, by carefully focusing on a limited set of potent and politically acceptable incentives, Feinberg and his colleagues found that it was possible to build support for institutional reform:
As the vision of a more socially responsible economy captures the national imagination, and as the linkages between responsible labour practices, international competitiveness, and better living standards gain wider recognition, the foundations will have been laid for the proposed administrative reforms and institutional innovations − and for a renewed national awareness and culture of compliance (pp. 26-27).
Success also depends on the participation of international brands, who are also potential beneficiaries of the new programmes and whose subsequent sourcing decisions will punish or reward countries that adopt these principles. If such public goods are implemented,
companies will recognize governments as key stakeholders of their operational structures and become more aware of the public sector’s efforts to promote RLP. Those companies that take proactive steps to become involved in public policy will have a new opportunity to
43 Feinberg et al. (2012) argue for what they refer to as a “whole-of-government (WOG) framework to develop a more nuanced understanding of the actual constituencies and effective areas of action that specific ministries and instruments of government fulfill. In what they call a burewaucratic politics approach, each public-sector entity has its own particular constituency: finance ministries work closely with bankers and investors, ministries of agriculture work closely with farmers, etc. By engaging a whole-of-government framework, executive branches can impact upon a wide array of constituencies and stakeholders across the industry.

108
become leaders in the countries where they operate, while ensuring that the virtuous cycle takes hold for their businesses and the communities in their spheres of influence (p.27).
In doing this, however, it remains important to recognize that current trade policies place limits on economic and social upgrading for lower-value segments of the global (highly fragmented) value chain. While they enable market access for low-income country producers, they do so at the cost of forms of ‘constrained development’ in which the question of upgrading is to be addressed in the lowest value segments of the industry. Governments in low-income countries like China, Vietnam, Sri Lanka, and Bangladesh recognize the need to integrate their textile and production systems if regional economic and social upgrading is to be possible. Other countries (such as Nicaragua) are trying to foster industrial integration with textile mills in neighbouring countries, or pushing against local content rules to allow for market-based decisions on input sourcing. In other cases, buyers concerned about reputational risk are experimenting with new strategic partnerships and inter-firm alliances through which the rents that accrue to the high-value segments of the value chain are being shared (in small degree) with suppliers in return for changes in production and working conditions that result in economic and social upgrading, while reducing risk.

109
References Abernathy, F. H., Volpe, A. and Weil, D. (2006). ‘The Future of the Apparel and Textile Industries: Prospects and Choices for Public and Private Actors’. Environment and Planning A 38(12): 2207–2232. Ahmad, M. (2007). Impact of Origin Rules for Textiles and Clothing on Developing Countries. ICTSD Programme on Competitiveness and Sustainable Development Paper No. 3, December (ICTSD: Geneva). Adhikari, R. and Yumiko Yamamoto. (2008). ‘The textile and clothing industry: Adjusting to the post-quota world’, in Unveiling Protectionism: Regional Responses to Remaining Barriers in the Textiles and Clothing Trade,(pp. 3-48). United Nations Economic and Social Commission for Asia and the Pacific (ESCAP). http://www.un.org/esa/sustdev/publications/industrial_development/2_2.pdf Aguayo-Tellez, Jim Airola, E. and Juhn, C. (2010). ‘Did Trade Liberalization Help Women? The Case of Mexico in the 1990s’. Working Paper 16195, National Bureau of Economic Research, Cambridge, MA. Bair, J. (2005) ‘Global capitalism and commodity chains: looking back, going forward’, Competition and Change, 9(2): 153-180. Bair, J. (2009) ‘Global commodity chains: genealogy and review’, in Bair, J. (ed) Frontiers of Commodity Chain Research, Stanford, CA: Stanford University Press, pp. 1-34. Bair, J. and Gereffi, G. (2003). ‘Upgrading, Uneven Development, and Jobs in the North American Apparel Industry’. Global Networks 3 (2): 143–69. Barrie, L., and Ayling, J. (2009). Apparel Industry Outlook for 2009. January/February Management Briefing. Bromsgrove, UK: Aroq Limited. Barrientos, S. Mayer, F. Pickles, J. and Posthuma, A. (2011). ‘Labour standards in global production networks: framing the policy debate.’ International Labour Review, 150(3-4),_ December: 299-318. Begg, R., Pickles, J. and Smith, A. (2003). ‘Cutting it: European integration, trade regimes and the reconfiguration of East-Central European apparel production’, Environment and Planning A, 35: 2191-2207. Birnbaum, D. (2012a). ‘Comment: TPP trade talks need a Plan B for garments’. just-style.com 3 May 2012. Birnbaum, D. (2012b). ‘Comment: It's not about the cost of labour’. Just-style.com, 4 July 2012 http://www.just-style.com/comment/its-not-about-the-cost-of-labour_id114743.aspx Birnbaum, D. (2012c.) ‘Comment: Caught in the cost of labour trap’. Just-style.com, 20 July 2012 http://www.just-style.com/comment/caught-in-the-cost-of-labour-trap_id115000.aspx
110
Cattaneo, O, Gereffi, G. and Staritz, C. (2010). Global Value Chains in a Post-Crisis World: A Development Perspective. Washington, DC: World Bank. Clothesource. (2011). ‘EU apparel industry airfreight mirrors consumer apathy’. 12 January, http://clothesource.blogspot.com/2011/01/eu-apparel-industry-quadruples-carbon.html de Hoyos, R., Bussolo, M. and Núñez, O. (2008). ‘Can Maquila booms reduce poverty? Evidence from Honduras’. Policy Research Working Paper 4789, World Bank, Washington, DC. Dickerson, K. G. (1999). Textiles and Apparel in the Global Economy. Upper Saddle River, NJ: Merrill. Edmonson, R. G. (2010). ‘Customs ends effort to change firsts sale rule’, The Journal of Commerce, 29 September 29. Online: http://www.joc.com/government-regulation/customs-ends-effort-change-first-sale-rule Ernst, C,, Hernández Ferrer, A. and Zult, D. (2005). The End of the Multi-fibre Arrangement and its Implication for Trade and Employment. International Labour Organization, Geneva. Feinberg, R. E., Koosed, T. B., Leon, C. and Nelidov, T. (2012). 'Creating an enabling environment for responsible labour practices: experiences in Costa Rica and El Salvador'. Unpublished manuscript. Flanagan, M. (2012). ‘The Flanarant: apparel sourcing forecasts miss the point’. Just-style.com 20 July. http://www.just-style.com/comment/apparel-sourcing-forecasts-miss-the-point_id114975.aspx?lk=dm&utm_source=daily-html&utm_medium=email&utm_campaign=20-07-2012&utm_term=id74852 Frederick, S. (2010). ‘Development and application of a value chain research approach to understand and evaluate internal and external factors and relationships affecting economic competitiveness in the textile value chain’. Doctoral dissertation, North Carolina State University, Raleigh, NC. Frederick, S., and Gereffi, G. (2011). ‘Upgrading and restructuring in the global apparel value chain: why China and Asia are outperforming Mexico and Central America’. International Journal of Technological Learning, Innovation, and Development 4(1–2): 67–95. GAO. (2010). Exporters’ Use of the Earned Import Allowance Program for Haiti Is Negligible because They Favor Other Trade Provisions. Report to Congressional Committees, GAO-10-654. Washington DC: Government Accountability Office. Available online: http://www.gao.gov/assets/310/305467.pdf Gereffi, G. (1994). ‘The organization of buyer driven global commodity chains: how US retailers shape overseas production networks’.” In Gereffi, G. and Korzeniewicz, M. (eds.), Commodity Chains and Global Capitalism, (pp. 95-122). Westport, CT: Praeger. Gereffi, G. (1999). ‘International trade and industrial upgrading in the apparel commodity chain’. Journal of International Economics 48 (1): 37–70.

111
Gereffi, G, and Frederick. S. (2010). ‘The Global Apparel Value Chain, Trade and the Crisis – Challenges and Opportunities for Developing Countries’.” In Cattaneo, O., Gereffi, G. and Startitz, C. (eds.), Global Value Chains in a Postcrisis World: A Development Perspective (pp. 157-208). Washington, DC: World Bank. Gereffi, G,, Humphrey, J., Kaplinsky, R. and Sturgeon, T.J. (2001). ‘Introduction: globalisation, value chains and development.” IDS Bulletin 32(3): 1–8. Gereffi, G, Humphrey, J. and Sturgeon, T.J. (2005). ‘The governance of global value chains’.” Review of International Political Economy 12(1): 78–104. Gereffi, G. and Mayer, F. W. (2006). 'Globalization and the demand for governance', in G.Gereffi, The New Offshoring of Jobs and Global Development (pp. 39-58). ILO Social Policy Lectures. Geneva: International Institute for Labour Studies, Gereffi, G. and Memedovic, O. (2003). ‘The Global Apparel Value Chain: What Prospects for Upgrading by Developing Countries?’ United Nations Industrial Development Organization, Sectoral Studies Series, Vienna. Gibbon, P. (2003). ‘AGOA, Lesotho ‘Clothing Miracle’ & the Politics of Sweatshops’, in: Review of African Political Economy 30: 96. Gibbon, P.(2008). ‘Governance, entry barriers, upgrading: a re-interpretation of some GVC concepts from the experience of African clothing exports’. Competition and Change 12(1): 29-48. Global Development Solutions. (2011). ‘The value chain and feasibility analysis; domestic resource cost analysis’.” Background paper (Light Manufacturing in Africa Study). Available online as Volume II at http://worldbank.org/africamanufacturing. Washington, DC: World Bank. Humphrey, J. and Schmitz, H. (2002). ‘How does insertion in global value chains affect upgrading in industrial clusters?’ Regional Studies 36 (9): 1017–27. Hur, J. (2012), ‘Do free trade agreements increase economic growth of the member countries?’ World Development. Accepted 8 November 2011. Available online 23 January 2012. http://dx.doi.org/10.1016/j.worlddev.2011.12.006 IDTechEx. (2011). Apparel RFID 2011-2021. Research Report 119923. Jassin-O’Rourke Group, L. (2008). Global Apparel Manufacturing Labor Cost Analysis 2008, Textile and Apparel Manufacturers & Merchants. http://www.tammonline. com/researchpapers.htm. just-style.com. (2008). ‘Talking strategy’. Just-Style.com. just-style.com. (2009). ‘Japan mulls’. Just-Style.com. Kaplinsky, R, and Morris, M. (2006). Dangling by a Thread: How Sharp Are the Chinese Scissors? Report prepared for the Department for International Development Trade Division, Institute of Development Studies, Brighton, UK.

112
Korniek, J. (2005). ‘Trade and gender: issues and interactions’. OECD Trade Policy Working Paper No.24. Paris: OECD. Knappe, M. (2002). 'Inter-firm strategic alliances in the textiles and clothing industry examples from Bangladesh and Sri Lanka'. Presented to the Executive Forum on National Export Strategies: Managing Competitive Advantage: the Values of National Strategy. Leslie, D. and Reimer, S. (1999) ‘Spatializing commodity chains’, Progress in Human Geography, 23(3): 410–20. Lopez-Acevodo, G. and Robertson, R. (eds.) (2012). Sewing Success? Employment, Wages, and Poverty following the End of the Multifibre Arrangement. Washington, DC: World Bank. Milberg, W. and Winkler, D. (2010). ‘Trade, crisis, and recovery: restructuring global value chains’.” In Cattaneo, O., Gereffi, G. and Staritz, C. (eds.), Global Value Chains in a Postcrisis World: A Development Perspective (pp.23–72). Washington, DC: World Bank. Miller, D. ‘Towards sustainable labour costing in the global apparel industry: some evidence from UK fashion retail’. Mimeo. Available at: http://www.northumbria.ac.uk/static/5007/despdf/designres/dougproject.pdf Miller, D. (2012a) ‘Comment: Why it is all about the cost of labour!’ Just-style.com, 17 July 2012 http://www.just-style.com/comment/why-it-is-all-about-the-cost-of-labour_id114956.aspx Miller, D. (2012b) ‘Comment: Apparel costing for a living wage’ Just-style.com 23 July 2012 http://www.just-style.com/comment/apparel-costing-for-a-living-wage_id115005.aspx Morris, M. (2006). ‘Globalisation, China, and clothing industrialisation strategies in Sub-Saharan Africa’. In Jauch, H. and Traub-Merz, R. (eds.), The Future of the Textile and Clothing Industry in Sub-Saharan Africa (pp. 36–53). Bonn: Friedrich-Ebert-Stiftung. Pickles, J. (2012). Economic and social upgrading in apparel global value chains: – public governance and trade policy. Capturing the Gains Working Paper. Pickles, J. and Smith, A. (2011) ‘Delocalization and persistence in the European clothing industry: the reconfiguration of trade and production networks’, Regional Studies, 45(2): 167-185. Piore M. and A. Shrank (2006). ‘Trading up: an embryonic model for easing the costs of free markets.’ Boston Review, September/October.
Portugal-Perez, A. (2008). The Cost of Rules of Origin in Apparel: African Preferential Exports to the United States and the European Union. United Nations Conference on Trade and Development. Policy Issues in International Trade and Commodities Study Series No.39. Qian, N. (2008). ‘Missing women and the price of tea in China: the effect of sex-specific earnings on sex imbalance’.” Quarterly Journal of Economics 123(3): 1251–85.

113
Robertson, R., Brown, D., Pierre, G., and Sanchez-Puerta, L. (eds.) 2009. Globalization, Wages, and the Quality of Jobs: Five Country Studies. Washington, DC: World Bank. Sauls, J. (2008). Excellence in sourcing: an Apparel research study and analysis (Supplement to Apparel Magazine August) Apparel Magazine & Kurt Salmon Associates. Talking strategy: expert views on US apparel sourcing. Global Apparel Markets 1:5-9. Sellar, C. (2007). The Relationship between the Processes of Outsourcing of Italian Textile and Clothing Firms and the Emergence of Industrial Districts in Eastern Europe. PhD Dissertation, Department of Geography, University of North Carolina, Chapel Hill. Smith, A., Begg, R., Bucek, M. and Pickles, J. (2003). ‘Global trade, European integration and the restructuring of Slovak apparel exports.’ Ekonomicky casopis (Slovak Journal of Economics). 51(6): 731-748. Smith, A., Pickles, J., Buček, M., Begg, B. and Roukova, P. (2008) ‘Reconfiguring “post-socialist” regions: trans-border networks and regional competition in the Slovak and Ukrainian clothing industry’, Global Networks, 8(3): 281-307. Staritz, C. (2011). Making the Cut? Low-Income Countries and the Global Clothing Value Chain in a Post-Quota and Post-Crisis World. Study, World Bank, Washington, DC. Staritz, C, Gereffi, G. and Cattaneo, O. (2011). Shifting End Markets and Upgrading Prospects in Global Value Chains. Special Issue, International Journal of Technological Learning, Innovation and Development 4(1–3). Sturgeon, T. (2009) ‘From commodity chains to value chains: interdisciplinary theory building in an age of globalization’, in Bair, J. (ed.) Frontiers of Commodity Chain Research, (pp. 110-135). Stanford, CA: Stanford University Press. Teravaninthorn, S., and Raballand, G. (2008). Transport Prices and Costs in Africa: A Review of the Main International Corridors. Washington, DC: World Bank. Terry, S. (2008). ‘Snapshot: Sewing Up the Apparel Supply Chain’. Inbound Logistics. July http://www.inboundlogistics.com/cms/article/snapshot-sewing-up-the-apparel-supply-chain/ Tewari, M. and Nathan, D. (2012). ‘Understanding the sustainability of the Indian garment and textile value chain: competitiveness, compliance and a transition to the “High Road”’. Paper prepared for GIZ’s Center or Responsible Business, India. Tokatli, N. (2007a) ‘Asymmetrical power relations and upgrading among suppliers of global clothing brands: Hugo Boss in Turkey’, Journal of Economic Geography 7(1): 67-92. Tokatli, N. (2007b) ‘Networks, firms and upgrading within the blue-jeans industry: evidence from Turkey’, Global Networks 7(1): 51-68. UBS Investment Research (2004). ‘What’s all this labor shortage talk?’ Asian Weekly Focus, 13 September. United Nations Inter-Agency Network on Women and Gender Equality (IANWGE) (2011). ‘Gender equality and trade policy’. Resource Paper. http://unctad.org/en/docs/ditc_gender_2011d02.pdf

114
US International Trade Commission (2009). Use of the ‘First Sale Rule’ for Customs Valuation of U.S. Imports. Investigation No. 332-505, USITC Publication 4121, December 2009: http://www.usitc.gov/publications/332/pub4121.pdf World Bank (2010). The DR-CAFTA and the Extensive Margin: a Firm-level Analysis. Washington DC: World Bank. World Bank. (2005). Trade Logistics, Chapter 5. http://siteresources.worldbank.org/DEC/Resources/05--Chapter5--85-92.pdf Wright, M. (2006). Disposable Women and Other Myths of Global Capitalism. New York and London: Routledge.. Yamagata, T. (2006). ‘The garment industry in Cambodia: its role in poverty reduction through export-oriented development’. Discussion Paper 62, Institute of Developing Economies, JETRO, Chiba. Yearman, K. and Gluckman, A. (2005). ‘Falling off a cliff’, in Dollars and Sense, 1 January. http://www.dollarsandsense.org/archives/2005/0905yearman.html

115
Appendices Background papers and research reports by CtG researchers Ahmed, N. (2012). The effects on working conditions and productivity of the Bangladesh minimum wage legislation. Report of about 50 pages, due March 2012. Al-Azmeh, S. (2011). Working Conditions in Egypt’s and Jordan’s Garments Industry: A Scoping Report for Capturing the Gains Project, June 2011. Arnold, D. (2012). Wage and Workers’ Voice: Labour and Global Production in Cambodia. Research Report April 2012. Arnold, D. 2011a. Rising Costs, Living Wage and Global Garments in Cambodia. CtG Bali Conference paper July 26029, 2011. Arnold, D. (2011b). Wage and Workers’ Voice: Labour and Global Production in Cambodia. Paper presented to the ILO-International Finance Corporation Conference on Better Work 26-28 October 2011, International Finance Corporation, Washington DC. Bair, J. (2012). Economic and Social Upgrading in Nicaraguan and Honduran Textile and Apparel Production Networks Part 2. One or two journal manuscripts plus a summary research report. March 2012. Bair, J. and Gereffi, G. (2011). Towards Better Work in Central America: Assessing the Climate for Success in Nicaragua. Paper presented to the ILO-International Finance Corporation Conference on Better Work 26-28 October 2011, International Finance Corporation, Washington DC. Barrientos, S., Gereffi G., and Rossi, A. (2008). “What Are the Challenges and Opportunities for Economic and Social Upgrading?” Concept note for research workshop, “Capturing the Gains,” University of Manchester, U.K. Bernhardt, T. (2012). ‘Economic and social upgrading of developing countries in the global apparel sector: Insights from using a parsimonious measurement approach’, iIn Arianna Rossi, Amy Luinstra, and John Pickles (editors) Toward Better Work: Understanding Labour in Apparel Global Value Chains. London and Generva: Palgrave/Macmillan and the ILO. In preparation. Bernhardt, T. and Milberg, W. (2012).’International trade and the relation between economic and social upgrading’, Capturing the Gains Summit Briefing, Bhaskaran, R., Nathan, D. Phillips, N. Upendranadh, C. (2010). Home-Based Child Labour in Delhi's Garment Sector: Contemporary Forms of Unfree Labour in Global Production. Indian Journal of Labor Economics. 53(4), 2010, pp. 607-624. Fernandez-Stark, K., Frederick, S. and Gereffi, G. (2011). The Apparel Global Value Chain: Economic Upgrading and Workforce Development. Center on Globalization, Governance, and Competitiveness, Duke University, November. Frederick, S. and Staritz, C (2012) ‘Developments in the Global Apparel Industry after the MFA Phaseout’, in Lopez-Acevodo, G. and Robertson, R. (eds.). Sewing Success? Employment, Wages, and Poverty following the End of the Multifibre Arrangement. Washington DC: World Bank, pp. 41 Frederick. S. and Staritz, C. (2011a). “Background Global Value Chain Country Papers: Bangladesh.” Background paper to Sewing Success? Employment, Wages, and Poverty following the End of the Multi-fibre Arrangement, World Bank, Washington, DC.

116
———. (2011b). “Background Global Value Chain Country Papers: India.” Background paper to Sewing Success? Employment, Wages, and Poverty following the End of the Multi-fibre Arrangement, World Bank, Washington, DC. ———. (2011c). “Background Global Value Chain Country Papers: Vietnam.” Background paper to Sewing Success? Employment, Wages, and Poverty following the End of the Multi-fibre Arrangement, World Bank, Washington, DC. ———. (2011d). “Background Global Value Chain Country Papers: Pakistan.” Background paper to Sewing Success? Employment, Wages, and Poverty following the End of the Multi-fibre Arrangement, World Bank, Washington, DC. ———. (2011e). “Background Global Value Chain Country Papers: Cambodia.” Background paper to the book Sewing Success? Employment, Wages, and Poverty following the End of the Multi-fibre Arrangement, World Bank, Washington, DC. ———. (2011f). “Background Global Value Chain Country Papers: Sri Lanka.” Background paper to the book Sewing Success? Employment, Wages, and Poverty following the End of the Multi-fibre Arrangement, World Bank, Washington, DC. ———. (2011g). “Background Global Value Chain Country Papers: Honduras.” Background paper to the book Sewing Success? Employment, Wages, and Poverty following the End of the Multi-fibre Arrangement, World Bank, Washington, DC. ———. (2011h.) “Background Global Value Chain Country Papers: Mexico.” Background paper to the book Sewing Success? Employment, Wages, and Poverty following the End of the Multi-fibre Arrangement, World Bank, Washington, DC. ———.(2011i). “Background Global Value Chain Country Papers: Morocco.” Background paper to the book Sewing Success? Employment, Wages, and Poverty following the End of the Multi-fibre Arrangement, World Bank, Washington, DC. Gereffi, G. and Frederick. S. (2010). “The Global Apparel Value Chain, Trade, and the Crisis: Challenges and Opportunities for Developing Countries”. Policy Research Working Paper 5281, World Bank, Washington, DC. https://openknowledge.worldbank.org/bitstream/handle/10986/3769/WPS5281.txt?sequence=2 Gereffi G. and Bair, J. ( 2010). Improving Competitiveness in the Textile-Apparel Industry in Nicaragua and the United States. Draft version of the study commission by USAID/CARANA and the National Free Zones Commission (CNZF/Government of Nicaragua). Presented at a workshop organized by USAID.CARANA and CNZF at the Crowne Plaza, Managua, Nicaragua, 24 November 24. Gereffi, G. and Christian, M. (2009). ‘The Impacts of Wal-Mart: The Rise and Consequences of the World’s Dominant Retailer’. Annual Review of Sociology. 2009. 35:573–91 Gregoratti, C. and Miller, D. (2010). ‘International Framework Agreements for Workers’Rights? Insights from River Rich Cambodia’. Global Labour Journal 2(2: 84-105. Godfrey, S. and Pike, K. (2012). Research reports on apparel GPNs and RPNs in South Africa and Lesotho as well as Kenya and Mauritius. April 2012. Goger, A. (2012). Ethical Labeling in Sri Lanka: A Case Study of Garments Without Guilt. April. Goger, A.. (2011). ‘Going more local with global governance: lessons from ethical branding in Sri Lanka’. Paper presented to the ILO-International Finance Corporation Conference on Better Work 26-28 October 2011, International Finance Corporation, Washington DC.

117
Goger, A. and Pickles, J. (2010) Currency Fluctuation, the Race to the Bottom, and the Changing Geographies of Apparel Sourcing. Unpublished mimeo. Hang, Nguyen Thu (2009). Rapid Impact Monitoring on Impacts of the Global Economic Crisis in Viet Nam. Synthesis Report Round August-September 2009. Center for Analysis and Forecasting of the Viet Nam Academy of Social Sciences.
Hang, Nguyen Thu (2011).’ Impact of the Financial Crisis on Firm Production and Labour Income in the Garment Sector in Vietnam’. Cappturing the Gains Bali Conference paper, 26-29 July. Lan, Tu and Pickles, J. (2011). China’s New Labor Contract Law: State regulation and worker rights in global production networks. Capturing the Gains Working Paper, 2011. Mayer, F. and Pickles, J. (2011). Re-embedding Governance: Global Apparel Value Chains and Decent Work. Capturing the Gains Working Paper. Milberg, W. and Bernhardt, T. (2011). ‘Does Industrial Upgrading Generate Employment and Wage Gains?’ Paper presented to the ILO-International Finance Corporation Conference on Better Work 26-28 October 2011, International Finance Corporation, Washington DC. Miller, D. (2011a). The ITGLWF’s policy on cross-border dialogue in the apparel and textile sector: emerging strategies in a sector ruled by codes of conduct and resistant companies. Capturing the Gains Apparel Sector Working Paper. Miller, D. (2011b). ‘Regulating the ”Wage Effort Bargain” in outsourced apparel production – two provocations’. Paper presented to the ILO-International Finance Corporation Conference on Better Work 26-28 October, International Finance Corporation, Washington DC. Miller, D. (2011c.) Global social relations and the limits and possibilities of transformative CSR in outsourced apparel supply chains: The case of the Inditex GFA. Capturing the Gains Apparel Sector Working Paper. Miller, D. (2012a). Towards Sustainable Labour Costing in the Global Apparel Industry: Some evidence from UK Fashion Retail. CtG Apparel Sector Working Paper. Miller, D. (2012b.) Implementing the living wage: A costing model for clothing brands and retailers. Capturing the Gains Apparel Sector Working Paper. Miller, D. (2012c). Towards Sustainable Labour Costing in the Global Apparel Industry: Some evidence from UK Fashion Retail. Capturing the Gains Apparel Sector Working Paper. Miller, D. (2012d). Last Nightshift in Savar: The Story of the Spectrum Sweater Factory Collapse. London: Mcnidder and Grace. Miller, D. Turner, S. Grinter, T. (2011). Back to the Future? Mature systems of industrial relations approaches and governance issues in outsourced apparel supply chains. Capturing the Gains Working Paper. Morris, M. and Staritz, C. (2011). ‘Local embeddedness, upgrading and skill development: global value chains and foreign direct investment in Lesotho’s clothing sector’. Paper presented to the ILO-International Finance Corporation Conference on Better Work 26-28 October, International Finance Corporation, Washington DC. Nathan, D. and Phillips, N. (2011). ‘Dealing with home-based child labour in global garments production’. Paper presented to the ILO-International Finance Corporation Conference on Better Work 26-28 October , International Finance Corporation, Washington DC. Pickles, J. and Zhu, S.( 2012a). Alta Gracia. Briefing Notes on New Dimensions in Apparel GPN Governance. Capturing the Gains Apparel Sector Working Paper.
118
Pickles, J. and Zhu, S. (2012b). California Supply Chains Act. Briefing Notes on New Dimensions in Apparel GPN Governance. Capturing the Gains Apparel Sector Working Paper. Pickles, J. and Zhu, S. (2012c). Levi’s Terms of Engagement. Briefing Notes on New Dimensions in Apparel GPN Governance. Capturing the Gains Apparel Sector Working Paper. Pike, K. and Godfrey, S. (2011). ‘Explaining variation in compliance with labour standards in Lesotho’s apparel industry’. Paper presented to the ILO-International Finance Corporation Conference on Better Work 26-28 October, International Finance Corporation, Washington DC. Plank, L., Rossi, A. and Staritz, C. (2011). ‘Workers and Social Upgrading in ”Fast Fashion”: The Case of the Apparel Industry in Morocco and Romania’. Paper presented to the ILO-International Finance Corporation Conference on Better Work 26-28 October 2011, International Finance Corporation, Washington DC. Rossi, A (2010). ’Economic and Social Upgrading in Global Production Networks: The Case of the Garment Industry in Morocco’. Unpublished dissertation, University of Sussex, UK. Staritz, C. (2010a). Overview of the development of the clothing sectors in the main SSA clothing exporter countries.. CtG Apparel Sector Working Paper. Staritz, C. (2010b). Overview of the development of the clothing sectors in South Africa, Lesotho and Swaziland. World Bank Draft, August. Staritz, C. and Morris. M. (2012). Local Embeddedness and Economic and Social Upgrading in Madagascar’s Export Apparel Industry. CtG Apparel Sector Working Paper. Tewari. M. (2012). Lead Firms, Community based CSR practices and the prospects of area-based economic and social upgrading: Lessons from Gap South Asia’s Mewat Case and the PACE program. CtG Apparel Sector Working Paper. Zhu, S. and Pickles, J. (2013). “ From ‘Bring-In’ to ‘Go-Up’, ‘Go-West’, and ‘Go-Out’: Upgrading, Regionalization, and Delocalization in China’s Apparel Production Networks”. Journal of Contemporary Asia. Forthcoming.

119
Share of clothing in trade in total merchandise and in manufactures by region, 2010 (%)
Exports Imports Share in total merchandise
World 2.4 2.4 North America 0.5 3.4 South and Central America 1.9 1.5 Europe 2.0 2.9 Commonwealth of Independent States (CIS) 0.3 4.3 Africa 1.8 1.6 Middle East 0.4 2.2 Asia 4.3 1.1
Australia, Japan and New Zealand 0.1 3.5 Other Asia 5.4 0.5
Share in manufactures World 3.5 3.5 North America 0.8 4.7 South and Central America 7.3 2.2 Europe 2.7 4.2 Commonwealth of Independent States (CIS) 1.3 5.8 Africa 9.9 2.4 Middle East 1.7 3.0 Asia 5.4 1.8
Australia, Japan and New Zealand 0.1 6.1 Other Asia 6.6 0.8
Note: Import shares are derived from the Secretariat's network of world merchandise trade by product and region. Source: WTO: International Trade Statistics 2011, Merchandise trade: http://www.wto.org/english/res_e/statis_e/its2011_e/its11_merch_trade_product_e.htm

120
Clothing exports contributing more than 10% share in economy's total merchandise exports, 2005, 2010
Value 2010 2005 2010 a Haiti c 509 83.6 87.8 Bangladesh b, c 15660 74.1 81.6 Lesotho c 590 68.5 72.0 Cambodia 3041 71.5 60.5 Honduras c 2915 55.3 50.8 Sri Lanka c 3491 45.3 41.1 Macao, China c 334 66.8 38.4 El Salvador d 1697 49.8 37.7 Madagascar c 363 40.3 33.3 Mauritius c, d 658 34.7 29.4 FYR Macedonia ... 24.4 21.7 Tunisia c 3043 29.8 18.5 Pakistan 3930 22.5 18.4 Albania 281 30.0 18.1 Morocco d 2743 25.4 15.6 Viet Nam c 10839 14.4 15.0 Moldova 233 15.7 14.7 Guatemala 1187 28.0 14.0 Jordan 889 24.7 12.6 Turkey 12760 16.1 11.2 a Or nearest year. b Figures refer to fiscal year. c Includes Secretariat estimates. d Includes significant exports from processing zones. e Mainly re-exports. Source: WTO: International Trade Statistics 2011, Merchandise trade: http://www.wto.org/english/res_e/statis_e/its2011_e/its11_merch_trade_product_e.htm

121
Leading exporters and importers of clothing, 2010 (Billion US$ and percentage) Value
Share in world exports/imports Annual percentage change
2010 1990 2000 2010 2005-10 2008 2009 2010 Exporters
China a 130 8.9 18.3 36.9 12 4 -11 21 European Union (27) 99 - 28.5 28.1 3 8 -14 1
extra-EU (27) exports 22 - 6.6 6.3 3 10 -21 2 Hong Kong, China 24 - - - -2 -3 -18 5
domestic exports 0 8.6 5.0 0.1 -43 -42 -80 -28 re-exports 24 - - - 3 5 -11 6
Bangladesh b 16 0.6 2.6 4.5 18 23 15 25 Turkey 13 3.1 3.3 3.6 2 -2 -15 10 India 11 2.3 3.0 3.2 5 10 9 -6 Viet Nam b 11 ... 0.9 3.1 18 18 -2 27 Indonesia 7 1.5 2.4 1.9 7 7 -6 15 United States 5 2.4 4.4 1.3 -1 3 -6 12 Mexico a 4 0.5 4.4 1.2 -10 -4 -16 6 Thailand 4 2.6 1.9 1.2 1 4 -12 15 Pakistan 4 0.9 1.1 1.1 2 3 -14 17 Malaysia a 4 1.2 1.1 1.1 9 15 -14 24 Sri Lanka b 3 0.6 1.4 1.0 4 5 -5 7 Tunisia b 3 1.0 1.1 0.9 -1 5 -17 -2
Above 15 314 - 79.5 89.4 - - - - Importers
European Union (27) 164 - 41.0 44.7 5 16 -11 2 extra-EU (27) imports 88 - 19.8 23.8 6 10 -9 3
United States 82 24.0 33.1 22.3 0 -3 -13 14 Japan 27 7.8 9.7 7.3 4 7 -1 5 Hong Kong, China 17 - - - -2 -3 -16 7
retained imports ... ... ... ... ... ... ... ... Canada c 8 2.1 1.8 2.3 7 8 -8 10 Russian Federation c 7 - 1.3 2.0 -2 -17 -40 -1 Switzerland 5 3.1 1.6 1.4 3 12 -10 1 Australia c 5 0.6 0.9 1.3 9 16 -5 19 Korea, Republic of 4 0.1 0.6 1.2 9 -2 -20 31 Turkey 3 0.0 0.1 0.8 29 41 -3 32 United Arab Emirates 3 0.5 0.4 0.7 11 21 -8 2 China a 3 0.0 0.6 0.7 9 16 -19 36 Norway 3 1.1 0.6 0.7 6 12 -11 10 Mexico a, c 2 0.5 1.8 0.6 -2 3 -17 9 Singapore 2 0.8 0.9 0.5 -2 -8 -24 15
Above 15 d 318 - 94.5 86.5 - - - - a Includes significant shipments through processing zones b Includes Secretariat estimates. c Imports are valued f.o.b. d Excludes retained imports of Hong Kong, China. Source: WTO: International Trade Statistics 2011, Merchandise trade: http://www.wto.org/english/res_e/statis_e/its2011_e/its11_merch_trade_product_e.htm
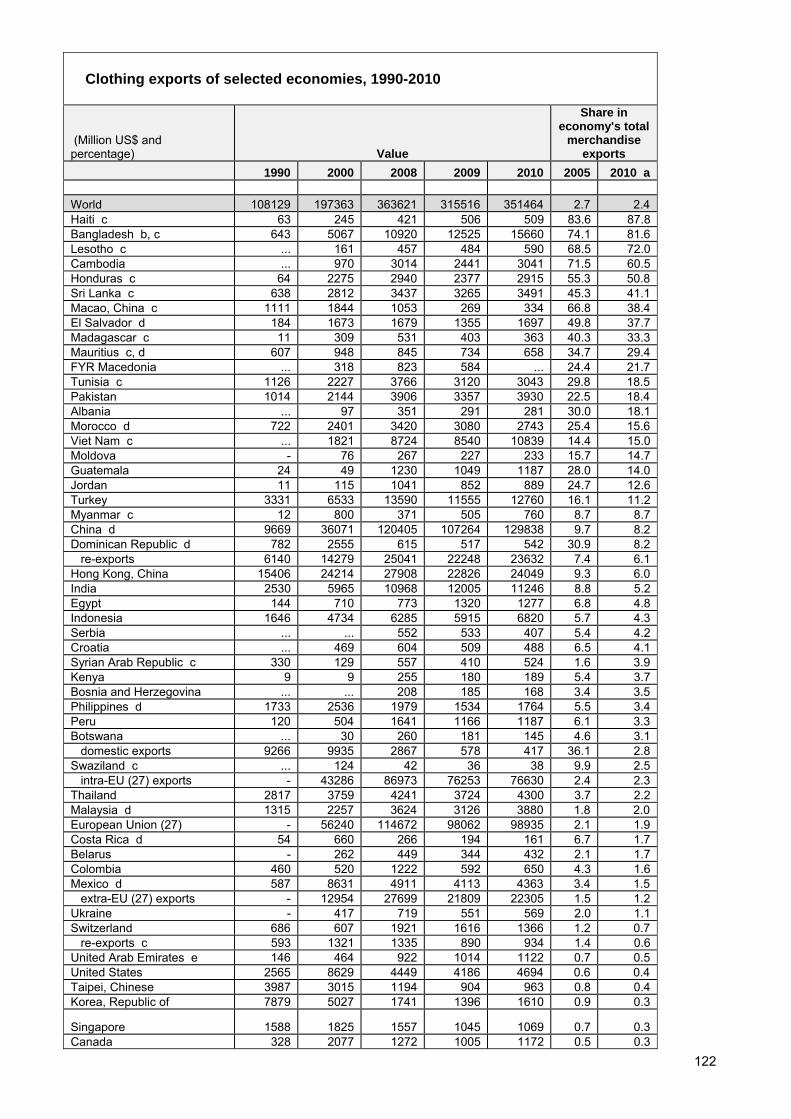
122
Clothing exports of selected economies, 1990-2010
(Million US$ and percentage) Value
Share in economy's total
merchandise exports
1990 2000 2008 2009 2010 2005 2010 a World 108129 197363 363621 315516 351464 2.7 2.4 Haiti c 63 245 421 506 509 83.6 87.8 Bangladesh b, c 643 5067 10920 12525 15660 74.1 81.6 Lesotho c ... 161 457 484 590 68.5 72.0 Cambodia ... 970 3014 2441 3041 71.5 60.5 Honduras c 64 2275 2940 2377 2915 55.3 50.8 Sri Lanka c 638 2812 3437 3265 3491 45.3 41.1 Macao, China c 1111 1844 1053 269 334 66.8 38.4 El Salvador d 184 1673 1679 1355 1697 49.8 37.7 Madagascar c 11 309 531 403 363 40.3 33.3 Mauritius c, d 607 948 845 734 658 34.7 29.4 FYR Macedonia ... 318 823 584 ... 24.4 21.7 Tunisia c 1126 2227 3766 3120 3043 29.8 18.5 Pakistan 1014 2144 3906 3357 3930 22.5 18.4 Albania ... 97 351 291 281 30.0 18.1 Morocco d 722 2401 3420 3080 2743 25.4 15.6 Viet Nam c ... 1821 8724 8540 10839 14.4 15.0 Moldova - 76 267 227 233 15.7 14.7 Guatemala 24 49 1230 1049 1187 28.0 14.0 Jordan 11 115 1041 852 889 24.7 12.6 Turkey 3331 6533 13590 11555 12760 16.1 11.2 Myanmar c 12 800 371 505 760 8.7 8.7 China d 9669 36071 120405 107264 129838 9.7 8.2 Dominican Republic d 782 2555 615 517 542 30.9 8.2 re-exports 6140 14279 25041 22248 23632 7.4 6.1 Hong Kong, China 15406 24214 27908 22826 24049 9.3 6.0 India 2530 5965 10968 12005 11246 8.8 5.2 Egypt 144 710 773 1320 1277 6.8 4.8 Indonesia 1646 4734 6285 5915 6820 5.7 4.3 Serbia ... ... 552 533 407 5.4 4.2 Croatia ... 469 604 509 488 6.5 4.1 Syrian Arab Republic c 330 129 557 410 524 1.6 3.9 Kenya 9 9 255 180 189 5.4 3.7 Bosnia and Herzegovina ... ... 208 185 168 3.4 3.5 Philippines d 1733 2536 1979 1534 1764 5.5 3.4 Peru 120 504 1641 1166 1187 6.1 3.3 Botswana ... 30 260 181 145 4.6 3.1 domestic exports 9266 9935 2867 578 417 36.1 2.8 Swaziland c ... 124 42 36 38 9.9 2.5 intra-EU (27) exports - 43286 86973 76253 76630 2.4 2.3 Thailand 2817 3759 4241 3724 4300 3.7 2.2 Malaysia d 1315 2257 3624 3126 3880 1.8 2.0 European Union (27) - 56240 114672 98062 98935 2.1 1.9 Costa Rica d 54 660 266 194 161 6.7 1.7 Belarus - 262 449 344 432 2.1 1.7 Colombia 460 520 1222 592 650 4.3 1.6 Mexico d 587 8631 4911 4113 4363 3.4 1.5 extra-EU (27) exports - 12954 27699 21809 22305 1.5 1.2 Ukraine - 417 719 551 569 2.0 1.1 Switzerland 686 607 1921 1616 1366 1.2 0.7 re-exports c 593 1321 1335 890 934 1.4 0.6 United Arab Emirates e 146 464 922 1014 1122 0.7 0.5 United States 2565 8629 4449 4186 4694 0.6 0.4 Taipei, Chinese 3987 3015 1194 904 963 0.8 0.4 Korea, Republic of 7879 5027 1741 1396 1610 0.9 0.3
Singapore 1588 1825 1557 1045 1069 0.7 0.3 Canada 328 2077 1272 1005 1172 0.5 0.3

123
domestic exports 995 504 222 155 135 0.2 0.1 Japan 568 534 591 484 531 0.1 0.1 a Or nearest year. b Figures refer to fiscal year. c Includes Secretariat estimates. d Includes significant exports from processing zones. e Mainly re-exports. Source: WTO: International Trade Statistics 2011, Merchandise trade: http://www.wto.org/english/res_e/statis_e/its2011_e/its11_merch_trade_product_e.htm

124
Growth rates 2000 - 2009 Three-year-moving averages, market shares and unit values Growth (in %) Growth (in %) market sh. unit value Kenya 140.00 6.18
Lesotho -2.03 13.48
Mauritius -40.37 54.52
South Africa -67.31 44.19
Bangladesh 74.56 31.92
Cambodia 95.25 13.19
China 56.89 49.28
India 46.75 12.06
Sri Lanka -3.12 23.16
Viet Nam 140.00 27.94
Indonesia -1.94 16.42
Jordan 140.00 15.04
Dominican Rep. -76.70 -7.23
El Salvador -36.75 -7.27
Guatemala -39.73 -1.55
Haiti 37.31 -26.84
Mexico -65.50 4.07
Nicaragua 86.30 -16.87

125
Nominal wages and labour costs in the apparel sector (in US$), 2000‐2009
Country Indicator / Unit 2000 2004 2005 2008 2009 %‐change
2000‐04 2004‐09 2000‐09 Cambodia Avge annual wage in US$ 753 705 n.a. 888 834 ‐6.25% 18.16% 10.77%
China Avge annual wage in US$ n.a. 1,402 1,578 3,094 3,661 n.a. 161.09% 191.46%
Domin. Rep. Avge annual wage in US$ 3,718 2,182 3,380 3,466 3,537 ‐41.32% 62.10% ‐4.87%
El Salvador Avge annual wage in US$ 1,988 2,084 2,720 2,853 n.a. 4.81% 36.88% 43.46%
India Avge annual wage in US$ 777 1,032 1,136 1,642 n.a. 32.80% 59.16% 111.36%
Indonesia Avge annual wage in US$ 752 1,127 1,012 1,370 1,330 49.79% 18.07% 76.85%
Jordan Avge annual wage in US$ 1,737 1,947 2,275 4,107 3,444 12.09% 76.87% 98.26%
Kenya Avge annual wage in US$ 747 987 938 1,139 926 32.10% ‐6.15% 23.97%
Lesotho Avge annual wage in US$ 1,271 1,656 1,811 1,142 1,325 30.28% ‐19.98% 4.25%
Mauritius Avge annual wage in US$ 2,833 3,562 3,645 n.a. 3,577 25.73% 0.43% 26.26%
Mexico Avge annual wage in US$ 4,829 4,950 5,467 6,312 5,328 2.51% 7.64% 10.34%
South Africa Avge annual wage in US$ 3,758 5,161 6,350 5,718 6,066 37.35% 17.53% 61.43%
Nicaragua Min. annual wage in US$, incl. social charges
963 1,243 1,362 2,138 2,202 29.10% 77.12% 128.66%
Bangladesh Labour Costs (US$ per hour, incl. social charges)
0.39 n.a. 0.23 0.22 n.a. ‐41.03% ‐4.35% ‐43.59%
Guatemala LC (US$/hour, incl. SC) 1.49 n.a. n.a. 1.65 n.a. n.a. n.a. 10.74%
Haiti LC (US$/hour, incl. SC) 0.49 n.a. n.a. 0.52 n.a. n.a. n.a. 6.12%
Sri Lanka LC (US$/hour, incl. SC) 0.48 0.46 n.a. 0.43 n.a. ‐4.17% ‐6.52% ‐10.42%
Vietnam LC (US$/hour, incl. SC) n.a. n.a. 0.28 0.38 n.a. n.a. 35.71% n.a.
Note: “LC (US$/hour, incl. SC)” stands for “Labour Costs (US$ per hour, incl. social charges)”. For Cambodia and Lesotho, the figures refer to the textiles & clothing sector. For the Dominican Republic, Kenya, and Nicaragua, the figures reported are wages in textiles & apparel in EPZs. For El Salvador, the figure for 2000 refers to 2001; for Bangladesh, Cambodia, Guatemala, Haiti, Kenya, and Sri Lanka, the figure for 2000 refers to 2002; for China and Mexico, the figure for 2000 refers to 2003; for Mauritius, the figure for 2009 refers to 2007. For El Salvador, India, Bangladesh, Guatemala, Haiti, Sri Lanka and Vietnam, the final year underlying the calculation of growth rates is 2008. The growth rates reported in the last three columns cover different time periods accordingly. Sources: Author’s own illustration based on wage data from UNIDO INDSTAT4 database, Jassin‐O'Rourke Group (2002, 2008), CNZFE (2005, 2010), EPZA (2009), Lesotho Bureau of Statistics (2010), Instituto Nacional de Estadística, Geografía e Informática (INEGI) de México, ProNicaragua (2011); and exchange rate data from IMF International Financial Statistics (IFS) database.

126
economic and social upgrading in global production networks
Published by: Capturing the Gains The University of Manchester Arthur Lewis Building Oxford Road Manchester M13 9PL United Kingdom [email protected]
www.capturingthegains.org
Capturing the Gains brings together an international network of experts from North and South. The research programme is designed to engage and influence actors in the private sector, civil society, government and multi-lateral organisations. It aims to promote strategies for decent work in global production networks and for fairer international trade.