ng. cell’s ri is used as a higher protein content....
TRANSCRIPT

8511-4244-0842-3/07/$20.00©2007 IEEE
TRA
NSD
UC
ERS &
EUR
OSEN
SOR
S ’07The 14th International C
onference on Solid-State Sensors, Actuators and M
icrosystems, Lyon, France, June 10-14, 2007
Inlet of buffers
Cellloading
Outlet
FBG
Input
Output
SINGLE LIVING CELL REFRACTOMETRY USING FBG-BASED RESONANT CAVITY
L. K. Chin1, C. S. Lim2, P. H. Yap3, J. H. Ng4, J. Z. Hao4, S. Takahashi4 and A. Q. Liu1†
1School of Electrical & Electronic Engineering, Nanyang Technological University, SINGAPORE 2School of Chemical and Biomedical Engineering, Nanyang Technological University, SINGAPORE
3Defense Medical & Environmental Research Institute, DSO National Laboratories, SINGAPORE 4Institute of Infocomm Research, SINGAPORE
(†Email: [email protected]; Tel: (65) 6790-4336; Fax: (65) 6792-0415)
Abstract: This paper reports a single cell refractometer consists of FBG fiber-based resonant cavity by employing buffer modulation method. In this biophotonic chip, single cell is trapped optically in the cavity, and the transmission spectral shifts due to the change of surrounding buffer, without and with cell, are used to determine the cell’s refractive index (RI) and size. The measurement shows that MDCK cell has an effective RI of 1.383 at a precision of 0.1%. Moreover, the measurement method with optical trapping eliminates uncertain factors and prevents cell damage. The chip is promising for label-free cell measurement and further cell analysis.
Keywords: Fiber Bragg gratings, single cell measurement, buffer modulation and refractive index.
1. INTRODUCTION
For years, refractive index (RI) of single living cell has gained attention from scientists to investigate the measurement methods and the interpretation of its meaning. Cell’s RI is used as a fundamental quantity to be investigated and related to certain metabolic activities, such as mobility of human spermatozoon, studies on cell permeability and death, haematology, spectrophometry of cell suspension [1] and others. In addition, RI of cell is also related to cancerology [2] in which cancerous cell has higher RI as compared to normal cell due to higher protein content. Previously, cell’s RI is detected by Fabry-Pérot cavity with gold-coated fibers, and the micropipette is integrated for cell trapping [3]. The drawback is the deformation of cell sample during micropipette trapping for measurement. Moreover, the integration of additional micropipette for cell trapping also increases the difficulties of the fabrication process. Therefore, this paper demonstrates a simple but precise method by using a single pair of fibers for both cell trapping and RI measurement.
2. BIOPHOTONIC CHIP DESIGN
The biophotonic chip is designed by employing a pair of FBG single-mode fibers for RI
measurement and integrating fiber optical tweezers for non-contactable cell trapping. Fig. 1 shows the schematic of the designed biophotonic chip where three inlets are introduced; one for cell loading and the other two for buffer injection. A pair of FBG fibers are aligned and separated by 20 µm to form a resonant cavity. A high power laser source is coupled into both fibers. A single cell can be trapped between the fibers by laser scattering force in the direction of beam propagation. Meanwhile, the cell is also self-aligned along the core of the fibers because of the gradient force perpendicular to the beam propagation direction. A broadband light source is used to observe the transmission spectrum of the resonant cavity for RI measurement.
Fig. 1 Schematic diagram of the designed chip.
2E
F15.P

8521-4244-0842-3/07/$20.00©2007 IEEE
TRA
NSD
UC
ERS &
EUR
OSEN
SOR
S ’07The 14th International C
onference on Solid-State Sensors, Actuators and M
icrosystems, Lyon, France, June 10-14, 2007
Nor
mal
ized
Tra
nsm
ittan
ce
Wavelength (nm) 1258.61258.41258.2
0.0
0.2
0.4
0.6
0.8
1.0T-matrix Resonant formula
(b)b)
D
L1
lc
nc
Cell
(a)
3. PRINCIPLES OF DETECTION
The working principle of RI measurement is based on the differential method [3]. Based on Fabry-Pérot cavity [4], the resonant cavity formed by the FBG fibers has a transmittance, given as
2
20 1 1
(1 )1 2 cos 2( 2 )
RT
R R D Lβ β ϕ−
=+ − + +
, (1)
where R and are the reflectance and phase shift of FBG respectively, D is the cavity length, L1 isthe length from the fiber edge to FBG, 0 and 1are the respective propagation constants, as shown in Fig. 2(a). A comparison between T-matrix method [5] and the above developed formula is conducted and the simulated transmittance spectrum is shown in Fig. 2(b). The simulation results show that both methods support each other because the peaks occur within the band-stop region are exactly identical. When the refractive index of the buffer in the cavity is changed slightly, the resonant peaks are shifted by,
2
2 eff eff eff
nD OPL
n L OPL
λλ
Δ Δ Δ= = , (2)
where is the wavelength shift, is the resonant wavelength, n is the change of refractive index, D is the length of the cavity, neff and Leff are the effective refractive index and effective length of the resonant cavity formed by the FBG fibers respectively.
As the change in effective optical path length (OPLeff) due to the slight change in RI is negligible, a linear relation can be derived from the wavelength shift and the change of optical path length, i.e.
k OPLλΔ = Δ , (3) where k is defined as the resonant peak shift per unit change of optical path length.
With the defined k, differential method can now be used to determine the refractive index and size of a single cell. In this method, two buffers are alternatively injected into the cavity. Four transmission spectra can be obtained with two spectra for each buffer, i.e. with the absence or presence of cell in the cavity. Based on Eq. (3), the wavelength shifts are:
1 1( )c ck n n lλΔ = − , (4)
and 2 2( )c ck n n lλΔ = − . (5) The cell’s size (lc) and RI (nc) can be determined by,
2 1
2 1( )cl k n nλ λΔ − Δ=
−, (6)
and 1 21 2c
c c
n n nkl klλ λΔ Δ= + = + , (7)
where n1 and n2 are the refractive index of buffer 1 and buffer 2 respectively, 1 is the wavelength shift in buffer 1 and 2 is the wavelength shift in buffer 2.
Fig. 2 (a) Schematic of FBG resonant cavity; and (b) Comparison of different theoretical models for FBG cavity.
4. FABRICATION METHODS
The biophotonic chip was fabricated (with a dimension of 5 mm × 10 mm) as shown in Fig. 3, by using laser engraving system (Universal Laser Systems, M360) to scribe the microstructure on a bare piece of poly (methyl methacrylate) (PMMA) slab. The 2-mm FBG with Bragg wavelength of 1258 nm and reflectivity of 6 dB are inscribed in
2E
F15.P
8531-4244-0842-3/07/$20.00©2007 IEEE
TRA
NSD
UC
ERS &
EUR
OSEN
SOR
S ’07The 14th International C
onference on Solid-State Sensors, Actuators and M
icrosystems, Lyon, France, June 10-14, 2007
(b)
Ref
ract
ive
inde
x ch
ange
(n)
Wavelength shift (nm) 0.00 0.20 0.40 0.60 0.80 1.00
0.02
0.01
0.00
0.03
(a)Wavelength (nm)
1258.0 1258.2 1258.4 1258.6 1258.8 1259.0 N
orm
aliz
ed T
rans
mitt
ance
0.50
0.25
0.00
0.75
1.00
Deionized water 13% NaCl
Cellloading
Buffer inlets
Outlet
FBG fiber
FBG fiber
PMMA chip 3 mm
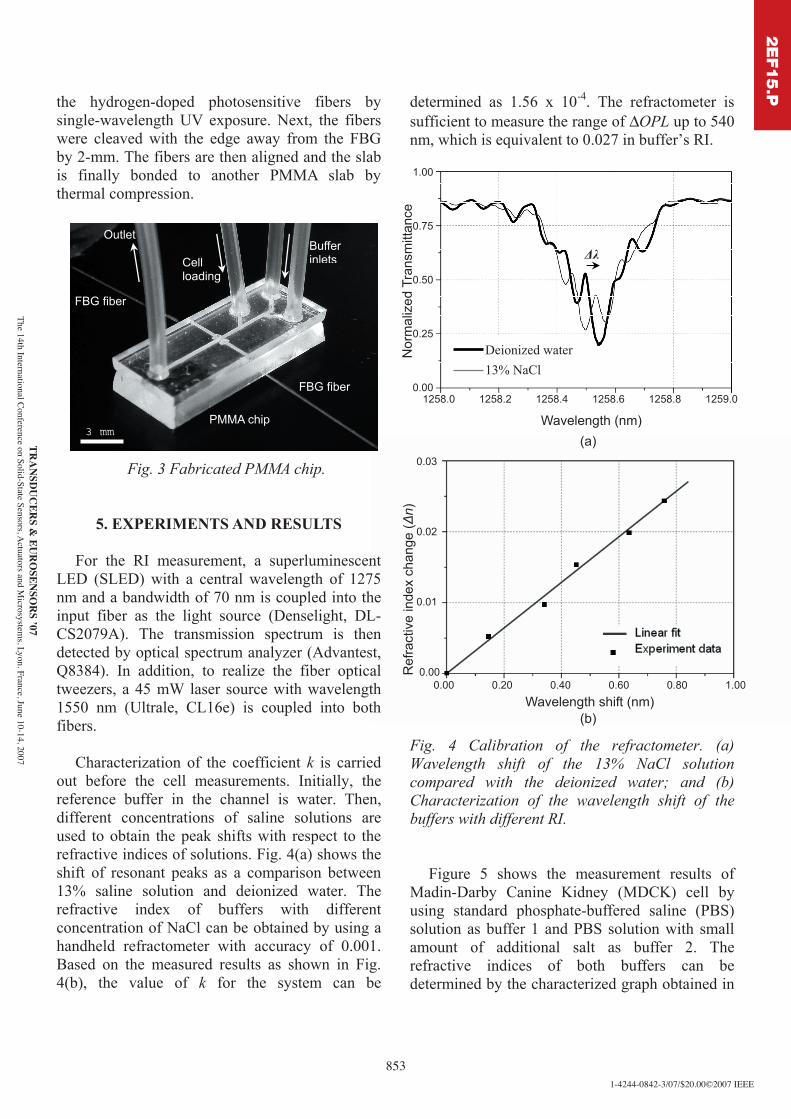
the hydrogen-doped photosensitive fibers by single-wavelength UV exposure. Next, the fibers were cleaved with the edge away from the FBG by 2-mm. The fibers are then aligned and the slab is finally bonded to another PMMA slab by thermal compression.
Fig. 3 Fabricated PMMA chip.
5. EXPERIMENTS AND RESULTS
For the RI measurement, a superluminescent LED (SLED) with a central wavelength of 1275 nm and a bandwidth of 70 nm is coupled into the input fiber as the light source (Denselight, DL-CS2079A). The transmission spectrum is then detected by optical spectrum analyzer (Advantest, Q8384). In addition, to realize the fiber optical tweezers, a 45 mW laser source with wavelength 1550 nm (Ultrale, CL16e) is coupled into both fibers.
Characterization of the coefficient k is carried out before the cell measurements. Initially, the reference buffer in the channel is water. Then, different concentrations of saline solutions are used to obtain the peak shifts with respect to the refractive indices of solutions. Fig. 4(a) shows the shift of resonant peaks as a comparison between 13% saline solution and deionized water. The refractive index of buffers with different concentration of NaCl can be obtained by using a handheld refractometer with accuracy of 0.001. Based on the measured results as shown in Fig. 4(b), the value of k for the system can be
determined as 1.56 x 10⁻⁴. The refractometer is sufficient to measure the range of ΔOPL up to 540 nm, which is equivalent to 0.027 in buffer’s RI.
Fig. 4 Calibration of the refractometer. (a) Wavelength shift of the 13% NaCl solution compared with the deionized water; and (b) Characterization of the wavelength shift of the buffers with different RI.
Figure 5 shows the measurement results of Madin-Darby Canine Kidney (MDCK) cell by using standard phosphate-buffered saline (PBS) solution as buffer 1 and PBS solution with small amount of additional salt as buffer 2. The refractive indices of both buffers can be determined by the characterized graph obtained in
2E
F15.P

8541-4244-0842-3/07/$20.00©2007 IEEE
TRA
NSD
UC
ERS &
EUR
OSEN
SOR
S ’07The 14th International C
onference on Solid-State Sensors, Actuators and M
icrosystems, Lyon, France, June 10-14, 2007
1258.0 1258.2 1258.4 1258.6 1258.8 1259.0
Nor
mal
ized
Tra
nsm
ittan
ce
Wavelength (nm)
1.0
0.5
0.0
λ2
(b)
Buffer 2 Buffer 2 with cell
1258.0 1258.2 1258.4 1258.6 1258.8 1259.0
Nor
mal
ized
Tra
nsm
ittan
ce
Wavelength (nm)
1.0
0.5
0.0
λ1
(a)
Buffer 1 Buffer 1 with cell
Fig. 4(b). In this case, the refractive index of buffer 1 is 1.355 and the one of buffer 2 is 1.360. Based on Fig. 5, the wavelength shifts can be determined for each case, i.e. 1 is 0.062 nm and
2 is 0.050 nm. The calculated MDCK cell’s refractive index and size can then be determined, as listed in Table 1. The same cell is measured for four times and the means of the values are calculated. The results show that the standard deviation for the measured cell’s size is improved compared to the method proposed in [3]. As a result, the cell refractometer demonstrated in this paper is more reliable and stable.
Fig. 5 Transmission spectra of buffers without and with cell in the cavity. (a) Standard PBS solution (Buffer 1); and (b) PBS solution with additional NaCl (Buffer 2).
6. CONCLUSIONS
In conclusion, a highly-sensitive single living cell refractometer is demonstrated. This device operates through optically trapping the cell in the resonant cavity between a pair of FBG fibers. The RI and size of cell are measured by using buffer modulation method, in which the resonant wavelength shifts are observed with the absence/presence of cell in two different buffers. The sensitivity of the device is 3 nm per unit change in RI. The device is precise with high reproducibility in measurement due to the employment of fiber optical tweezers. This refractometer has a potential in label-free cell detection and sorting for further medical cell diagnosis.
REFERENCES
[1] R. Barer, F. A. Ross and S. Tkaczy, “Refractometry of living cells,” Nature, Vol. 171, pp. 720 – 724, 1953. [2] X. J. Liang, A. Q. Liu, C. S. Lim, T. C. Ayi and P. H. Yap, “Determining refractive index of single living cell using an integrated microchip,” Sensors and Actuators A: Physical, Vol. 133, pp 349 – 354, 2007. [3] W. Z. Song, X. M. Zhang, A. Q. Liu, C. S. Lim, P. H. Yap and H. M. Hosseini, “Refractive index measurement of single living cells using on-chip Fabry-Pérot cavity,” Applied Physics Letters, Vol. 89, 203901, 2006. [4] Y. O. Barmenkov, “Effective length of short Fabry-Pérot cavity formed by uniform fiber Bragg gratings,” Optics Express, Vol. 14, pp 6394 – 6399, 2006. [5] T. Erdogan, “Fiber grating spectra,” Journal of Lightwave Technology, Vol. 15, pp. 1277 – 1294, 1997.
Cell’s RI Cell’s Size (µm)Test 1 1.383 15.938 Test 2 1.382 16.423 Test 3 1.382 16.339 Test 4 1.384 15.845
Average 1.383 16.136 Standard Deviation 0.001 0.287
Table 1. Measurement results of MDCK cell
2E
F15.P