nfo (june 13 to june 21 axis nifty etf - axismf e… · 7 nifty 50 index performance the above...
TRANSCRIPT

NFO (June 13th to June 21st)
Axis Nifty ETF (An open-ended Exchange-Traded Fund)
1
2
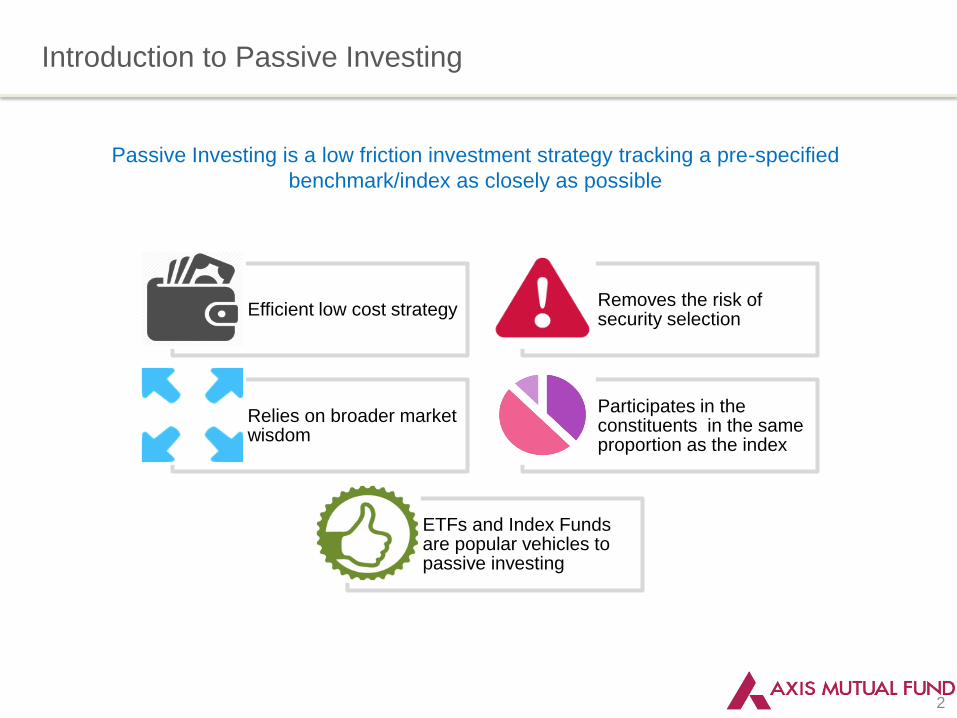
Introduction to Passive Investing
Passive Investing is a low friction investment strategy tracking a pre-specified
benchmark/index as closely as possible
Efficient low cost strategy Removes the risk of security selection
Relies on broader market wisdom
Participates in the constituents in the same proportion as the index
ETFs and Index Funds are popular vehicles to passive investing

3
ETFs provide the best of both worlds
Combines benefits of index based investing with stock listing
Similarity
with index
funds
Similarity with
stocks
• Low cost vehicle
• Replicates an Index
• Low expense ratio
• Open-ended structure
• Listed on an exchange
• Traded on daily basis
• Can put limit orders
• Demat holding
4
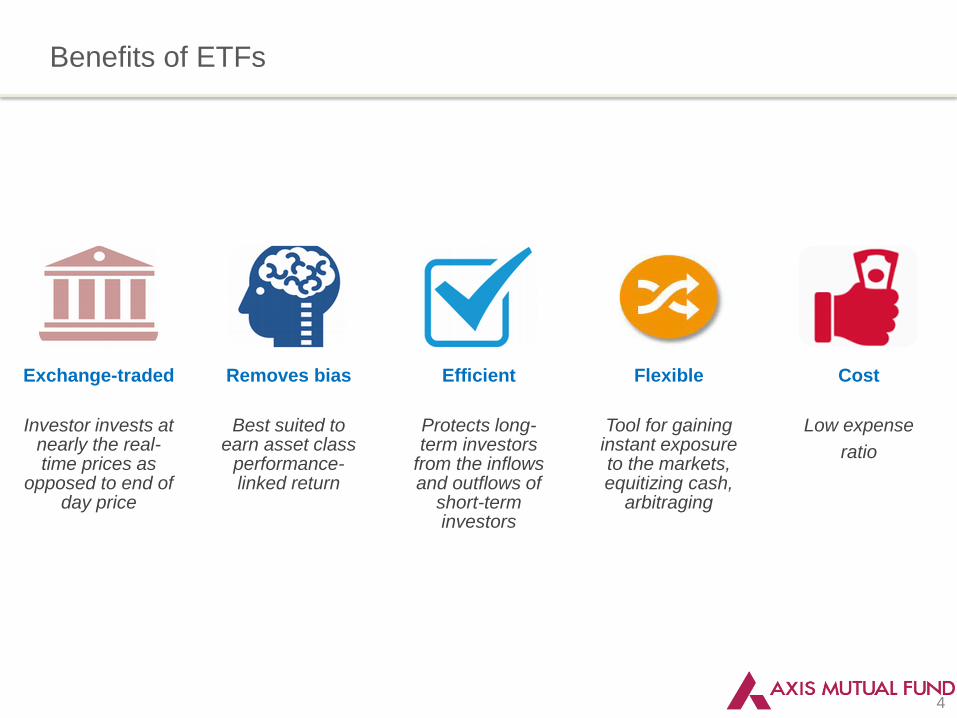
Benefits of ETFs
Exchange-traded
Investor invests at nearly the real-time prices as
opposed to end of day price
Removes bias
Best suited to earn asset class
performance-linked return
Efficient
Protects long-term investors
from the inflows and outflows of
short-term investors
Flexible
Tool for gaining instant exposure to the markets, equitizing cash,
arbitraging
Cost
Low expense
ratio

5
The ETF mechanism
Seller
NSE
Buyer Fund
Authorized
Participants /
Financial Institutions
Primary Market Secondary Market
Redemption
in kind
Buy/Sell
Cash Units of
ETF
Cash Units of
ETF Market
Making/
Arbitrage
Creation
in-kind
6
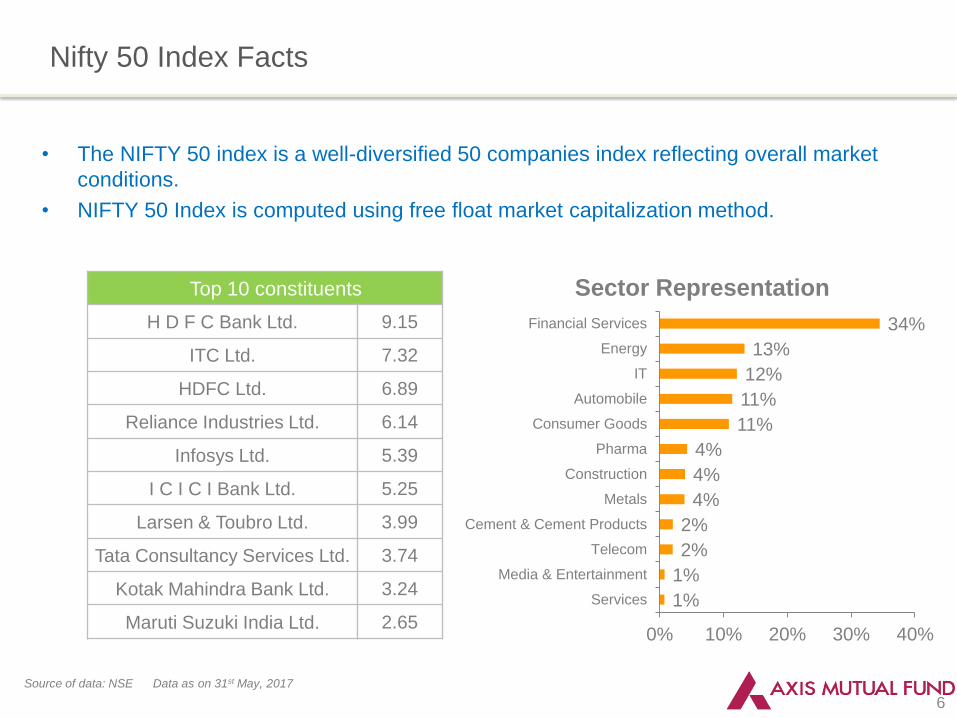
Nifty 50 Index Facts
Source of data: NSE Data as on 31st May, 2017
• The NIFTY 50 index is a well-diversified 50 companies index reflecting overall market
conditions.
• NIFTY 50 Index is computed using free float market capitalization method.
Top 10 constituents
H D F C Bank Ltd. 9.15
ITC Ltd. 7.32
HDFC Ltd. 6.89
Reliance Industries Ltd. 6.14
Infosys Ltd. 5.39
I C I C I Bank Ltd. 5.25
Larsen & Toubro Ltd. 3.99
Tata Consultancy Services Ltd. 3.74
Kotak Mahindra Bank Ltd. 3.24
Maruti Suzuki India Ltd. 2.65
1%
1%
2%
2%
4%
4%
4%
11%
11%
12%
13%
34%
0% 10% 20% 30% 40%
Services
Media & Entertainment
Telecom
Cement & Cement Products
Metals
Construction
Pharma
Consumer Goods
Automobile
IT
Energy
Financial Services
Sector Representation

7
Nifty 50 Index Performance
The above return does not factor in expenses. Returns from Axis Nifty ETF will be charged expenses.
Source of data: NSE Returns are compounded annualised. Inception Date: November 3, 1995
Performance as on 31st May, 2017. Past performance may or may not be sustained in future.
Performance 1 Year 3 Years 5 Years Since Inception
Nifty 50 Index 17.91 9.26 14.33 11.06
Nifty 50 - Last 5 years
14.3%
8
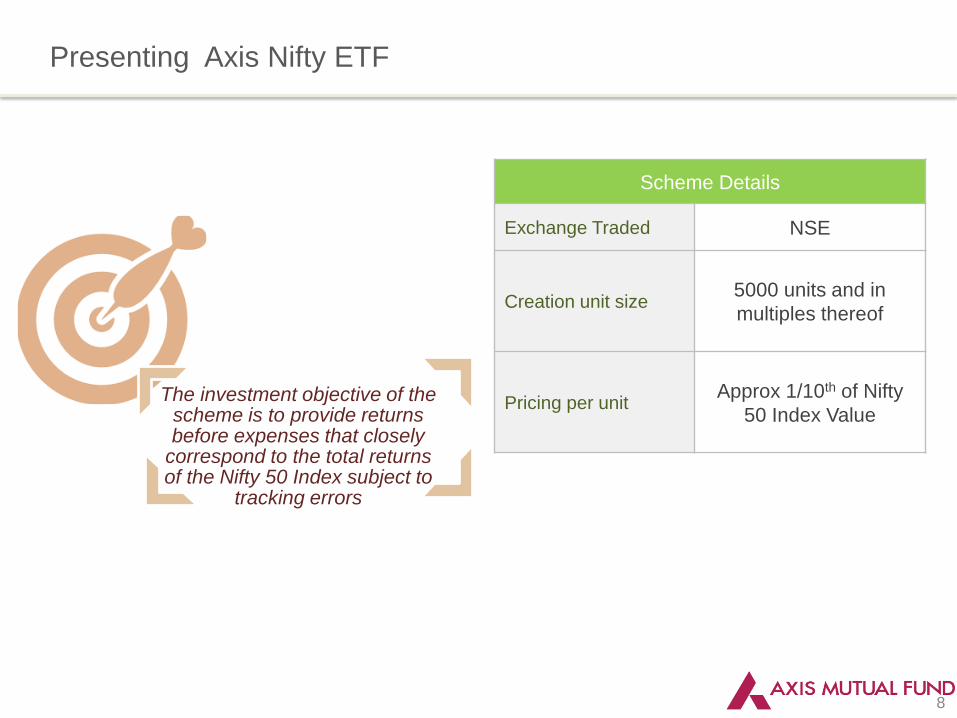
Presenting Axis Nifty ETF
The investment objective of the scheme is to provide returns before expenses that closely
correspond to the total returns of the Nifty 50 Index subject to
tracking errors
Scheme Details
Exchange Traded NSE
Creation unit size 5000 units and in
multiples thereof
Pricing per unit Approx 1/10th of Nifty
50 Index Value
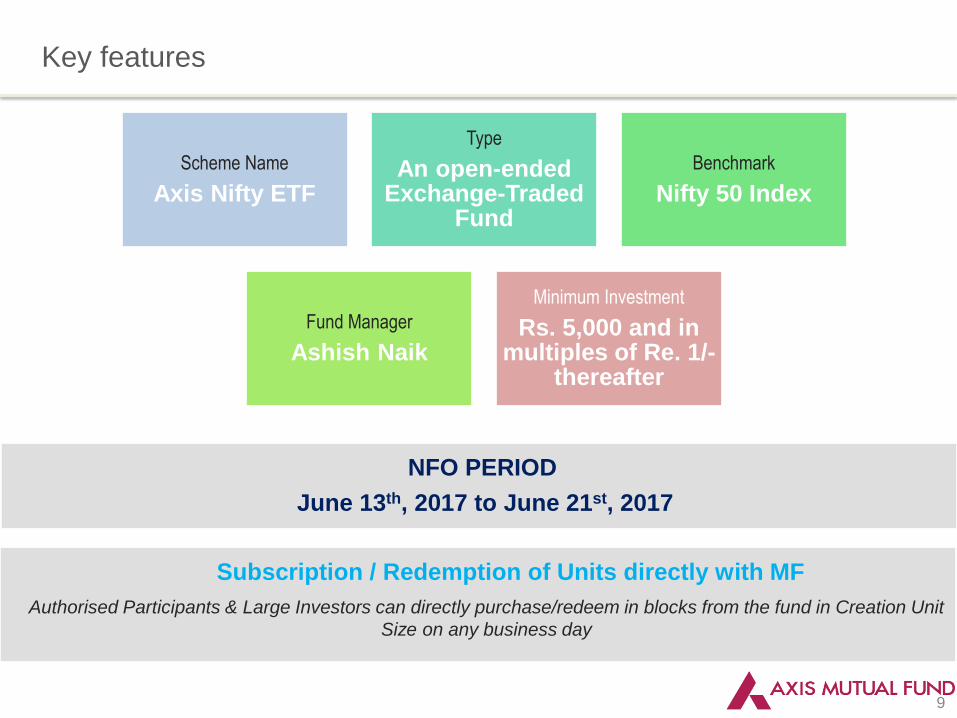
Key features
9
Scheme Name
Axis Nifty ETF
Type
An open-ended Exchange-Traded
Fund
Benchmark
Nifty 50 Index
Fund Manager
Ashish Naik
Minimum Investment
Rs. 5,000 and in multiples of Re. 1/-
thereafter
NFO PERIOD
Subscription / Redemption of Units directly with MF
Authorised Participants & Large Investors can directly purchase/redeem in blocks from the fund in Creation Unit
Size on any business day
June 13th, 2017 to June 21st, 2017

10
Is it the right time to invest in Nifty?

11
Potential for sharp acceleration in earnings over next few years
Source of data: Motilal Oswal,
Past performance may or may not be sustained in future.
0
100
200
300
400
500
600
700
FY
01
FY
02
FY
03
FY
04
FY
05
FY
06
FY
07
FY
08
FY
09
FY
10
FY
11
FY
12
FY
13
FY
14
FY
15
FY
16
FY
17
FY
18
E
FY
19
E
FY08-17: 4% CAGR
FY17-19E: 20% CAGR
6%
20%
20%
FY01-08: 21% CAGR
12
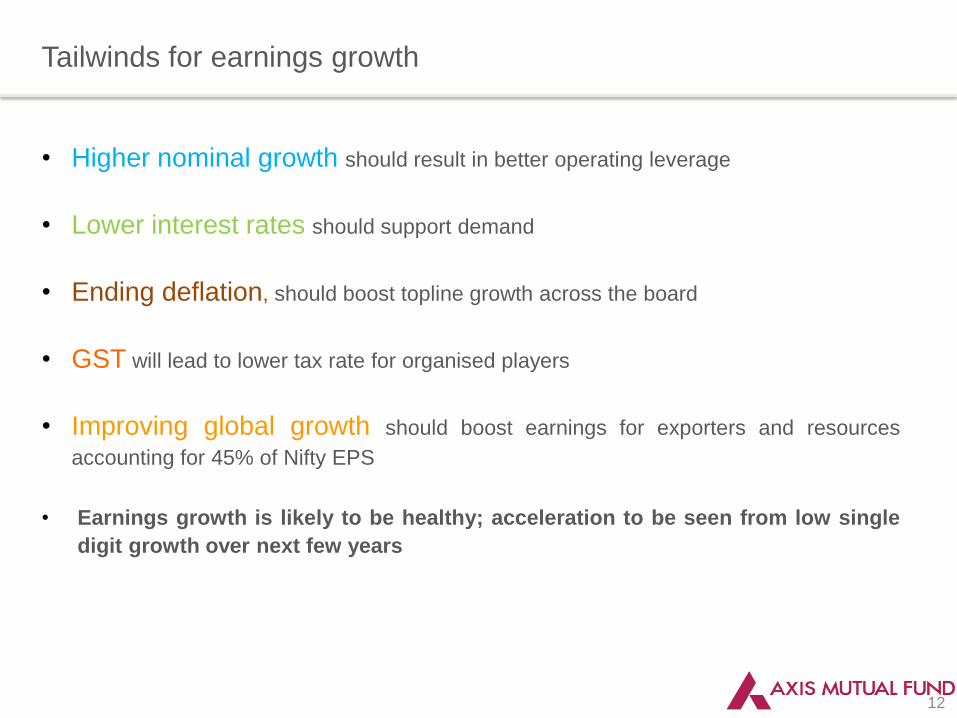
Tailwinds for earnings growth
• Higher nominal growth should result in better operating leverage
• Lower interest rates should support demand
• Ending deflation, should boost topline growth across the board
• GST will lead to lower tax rate for organised players
• Improving global growth should boost earnings for exporters and resources
accounting for 45% of Nifty EPS
• Earnings growth is likely to be healthy; acceleration to be seen from low single
digit growth over next few years
13
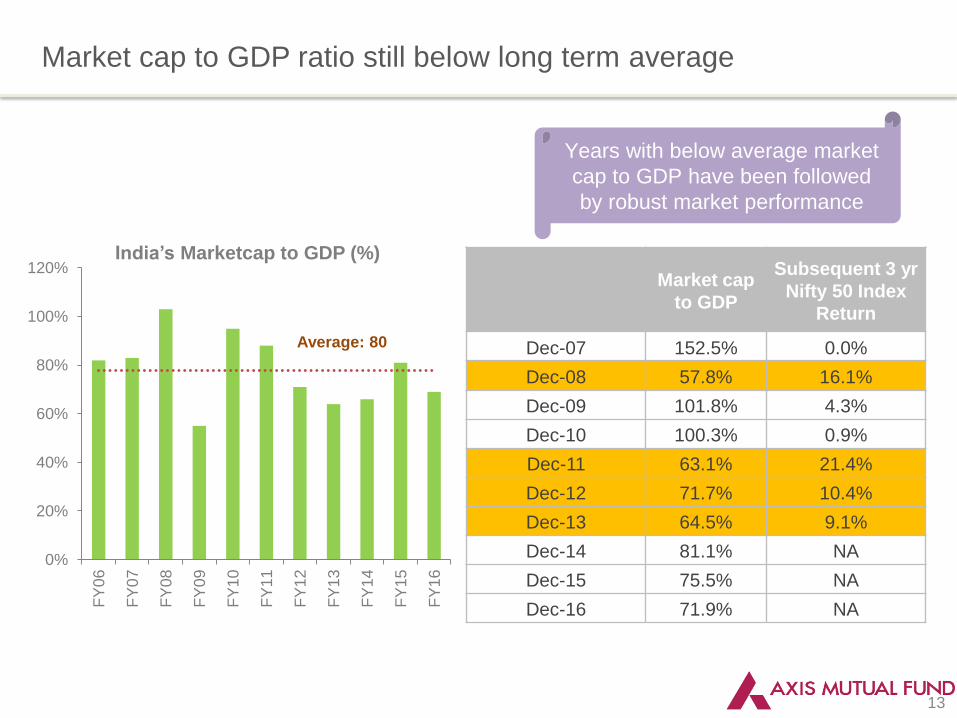
Market cap to GDP ratio still below long term average
Market cap
to GDP
Subsequent 3 yr
Nifty 50 Index
Return
Dec-07 152.5% 0.0%
Dec-08 57.8% 16.1%
Dec-09 101.8% 4.3%
Dec-10 100.3% 0.9%
Dec-11 63.1% 21.4%
Dec-12 71.7% 10.4%
Dec-13 64.5% 9.1%
Dec-14 81.1% NA
Dec-15 75.5% NA
Dec-16 71.9% NA
0%
20%
40%
60%
80%
100%
120%
FY
06
FY
07
FY
08
FY
09
FY
10
FY
11
FY
12
FY
13
FY
14
FY
15
FY
16
India’s Marketcap to GDP (%)
Average: 80
Years with below average market
cap to GDP have been followed
by robust market performance
14
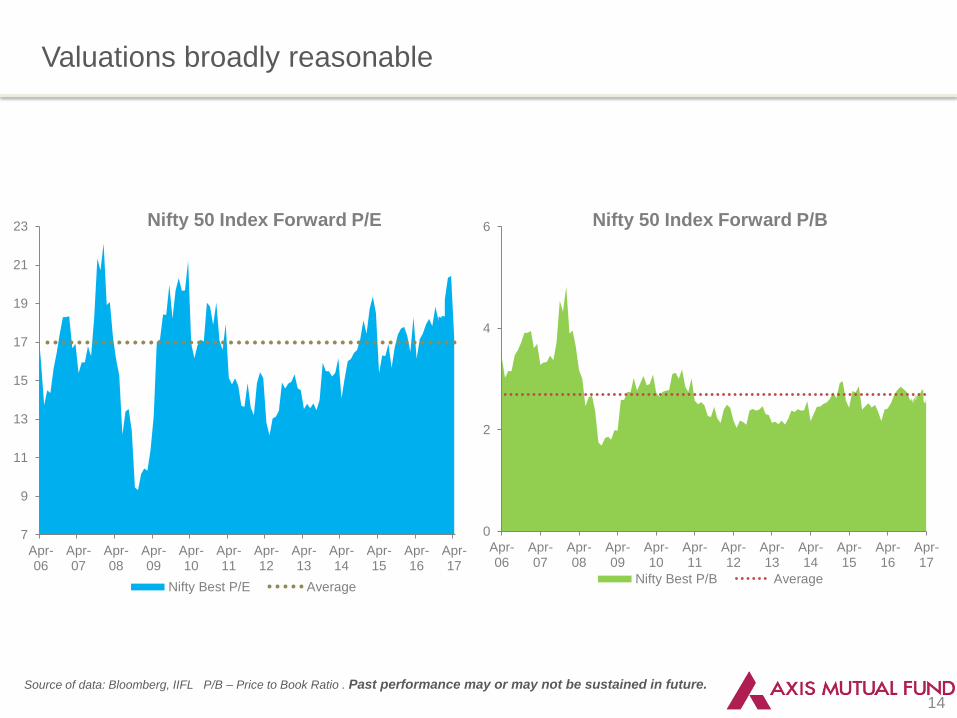
Valuations broadly reasonable
Source of data: Bloomberg, IIFL P/B – Price to Book Ratio . Past performance may or may not be sustained in future.
Nifty 50 Index Forward P/B
0
2
4
6
Apr-06
Apr-07
Apr-08
Apr-09
Apr-10
Apr-11
Apr-12
Apr-13
Apr-14
Apr-15
Apr-16
Apr-17
Nifty Best P/B Average
7
9
11
13
15
17
19
21
23
Apr-06
Apr-07
Apr-08
Apr-09
Apr-10
Apr-11
Apr-12
Apr-13
Apr-14
Apr-15
Apr-16
Apr-17
Nifty Best P/E Average
Nifty 50 Index Forward P/E
15
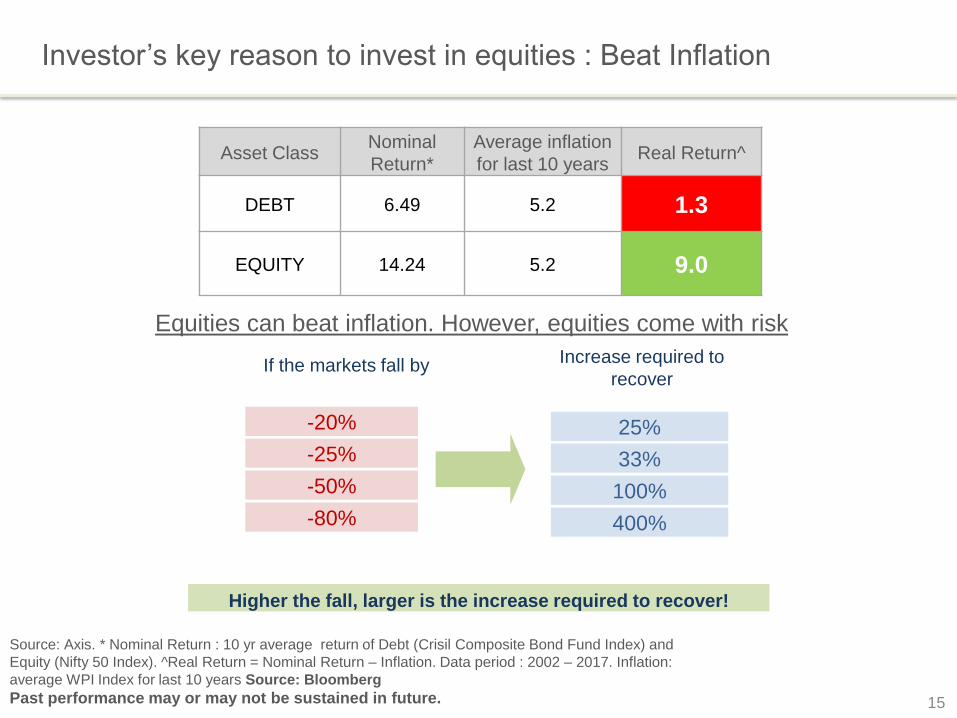
Investor’s key reason to invest in equities : Beat Inflation
Equities can beat inflation. However, equities come with risk
If the markets fall by Increase required to
recover
-20% 25%
-25% 33%
-50% 100%
-80% 400%
Higher the fall, larger is the increase required to recover!
Source: Axis. * Nominal Return : 10 yr average return of Debt (Crisil Composite Bond Fund Index) and
Equity (Nifty 50 Index). ^Real Return = Nominal Return – Inflation. Data period : 2002 – 2017. Inflation:
average WPI Index for last 10 years Source: Bloomberg
Past performance may or may not be sustained in future.
Asset Class Nominal
Return*
Average inflation
for last 10 years Real Return^
DEBT 6.49 5.2 1.3
EQUITY 14.24 5.2 9.0

16
Sideway markets provide an opportunity over the next few years
Range of 2 year
returns
Average subsequent
3 yr return
Average subsequent
5 yr return
<-5% 16.21% 14.65%
Between -5% to 0% 13.45% 12.03%
Between 0% to 5% 10.23% 10.19%
Between 5% to 10% 11.39% 9.91%
>10% 5.43% 6.12%
Source: MFI Explorer . Data period: Mar 1992 – Mar 2017. Above returns are for Nifty
50Index
Past performance may or may not be sustained in future.
0
2000
4000
6000
8000
10000
Jul-12 Jul-13 Jul-14 Jul-15 Jul-16
Nifty 50 Index
Equity markets have been range
bound in the last 2 years
Last 2 yr return of
Nifty 50 Index was
3.9%
17
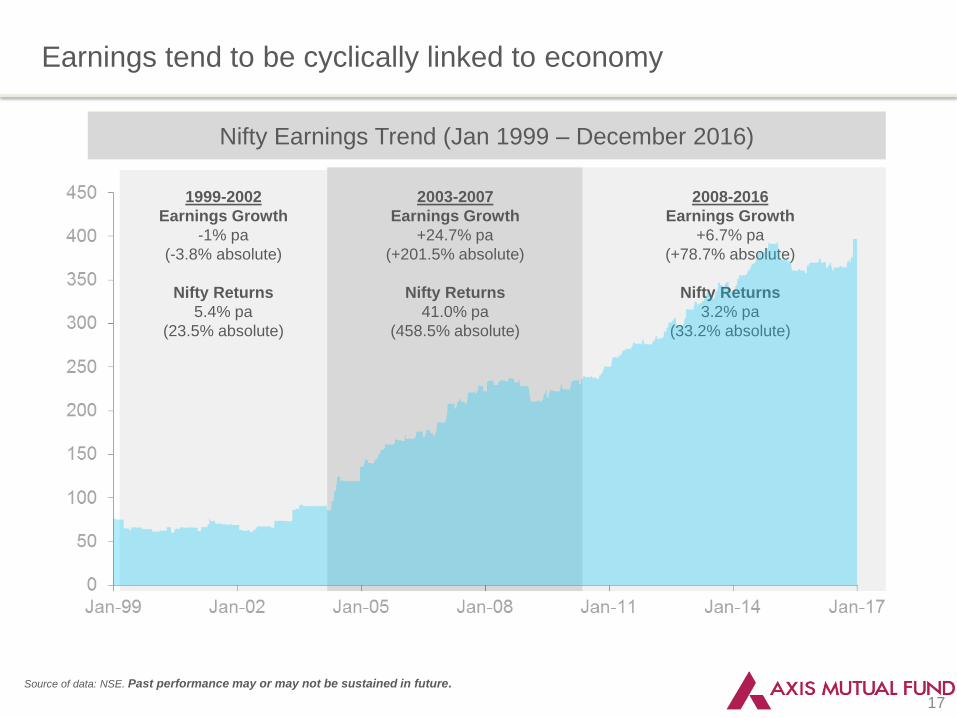
Earnings tend to be cyclically linked to economy
Source of data: NSE. Past performance may or may not be sustained in future.
Nifty Earnings Trend (Jan 1999 – December 2016)
1999-2002
Earnings Growth
-1% pa
(-3.8% absolute)
Nifty Returns
5.4% pa
(23.5% absolute)
2003-2007
Earnings Growth
+24.7% pa
(+201.5% absolute)
Nifty Returns
41.0% pa
(458.5% absolute)
2008-2016
Earnings Growth
+6.7% pa
(+78.7% absolute)
Nifty Returns
3.2% pa
(33.2% absolute)
18
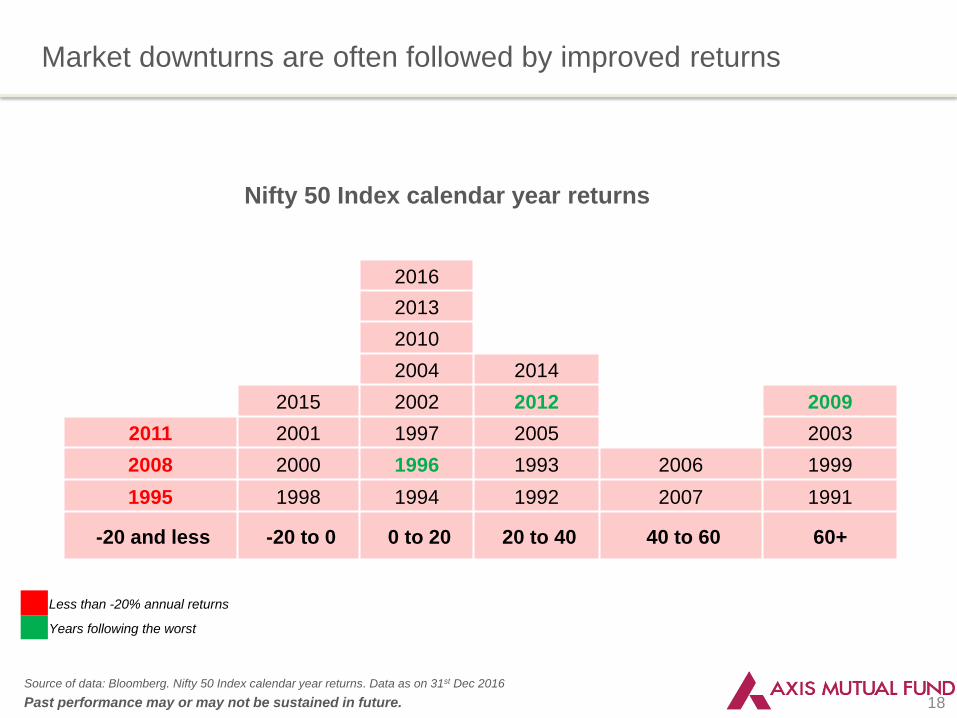
Market downturns are often followed by improved returns
Source of data: Bloomberg. Nifty 50 Index calendar year returns. Data as on 31st Dec 2016
Past performance may or may not be sustained in future.
2016
2013
2010
2004 2014
2015 2002 2012 2009
2011 2001 1997 2005 2003
2008 2000 1996 1993 2006 1999
1995 1998 1994 1992 2007 1991
-20 and less -20 to 0 0 to 20 20 to 40 40 to 60 60+
Less than -20% annual returns
Years following the worst
Nifty 50 Index calendar year returns
19
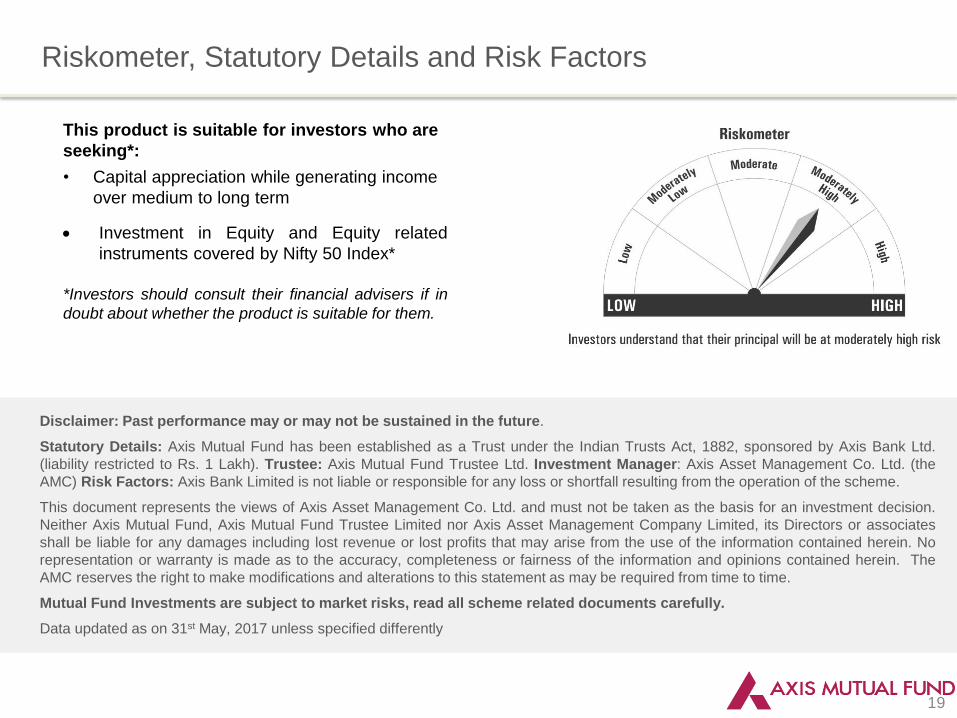
Riskometer, Statutory Details and Risk Factors
Disclaimer: Past performance may or may not be sustained in the future.
Statutory Details: Axis Mutual Fund has been established as a Trust under the Indian Trusts Act, 1882, sponsored by Axis Bank Ltd.
(liability restricted to Rs. 1 Lakh). Trustee: Axis Mutual Fund Trustee Ltd. Investment Manager: Axis Asset Management Co. Ltd. (the
AMC) Risk Factors: Axis Bank Limited is not liable or responsible for any loss or shortfall resulting from the operation of the scheme.
This document represents the views of Axis Asset Management Co. Ltd. and must not be taken as the basis for an investment decision.
Neither Axis Mutual Fund, Axis Mutual Fund Trustee Limited nor Axis Asset Management Company Limited, its Directors or associates
shall be liable for any damages including lost revenue or lost profits that may arise from the use of the information contained herein. No
representation or warranty is made as to the accuracy, completeness or fairness of the information and opinions contained herein. The
AMC reserves the right to make modifications and alterations to this statement as may be required from time to time.
Mutual Fund Investments are subject to market risks, read all scheme related documents carefully.
Data updated as on 31st May, 2017 unless specified differently
This product is suitable for investors who are
seeking*:
• Capital appreciation while generating income
over medium to long term
Investment in Equity and Equity related
instruments covered by Nifty 50 Index*
*Investors should consult their financial advisers if in
doubt about whether the product is suitable for them.