nextgen environmental sensing at the national arboretum
TRANSCRIPT

National Arboretum Phenomic Sensor Array (PESA)NextGen ecosystem monitoring
Tim Brown, PhD
Research Fellow, ARC Center of Excellence in Plant Energy Biology
Borevitz Lab, Australian National University
PESA ProjectCris Brack, Albert Van Dijk (Fenner school) Borevitz Lab (RSB, Plant Sciences)
In the next 100 years we will face challenges of unprecedented scale and complexity
• Massive Biodiversity loss (since 1500):
• ~30% decline in land animals; ~70% of invertebrates (insects, etc.) show >45% declines4
• > 90% of the world’s fish stocks are fully exploited or overexploited 6
• 11 billion people on the planet by 2100 1
• We must grow more food by 2100 than all the food produced in human history 2
• Global climate will warm by 4-6°C by 2100
• No one under the age of 24 has lived in a year when the earth was cooler than any time in the last 2,000 years
• 53% of Eucalyptus species will be out of their native ranges 21002
• Sea levels will rise by 0.5 – 1.1m3
1) Gerland, et al, 2014, [DOI:10.1126/science.1257469]; 2) “Seeds of Doubt” New Yorker, Aug 25, 20143) Hughes et al. Global Ecology and Biogeography Letters (1996): 23-29.4) “Climate Change Risks to Australia’s Coast”, 20095) Dirzo, Rodolfo, et al. 2014. DOI: 10.1126/science.12518176) http://worldoceanreview.com/en/wor-2/fisheries/state-of-fisheries-worldwide/ 2/20

The grand challenge of the 21st century
Sustain and create ecosystems that
• optimize benefit to other living things
• provide sustainable ecosystem services for humans
• in the face of over-population, resource scarcity, climate change and other major negative humans impacts
We no longer have the luxury of trusting low resolution ecological models
3/20

Traditionally field ecology has had very limited capacity
• Low spatial/time resolution data
• Limited sensors other than weather
• Sampling is manual; subjective
• Observations not-interoperable
• Limited data sharing
• Few standards
• Repeat experiments: often different sites;different observers; different methods
What % of data from the last century of ecology is available for reuse?
(even your own data)
4/20

Monitoring “Everything all the time”How to do improve field ecology datasets
1. Large, long-term regional-scale monitoring projects• TERN/Supersites; NEON, ICOS; FLUXNET, etc• Standardized high-quality data products for long periods of time• Force development of standard methods and data standards• Provide large, well-curated public datasets that we can all use
2. Data standards (more on this later)• If our data isn’t interoperable its utility is very limited
3. Capture higher complexity data• New technology is changing everything and will revolutionize how we
do ecology
5/20

The challenge
• Persistent 3D, multi data-layer ecosystem model
6/20

Lab Phenomics – Monitoring “everything all the time”
Genotype X Environment = Phenotypes (heritable traits)
Understanding how Phenotype, Environment and Genetics interact in plants requires:
• mm resolution 5-min timescale 3D models of each plant growing
• Multi/hyperspectral imaging
• Fluorescence scanning to measure photosynthesis
• Thermal scans (respiration, water use efficiency, etc)
• Control lighting and temperature to mimic real world growth conditions
Requires contrived environments
7/20

The real world is way more complex than plants in the lab
Don’t we need equally complex datasets and models to understand real world ecosystems?
• This hasn’t traditionally been possible
• The questions we ask are often defined more by what data we can get than by what the best question would be
• What questions would you ask if you had a 10-year high-resolution dataset of your field site?
8/20

“NextGen” monitoringWithin ten years we will have similar data to lab phenomics
• Automated time-series (weekly/daily) aerial (UAV) scans measure:• RGB; Hyperspectral; Thermal; (lidar?)• Centimeter resolution 3D model of every tree on field site
• Gigapixel imaging to track phenology in every tree/plant• Automated computer visions analysis for change detection
• LIDAR scanning• DWEL / Zebedee – high resolution 3D scans (ground based)• Dense point clouds of 3D structure
• Microclimate sensor networks• PAR• Temp, Humidity• Soil moisture @ multiple depths• mm resolution dendrometers
• Full genome for every tree on site (<$5/tree)
Environment
Phenotype
Genetics
9/20

New technology is changing everything
We should all aspire to build field sites that last 10,20,30 years
Looking back that far…
• 30 years ago was ~1980 (everything was analog)
• The first space shuttle (1981) 1MB of RAM1 (your phone has 2000x this)
• 4G is the same bandwidth that MODIS uses to download a full satellite image of the earth every day (MODIS: 6.1Mbps avg; Verizon 4G: 5-12Mbps 2,3)
• Even 20 years ago: no Web, WiFi, cell phones, Google anything
• 1.8 billion (mostly geolocated) images are uploaded to social media every day (4)
• Consider: 75% of cars may be self-driving by 20405 – continuously imaging, laser scanning and 3D modelling their immediate environment: 6.2 billion miles6 of roadside environments in US, imaged in 3D daily!
1.http://www.popsci.com/node/31716
2.http://modis.gsfc.nasa.gov/about/specifications.php
3.https://www.lte.vzw.com/AboutLTE/VerizonWirelessLTENetwork/tabid/6003/Default.aspx
4. Meeker, 2014
5.http://www.ieee.org/about/news/2012/5september_2_2012.html
6.http://www.fhwa.dot.gov/policyinformation/travel_monitoring/13dectvt/figure1.cfm 10/20

National Arboretum Phenomic & Environmental Sensor Array
ANU Major Equipment Grant, 2014
Collaboration with Cris Brack, Albert Van Dijk (Fenner school) and Borevitz Lab
11/20

National Arboretum Phenomic & Environmental Sensor Array
• Ideal location• 5km from ANU (64 Mbps wifi)
• Many institutions close by• ANU, CSIRO, U. Canberra , etc
• Brand new forest to monitor from birth into the future
• Great test site for “NextGen” monitoring prior to more remote deployment
12/20

National Arboretum Sensor Array
• 20-node Wireless mesh sensor network (Temp, Hum, PAR, Soil T/M)
• High resolution dendrometers on 20 trees
• Two Gigapixel timelapse cameras: • Leaf/growth phenology for > 1,000 trees
• Campbell weather stations (baseline data for verification)
• All data live online in realtime
• LIDAR: DWEL / Zebedee
• UAV overflights (bi-weekly/monthly) • Georectified Google Earth/GIS image layers• High resolution DEM• 3D point cloud of site in time-series
Total Cost ~$200K13/20

(Single 15MP image)
Area: ~7ha
Area: ~1m2
The Gigapan and
Gigavision systems
allow you to capture
hundreds or
thousands of
zoomed-in images in
a panorama.
Images are then
“Stitched” into a
seamless panorama.
The super-high
resolution of the final
panorama lets you
monitor huge
landscape areas in
great detail.
Gigapixel Imaging – How it works
14/20
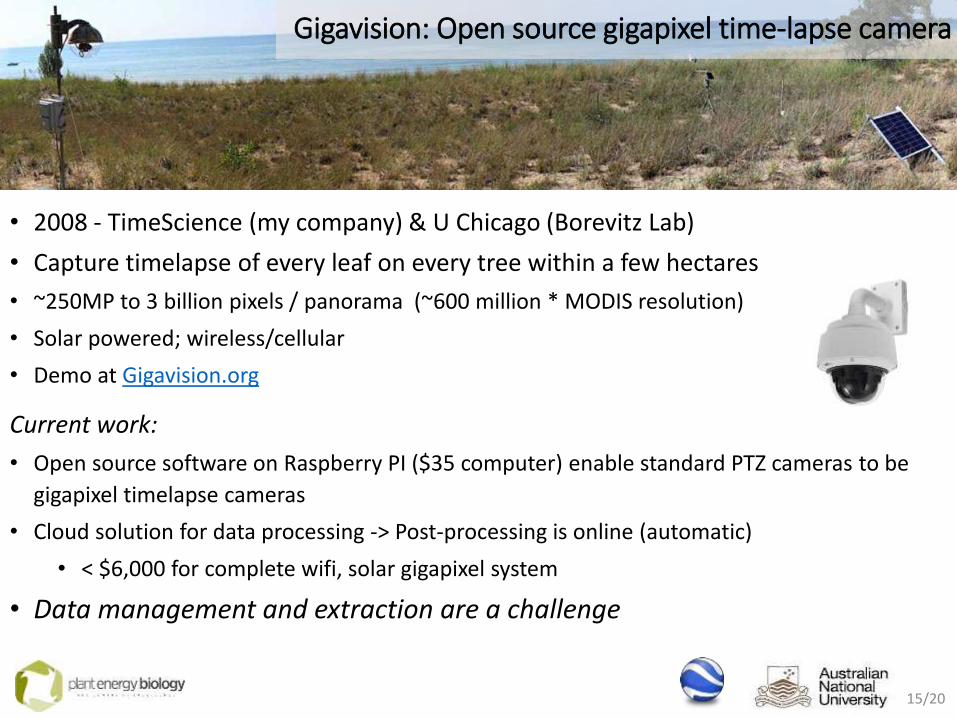
Gigavision: Open source gigapixel time-lapse camera
• 2008 - TimeScience (my company) & U Chicago (Borevitz Lab)
• Capture timelapse of every leaf on every tree within a few hectares
• ~250MP to 3 billion pixels / panorama (~600 million * MODIS resolution)
• Solar powered; wireless/cellular
• Demo at Gigavision.org
Current work:
• Open source software on Raspberry PI ($35 computer) enable standard PTZ cameras to be
gigapixel timelapse cameras
• Cloud solution for data processing -> Post-processing is online (automatic)
• < $6,000 for complete wifi, solar gigapixel system
• Data management and extraction are a challenge
15/20

Unmanned Aerial Systems (UAV/UAS)
• This is the future of ecosystem monitoring!
• Tech is very new and changing at light speed• Getting much easier & cheaper VERY quickly
• Current regs are restrictive
• But anyone can get started now for ~$1,000
Gatewing (Trimble), ~$90,000Sensefly.com, ~$25KDroidworx Hexacopter~$5K AUD
Pocket Drone: $45020min flight timeGoPro MountControl with tablet
DJI Phantom Vision 2+$1,500 AUDVERY easy autopilot control viaPix4D and DJI phone apps
16/20

UAV’s for monitoring
• $1,6000 AUD – Hardware (DJI Phantom V2+)• 12MP (lower quality) camera
• Better: Droidworx or similar (~$5,000) w/ 20MP digital camera
• $1,800 AUD – Pix4D Software (non-commercial license)• 3D models of field site (cm resolutions are possible)
• Orthorectified image and map layers
• LAS / point cloud data
17/20

So what do we do with all this data?
The challenge is no longer to gather the data, the challenge is how we do science with the data once we have it
• A sample is no longer a data point
• Example: Gigavision dataFrom Sample:• Camera hardware: 1200 images (per hour)• Automate stitching into panoramas (5,000 tiles images / pano /hr)• Need to align time-series images to each other and to the real
world (despite hardware failures, camera upgrades)• How to visualize a time-series of 22 million images/year?• Computer vision analysis
• Automated feature detection and phenophase detections
To Data:• “Phenophase” transition and growth data from 1,000 trees• And then how do you even analyze that?!
18/20

Big data doesn’t work without data standards
• Data management and synthesis is essential to doing science in the 21st century
• New technology lets us measure the world in unprecedented detail but it creates so much data we have to organize it better
• Data standards allow us to share and collaborate with our data is ways never before possible
• How will people access your data?
• When you publish a paper, it should have a DOI with a link to the code you used and the data you analyzed
• Aspire to: Readers can redo your analysis on their desktops
19/20

Summary / Goals
• What questions can our collective data help answer?
• Coverage• What are we monitoring well now? • What are the gaps?
• Sensors/ data types• Spatial coverage• Data availability / incompatibility
• Data standards• What are the barriers to sharing data and what can we do to facilitate
data sharing?
• New technology will completely change the resolution at which we can monitor the environment
• What questions would you ask/answer if you could know anything from you field site back for a decade?
• What new tools do we need to do science with these new data types?
20/20

Thanks and Contacts
• Funding: ANU Major Equipment Grant
• Cris Brack, Albert VanDijk, Justin Borevitz (PESA Project PI’s)
• Project web page• http://bit.ly/PESA2014
• Collaborators• UAV data: Darrell Burkey, ProUAV
• 3D site modelling: Pix4D.com
• Dendrometers & site infrastructure• Darius Culvenor: Environmental Sensing Systems
• Mesh sensors: EnviroStatus, Alberta, CA
Contact me: [email protected]
21/20