next level stage 3, capital markets day,...
TRANSCRIPT

NEXT LEVEL STAGE 3, CAPITA L MARKETS DAY, OCTOBER 4, 2016
Committed to unlocking value
Eric Elzvik, CFO

October 4, 2016
©ABB
Slide 2
—
Agenda
Next Level Stage 1 and 2 – delivered
Current market environment
Next Level Stage 3 – committed to unlocking value

October 4, 2016
©ABB
Slide 3
—
1Includes cash returns to shareholders as dividends and under the share buyback program
Next Level transformationStrong operational momentum
Committed
to unlocking
value
Next Level Stage 1
Next Level Stage 2
Next Level Stage 3
Productivity and cost savings programs delivering
Shifting focus from EBITDA to earnings per share
Improved capital efficiency; strong Free Cash Flow (FCF) conversion
Managing an efficient balance sheet
Returned $8.7 bn1 to shareholders from 2014 to today

October 4, 2016
©ABB
Slide 4
—
1Calculation: sum of cash dividends paid and share buyback in respective year divided by the market capitalization at the beginning of the year
Business transformation deliveringDriving margin accretion and mid-teens cash return on investment
7 consecutive quarters of margin improvementOperating EBITA margin, %
Cash return on invested capital (CROI)
Leading and consistent FCF generation Leading cash return rate1 to shareholders 2013-2016YTD
Average annual cash return (dividend and share buyback, % of market cap)
Margin in same quarter, one year earlier
2014 2015 2016
12.7%13.4%
15.1%
FCF, % revenue (4Q rolling)
Competitor A 12%
ABB 11%
Competitor B 11%
Competitor C 7%
FCF, $ bn (4Q rolling)
4.04.14.1
5.15.45.55.6ABB
Competitor ACompetitor BCompetitor CCompetitor DCompetitor ECompetitor F
11.1% 11.1%11.7%
12.5%11.7% 12.0% 12.7%
Q4 Q1 Q2 Q3 Q4 Q1 Q2
2.5
3.5+33%
2014 2015 2016
2014 2015 H1 2016

October 4, 2016
©ABB
Slide 5
—
1Average annual revenue growth on a like-for-like basis over 6 years, base year 2014; 2Target is on a full-year basis; 3CAGR = Compound annual growth rate, base year is 2014 and assuming constant exchange rates; 4Temporary reduction possible in the event of larger acquisitions
Improving operational performance in a challenging marketStatus 2015 – 2020 financial targets
Status as of June 2016 unless otherwise stated
Group
Revenue growth1 3 – 6% 0%
Operational EBITA %2 (H1 2016) 11 – 16% 12.3%
Operational EPS growth CAGR3 10 – 15% 7%
FCF conversion to net income >90% 220%
CROI %4 Mid-teens 15.1%

October 4, 2016
©ABB
Slide 6
—
1Including automotive, food & beverage, machinery
Short term market conditions
Pioneering technology
Utilities Industry Transport & Infrastructure
Globally
T&D: positive fundamental drivers, policy support intact
Solar and Wind: 5%+ growth
Conventional Power: fewer coal capacity additions, gas stable
Discrete & hybrid industries1: investment remains positive
Oil & Gas: decline in upstream capex, downstream stable
Mining & metals: persistent overcapacity, bulk metal capacity clean-up
Transportation: rail growing, specialty ships strong, cargo challenged
Construction: solid, broad-based growth
China: growth in T&D, robotics and general industry, continued slowing in process
India: strong growth across multiple sectors
Middle East: persistent challenges, Saudi Arabia in particular
US: considerable investment delay due to elections, consumer growing, industrials lagging
Canada: infrastructure steady, mining and O&G difficult
Brazil: O&G continues to decline, other industries bottoming
Northern & Central Europe: moderate growth overall, uncertainty in UK
Southern Europe: mixed, strong growth in Spain, Italy slow, Turkey affected by political events
Africa, Middle East and Asia Americas Europe

October 4, 2016
©ABB
Slide 7
—
1PIE: Penetration, Innovation, Expansion; Note: 2016 – 2020 forecast; Source: Bloomberg, Rystad, IMS, AME and others
Mid-long term drivers remain intactDriving investment into high growth markets
Utilities Industry Transport & Infrastructure
14 61 25
Fast growth Growth Decline
Growth
Driving PIE1 and growth initiatives
1,000 day programs, e.g. F&B
(Re-) allocation of resources
Expansion in digital
Decline
Expansion of strongholds
Adjustment of capacity
Aligning footprint
Aligning with market outlook
Conventional power
generation
Renew-ables
Transmission & distribution grid
O&G up-/mid-stream
O&G down-
stream, chemicals
Mining MetalOther
processHybrid & discrete
BuildingsData
centersMarine Rail

October 4, 2016
©ABB
Slide 8
—
Proven cost-out programs (OpEx, SCM)
Safeguard profitability
White CollarProductivity program
Drive margin accretion
Net Working Capital program
Enhance capital efficiency
Active portfolio management
Transform business portfolio
Building momentum to achieve double digit operational earnings per share growth
On track

October 4, 2016
©ABB
Slide 9
—
2016 White Collar Productivity savings ahead of plan
2016 WCP program savings1 Major achievements, examples
Sales: process simplification in 16 countries
GBS already servicing 24 countries
Simplified organization: 30% reduction of managerial layers
White collar employees reduced by 8%2
(White Collar Productivity & capacity adjustments)
Greater than 50% bottom-line impact
1Gross cost savings; 2Since 2014
Lean business functions
GBS & support functions
Market-oriented complexity reduction
24%
23%
54%
$400 mn
$550 mn +
2016 new estimate
2016 target

October 4, 2016
©ABB
Slide 10
—
1Combined total restructuring and White Collar Productivity implementation costs
White Collar Productivity commitment increased by 30% to $1.3 bn
Targeting more for the same cost1 over the same period
White Collar Productivity target gross cost savings
$1 bn
New target2014 – 17
$1.3 bn
Initial target2014 – 17
Target +30%
Timeline unchanged
Total costs unchanged
Run rate progress to date

October 4, 2016
©ABB
Slide 11
—
1Q2 2015 to Q2 2016; 2NWC as percentage of revenues improved for all divisions between Q2 2014 and Q2 2016
Solid execution of Net Working Capital management
Accelerated Net Working Capital reduction as a % of revenues Major achievements to date
~200 bps reduction in net working capital as % of revenues
~$800 mn cash generation from working capital improvement since Q2 20151
with highest reduction in inventories and unbilled receivables
Sustainable value chain optimization
Improvement in all divisions2
15
14
13
19
18
17
16
10
11
12
Q1 Q2 Q3 Q4
2014
2015
2016

October 4, 2016
©ABB
Slide 12
—
1Peer group of 9 companies
Confirming Net Working Capital target of $2 bn reduction by 2017
ABB moving swiftly towards top-quartile performance
Net Working Capital, % of revenue at December 31
Range of comparable peer group1
ABB
5
10
15
20
2014 2015 2016 2017
Max.
ABB
Min.
Average
top-quartile
Further potential
Improve front-end sales and service inventory
Enhance sales and operations planning
Optimize receivables and payables management
Applying advanced applications and analytics

October 4, 2016
©ABB
Slide 13
—
Continuing to drive active portfolio management
Target: higher growth, better margins, lower risk, better cash returns
Outcome
Strengthen
Fix / restructure
Refocus / divest
Partner / acquire
Portfolio relevance
Financial performance
− Market attractiveness
− Competitive position
− Offering
− Portfolio relevance
− Center of gravity
− Gap in current portfolio
− Revenue growth
− Op. EBITA margin
− CROI
high
low
high
Illustrative

October 4, 2016
©ABB
Slide 14
—
Delivery set to continueConcrete plan in place
Accelerating growthPosition business to move into target range
Proven cost-out programs 3 – 5%
White Collar Productivity program
Active portfolio management
Drive 40 – 60 bps of op. EBITA margin accretion p.a.
Net Working Capital programEnhance business efficiencies
Improve cash returns
Double
digit earnings
growth

October 4, 2016
©ABB
Slide 15
—
Confirming Group targets 2015 – 2020 Increased operational EBITA margin corridor for Power Grids
Group
Revenue growth1 3 – 6%
Operational EBITA %2 11 – 16%
Operational EPS CAGR3 10 – 15%
FCF conversion to net income
>90%
CROI %4 Mid-teens
Divisions
ElectrificationProducts 15 – 19%
Robotics and Motion 14 – 19%
Industrial Automation 11 – 15%
Power Grids New 10 – 14%5
1Average annual revenue growth on a comparable basis over 6 years, base year 2014; 2Target is on a full-year basis; 3CAGR = Compound annual growth rate, base year is 2014 and assuming constant exchange rates; 4Temporary reduction possible in the event of larger acquisitions; 5Margin target of Power Grids will be in effect as of January 1, 2018; previous target 8 – 12%

October 4, 2016
©ABB
Slide 16
—
Strong cash generation allows for significant deployment Capital allocation priorities unchanged
ABB’s strong cash generation, Free Cash Flow, $ bn Capital allocation priorities
Fund organic growth, R&D, capex at attractive CROI
Steadily rising sustainable dividend
Value-creating acquisitions
Returning additional cash to shareholders
3
2.9
2.6
2020E
2015
2014
2013

October 4, 2016
©ABB
Slide 17
—
Capturing additional opportunities through acquisitionsDisciplined, clear strategic direction, proven criteria
Logic Criteria
Accelerating profitable growth
Impactful and value creating
Complementary strengths
Cultural fit
Integration capabilities available
Financial criteria
– Return > WACC by end of year 3
– IRR > WACC plus specific hurdles
– Retain “A” credit rating
– EPS-accretive
Products
Software &
Services
Po
we
r Grid
s
Ind
us
trial
Au
tom
atio
n
Ro
bo
tics
an
dM
otio
n
Ele
ctrific
atio
n
Pro
du
cts
Backward integration of strategic components
Product gaps
Design / engineering
Analytics / optimization
Engineering / consulting
Regional coverage

October 4, 2016
©ABB
Slide 18
—
1Planned
Continued commitment to deliver shareholder returns$3 bn share buyback program planned 2017 – 2019
Second buyback program
Solid future performance and cash generation
In line with capital allocation priorities and cash flow generation
Managing ABB with an efficient balance sheet and retain “A” credit rating
Shareholders participate in strong cash generation, $ bn
2014 – 16 2017 – 19 2017 – 20
DividendsShare buyback
Share buyback1
TotalDividends
3.5
5.2
3.0

October 4, 2016
©ABB
Slide 19
—
Next Level stage 3 – committed to unlocking value
Attractive shareholder returns
Profit
Gro
wth
mo
me
ntu
m
Accelerate growth including digital
Margin accretion through cost
savings
Actively manage portfolio
Performance management in line
with entrepreneurship
10 – 15% p.a.
operational
EPS growth
Mid-teen cash
return on
invested
capital
Maintain strong free cash flow conversion
Deliver on working capital program
Today
Future

October 4, 2016
©ABB
Slide 20
—
Why own ABB
Committed to unlocking value
Strong positions in attractive markets
Pioneering technology leader
Efficient balance sheet; generating attractive returns for shareholders
Clear transformation agenda driving operational EPS and CROI

October 4, 2016
©ABB
Slide 21
—
October 4, 2016
©ABB
Slide 22
—
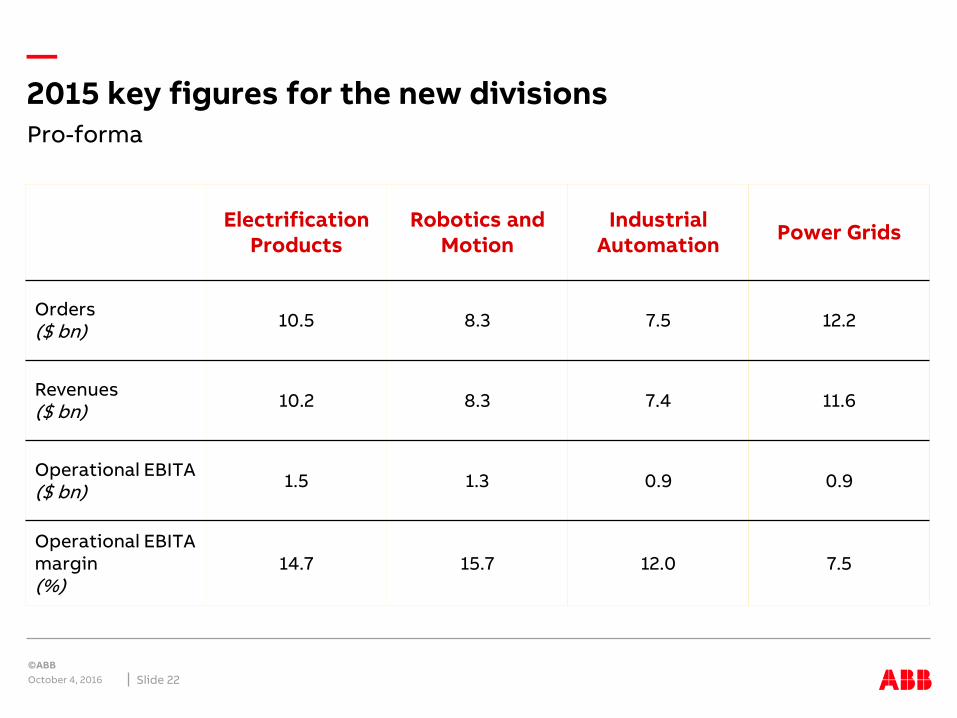
2015 key figures for the new divisionsPro-forma
ElectrificationProducts
Robotics and Motion
Industrial Automation
Power Grids
Orders($ bn)
10.5 8.3 7.5 12.2
Revenues($ bn)
10.2 8.3 7.4 11.6
Operational EBITA($ bn)
1.5 1.3 0.9 0.9
Operational EBITA margin(%)
14.7 15.7 12.0 7.5

October 4, 2016
©ABB
Slide 23
—
$ mn unless otherwise stated
Total 2015 2016 2017
Cost
Restructuring and related expenses + program implementation1
1,200-1,250 420 450-490 290-330
1’000 day program White Collar ProductivityFinancial impacts of program
$ mn unless otherwise stated
Run-rate at theend of 2017
2015 2016 2017 2018
Gross savings (run rate)
~1,300
Gross savings (incremental y-o-y)
~25 >550 450 300
1Non-operational; 2Restructuring and implementation