next: cell division and cancer. cb 5.25 genes are the parts of dna that contain information. protein
TRANSCRIPT

Next: Cell Division and Cancer

CB 5.25
Genes are the parts of DNA that contain information.
Protein

For life to exist, the information (genes) must be passed on.
{Mitosis:producing more cells}
{Meiosis:producing gametes}
CB 13.5

Mitosis

Mitosis plays a role in:• Growth and Development
• Repair and Turnover of Cells
• Reproduction
–Asexual

The Cell Cycle
[DNA Replication]
CB 12.5
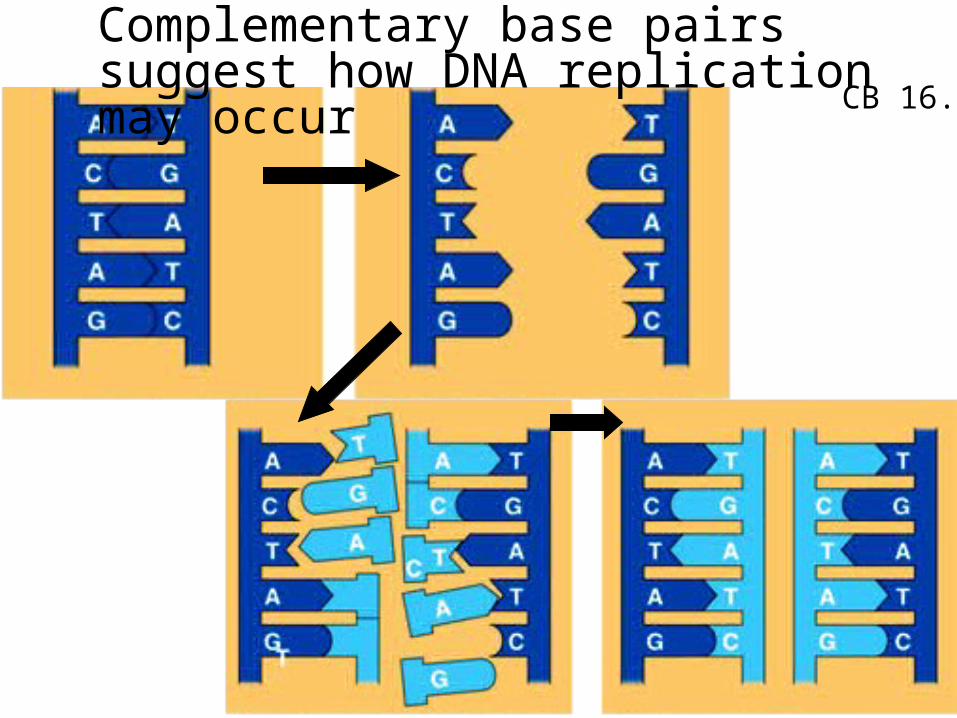
Complementary base pairs suggest how DNA replication may occur
CB 16.9

DNA replication: each strand serves as a template for making a complementary copy
O.R.
Origin of Replication
CB16.12b

O.R.
DNA replication: each strand serves as a template for making a complementary copy
CB16.12b

The two strands of DNA are unwound.
DNA replication: each strand serves as a template for making a complementary copy
CB16.12b

The DNA is copiedby DNA polymerase (a protein).
DNA replication: each strand serves as a template for making a complementary copy
CB16.12b

More unwinding, more copying
DNA replication: each strand serves as a template for making a complementary copy
CB16.12b

The DNA has now been copied. There are now two double-stranded DNAs
DNA replication: each strand serves as a template for making a complementary copy
CB16.12b

Most DNA has multiple origins of replication
CB16.12b

DNA replication:each strand serves as a template for producing a complementary copy
CB 5.28

Sometimes errors are made.

Luckily, errors can be repaired.
Error

DNA Repair
CB 16.18
Damage or replication error
Mismatch removed by enzymes
DNA replaced
Repair complete


Is recognized as NEW and mismatches are repaired

Not all errors get repaired.These are mutations.

3,000,000,000 (3 billion) base pairs/human cellwith1 error/1 billion base pairs not repaired= (average)~6 errors each time DNA is replicated
Errors are made during DNA replication

Only mutations in gametes will be passed on.

Mutations can be lethal, or can lead to cancer.

Cancer: Cell Division Gone Wrong

Cell division is regulated by bothpositive and negative signals.
Positive signals start the processof cell division.
Negative signals inhibit cell division.

CB 12.14
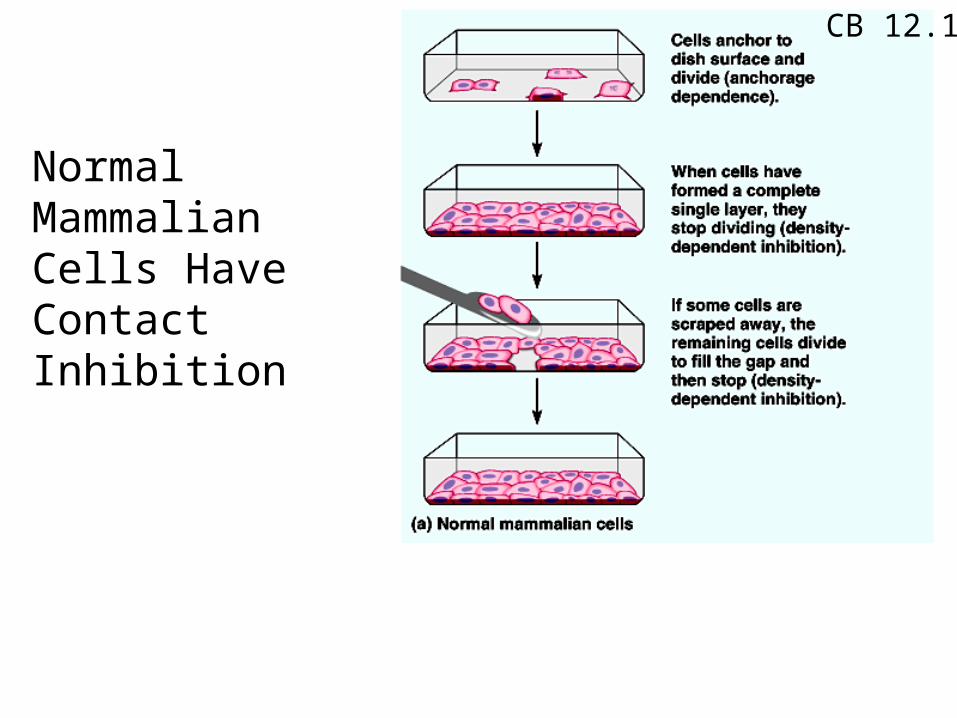
Normal Mammalian Cells Have Contact Inhibition
CB 12.19
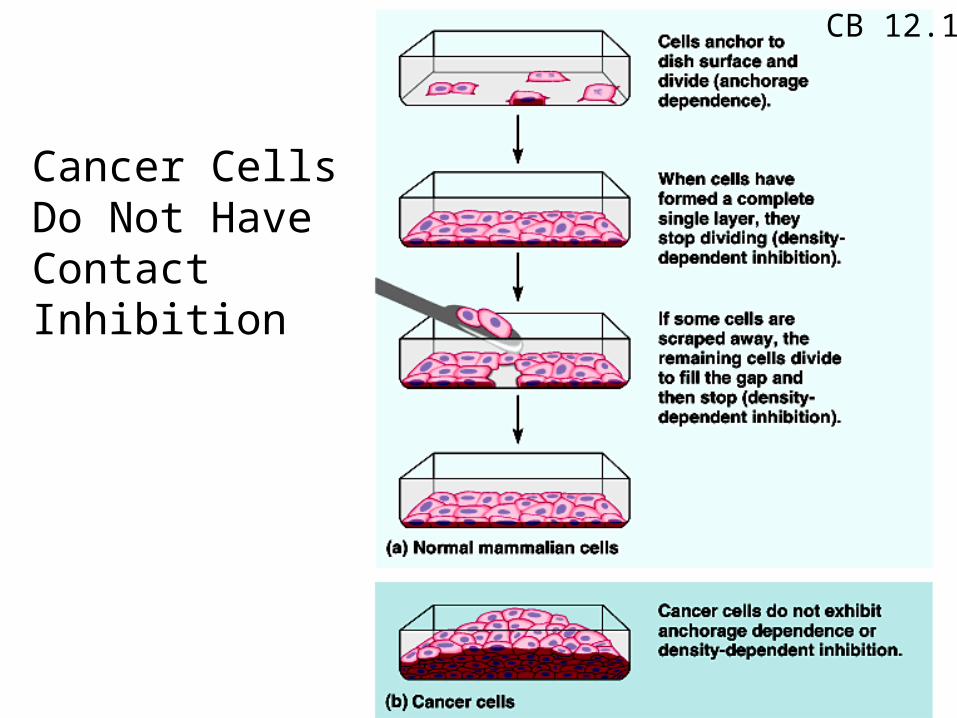
Cancer Cells Do Not Have Contact Inhibition
CB 12.19

Cancer:
• is the loss of control over cell division.
• Tumors are normal cells that are dividing inappropriately.
– They stop performing their “normal” function, and are dividing repeatedly.

Tumors in a Livernormal
tumors

Cancer Cells
Normal Cells

A cell becomes cancerous when there are incorrect positive AND negative
signals.

Multiple mutations are required for a single cell to become cancerous.
CB18.22

GO! STOP!
cancer
CB18.21
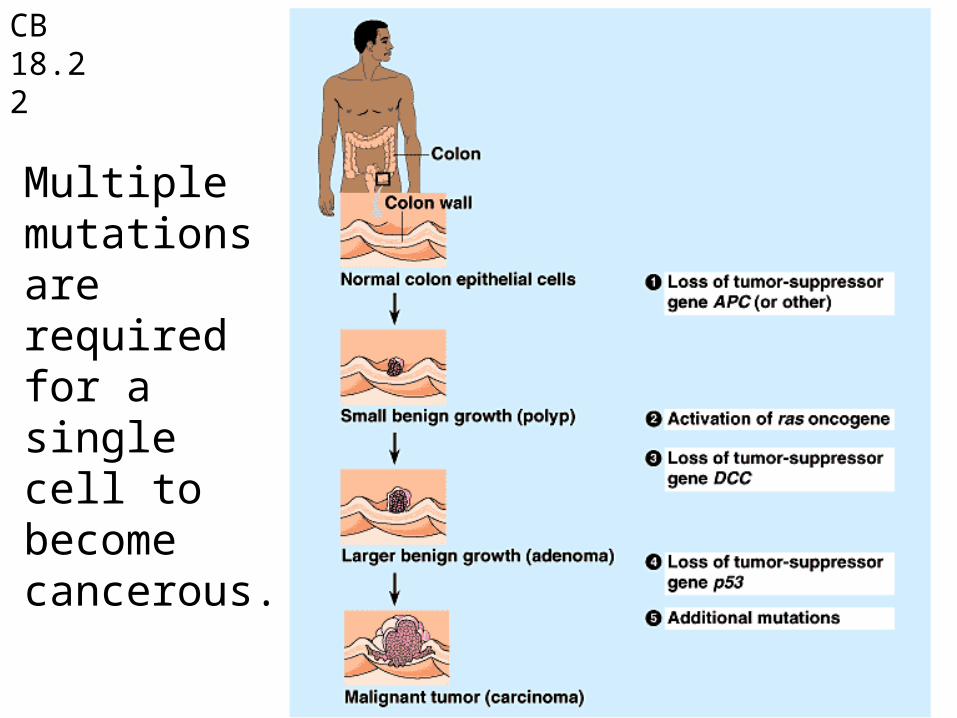
Multiple mutations are required for a single cell to become cancerous.
CB18.22

Benign versus Malignant cancer CB12.20
Image from: www.utm.utoronto.ca/~w3bio315/lecture22.htm

How do these mutations arise?
CB18.22

Causes of mutations:
• Replication errors– Exacerbated by poor DNA repair
• Genetic predispositions for poor repair or already having some mutations


Causes of mutations:
• Replication errors– Exacerbated by poor DNA repair
• Other biological agents– Viruses– Transposons

Causes of mutations:
• Replication errors– Exacerbated by poor DNA repair
• Other biological agents– Viruses– Transposons
• Environmental factors– Ultraviolet light– Mutagenic chemicals
• smoking, industrial waste, natural toxins

Environment plays a large role in the chance of contracting cancer…
The multiethnic cohort study: exploring genes, lifestyle and cancer risk. L Kolonel, D Altshuler, B Henderson (July 2004) Nature Reviews Cancer 4, 519-527 Fig 1

Causes of mutations:
• Replication errors– Exacerbated by poor DNA repair
• Other biological agents– Viruses– Transposons
• Environmental factors– Ultraviolet light– Mutagenic chemicals
• smoking, industrial waste, natural toxins

Source: Centers for Disease Control and Prevention: http://www.cdc.gov/nchs/fastats/deaths.htm.
U.S. Mortality, 2007Rank Cause # deaths %
1. Heart disease 616,067 33.4
2. Cancer 562,875 30.5
3. Stroke 135,952 7.4
4. Respiratory diseases 127,924 6.9
5. Accidents 123,706 6.7
6. Alzheimer's disease 74,632 4.0
7. Diabetes 71,382 3.9
8. Influenza and Pneumonia 52,717 2.9
9. Kidney disease 46,448 2.5
10. Septicemia 34,828 1.9

Change in the US Death Rates* by Cause, 1950 & 2000
* Age-adjusted to the 2000 US standard population.Source: US Mortality Volume 1950, National Vital Statistics Report, 2002, Vol. 50, No. 15.
586.8
180.5
48.160.923.7
200.9193.7
258.2
0
100
200
300
400
500
600
HeartDiseases
Stroke Pneumonia/Influenza
Cancer
1950
2000
Rate Per 100,000
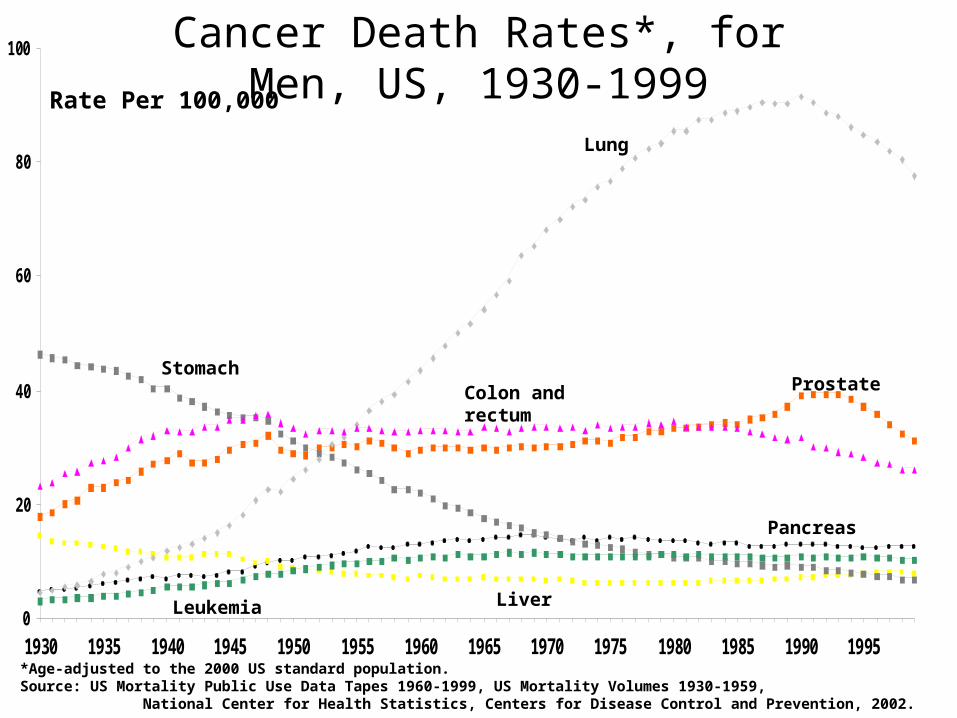
Cancer Death Rates*, for Men, US, 1930-1999
*Age-adjusted to the 2000 US standard population.Source: US Mortality Public Use Data Tapes 1960-1999, US Mortality Volumes 1930-1959, National Center for Health Statistics, Centers for Disease Control and Prevention, 2002.
0
20
40
60
80
100
1930 1935 1940 1945 1950 1955 1960 1965 1970 1975 1980 1985 1990 1995
Lung
Colon and rectum
Prostate
Pancreas
Stomach
Liver
Rate Per 100,000
Leukemia

Cancer Death Rates*, for Women, US, 1930-1999
*Age-adjusted to the 2000 US standard population.Source: US Mortality Public Use Data Tapes 1960-1999, US Mortality Volumes 1930-1959, National Center for Health Statistics, Centers for Disease Control and Prevention, 2002.
0
20
40
60
80
100
1930 1935 1940 1945 1950 1955 1960 1965 1970 1975 1980 1985 1990 1995
Lung
Colon and rectum
Uterus
Stomach
Breast
Ovary
Pancreas
Rate Per 100,000
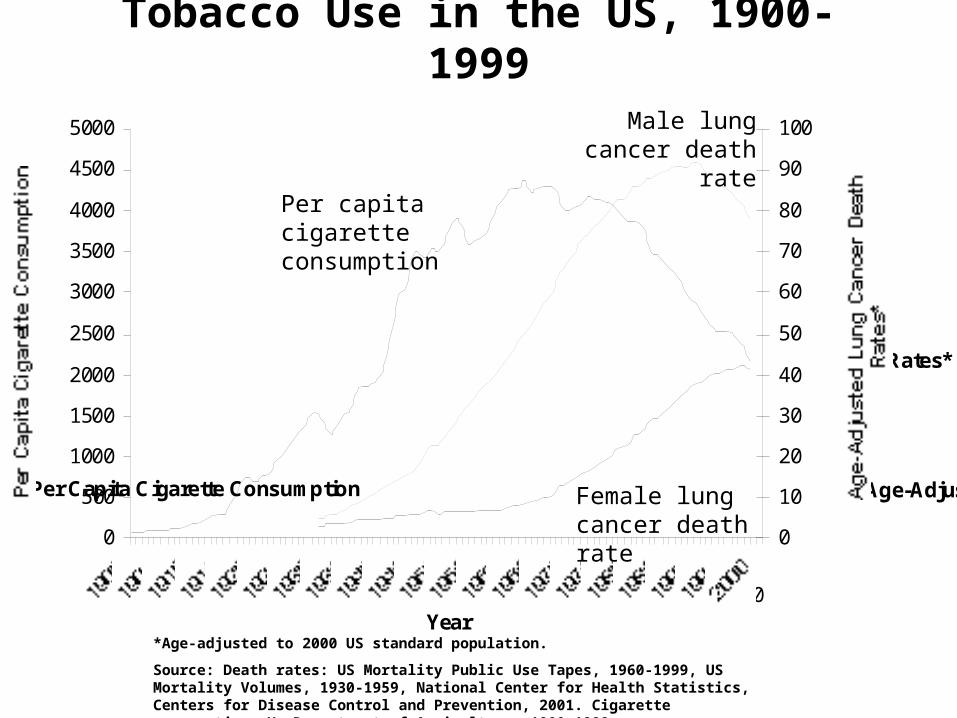
Tobacco Use in the US, 1900-1999
0
500
1000
1500
2000
2500
3000
3500
4000
4500
5000
190019051910191519201925193019351940194519501955196019651970197519801985199019952000Year
Per Capita Cigarette Consumption
0
10
20
30
40
50
60
70
80
90
100
Age-Adjusted Lung Cancer Death
Rates*
*Age-adjusted to 2000 US standard population.
Source: Death rates: US Mortality Public Use Tapes, 1960-1999, US Mortality Volumes, 1930-1959, National Center for Health Statistics, Centers for Disease Control and Prevention, 2001. Cigarette consumption: Us Department of Agriculture, 1900-1999.
Per capita cigarette consumption
Male lung cancer death rate
Female lung cancer death rate

Next:In class exercise- Funding cancer researchand How can mutations be minimized?