newton’s 2nd law - new york universityphysics.nyu.edu/.../newton's-2nd-law-09-30-2016.pdf ·...
TRANSCRIPT

Newton’s 2nd Law
Equipment Capstone, motion sensor, meter stick, force sensor, bench clamp, rod for force sensor,weights with hooks, 18.7 cm glider, 28.7 cm glider, air track, photogate/smart pulley, string forgliders, photo gate, large picket fence, digital scale, index cards, and small table clamp.
Photogate Sensor A digital sensor shaped in the form of a U. An infrared beam (peak at 880nm) is passed between the legs of the U. With the beam unblocked the output of the sensor ishigh. With the beam blocked the output is low and a light on the sensor is on. Usually Capstonestarts timing with a 10 kHz clock when the beam is blocked and stops timing when the beam isunblocked. This sequence is repeated if the beam is alternately blocked and unblocked. When usedwith various accessories such as picket fences and pulleys Capstone can calculate position, speed,acceleration, rotation, etc.
Force Sensor A analogue sensor that measures force in newtons (N) by means of a strain gauge.This sensor has a hook that if pushed records as a positive force and if pulled records as a negativeforce. The maximum force is ±50 N . (1 N=0.2248 lb.) The force sensor can be calibrated. Lateron you will use the Calibration button in the Tools column to calibrate the force sensor. Thereis a tare button located on the side of the force sensor which zeros the force sensor out. Also, youcan zero out the force sensor with a mass on it. This is a very useful feature that allows you tocancel out a given force and have the sensor give only changes from that force.
Photogate/Smart Pulley A digital sensor that combines a photogate sensor with a pulley thathas spokes. As the pulley turns the photogate is successively blocked by the spokes. The smartpulley can be programmed to display position, linear speed, linear acceleration, etc.
Picket Fence A sheet of clear plastic with opaque bands on it. When a picket fence is passedthrough a photogate the photogate beam is alternately blocked and transmitted. A display canbe programmed to give the position, speed, and acceleration of the picket fence. It is necessaryto program Capstone for the band distances of the picket fence. This is the distance from thebeginning of one opaque band to the beginning of the next opaque band.
1 Purpose
To verify Newton’s 2nd law and some applications of this law.
1

General Physics I Lab: Newton’s 2nd Law
2 Theory
Let ~F be the force in newtons (N), m the mass in kilograms (kg), and ~a the acceleration in m · s−2.Newton’s 2nd law states that
~F = m~a.
This is a vector equation but in this lab the motions are in one linear dimension and the vectornotation can be dropped. This law can be applied to an entire system or to any part of the system.Here we assume that the system is a rigid body and that the forces are applied in such a way thatthe body does not rotate. The force ~F is the sum of all the forces acting on the chosen body orsystem. This can also be called the net force or the total force.
Let m be the mass of an object on or near the surface of the earth, M the mass of the earth, Rthe radius of the earth, and G Newton’s gravitational constant. The gravitational force FG betweenm and M is given by Newton’s gravitational law as
FG =GmM
R2= mg,
where g is called the acceleration due to gravity (on the surface of the earth) and is given by
g =GM
R2= 9.81 m · s−2.
FG is more popularly known as weight. The above has 2 important applications.
1. The weight of an object in N is equal to the mass in kg times g=9.81 m · s−2.
2. If the only force on a dropped object is FG, then Newton’s 2nd law gives mg = ma, or a = g.Hence the name for g.
3 Does F = ma?
3.1 Description
The force sensor will be used to measure the net force (F) on a mass (m) and the motion sensor willbe used to measure the acceleration (a). A mass is hung on the force sensor and the combination ofthe mass with the force sensor is moved in a vertical direction. The measured acceleration shouldbe equal to F/m if Newton’s 2nd law holds.
3.2 Programming
Check that the motion sensor and the force sensor are plugged in and note the inputs used. StartCapstone from the desktop and click on Hardware Setup located below the Tools column. Animage of the interface will come up. Program Capstone for the digital motion sensor by clickingon the digital input that the motion sensor is plugged into. A window will pop up, scroll downand click on Motion Sensor II. The default speed of sound and sample rate is fine. Repeat forthe Force Sensor. Next click on the orange tack located on the top right corner of the hardwaresetup window to reduce overlapping.
2

General Physics I Lab: Newton’s 2nd Law
3.3 Calibrating the Force Sensor
1. Suspend the force sensor from a horizontal rod. Look at the following image.
2. In Capstone click on the Record button. You need to run the program to calibrate the Force Sensor.
3. Hang a 0.5 kg mass on the force sensor’s hook.
4. On the side of the force sensor press the tare button to zero out the sensor.
5. In the Tools column of Capstone click Calibration .
6. Select force and click next.
7. Pick ”Two Standards (2 point)” and then next.
3

General Physics I Lab: Newton’s 2nd Law
8. The calibration for the first point will come up. Enter 0 in the Standard Value box. ClickSet Current Value to Standard Value in the calibration point 1 box.
9. After calibrating the first point, hang two 0.2 kg masses from the 0.5 kg mass already on theforce sensor.
10. You will calibrate the second point by entering the weight of your two 0.2 kg masses inthe Standard Value box. The weight in newtons will be 0.400 × 9.81 = 3.92. Strictlyspeaking you should enter a negative number. For comparison with the acceleration, it ismore convenient to change the sign and enter the weight as a positive quantity. Why shouldyou enter a negative number? Explain.
Click Set Current Value to Standard Value in the calibration point 2 box.
11. Click finish.
12. Click Stop in the Capstone program.
13. Remove the two 0.2 kg masses from the force sensor but leave the 0.5 kg mass.
14. Go to the Data Summary in the Tools column and delete the data it recorded.
The force sensor has been calibrated to read zero when the mass (0.5 kg) is at rest. The netforce when the mass is accelerated will now be given by the output of the force sensor.
4

General Physics I Lab: Newton’s 2nd Law
3.4 Graph Setup
Now you will setup a force, position, velocity, and acceleration graph. Drag the graph iconfrom the displays column to the center. On the top center part of the graph click on the addnew plot area to the graph display icon three times. Configure each graph by clicking onSelect Measurements and choosing the appropriate label. Each graph will display a separatemeasurement. Look at the following image for visual assistance.
Don’t forget to click on the orange tack located on the top right corner of the hardware setupwindow to reduce overlapping.
3.5 Taking Data
Place the motion sensor on the floor with the grill pointing up. Be sure that it is far enough awayfrom the edge of the bench so that it does not measure the height of the bench. Tape an index cardalong the bottom of the hanging mass to aid the reflections back to the motion sensor. Carefullymove the force sensor with the 0.5 kg mass attached and hold it over the motion sensor. Have yourpartner click Record and move the force sensor up and down 5 times in a vertical line above themotion sensor. Click Stop. Examine your data. You should take several runs to determine how toget the best data. You will probably do better if you move the sensor fairly quickly up and down,but you should not move so quickly that the mass disengages from the sensor, so watch your feet!!!To aid your analysis click on the acceleration curve. Next, click on the Highlight range of pointsin active data icon. Highlight the best region of the acceleration graph, select a minimum of twocycles. Click on the Scale axes to show all data icon. Another tool for graph analysis to use isthe Add a coordinate tool icon and select ”Add Multi-Coordinate Tool.”
5

General Physics I Lab: Newton’s 2nd Law
3.6 Analysis
Compare the graph for force with the graph for acceleration. Does the curve for force pretty muchduplicate the shape of the curve for acceleration? What is occurring at the zero crossing for velocity,acceleration and force? Explain in detail. If you made the same motion with the force sensor butat a different distance from the motion sensor, which of your 4 graphs would differ from the onesyou actually took? Explain.
4 Newton’s 2nd Law Applied To A System.
4.1 Description
Newton’s laws are tested for a system of 2 masses connected by a string. Mass M1 is hanging froma vertical string. The string goes over a smart pulley and is attached to a mass M2 which is aglider attached to a horizontal string and lies on a horizontal air track. The glider on the air trackis held stationary and then let go. The motion of the string and hence of the masses is measuredby the smart pulley.
4.2 Theory
Let the tension in the string be T and the common acceleration of the masses be a. If the positivedirections are taken as down for M1 and toward the pulley for M2 the 2nd law applied to each ofthe masses gives
M1g − T = M1a and
T = M2a.
Eliminating T results in
a =M1g
M1 + M2.
6
General Physics I Lab: Newton’s 2nd Law
The above analysis assumes that the pulley is massless and frictionless. If either of these assump-tions is not true the tension in the string is not the same on each side of the pulley.
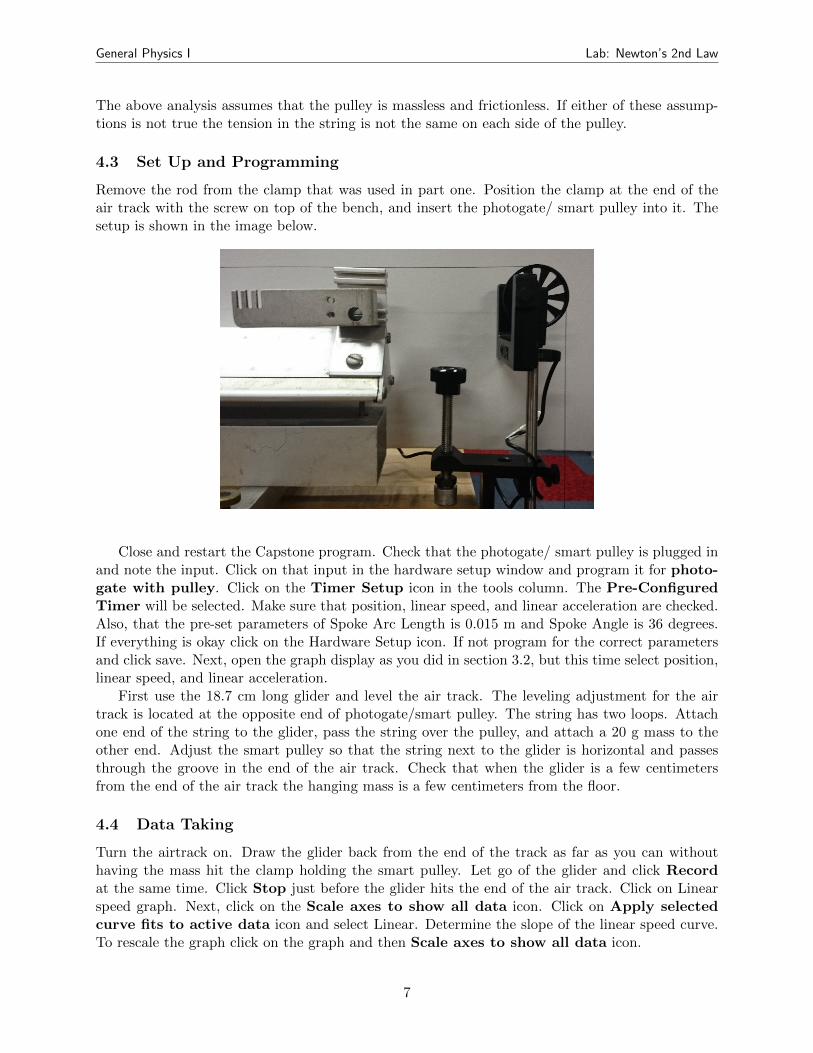
4.3 Set Up and Programming
Remove the rod from the clamp that was used in part one. Position the clamp at the end of theair track with the screw on top of the bench, and insert the photogate/ smart pulley into it. Thesetup is shown in the image below.
Close and restart the Capstone program. Check that the photogate/ smart pulley is plugged inand note the input. Click on that input in the hardware setup window and program it for photo-gate with pulley. Click on the Timer Setup icon in the tools column. The Pre-ConfiguredTimer will be selected. Make sure that position, linear speed, and linear acceleration are checked.Also, that the pre-set parameters of Spoke Arc Length is 0.015 m and Spoke Angle is 36 degrees.If everything is okay click on the Hardware Setup icon. If not program for the correct parametersand click save. Next, open the graph display as you did in section 3.2, but this time select position,linear speed, and linear acceleration.
First use the 18.7 cm long glider and level the air track. The leveling adjustment for the airtrack is located at the opposite end of photogate/smart pulley. The string has two loops. Attachone end of the string to the glider, pass the string over the pulley, and attach a 20 g mass to theother end. Adjust the smart pulley so that the string next to the glider is horizontal and passesthrough the groove in the end of the air track. Check that when the glider is a few centimetersfrom the end of the air track the hanging mass is a few centimeters from the floor.
4.4 Data Taking
Turn the airtrack on. Draw the glider back from the end of the track as far as you can withouthaving the mass hit the clamp holding the smart pulley. Let go of the glider and click Recordat the same time. Click Stop just before the glider hits the end of the air track. Click on Linearspeed graph. Next, click on the Scale axes to show all data icon. Click on Apply selectedcurve fits to active data icon and select Linear. Determine the slope of the linear speed curve.To rescale the graph click on the graph and then Scale axes to show all data icon.
7

General Physics I Lab: Newton’s 2nd Law
You will use a linear curve to determine the slope of the velocity curve. Repeat formasses of 30g and 40g. You will repeat the previous steps using a 28.7 cm long glider with massesof 40, 50, and 60 grams.
4.5 Analysis
Compare your results to the theoretical values. How well do they agree? What are possible reasonsfor any disagreement? Draw free body diagram of all the forces that both masses are being subjectedtoo when M1 is free falling.
5 The Acceleration of Gravity, g
5.1 Description
A picket fence is dropped through a digital photogate sensor. The acceleration of the picket fenceis measured and compared to g.
5.2 Set Up and Programming
Place the photogate stand near the edge of the bench and have the photogate itself extend over theedge of the bench. Restart the Capstone software. Check if the photogate sensor is plugged in andnote the channel. Program Capstone for the digital channel that the photgate is plugged into. ATimer Setup icon will come up in the Tools column. Click on it. Now configure the photogatesensor for the picket fence. Follow the 6 steps in the illustration on the next page and click Finish
8

General Physics I Lab: Newton’s 2nd Law
The flag spacing is 0.05 m. This is the correct value for the picket fence used in this experiment.Verify this by using the meter stick. Set up the graph display for speed and acceleration.
5.3 Taking Data
Put bubble wrap or a few coats on the floor directly beneath the photogate to act as a cushionfor when the picket fence hits the floor. Hold the picket fence just above the photogate, click theRecord button, and let go of the picket fence. Click Stop. (Capstone does not actually take datauntil the photogate beam is first blocked, so there is no need to drop the picket fence immediatelyafter the Rec button is clicked.) Determine the acceleration of the picket fence. Take a few runs tohave some statistics. Keep in mind that you can do a linear fit along the speed graph, or you cantake the mean average of the best part of the acceleration graph. Always click upon the graph youwant to analyze. To take the mean average value of the acceleration curve click on the accelerationgraph. Click on the down arrow next to sigma icon and check Mean. Click on the sigma button and
9

General Physics I Lab: Newton’s 2nd Law
the overall mean average value will come up. Select the best part of the graph with the highlightfeature.
5.4 Analysis
Compare your results to g. What contributes to the errors? Explain. What is ocurring with thespeed of the picket fence? Explain. If you change the height that you drop the picket fence throughthe photogate sensor will it effect the acceleration values or speed? Explain.
6 Finishing
Please return the bench to the condition in which you found it, so this means be considerate foryour fellow humans. Remove the smart pulley from the bench clamp and use the bench clamp tomount the rod and force sensor. Thank you.
10