newsletter power & utilities in europe · newsletter power & utilities in europe crude oil...
TRANSCRIPT

Commodities
NewsletterPower & Utilities in Europe
Crude oil prices continued to rise in Q1 2018 amidst some mild market volatility. In January 2018, Brent prices reached $69 per barrel for the first time since December 2014. Prices fell briefly in February 2018 before recovering to $67 per barrel by the end of the quarter.
The rise in oil prices at the start of 2018 was driven by strong demand from global economic growth, particularly in the United States (US) and Asia, together with a continued tightening of supply. The cooperation among OPEC and Russia to restrict production has sustained upward pressure on prices. Saudi Arabia and Russia have also indicated their willingness to expand on current arrangements and form a long-term 20-year alliance. OPEC’s efforts to restrict production were aided by a substantial reduction in production in Venezuela, one of its key members. Production has fallen from 2.2 million barrels a day (mbd) in 2016 to 1.5mbd in February 2018, driven by a combination of factors, such as the lack of investment by state company PDVSA into new fields and the continued economic crisis.
A brief fall in oil prices in February 2018 coincided with a period of stock market volatility and concerns about a potential US-China trade war. Prices rebounded in March 2018 on the back of growing geopolitical tension between USA and Iran, which could result in the re-imposition of sanctions against Iran and a fall in oil output.
Over the past year, OPEC’s efforts to restrict supply have been offset by rising US shale oil production. According to the US Energy Information Administration, US oil output has risen from 9.3mbd in 2017 to 10.3mbd in February 2018, and forecasted to rise to 10.7mbd for the rest of 2018. The growth in US oil production is likely to be in response to rising oil prices and growing domestic demand.
The International Energy Agency has noted that the global market is re-balancing. Supply and demand are more closely aligned, with inventories near five-year average levels. Looking ahead, the forward curve reflects market expectation that the oil market will cool down. The two key factors are likely to be the strength of cooperation among OPEC members amidst rising prices, as well as the rise in US shale oil production.
Crude oil ($/bbl)
Source Capital IQ
NEWSLETTER
April 2018
COMMODITIES
Crude oil
Source: Capital IQ Crude oil prices continued to rise in Q1 2018 amidst some mild market volatility. In January 2018, Brent prices reached $69 per barrel for the first time since December 2014. Prices fell briefly in February 2018 before recovering to $67 per barrel by the end of the quarter. The rise in oil prices at the start of 2018 was driven by strong demand from global economic growth, particularly in the United States (US) and Asia, together with a continued tightening of supply. The cooperation among OPEC and Russia to restrict production has sustained upward pressure on prices. Saudi Arabia and Russia have also indicated their willingness to expand on current arrangements and form a long-term 20-year alliance. OPEC’s efforts to restrict production were aided by a substantial reduction in production in Venezuela, one of its key members. Production has fallen from 2.2 million barrels a day (mbd) in 2016 to 1.5mbd in February 2018, driven by a combination of factors, such as the lack of investment by state company PDVSA into new fields and the continued economic crisis. A brief fall in oil prices in February 2018 coincided with a period of stock market volatility and concerns about a potential US-China trade war. Prices rebounded in March 2018 on the back of growing geopolitical tension between USA and Iran, which could result in the re-imposition of sanctions against Iran and a fall in oil output. Over the past year, OPEC’s efforts to restrict supply have been offset by rising US shale oil production. According to the US Energy Information Administration, US oil output has risen from 9.3mbd in 2017 to 10.3mbd in February 2018, and forecasted to rise to 10.7mbd for the rest of 2018. The growth in US oil production is likely to be in response to rising oil prices and growing domestic demand.
30405060708090
100110120130
Crude oil ($/bbl)
Spot Brent
Spot WTIFuture BrentFutureWTI
Future WTIFuture BrentSpot WTISpot Brent
Power & UtilitiesApril 2018 - For internal use only

2
Newsletter Power & Utilities
Gas prices experienced a seasonal downturn in Q1 2018. Prices closed the quarter at around €19/MWh, similar to Q1 2017. This is a reduction of over 15% from the December 2017 peak, likely reflecting the reopening of the Forties pipeline in the North Sea which impacted gas prices at the end of Q4 2017.
This quarter’s movement in prices occurred despite some extreme cold weather in February 2018. The resulting spike in gas demand for heating was met by an increase in gas supply, particularly from imports of Liquefied Natural Gas (LNG). The residual demand in Europe was met by a rise in coal power which relieved the pressure on gas supplies.
Q1 2018 witnessed increased political tension between the UK, European Union and Russia. As a consequence, there is growing concern over gas supply security given the volume of Russian gas supplies into Europe. This tension is exacerbated by Gazprom’s decision to terminate its contract with Ukraine’s Naftogaz, a year ahead of expiry.
The quarter ended with a decision by the Netherlands to halt production at Groningen field – the largest natural gas field in Europe – by 2030. This announcement follows yearly declines in gas production from Groningen due to fears of earthquakes around the region.
The forward curve reflects market expectation that gas prices will continue in a seasonal downturn, with a reduction in gas demand for heating as the Northern Hemisphere spring and summer approach. However, unlike in previous years, the reduction in prices in spring/summer are expected to be less pronounced compared to the previous year, which might reflect current political tensions, slightly tighter gas supplies and the need to build up gas reserves in preparation for next winter.
Gas (€/MWh) Gas
Source: Capital IQ Gas prices experienced a seasonal downturn in Q1 2018. Prices closed the quarter at around €19/MWh, similar to Q1 2017. This is a reduction of over 15% from the December 2017 peak, likely reflecting the reopening of the Forties pipeline in the North Sea which impacted gas prices at the end of Q4 2017.
This quarter’s movement in prices occurred despite some extreme cold weather in February 2018. The resulting spike in gas demand for heating was met by an increase in gas supply, particularly from imports of Liquefied Natural Gas (LNG). The residual demand in Europe was met by a rise in coal power which relieved the pressure on gas supplies.
Q1 2018 witnessed increased political tension between the UK, European Union and Russia. As a consequence, there is growing concern over gas supply security given the volume of Russian gas supplies into Europe. This tension is exacerbated by Gazprom’s decision to terminate its contract with Ukraine’s Naftogaz, a year ahead of expiry.
The quarter ended with a decision by the Netherlands to halt production at Groningen field – the largest natural gas field in Europe – by 2030. This announcement follows yearly declines in gas production from Groningen due to fears of earthquakes around the region.
The forward curve reflects market expectation that gas prices will continue in a seasonal downturn, with a reduction in gas demand for heating as the Northern Hemisphere spring and summer approach. However, unlike in previous years, the reduction in prices in spring/summer are expected to be less pronounced compared to the previous year, which might reflect current political tensions, slightly tighter gas supplies and the need to build up gas reserves in preparation for next winter.
10 12 14 16 18 20 22 24 26 28
Gas (€/MWh)
Spot NBP
Spot TTFFuture NBP
Future TTF
Source Capital IQ
Future TTFFuture NBPSpot TTFSpot NBP
Coal prices declined in Q1 2018 in a reversal of an upward trend which began in Q2 2017. Compared to peak prices in December 2017, prices at the end of Q1 2018 were 15% lower at $80 per metric tonne. This quarter’s decline in prices may reflect a seasonal fall in coal demand due to the end of winter in East Asia and the Chinese New Year holiday period.
Like most commodities, coal prices were negatively affected by a brief period of stock market volatility in February 2018. The resulting appreciation in USD made dollar-denominated coal less attractive relative to other fuel sources.
The fall in coal prices may also reflect market reaction to a change in fundamen-tals in China, the world’s largest producer and consumer of coal. The Chinese government intends to accelerate its ‘gasification’ policy which began in 2017. In particular, 4 million households and industrial plants will switch heating systems from coal to gas in 2018. This policy is part of the Chinese National Energy Administration’s aim to cut the share of coal in the energy mix.
The forward curve suggests that markets expect coal prices to decline steadily over the next two years. In addition to Chinese gasification policy, the French government pledged to shut all coal-fired power stations by 2021. Like-wise, the coalition government in coal-dominant Germany has set 2019 as an end date for coal power.
The trend in global policy to phase out coal is likely to be partially offset by ro-bust demand from India and South East Asia, as well as China. According to the International Energy Agency, Indian demand for coal is forecasted to grow annually at a rate of 5% by 2021. In China, although there have been large investments in solar, wind and Carbon Capture and Storage (CCS) technology, coal still represents around 50% of the energy mix. Therefore, it will still take some time for the full impact of Chinese policies to be observed and take effect.
Coal ($/metric ton)
Source Capital IQ
Coal
Source: Capital IQ Coal prices declined in Q1 2018 in a reversal of an upward trend which began in Q2 2017. Compared to peak prices in December 2017, prices at the end of Q1 2018 were 15% lower at $80 per metric tonne. This quarter’s decline in prices may reflect a seasonal fall in coal demand due to the end of winter in East Asia and the Chinese New Year holiday period. Like most commodities, coal prices were negatively affected by a brief period of stock market volatility in February 2018. The resulting appreciation in USD made dollar-denominated coal less attractive relative to other fuel sources. The fall in coal prices may also reflect market reaction to a change in fundamentals in China, the world’s largest producer and consumer of coal. The Chinese government intends to accelerate its ‘gasification’ policy which began in 2017. In particular, 4 million households and industrial plants will switch heating systems from coal to gas in 2018. This policy is part of the Chinese National Energy Administration’s aim to cut the share of coal in the energy mix. The forward curve suggests that markets expect coal prices to decline steadily over the next two years. In addition to Chinese gasification policy, the French government pledged to shut all coal-fired power stations by 2021. Likewise, the coalition government in coal-dominant Germany has set 2019 as an end date for coal power. The trend in global policy to phase out coal is likely to be partially offset by robust demand from India and South East Asia, as well as China. According to the International Energy Agency, Indian demand for coal is forecasted to grow annually at a rate of 5% by 2021. In China, although there have been large investments in solar, wind and Carbon Capture and Storage (CCS) technology, coal still represents around 50% of the energy mix. Therefore, it will still take some time for the full impact of Chinese policies to be observed and take effect.
40
50
60
70
80
90
100
110
Coal ($/metric tonne)
Spot ARAFuture ARA
Future ARASpot ARA

3
Newsletter Power & Utilities
Carbon CO2 (€/ton)
Carbon
Source: Capital IQ Carbon prices reached a six-year high of €11.50/ton in Q1 2018. The rate of increase, which began in Q2 2017, has accelerated this quarter, with prices in March 2018 50% higher than in December 2017. The increase in carbon prices above €10/ton is a significant development given where carbon prices of the EU Emissions Trading System (ETS) have been in the last five years. This will provide an additional incentive to invest in cleaner renewable energy, alongside a range of other incentive mechanisms that are in place across the EU. However, prices are still well below the level required to meet future emission targets. For example, the UK Committee on Climate Change estimates the required price to be £30/ton in 2020, rising to £70/ton in 2030. Carbon prices tend to increase in level and volatility around Q1 every year as market activity increases before the annual ETS compliance deadline of 30 April. However, this quarter’s sharp price movements may also be attributed to the imminent implementation of Market Stability Reserve (MSR) in 2019. The MSR aims to double the rate at which the excess supply of European Union Allowance (EUA) is removed from the market. In anticipation of future shortages of EUAs, demand for EUAs increased to take advantage of current low prices. Further, the UK government announced its intention to remain in Phase III of the ETS until the end of 2020. This announcement reduced uncertainty in the market and will support carbon prices at least until the next phase of the EU ETS. On the demand side, the continued economic recovery in Europe, particularly in the aviation and industrial sectors, led to increased economic activity and higher carbon emissions. In addition, extreme cold weather in February 2018, combined with the fall in coal prices relative to gas prices increased carbon emissions from coal power plants. The forward curve suggests that market expectations are cautious. In particular, the market does not appear convinced that market fundamentals have changed substantially to herald a long-term recovery of carbon prices. It is worth nothing that the MSR represents a substantial market correction which may lead to greater speculative market activity and thus higher volatility in prices over the course of 2018.
3
5
7
9
11
13
15
17
CO² (€/ton)
Spot ETSFuture ETS
Carbon prices reached a six-year high of €11.50/ton in Q1 2018. The rate of increase, which began in Q2 2017, has accelerated this quarter, with prices in March 2018 50% higher than in December 2017. The increase in carbon prices above €10/ton is a significant development given where carbon prices of the EU Emissions Trading System (ETS) have been in the last five years. This will provide an additional incentive to invest in cleaner renewable energy, alongside a range of other incentive mechanisms that are in place across the EU. However, prices are still well below the level required to meet future emission targets. For example, the UK Committee on Climate Change estimates the required price to be £30/ton in 2020, rising to £70/ton in 2030.
Carbon prices tend to increase in level and volatility around Q1 every year as market activity increases before the annual ETS compliance deadline of 30 April. However, this quarter’s sharp price movements may also be attributed to the imminent implementation of Market Stability Reserve (MSR) in 2019. The MSR aims to double the rate at which the excess supply of European Union Allowance (EUA) is removed from the market. In anticipation of future shortages of EUAs, demand for EUAs increased to take advantage of current low prices. Further, the UK government announced its intention to remain in Phase III of the ETS until the end of 2020. This announcement reduced uncertainty in the market and will support carbon prices at least until the next phase of the EU ETS.
On the demand side, the continued economic recovery in Europe, particu-larly in the aviation and industrial sectors, led to increased economic activity and higher carbon emissions. In addition, extreme cold weather in February 2018, combined with the fall in coal prices relative to gas prices increased car-bon emissions from coal power plants.
The forward curve suggests that market expectations are cautious. In par-ticular, the market does not appear convinced that market fundamentals have changed substantially to herald a long-term recovery of carbon prices. It is worth nothing that the MSR represents a substantial market correction which may lead to greater speculative market activity and thus higher volatility in prices over the course of 2018.
Baseload spot electricity prices were mildly volatile in Q1 2018 across the UK, France, Italy and Germany. Due to an exceptionally cold quarter, electricity prices at the end of Q1 2018 were higher than in Q1 2017 – prices in UK and France were 30% higher year-on-year.
Across all four countries, prices dipped in January 2018 but rose sharply in Feb-ruary due to the cold weather. As a result, gas demand increased to its highest level since 2010, leading to National Grid issuing a warning over gas sup-plies in the UK. Towards the end of March 2018, milder temperatures pushed prices down on the Continent.
Aside from weather impacts, fluctuations in electricity prices can be explained by levels of electricity generation. In France, prices are affected by nuclear power availability – prices fell in January 2018 following the restart of Cattenom reactor. The impending reopening of the Fessenheim, Belleville and Paluel reac-tors in Q2 2018 would further increase nuclear power availability and exert downward pressure on prices.
In Germany, prices are affected by wind power generation. Towards the end of Q1 2018, electricity generated from wind turbines decreased, but this was partially offset by weak demand due to mild weather. As a result, the volatility of electricity prices in Germany was lower compared to other countries. In Italy, prices dipped in January 2018 due to above-average temperatures and strong hydroelectric generation (2.2 TWh in January). Furthermore, an increase in nuclear power generation from France boosted electricity imports into Italy.
Baseload Electricity Baseload Spot Day Ahead (€/MWh)
Source Capital IQFuture ETSSpot ETS
Source Bloomberg
FranceItalyUKGermany
Baseload Electricity
Source: Bloomberg Baseload spot electricity prices were mildly volatile in Q1 2018 across the UK, France, Italy and Germany. Due to an exceptionally cold quarter, electricity prices at the end of Q1 2018 were higher than in Q1 2017 – prices in UK and France were 30% higher year-on-year. Across all four countries, prices dipped in January 2018 but rose sharply in February due to the cold weather. As a result, gas demand increased to its highest level since 2010, leading to National Grid issuing a warning over gas supplies in the UK. Towards the end of March 2018, milder temperatures pushed prices down on the Continent. Aside from weather impacts, fluctuations in electricity prices can be explained by levels of electricity generation. In France, prices are affected by nuclear power availability – prices fell in January 2018 following the restart of Cattenom reactor. The impending reopening of the Fessenheim, Belleville and Paluel reactors in Q2 2018 would further increase nuclear power availability and exert downward pressure on prices. In Germany, prices are affected by wind power generation. Towards the end of Q1 2018, electricity generated from wind turbines decreased, but this was partially offset by weak demand due to mild weather. As a result, the volatility of electricity prices in Germany was lower compared to other countries. In Italy, prices dipped in January 2018 due to above-average temperatures and strong hydroelectric generation (2.2 TWh in January). Furthermore, an increase in nuclear power generation from France boosted electricity imports into Italy. In the UK, the upward pressure on electricity prices from the cold weather was alleviated by a rise in generation from wind power. The sustained cold weather and a reduction in wind power generation in March 2018 meant that gas power plants were required to generate electricity. Therefore, unlike on the other three markets, UK electricity prices rose in March 2018.
20
30
40
50
60
70
80
90Baseload Spot Day Ahead (€/MWh)
Germany
UK
Italy
France

4
Newsletter Power & Utilities
In the UK, the upward pressure on electricity prices from the cold weather was alleviated by a rise in generation from wind power. The sustained cold weather and a reduction in wind power generation in March 2018 meant that gas power plants were required to generate electricity. Therefore, unlike on the other three markets, UK electricity prices rose in March 2018.
Since natural gas typically dominates the UK electricity supply stack, wholesale electricity prices are often determined by marginal costs of Combined Cycle Gas Turbines (CCGT). Clean spark and dark spreads capture the profitabil-ity of gas and coal power plants respectively.
Clean spark spreads measure the gross margin of a 50% efficient gas-fired power plant after accounting for the cost of gas, Carbon Price Support and car-bon emissions. After 18 months above £5/MWh, clean spark spreads declined steadily in Q1 2018, closing the quarter at £2.55/MWh – 50% lower com-pared to the spread at the end of the previous quarter.
Clean dark spreads measure the gross margin of a 35% efficient coal power plant after accounting for the cost of coal and carbon emissions. After a brief period of profitability in Q4 2017, clean dark spreads were near zero by the end of Q1 2018.
The declining margins of gas and coal power plants may be attributed to rising carbon prices, particularly for emission-heavy coal power plants. However, this effect was partially offset by falling coal prices, thus coal margins declined less compared to gas margins.
Overall, the low and negative clean dark spreads over the past year provides economic support to the UK government’s proposition to close all coal power plants by 2025
UK Clean dark & spark spreads (£/MWh)
Source Bloomberg
Clean dark spreadClean spark spread
UK clean dark & spark spread
Source: Bloomberg Since natural gas typically dominates the UK electricity supply stack, wholesale electricity prices are often determined by marginal costs of Combined Cycle Gas Turbines (CCGT). Clean spark and dark spreads capture the profitability of gas and coal power plants respectively. Clean spark spreads measure the gross margin of a 50% efficient gas-fired power plant after accounting for the cost of gas, Carbon Price Support and carbon emissions. After 18 months above £5/MWh, clean spark spreads declined steadily in Q1 2018, closing the quarter at £2.55/MWh – 50% lower compared to the spread at the end of the previous quarter. Clean dark spreads measure the gross margin of a 35% efficient coal power plant after accounting for the cost of coal and carbon emissions. After a brief period of profitability in Q4 2017, clean dark spreads were near zero by the end of Q1 2018. The declining margins of gas and coal power plants may be attributed to rising carbon prices, particularly for emission-heavy coal power plants. However, this effect was partially offset by falling coal prices, thus coal margins declined less compared to gas margins. Overall, the low and negative clean dark spreads over the past year provides economic support to the UK government’s proposition to close all coal power plants by 2025.
-10
-5
0
5
10
15
20
25
30
35
UK Clean dark and spark spreads (£/MWh)
Clean spark spreadClean dark spread
In Germany, coal dominates electricity generation, with a third of electricity gen-erated from coal. Therefore, coal has been the electricity price setting plant for a number of years.
Clean dark spreads declined slightly in Q1 2018. By the end of the quarter, coal power plants were barely breaking even. The decline in coal margins was partially alleviated by falling coal prices. On the other hand, clean spark spreads declined more significantly relative to clean dark spreads, dipping to a negative spread of €9/MWh in March 2018. This level of unprofitability in gas power plants was last seen in September 2015.
A contributing factor to the negative profitability trends in Q1 2018 is the rise in carbon prices. Higher carbon prices affect coal margins more severely since coal produces higher carbon emissions. The negative margins in gas pow-er plants are also exacerbated by increased efficiency of coal power plants, which leads to a decline in wholesale electricity prices.
Over the past four years, coal power plants have declined in profitability while gas power plants have been unprofitable for the majority of the period. These negative trends should incentivise the German coalition government to meet its long-term energy policy targets, namely having 65% of electricity generated from renewables by phasing out coal.
German Clean dark & spark spreads (€/MWh)
German clean dark & spark spread
Source: Bloomberg In Germany, coal dominates electricity generation, with a third of electricity generated from coal. Therefore, coal has been the electricity price setting plant for a number of years. Clean dark spreads declined slightly in Q1 2018. By the end of the quarter, coal power plants were barely breaking even. The decline in coal margins was partially alleviated by falling coal prices. On the other hand, clean spark spreads declined more significantly relative to clean dark spreads, dipping to a negative spread of €9/MWh in March 2018. This level of unprofitability in gas power plants was last seen in September 2015. A contributing factor to the negative profitability trends in Q1 2018 is the rise in carbon prices. Higher carbon prices affect coal margins more severely since coal produces higher carbon emissions. The negative margins in gas power plants are also exacerbated by increased efficiency of coal power plants, which leads to a decline in wholesale electricity prices. Over the past four years, coal power plants have declined in profitability while gas power plants have been unprofitable for the majority of the period. These negative trends should incentivise the German coalition government to meet its long-term energy policy targets, namely having 65% of electricity generated from renewables by phasing out coal.
-25-20-15-10
-505
1015
German Clean dark and spark spreads (€/MWh)
Clean spark spreadClean dark spread
Source Bloomberg
Clean dark spreadClean spark spread

5
Newsletter Power & Utilities
Spotlight on Power and Utilities market
Capital market overviewDeloitte Index (1) Enel Iberdrola EDF ENGIE E.ON
Gas Natural
RWE Centrica
Market cap. ratios Natural E.ON SSE Currency EUR EUR EUR EUR EUR EUR EUR GBPMarket cap. (March 18) 49 177 37 170 32 499 31 307 19 362 18 764 11 763 7 764
3m stock price performance -1% -3% -7% +12% -5% -1% -3% +16% +1%
YoY stock price performance +6% +13% -10% +49% +3% +22% -4% +30% -34%
Market multiples EV/EBITDA 2017 9.0x 8.2x 12.1x 9.3x 8.5x 6.3x 9.2x 12.0x 5.7x
EV/EBITDA 2018 7.7x 6.9x 8.6x 7.8x 7.7x 8.1x 8.2x 8.7x 5.6x
P/E 2017 11.6x 13.0x 13.3x 10.2x 22.0x 4.9x 13.8x 6.1x 23.3x
P/E 2018 12.7x 11.9x 13.0x 16.0x 12.6x 13.6x 15.4x 13.1x 10.3x
Price/book value 2018 1.2x 1.4x 1.0x 0.8x 0.9x n.m. 1.3x 1.5x 2.9x
Profitability ratios ROE forward 12m 12% 12% 8% 5% 7% 35% (3) 8% 12% (3) 28% (2)
ROCE forward 12m 8% 9% 5% 4% 5% 17% (3) 6% 10% (3) 17% (2)
EBITDA margin 2017 18% 19% 20% 18% 13% 16% 17% 9% 8%
EBITDA margin 2018 19% 21% 25% 22% 15% 13% 19% 11% 8%
Key messages from brokers and analysts“A good earnings season … on low expectations … overshadowed by debates on 2018 outlook and new business plan” (Morgan Stanley – March 26, 2018)
“RWE becomes a pure generator and E.ON pure downstream: German utilities gain true identities at last, but all-around euphoria misplaced” (HSBC – March 19, 2018)
“LNG supply-demand are key to watch: we see limited room for normalized demand growth in Europe” (Credit Suisse – March 6, 2018)
“Do the negative earnings revision stop here?: Earnings revision ratio stand at most negative level in 5 years” (Morgan Stanley – March 5, 2018)
“Caution on commodities continued: European power, coal and gas prices have continued their YTD declines, and weaker USD adds fuel. Despite this, generation exposed utility performance remains relatively robust” (Morgan Stanley – February 5, 2018)
Source Capital IQ
Source Capital IQ
(1) Deloitte Index is composed of Engie, EDF, EON, Iberdrola, RWE, Gas Natural, Enel, SSE and Centrica
(2) Ratio linked to the expected level of non recurring income resulting from disposals program by Centrica
(3) Ratio linked to non-reccuring items (Nuclear tax refund and E.ON / RWE agreement)
Capital market overview
Deloitte Index (1) Enel Iberdrola EDF ENGIE E.ON Gas
Natural RWE Centrica
Market cap. ratios Currency EUR EUR EUR EUR EUR EUR EUR GBP
Market cap. (March 18) 49 177 37 170 32 499 31 307 19 362 18 764 11 763 7 764 3m stock price performance -1% -3% -7% +12% -5% -1% -3% +16% +1%
YoY stock price performance +6% +13% -10% +49% +3% +22% -4% +30% -34%
Market multiples EV/EBITDA 2017 9.0x 8.2x 12.1x 9.3x 8.5x 6.3x 9.2x 12.0x 5.7x EV/EBITDA 2018 7.7x 6.9x 8.6x 7.8x 7.7x 8.1x 8.2x 8.7x 5.6x P/E 2017 11.6x 13.0x 13.3x 10.2x 22.0x 4.9x 13.8x 6.1x 23.3x P/E 2018 12.7x 11.9x 13.0x 16.0x 12.6x 13.6x 15.4x 13.1x 10.3x Price/book value 2018 1.2x 1.4x 1.0x 0.8x 0.9x n.m. 1.3x 1.5x 2.9x Profitability ratios ROE forward 12m 12% 12% 8% 5% 7% 35% (3) 8% 12% (3) 28% (2)
ROCE forward 12m 8% 9% 5% 4% 5% 17% (3) 6% 10% (3) 17% (2)
EBITDA margin 2017 18% 19% 20% 18% 13% 16% 17% 9% 8% EBITDA margin 2018 19% 21% 25% 22% 15% 13% 19% 11% 8%
(1) Deloitte Index is composed of Engie, EDF, EON, Iberdrola, RWE, Gas Natural, Enel, SSE and Centrica (2) Ratio linked to the expected level of non recurring income resulting from disposals program by Centrica (3) Ratio linked to non-reccuring items (Nuclear tax refund and E.ON / RWE agreement)
-
2,0x
4,0x
6,0x
8,0x
10,0x
12,0x
14,0x
ENGIE EDF EON Iberdrola RWE GasNatural
Enel Centrica
EV/EBITDA 2017 EV/EBITDA 2018
Weigthed average EV/EBITDA 2017 Weigthed average EV/EBITDA 20189.1x 7.7x
90
95
100
105
110
115
120
Stoxx Europe 600 Euro Stoxx Utilities Deloitte Index*
Key messages from brokers and analysts “A good earnings season … on low expectations … overshadowed by debates on 2018 outlook and new business plan” (Morgan Stanley – March 26, 2018) “RWE becomes a pure generator and E.ON pure downstream: German utilities gain true identities at last, but all-around euphoria misplaced” (HSBC – March 19, 2018) “LNG supply-demand are key to watch: we see limited room for normalized demand growth in Europe” (Credit Suisse – March 6, 2018) “Do the negative earnings revision stop here?: Earnings revision ratio stand at most negative level in 5 years” (Morgan Stanley – March 5, 2018) “Caution on commodities continued: European power, coal and gas prices have continued their YTD declines, and weaker USD adds fuel. Despite this, generation exposed utility performance remains relatively robust” (Morgan Stanley – February 5, 2018)

6
Newsletter Power & Utilities
M&A Trends
Transactions involving Power & Utilities companiesAgreement between RWE and E.ON for an exchange of assets. After E.ON would be a pure energy retailer and RWE would be specialized in generation.
(HydroWorld Weekly - March 20, 2018).
Total acquires a 74.33% interest in Direct Energie, an energy retailer in France and Belgium with a 1.35 GW of existing combined gas and renewable capacity and 2.4 GW of renewable energy capacity under development, for €1.4 bn.
(Market Report- April 19, 2018).
ContourGlobal, a UK energy company, has agreed to acquire five solar plants in Spain from Acciona, an energy developer, for €1.4bn.
(Financial Deals Tracker – March 1, 2018).
Enel launched a tender offer to acquire Eletropaulo Metropolitana Electricidade de Sao Paulo, a power distribution company, for R$4.7bn. This offer is backed by a forecasted R$1.5bn capital increase.
(Dow Jones Newswires- April 20, 2018).
2i Rete Gas, an Italian gas distributor, acquired the gas distributor Nedgia and the service company Gas Natural Italia from Gas Natural Fenosa, for €727m.
(Italian Collection- February 5, 2018)
Sonnedix, a solar power company, plans to acquire a 50% stake in a portfolio of solar power plants in Spain with an expected capacity of 660 MW, from Cox Energy, for $615m.
(Financial Deal Tracker- March 20, 2018).
The Snam, Enagas, Fluxys consortium won the tender for the acquisition of 66% of the Greek, national operator in the natural gas infrastructure, DESFA for €535m.
(Electronic News Publishing- April 25, 2018).
Edison, the Italian subsidiary of EDF, finalized the acquisition of Gas Natural Vendita Italia Spa, an Italian gas and electricity marketing company, for $231m.
(Financial Deals Tracker- February 27, 2018).
Enel has agreed to acquire Parques Eolicos Gestinver, a company owning five wind farms with an installed capacity of 132 MW, from Elawan Energy SL and Genera Avante, two renewable energy companies, for €178m.
(Financial Deals Tracker – March 7, 2018).
Gas Natural agreed to acquire two solar projects in Brazil from Canadian Solar Inc. for $117m, with an estimated annual capacity of 165 GW.
(Dow Jones Institutional News – March 19, 2018).
Tenaga Nasional Bhd, a renewable energy company, has completed the acquisition of 80% of GVO Wind and Bluemerang Capital, two renewable energy (RE) companies registered in the UK.
(Financial Deals Tracker - March 28, 2018)
Transaction involving equity fundsCVC, a Luxembourg private equity group, agreed to buy 20% of Gas Natural from Repsol for €3.8bn.
(SeeNews Deals- March 23, 2018)
Pensionskassernes Administration and PFA Pension, two Danish pension funds, acquired a 50% stake in the 659 MW Walney Extension Offshore Wind Farm in the UK from Orsted AS, formerly Dong Energy AS for a $2.6bn purchase consideration.
(Financial Deals Tracker- March 28, 2018)
Boralex acquires, Kallista Energy Investment, a French wind energy developer with a capacity of 163 MW, from Ardian, an infrastructure investor, for €129m.
(SNL Energy Financial- April 23, 2018).

7
Newsletter Power & Utilities
European Power and Utilities companies wrap-up
Most of European Power Utilities achieved their 2017 guidance.
In Q4 2017, European Power Utilities benefit from higher electricity sales prices namely driven by nuclear power plant outages in France. However, it has been more than offset by negative impacts of adverse warmer winter and poor hydro conditions.
• RWE and E.ON signed an agreement in which (i) E.ON should acquire innogy and (ii) RWE should obtain the control of E.ON and Innogy renewables businesses- E.ON receives (i) 76.8% of innogy and (ii) a €1.5bn cash payment from RWE - RWE to get in exchange (i) 16.67% in new E.ON by a capital increase with against contribution in kind (ii) E.ON and Innogy renewables
businesses and (iii) E.ON’s minority stakes in two RWE operated nuclear power plants, innogy’s gas storage business and minority participation in Kelag.
• After this operation, E.ON would becom an energy retailer and networks operator, and RWE would aggregate power generation with coal, gas and renewable assets.
In aggregate impairment recorded by Utilities are decreasing compared to 2016 (approx. €6bn) representing a quarter of the 2015 amount and the half of 2016 amount. In others words, financial consequence of undergoing strategic changes are now in a fine tunning phase.

8
Newsletter Power & Utilities
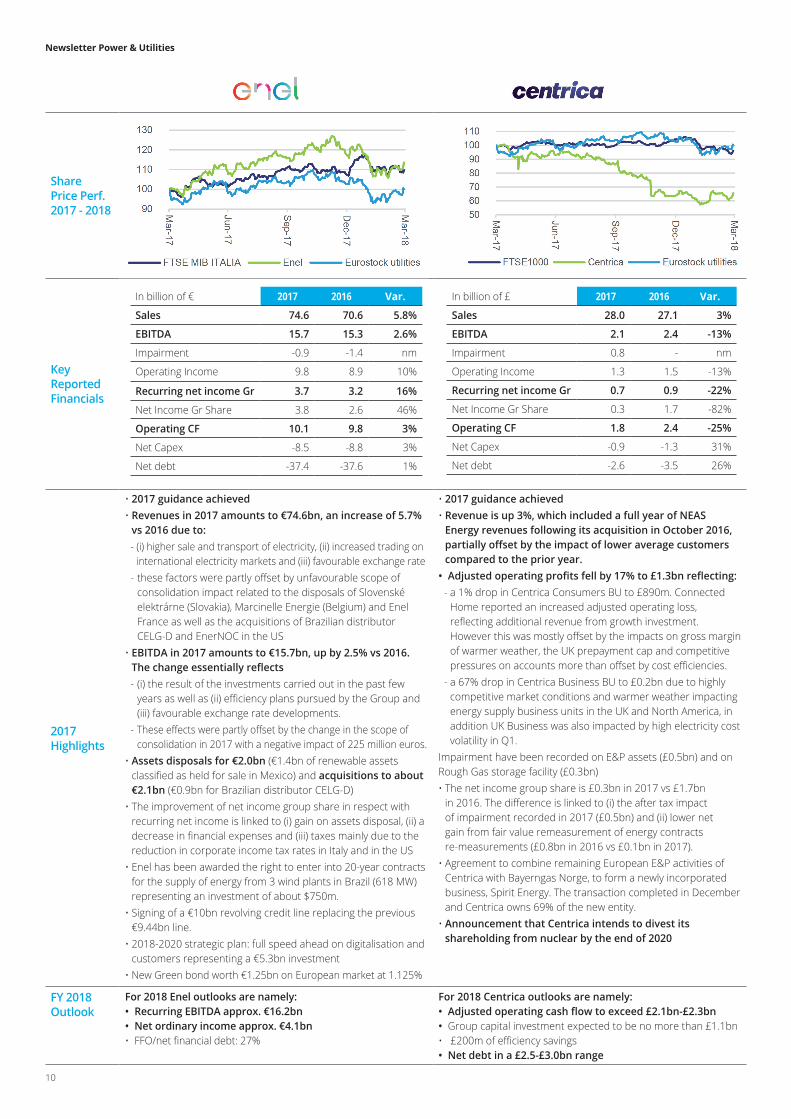
Share Price Perf.2017 - 2018
Key Reported Financials
2017Highlights
• 2017 guidance achieved• Revenues decreased by 2.2% to €69.6bn and increase by
0.4% on an organic basis.- France (+1.3% organic): (i) higher ARENH (1) sales linked and
price increase (ii) partially offset by a drop in French nuclear output (-4.9 TWh), lower hydro output (-5.3TWh) and loss of one million residential customers. In 2016 the tariff adjustment had a non-recurring impact of €0.9bn
- UK (-0.8% organic): nuclear output at 63.9TWh (-1.2TWH from 2016). This is more than offset by 12% decrease in nuclear power prices and a negative impact of pound sterling variation (-€0.5bn)
• EBITDA amounts to €13.7bn, -16.3% vs 2016, -14.8% on organic basis, due to electricity purchases to cover 2017 ARENH subscriptions in the context of higher power prices and lower nuclear power output.
• Capital increase (€4bn) positively impacted net debt• Impairment of €0.5bn linked to E&P assets• Opex reductions target reached one year early (€-0.7bn vs
2015) and rapid progress of the disposal plan (€8.1bn signed or released i.e. 80% of the objective)
• Net capex of Linky (smartmetring) and strategic investments (Framatome acquisition, HPC projects and wind offshore acquisitions) amount to €4.0bn in 2017 vs €1.0bn in 2016.
• In France, postponement of the 2025 target on reducing the share of nuclear power at 50% ahead of the PPE (multi-year energy plan).
(1) Right for energy retailers to buy electricity from EDF nuclear power plants (82TWh in 2017) at a regulated price (€42 per MWh)
• 2017 guidance achieved• Revenues increased by 0.3% to €65.0bn and by 1.7% on an
organic basis driven by:- (i) an increase in volumes and prices on commodities (gas
midstream in Europe and LNG business in Asia), (ii) an improved performance of the power generation in Europe and Australia, (iii) the impact of new assets commissioned and tariffs increases in Latin America, and (iv) the 2016 tariffs revisions in infrastructure in France.
- These positive impacts were partially offset by (i) a fall in natural gas sales to B to B in France and (ii) a decrease in hydro energy generation in France.
• Reported growth affected by the disposal of the merchant power generation assets in the USA, Poland and the UK (€0.6bn negative impact) and (ii) a negative foreign exchange effect of €0.3bn linked to the pound sterling.
• EBITDA amounted to EUR 9.3 billion, down 1.8% but up by 5.3% on an organic basis. Organic growth driven by revenue-related developments (excluding LNG and gas midstream activities), by the effects of the Lean 2018 performance program (€0.4bn) and by a slightly unfavourable temperature effect.
• €1.4bn impairments losses on Gas storage in France (€0.5bn) and thermal generation in Europe (€0.4bn)
• 2017 Net capex impacted by growth capex (low CO2, global networks and client solutions business) linked to the €14.3 investment program over 2016-2018
• Transformation plan on track :- €13.2bn from disposals plan. To date, €11.6bn are already closed.- €1.0 bn cumulated gains end of 2017 linked to performance
program “Lean 2018”
FY 2018Outlook
For 2018 EDF targets are:- EBITDA of €14.6bn to €15.3bn - Cash flow of 0 (excluding Linky, new developments and 2015-20
assets disposal plan)- Net financial debt/EBITDA < 2.7x- Pay-out ratio of Net Income excluding non-recurring items:
50%
For 2018 Engie targets are:• A net recurring income, Group share between €2.45bn and
€2.65bn assuming an organic growth (8%) compared to 2017. Guidance based on an estimated range of EBITDA of €9.3bn to €9.7bn.
For the 2018-2019 period, the Group anticipates:• A net debt/EBITDA ratio < 2.5x• An “A” category rating
In billion of € 2017 2016 Var.
Sales 69.6 71.2 -2%
EBITDA 13.7 16.4 -16%
Impairment -0.5 -0.6 nm
Operating Income 5.6 7.5 -25%
Recurring net income Gr 2.8 4.1 -31%
Net Income Gr Share 3.2 2.9 10%
Operating CF 10.2 13.1 -22%
Net Capex -16.0 -12.8 -25%
Net debt -33.0 -37.4 12%
In billion of € 2017 2016(1) Var.
Sales 65.0 64.8 1%
EBITDA 9.3 9.5 -2%
Impairment -1.4 -4.0 nm
Operating Income 2.6 2.5 4%
Recurring net income Gr 2.6 2.5 4%
Net Income Gr Share 1.4 -0.4 nm
Operating CF 8.3 9.6 -14%
Net Capex -9.2 -6.3 -46%
Net debt -22.5 -24.8 9%
(1) Prior year figures are restated following the classification of ENGIE E&P International as “discontinued operations”

9
Newsletter Power & Utilities
Share Price Perf.2017 - 2018
Key Reported Financials
2017Highlights
• 2017 results at upper range of full year guidance• Sales declined by 1% to €38bn in 2017:
- a decline in Customer Solutions’ sales (€0.8bn) due to (i) lower sales volume, (ii) negative currency-translation on pounds, (iii) transfer of supply contracts for the wholesale-customer business in Germany to Uniper and (iv) impact of E&P operations disposal in 2016.
- being partially offset by an increase in Energy Networks’ sales (€1.1bn) linked to higher costs charged by upstream grid operators in Germany is more than offset by Earnings.
• Adjusted EBIT is stable year on year:- The increase in Energy Networks’ (€0.3bn) because of
regulatory reasons in Germany and higher tariffs in Sweden.- being offset by a decline in Customer Solutions’ (€0.3bn) due
to (i) adverse impact of weather on volume sold and higher costs in the UK, (ii) lower gas sales prices, and persistently competitive and margin pressure in Germany.
• In 2017 the positive non-operating earnings is attributable to the German nuclear tax refund (€2.6bn). In the prior year non-operating earnings was adversely impacted by Uniper spin-off and change in Nuclear Waste Management regulation (€16bn loss).
• Improvement of recurring net income mainly driven by significant lower interest accretion of nuclear provisions and a tax rate of 26% (vs. 29% in 2017)
• Impairment are largely attributable to US onshore windfarms due to prices lower than expected
• Change in the net debt reflects the capital increase conducted in March 2017. In addition Cash flow is €6.2bn below 2016 due to (i) €10.3bn paid to nuclear fund (KFK) partially offset by the €2.6bn nuclear fuel tax refund
• 2017 guidance achieved• Sales declined by 3% reaching €44.6bn in 2017 due to:
- (i) reduced generation electricity output, (ii) lower electricity sales on the wholesale market and (iii) loss by innogy of residential and corporate retail customers notably in the UK and Netherlands for both electricity and gas supply.
- These impacts are partially offset by customer gains and increase activity with existing customers in Germany
• EBITDA increased by 7% to €5.7bn due to:- (i) a significantly improved performance in energy trading (€0.4bn),
(ii) a drop in operating and maintenance cost for distribution networks cost.
- These impacts are partially offset by a negative effect of lower wholesale price for generation from lignite-fire and nuclear power plants.
• Non-operating earnings are positively impacted by the German nuclear fuel tax refund (€1.7bn), while partially offset by impairment recorded on innogy retail business and a lignite-fired power plant in Hungary. In 2016, the non-operating result suffered from impairment on German conventional generation (€3.7bn).
• Due to the German nuclear tax refund RWE intends to pay a special dividend of €1 per share in addition to €0.5 regular dividend
• Innogy receives subsidy contract for Triton Knoll offshore wind farm (£2bn project) and becomes project’s sole owner.
• Capacity auction in the UK for the period 2021/22 enabled RWE to secure payment for 6.6 GW generation capacity. However the price of £8.4/kw is far below market expectation
FY 2018Outlook
For 2018 E.ON outlooks are:• Adjusted EBIT of €2.8bn to €3.1bn• Adjusted net income of €1.3bn to €1.5bn
For 2018 RWE outlooks are:• Adjusted EBITDA of €4.9bn to €5.2bn• Adjusted net income of €0.7bn to €1.0bn
In billion of € 2017 2016(1) Var.
Sales 38.0 38.2 -1%
EBITDA 5.0 4.9 2%
Impairment -1.2 -0.4 nm
Operating Income 3.1 3.1 -
Recurring net income Gr 1.4 0.9 56%
Net Income Gr Share 3.9 -8.5 nm
Operating CF -2.2 4.0 nm
Net Capex -3.3 -3.2 -3%
Net debt -19.2 -26.3 27%
(1) Prior year figures are restated following the deconsolidation of Uniper
In billion of € 2017 2016 Var.
Sales 44.6 45.8 -3%
EBITDA 5.7 5.4 6%
Impairment -0.9 -4.4 nm
Operating Income 3.6 3.1 16%
Recurring net income Gr 1.2 0.8 50%
Net Income Gr Share 1.9 -5.7 nm
Operating CF -1.7 2.4 nm
Net Capex -2.6 -2.4 -8%
Net debt -20.2 -22.7 11%
10
Newsletter Power & Utilities
Share Price Perf.2017 - 2018
Key Reported Financials
2017Highlights
• 2017 guidance achieved• Revenues in 2017 amounts to €74.6bn, an increase of 5.7%
vs 2016 due to:- (i) higher sale and transport of electricity, (ii) increased trading on
international electricity markets and (iii) favourable exchange rate- these factors were partly offset by unfavourable scope of
consolidation impact related to the disposals of Slovenské elektrárne (Slovakia), Marcinelle Energie (Belgium) and Enel France as well as the acquisitions of Brazilian distributor CELG-D and EnerNOC in the US
• EBITDA in 2017 amounts to €15.7bn, up by 2.5% vs 2016. The change essentially reflects - (i) the result of the investments carried out in the past few
years as well as (ii) efficiency plans pursued by the Group and (iii) favourable exchange rate developments.
- These effects were partly offset by the change in the scope of consolidation in 2017 with a negative impact of 225 million euros.
• Assets disposals for €2.0bn (€1.4bn of renewable assets classified as held for sale in Mexico) and acquisitions to about €2.1bn (€0.9bn for Brazilian distributor CELG-D)
• The improvement of net income group share in respect with recurring net income is linked to (i) gain on assets disposal, (ii) a decrease in financial expenses and (iii) taxes mainly due to the reduction in corporate income tax rates in Italy and in the US
• Enel has been awarded the right to enter into 20-year contracts for the supply of energy from 3 wind plants in Brazil (618 MW)representing an investment of about $750m.
• Signing of a €10bn revolving credit line replacing the previous €9.44bn line.
• 2018-2020 strategic plan: full speed ahead on digitalisation and customers representing a €5.3bn investment
• New Green bond worth €1.25bn on European market at 1.125%
• 2017 guidance achieved• Revenue is up 3%, which included a full year of NEAS
Energy revenues following its acquisition in October 2016, partially offset by the impact of lower average customers compared to the prior year.
• Adjusted operating profits fell by 17% to £1.3bn reflecting:- a 1% drop in Centrica Consumers BU to £890m. Connected
Home reported an increased adjusted operating loss, reflecting additional revenue from growth investment. However this was mostly offset by the impacts on gross margin of warmer weather, the UK prepayment cap and competitive pressures on accounts more than offset by cost efficiencies.
- a 67% drop in Centrica Business BU to £0.2bn due to highly competitive market conditions and warmer weather impacting energy supply business units in the UK and North America, in addition UK Business was also impacted by high electricity cost volatility in Q1.
Impairment have been recorded on E&P assets (£0.5bn) and on Rough Gas storage facility (£0.3bn)• The net income group share is £0.3bn in 2017 vs £1.7bn
in 2016. The difference is linked to (i) the after tax impact of impairment recorded in 2017 (£0.5bn) and (ii) lower net gain from fair value remeasurement of energy contracts re-measurements (£0.8bn in 2016 vs £0.1bn in 2017).
• Agreement to combine remaining European E&P activities of Centrica with Bayerngas Norge, to form a newly incorporated business, Spirit Energy. The transaction completed in December and Centrica owns 69% of the new entity.
• Announcement that Centrica intends to divest its shareholding from nuclear by the end of 2020
FY 2018Outlook
For 2018 Enel outlooks are namely:• Recurring EBITDA approx. €16.2bn • Net ordinary income approx. €4.1bn • FFO/net financial debt: 27%
For 2018 Centrica outlooks are namely:• Adjusted operating cash flow to exceed £2.1bn-£2.3bn • Group capital investment expected to be no more than £1.1bn • £200m of efficiency savings • Net debt in a £2.5-£3.0bn range
In billion of € 2017 2016 Var.
Sales 74.6 70.6 5.8%
EBITDA 15.7 15.3 2.6%
Impairment -0.9 -1.4 nm
Operating Income 9.8 8.9 10%
Recurring net income Gr 3.7 3.2 16%
Net Income Gr Share 3.8 2.6 46%
Operating CF 10.1 9.8 3%
Net Capex -8.5 -8.8 3%
Net debt -37.4 -37.6 1%
In billion of £ 2017 2016 Var.
Sales 28.0 27.1 3%
EBITDA 2.1 2.4 -13%
Impairment 0.8 - nm
Operating Income 1.3 1.5 -13%
Recurring net income Gr 0.7 0.9 -22%
Net Income Gr Share 0.3 1.7 -82%
Operating CF 1.8 2.4 -25%
Net Capex -0.9 -1.3 31%
Net debt -2.6 -3.5 26%

11
Newsletter Power & Utilities
Share Price Perf.2017 - 2018
Key Reported Financials
2017Highlights
• 2017 guidance achieved• Sales increase by 8.7% at €31.2bn supported by the
contribution of US, Mexico and Brazil, due to the incorporation of NEOENERGIA. The performance of reference currencies had a negative effect (sterling and US dollar) partly offset by the appreciation of the Brazilian real
• EBITDA amounts to €7.3bn, -7.8% vs 2016, and by -5.7% excluding foreign exchange impact, due to:- (i) lower hydropower (-21%) contribution in Spain, (ii) US
storms costs, (iii) lower output (-31%) in the UK linked the closure of the Longannet plant and (iv) lower tariffs in regulated generation.
- partially offset by (i) Electro annual tariff revision, (ii) NEO consolidation (R$1bn) and (iii) higher volume of energy distributed (+1.2%) in Brazil.
• Net debt totals €32.9bn mostly because of consolidation of NEO (+€2.8bn)
• Impairments are related to Renewables and Gas asset in North America.
• US tax reform has a net positive impact of €1.3bn reducing federal income tax from 35% to 21%.
• In addition, Iberdrola placed its first green hybrid bond as well as its subsidiaries Avangrid green bond in November 2017 on European market valued for €1bn.
• Iberdrola signs a long-term renewable energy sales agreement with Google (more than $31 billion in assets and operations in 27 states).
• 2017 guidance achieved• Sales increased by 6.4% vs 2016 and totalled €23.3bn in
2017, due to (i) higher volumes and sale prices in the gas business compared with the previous year, and (iii) the currency effect.- EBITDA amounts to €3.9bn, -16.1% vs 2016, with (i) higher
pool prices with sale prices at particularly low levels, given the exceptionally low forward prices, (ii) low hydroelectricity production and (iii) foreign exchange impact due to depreciation of the US dollar, Argentinean peso and Mexican peso.
• Capex decrease by 29% due to acquisition in 2016 of two new gas carriers (€0.4bn) and new LPG connection points (€0.4bn).
• Sale of 59.1% shareholding of gas distribution activities in Colombia to Brookfield Infrastructures to be finalized in 2018
• Issue of a €0.8bn green bond issuance with 7.5-year maturity and a coupon of 0.875%
• Gas Natural Fenosa reached a binding agreement to sell its 59.1% stake in Gas Natural, S.A. ESP, a Colombian company engaged in distribution and retail supply of natural gas, to Brookfield Infrastructure for €0.5bn.
• Approval of Italian antitrust authorities for the sale of gas distribution business in Italy.
FY 2018Outlook
Iberdrola announced its strategic plan long term outlook for 2018-2022 with the following outlooks:• 2022 EBITDA: €11.5bn - €12bn• 2022 net profit: €3.5bn - €3.7bn• 2022 FFO / net debt: 24% (23% in 2020)• 2022 net debt / EBITDA: 3.3% (3.5% in 2020)
No quantitative outlooks disclosed for 2018 However Gas Natural forecasts namely (i) continued organic growth in networks and secured growth in international generation (ii) positive outlook in gas supply, (iii) recovery of Electricity Spain
In billion of € 2017 2016(1) Var.
Sales 31.2 28.8 8%
EBITDA 7.3 7.9 -8%
Impairment -1.0 -0.5 nm
Operating Income 2.7 4.7 -43%
Recurring net income Gr na na -
Net Income Gr Share 2.8 2.7 4%
Operating CF 6.5 6.4 2%
Net Capex -5.2 -4.8 8%
Net debt -32.9 -29.4 12%
(1) Prior year figures are restated following the classification of Engineering business as “discontinued operations”
In billion of € 2017 2016 Var.
Sales 23.3 21.9 6%
EBITDA 3.9 4.7 -17%
Impairment - -0.1 nm
Operating Income 2.1 2.8 -25%
Recurring net income Gr 1.2 1.2 -
Net Income Gr Share 1.4 1.3 8%
Operating CF 2.9 3.4 -15%
Net Capex -1.6 -2.2 27%
Net debt -15.2 -15.4 1%
(1) Prior year figures are restated following the classification of the gas distribution business in Italy and Colombia, the electricity distribution business in Moldova, the gas supply business in Italy, and the power generation business in Kenya as “discontinued operations”

12
Newsletter Power & Utilities
Delimitation of bidding zones for electricity markets in Europe and the consideration of internal congestions
Talking points
1 https://www.ofgem.gov.uk/sites/default/files/docs/2014/10/fta_bidding_zone_configuration_literature_review_1.pdf
The definition of bidding zones to manage congestionTrading electricity between regions allows to lower the generation costs by dispatching the cheapest power plants, independent of where they are in Europe, and by serving consumers with the highest willingness to pay, regardless of their location. If trading opportunities were unlimited, this would result in the most efficient allocation of resources and in a uniform electricity price in Europe.
However, in practice, trading is limited between adjacent regions by the capacity of the interconnecting transmission lines. If interconnector capacity is insufficient, low-cost power plants in one region cannot – via exports – fully displace high-cost power plants in neighbouring regions. As a result, generation costs differ between the regions, as well as electricity prices. Different prices may ultimately alter investment decisions, in particular in plants or storage facilities. A key element of the current European discussions is therefore the definition and delineation of markets and how they should deal with congestion on transmission lines.
The solution implemented in Europe lies in the definition of bidding zones. A bidding zone is defined as the largest geographical area in which market players can trade electricity without any restriction due to internal bottlenecks. For instance, France is defined as one bidding zone: from a market point of view, a consumer in the North of France can trade any amount of electricity with any French power plant, independent of its location. Transmission capacity is assumed to be unlimited within each bidding zone (as if the zone were a copper plate), resulting in the definition of a uniform electricity price.
Limited transmission capacity is only considered for trades between different bidding zones. For instance, a market participant who wants to trade electricity between France and Spain (two different bidding zones) has to request a right to use the limited cross-border capacity between both countries, using a process called capacity allocation. If market participants want to trade more electricity than the maximum capacity of transmission lines between bidding zones, congestions happen which result in different electricity prices in each bidding zone.
In Europe, historically, bidding zones have been mainly defined according to national borders as illustrated in Figure 1. It means that electricity prices tend to be defined on a national level (with Sweden and Italy being the main exceptions, see below) and that congestion is assumed to occur only on cross-border lines.
Limits of the current definition of bidding zonesTo ensure efficiency and proper functioning, the definition of bidding zones usually built on two assumptions:
1) there is no congestion inside the bidding zone (trade within the zone is not limited by technical constraints and power can flow without restrictions), and,
2) trade within a bidding zone does not distort trade outside the bidding zone (for instance, electricity trade between the North and the South of France is assumed not to modify potential trade in Germany or between Germany and France).
Figure 1 : Bidding zones in Europe (source : OFGEM1)

13
Newsletter Power & Utilities
However, the relevance of both assumptions, and more generally the delimitation of bidding zones, are currently being challenged in Europe. The growing output from renewables (wind and solar PV notably), which are often concentrated in areas where weather conditions are most favourable and which are often remote from consumption centres, increases the occurrence and the magnitude of internal congestions. Germany and Austria, which are currently defined as one bidding zone, are a case in point: the bulk of the wind capacity is located in the lowlands of Northern Germany (or increasingly also offshore) while consumption hubs are predominantly in the South and in Austria. During windy days, it results in large power flows from the north to the south and to Austria. This phenomenon is exacerbated by the decommissioning of nuclear plants in the South. The new and large electricity flows within the same bidding zone challenge both assumptions which characterise an efficient bidding zone.
First, due to large internal flows and limited internal transmission capacity, congestion does actually occur within the Austro-German bidding zone. In particular, in 2016, the average physical available capacity of the Austrian-German transmission line was about 3200 MW while trade reached up to 7700 MW between both regions2, due to the absence of capacity restrictions by the market. Such congestion may jeopardise the security of the system if it is not handled thanks to another solution which will be described later.
Second, trading within the bidding zone, between North and South, has impacts on potential trade in neighbouring bidding zones: the underlying cause is referred to as ‘loop flows’ and is illustrated in Figure 2 for internal trade between Germany and Austria. The actual flow of electricity through the power grid is determined by the laws of physics and may consequently differ from commercial schedules. In fact, less than half of the internal trade between Austria and Germany physically takes place on the Austro-German interconnection. The remainder flows through neighbouring bidding zones, in particular through Poland and the Czech Republic.
2 https://www.acer.europa.eu/Official_documents/Acts_of_the_Agency/ANNEXES_CCR_DECISION/Annex%20IV.pdf3 Ibid.4 https://acer.europa.eu/Official_documents/Acts_of_the_Agency/Publication/ACER%20Market%20Monitoring%20Report%202015%20-%20ELECTRICITY.pdf Source: ENTSO-E Transparency Platform5 https://www.acer.europa.eu/Official_documents/Acts_of_the_Agency/Publication/ACER_Market_Monitoring_Report_2015.pdf 7 https://www.ei.se/Documents/Publikationer/rapporter_och_pm/Rapporter%202015/Ei_R2015_12.pdf 8 http://europa.eu/rapid/press-release_IP-18-2122_en.htm
In dealing with these unscheduled loop flows, transmission system operators (TSO) tend to reduce the cross-border capacity made available to market participants via the capacity allocation process. This consequently reduces potential trade between countries and limits the potential to lower the cost of generation. Moreover, loop flows can jeopardise the security of supply in other countries by creating unscheduled congestions, and thus increasing the risk of blackouts. According to ACER (the European agency of energy regulators), the reduction of social welfare in Europe due to loop flows is estimated at about 445 millions € in 20154.
Which solutions to reduce the impact of internal congestions and loop flows?Short-term solutions
1) Redispatching
A major solution used in Europe to alleviate congestion inside the bidding zone is called redispatching i.e. the TSO asks a number of plants on each side of the congested line to modify their output. For instance, when the north-south transmission line in Germany is congested, the TSO asks (and remunerates accordingly) plants in the South to increase their production and plants in the North to reduce theirs. This typically implies that lower cost plants on one side reduce the output while higher cost plants on the other side ramp up. As such, redispatching can lead to significant costs for the TSO and ultimately for the consumers. For instance, in Germany, it amounts to 1.2 billion euro in 20175.
2) Reduction of the cross border capacity
Another short-term solution lies in the reduction of the cross-border capacity between two bidding zones and which is made available to the market. By limiting import or export from neighbouring bidding zones, a TSO may reduce its internal congestions and then limit the costs it would have borne by resorting to redispatching if these congestions happened. In 2014, 56% of interconnections were voluntarily reduced to solve internal congestions6.
However, reducing cross-border capacity to solve internal congestions may be in breach of EU competition rules as an abuse of a dominant market which may distort competition between bidding zones. For instance, in 2009, the European Commission launched an inquiry to assess whether the Swedish TSO reduced voluntarily exports to Denmark in order to limit the internal bottlenecks7.
A similar issue is investigated by the European Commission (EC) regarding the German-Danish interconnection. Tennet, a German TSO, is suspected to reduce imports from Nordic countries to avoid worsening existing internal bottlenecks between the north and the south of Germany8. It may reduce competition between Nordic producers and German producers as it creates a barrier for Nordic producers to access the German market.
Figure 2 : Distribution of the physical flows of electricity for a commercial trade from Germany to Austria (source: ACER3)

14
Newsletter Power & Utilities
Medium-term solutions
The conflict between the reduction of cross-border capacity and antitrust considerations has led to another solution to alleviate internal bottlenecks: a review of the delimitation of bidding zones. The main idea is to redefine bidding zones so that internal congestion becomes congestion between different bidding zones which can be handled efficiently by the market thanks to cross-border allocation. Similarly, bidding zones should also be redefined to minimize the size of loop flows in neighbouring bidding zones.
This solution has been implemented in Sweden following an inquiry of the EC in 2009: Sweden has subsequently been split into four different bidding zones. This solution has also been decided for the common bidding zone of Germany and Austria. Due to permanent congestions on the border between both countries as mentioned previously, both countries will be split into two different bidding zones in October 20189. Consequently, trades between these two countries will be constrained by the physical capacity of the cross-border lines and market participants will not be able to trade more than is available, then avoiding congestions and the costs of solving them thanks to redispatching for instance. Some discussions also assess the need to split the German bidding zone into two parts (North/South) to alleviate and consider more accurately the internal congestions between these two regions.
However, splitting bidding zones also has drawbacks. A major consequence of market splitting is the reduction of the market liquidity and the higher risk of market power abuse since two different markets are now created. Several criteria should then be weighted when assessing the need to split bidding zones. ENTSO-E, which have recently released the first edition of the bidding zone review, underline the difficulty as they conclude that their study “does not provide sufficient evidence for a modification of or for maintaining of the current bidding zone configuration”10.
Moreover, it should be noted that spitting a market has important redistribution effects. For instance, the splitting of the German and Austrian bidding zone is expected to raise costs for Austria by 80 million euro per year due to higher electricity prices. On the contrary, Germany is expected to gain about 265 million euros per year. The discussion is then highly political as it is illustrated by the recent decision of the German government to prohibit TSOs from splitting the German bidding zone.
Long-term solutions
Finally, a long-term solution is to build more transmission lines to reduce internal congestions and make bidding zones closer to the copper plate assumption. However, this solution takes several years to be implemented and often encounters local opposition. Moreover, a central question lies in the coordination between TSOs to perform these investments. In particular, since loop flows appear outside the bidding zone which creates them (for instance in Poland whereas they are created by internal congestions in Germany), investment may have to be undertake by the foreign TSO (for instance Poland) to solve an issue caused the German network and the configuration of the German market. Cost sharing mechanisms should then be implemented (such as the Inter-Transmission System Operator Compensation in Europe11) and work efficiently to give incentives to TSOs to perform investments.
As a general conclusion, consideration of internal congestions and loop flows is a key topic in current European power systems. Among the different solutions, the redefinition of current bidding zones is currently highly debated in Europe. However, its interest should be weighed against the performances of other solutions, according to different criteria such as the efficiency of price signals but also the risks of reducing the liquidity of power markets. Due to redistribution effects, public and political acceptability also appears as a major criterion to consider. Economic theory also suggests another solution to treat efficiently congestion: nodal pricing. With this approach, bidding zones are reduced to the smallest area, the nodes of the electricity grid. This solution is currently implemented in most US power markets. However, creating a European nodal pricing system is a complex operation, as this would require significant changes to market making software and operations, and faces considerable political barriers.
Finally, one should keep in mind that the final aim of previously mentioned solutions is not to eliminate any congestion. From an economic point of view, congestion is desirable when the costs of solutions to alleviate it exceeds the gains from increased trade. In this case, implemented solutions should aim at managing congestion in the most efficient way, in particular by allocating the scarce cross-border capacity to the market participants whose trades will result in the highest social welfare.
9 https://af.reuters.com/article/africaTech/idAFL8N1IH3XX 10 https://www.entsoe.eu/Documents/News/bz-review/2018-03_First_Edition_of_the_Bidding_Zone_Review.pdf11 https://acer.europa.eu/en/Electricity/Infrastructure_and_network%20development/Pages/Inter-TSO-compensation-mechanism-and-transmission-
charging.aspx

15
Newsletter Power & Utilities
1 Caldecott et al. (2014).2 Caldecott et al. (2014).3 The impairments were also driven by other thermal generation assets such as coal which were impacted by some countries willingness to tighten environmental
restrictions. 4 The panel includes the following utilities: Centrica, CEZ, E.ON, EDF, Enel, Energias de Portugal, Engie, Fortum, Gas Natural, Iberdrola, RWE, SSE, Suez Environnement,
Vattenfall, Veolia and Verbund.5 For more details, see for instance: https://ec.europa.eu/info/news/new-energy-market-reports-show-surge-wind-energy-2018-mar-26_en 6 Gas prices were low during the 1990s and, in the early 2000s, the announcement of the introduction of the EU-ETS, provided high hopes to investors. These hopes
were reinforced in 2002 with Germany’s first attempt of nuclear phase-out (as market participants expected power demand to grow).7 RTE (2014).
Profitability of gas-fired power plants in Europe: is the storm behind us?
1. Evidence of the recent struggles The current decade has witnessed a trend of decreasing profitability of many European gas-fired power plants. Several utilities decided to shutdown, either definitely (decommissioning) or temporarily (mothballing), a number of gas-fired plants. This trend was especially pronounced over the years 2012 to 2014, where a number of major European utilities announced their decisions to mothball or shut down more than 50 gas-fired power plants amounting to a cumulative capacity of almost 9 GW1. These decisions came at a significant financial cost, estimated at more than 6 billion euros2 in 2013 alone.
Following the aforementioned decisions and the poor prospects of profitability for gas-fired generation assets in the concerned period, most European utilities have suffered from write downs as shown in Figure 1 below. Between 2012 and 2015, the average level of impairments related to generation assets was higher than 12 billion euros per year. While these impairments3 cannot be entirely attributed to the loss of profitability of gas-fired plants, this was certainly a key contributor.
2. Story of a ‘perfect storm’2.1 Flattening electricity demand
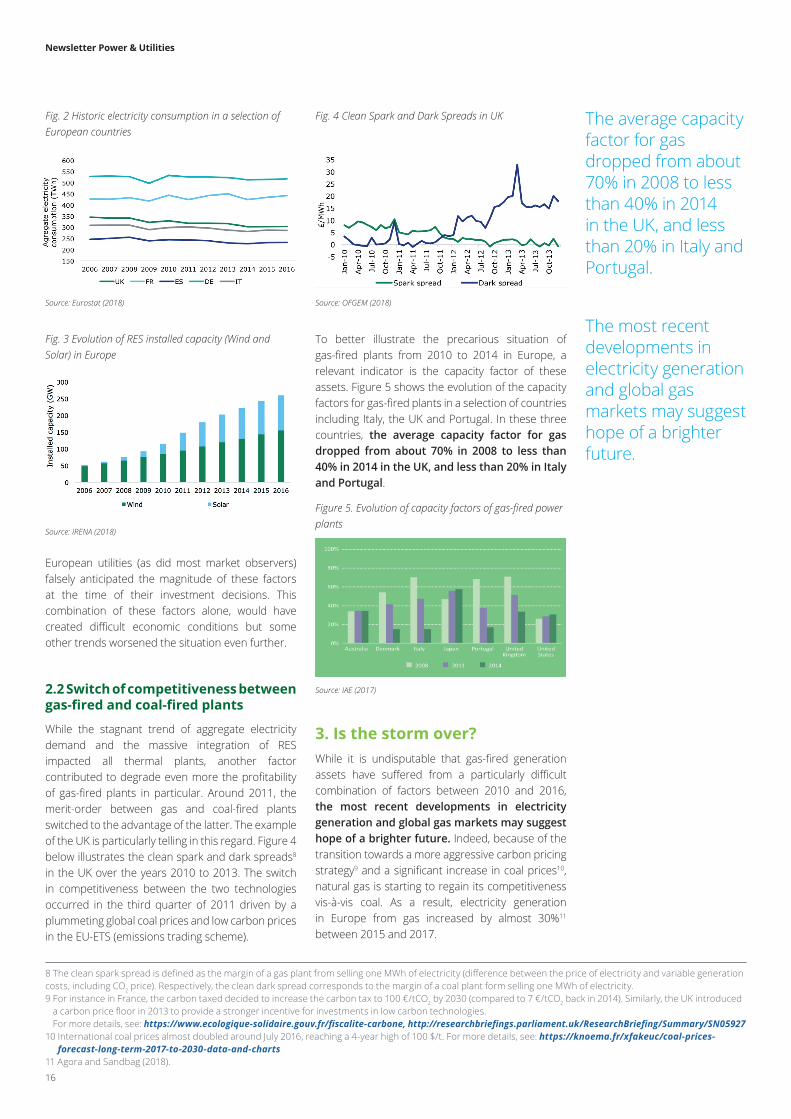
The struggles that European utilities have experienced regarding their thermal generation assets, especially gas-fired plants are the consequence of a combination of events which led to a ‘perfect storm’. One of the most noticeable reason behind the loss of profitability of gas-fired plants since 2010 is the levelling off of electricity demand in most European countries. Indeed, the financial and economic crisis of 2008 markedly dampened electricity consumption in Europe. For instance, in France, the UK, Germany, Italy and Spain, which are among the largest electricity consumers in Europe, aggregate electricity consumption has been flat or even decreasing since 2008 (see Figure 2). It is also worth noting that, a few years after the crisis, electricity consumption started to decouple from economic growth5, which explains the persistent flat trend, even ten years after the crisis.
This situation, was further exacerbated by the rapid development of renewable energy sources (RES) fostered by different support schemes implemented all over Europe. As illustrated in Figure 3, while electricity consumption was flattening (or declining), installed wind (both onshore and offshore) capacity more than tripled between 2006 and 2016. At the same time, solar PV capacity, which was almost inexistent back in 2006, grew to reach more than 100 GW in 2016. Due to their zero marginal cost of production, the penetration of RES directly affects the profitability of thermal plants as it creates the so-called ‘merit-order’ effect by reducing electricity prices (previously marginal plants become extramarginal and a lower cost technology sets the price).
In addition, from an investor’s perspective, these generation assets were also perceived as an attractive investment opportunity in the late 1990’s and 2000’s6. Between 2000 and 2010, investments in Combined-Cycle Gas Turbines (CCGT) amounted to more than 175 GW7 in Europe.
Fig. 1 Generation assets-related impairments of European utilities
Source: based on financial statements released by a panel of 16 European utilities4
Mothball or shut down more than 50 gas-fired power plants amounting to a cumulative capacity of almost 9 GW
The struggles that European utilities have experienced regarding their thermal generation assets, especially gas-fired plants are the consequence of a combination of events which led to a ‘perfect storm’
Between 2000 and 2010, investments in Combined-Cycle Gas Turbines (CCGT) amounted to more than 175 GW in Europe.
16
Newsletter Power & Utilities
8 The clean spark spread is defined as the margin of a gas plant from selling one MWh of electricity (difference between the price of electricity and variable generation costs, including CO2 price). Respectively, the clean dark spread corresponds to the margin of a coal plant form selling one MWh of electricity.9 For instance in France, the carbon taxed decided to increase the carbon tax to 100 €/tCO2 by 2030 (compared to 7 €/tCO2 back in 2014). Similarly, the UK introduced
a carbon price floor in 2013 to provide a stronger incentive for investments in low carbon technologies. For more details, see: https://www.ecologique-solidaire.gouv.fr/fiscalite-carbone, http://researchbriefings.parliament.uk/ResearchBriefing/Summary/SN05927
10 International coal prices almost doubled around July 2016, reaching a 4-year high of 100 $/t. For more details, see: https://knoema.fr/xfakeuc/coal-prices-forecast-long-term-2017-to-2030-data-and-charts
11 Agora and Sandbag (2018).
Fig. 2 Historic electricity consumption in a selection of European countries
Source: Eurostat (2018)
Fig. 3 Evolution of RES installed capacity (Wind and Solar) in Europe
Source: IRENA (2018)
Fig. 4 Clean Spark and Dark Spreads in UK
Source: OFGEM (2018)
Figure 5. Evolution of capacity factors of gas-fired power plants
Source: IAE (2017)
European utilities (as did most market observers) falsely anticipated the magnitude of these factors at the time of their investment decisions. This combination of these factors alone, would have created difficult economic conditions but some other trends worsened the situation even further.
2.2 Switch of competitiveness between gas-fired and coal-fired plants
While the stagnant trend of aggregate electricity demand and the massive integration of RES impacted all thermal plants, another factor contributed to degrade even more the profitability of gas-fired plants in particular. Around 2011, the merit-order between gas and coal-fired plants switched to the advantage of the latter. The example of the UK is particularly telling in this regard. Figure 4 below illustrates the clean spark and dark spreads8 in the UK over the years 2010 to 2013. The switch in competitiveness between the two technologies occurred in the third quarter of 2011 driven by a plummeting global coal prices and low carbon prices in the EU-ETS (emissions trading scheme).
To better illustrate the precarious situation of gas-fired plants from 2010 to 2014 in Europe, a relevant indicator is the capacity factor of these assets. Figure 5 shows the evolution of the capacity factors for gas-fired plants in a selection of countries including Italy, the UK and Portugal. In these three countries, the average capacity factor for gas dropped from about 70% in 2008 to less than 40% in 2014 in the UK, and less than 20% in Italy and Portugal.
3. Is the storm over?While it is undisputable that gas-fired generation assets have suffered from a particularly difficult combination of factors between 2010 and 2016, the most recent developments in electricity generation and global gas markets may suggest hope of a brighter future. Indeed, because of the transition towards a more aggressive carbon pricing strategy9 and a significant increase in coal prices10, natural gas is starting to regain its competitiveness vis-à-vis coal. As a result, electricity generation in Europe from gas increased by almost 30%11 between 2015 and 2017.
The average capacity factor for gas dropped from about 70% in 2008 to less than 40% in 2014 in the UK, and less than 20% in Italy and Portugal.
The most recent developments in electricity generation and global gas markets may suggest hope of a brighter future.

17
Newsletter Power & Utilities
In addition, gas demand for power generation is expected to grow in Europe in the medium term as highlighted by the EU gas and power TSO bodies (ENTSO-G12 an ENTSO-E13 respectively). In their most recent Ten Year Development Network Plan (TYNDP) report, ENTSO-G and ENTSO-E indicate that power generation demand for gas could rise by more than 70% between 2020 and 202514 if the merit-order between gas and coal switches back to the advantage of gas. Figure 6 shows gas demand forecast for power generation for different scenarios of coal/gas merit-order. Even in the coal before gas scenario, demand for gas is still expected to grow by 2025, especially in Italy Spain and the UK. This expected trend of increased gas demand for electricity generation in Europe is also stressed in the latest World Energy Outlook15 (WEO).
Relative fuel price movements depend on a large number of drivers and uncertainties. The global gas market is currently undergoing a significant shift towards LNG with a large-scale expansion in LNG export capacity underway in the United States and Australia (and a few others). The first wave of new facilities has already come online with further additions due to become operational in the next five years. This development has tended to depress gas prices but in 2017 Chinese LNG imports skyrocketed and other Asian countries also showed growing appetite for LNG – whether the global gas market will be long or short in the next few years thus depends ultimately on how quickly Asian gas imports increase. Coal prices are currently at levels above marginal costs in the international market mostly
4. ConclusionIn conclusion, the struggles experienced by gas-fired generation assets during the years 2010 to 2016 were the consequences of a conjectural combination of unanticipated events. The stagnation of electricity demand following the economic crisis of 2008, the rapid penetration of RES, a drop in coal prices alongside a weak carbon price all contributed to creating particularly difficult economic conditions for gas-fired plants. As a result, many utilities decided to decommission their plants or to shut them down temporarily. However, in light of the most recent forecasts regarding gas demand for power generation and the dynamics in global gas markets, the future seems to look brighter for these generation assets.
Furthermore, regardless of pure economic considerations, gas is a relatively clean and flexible source of power generation and can thus play an important role in decarbonizing power generation. Europe still relies to a large degree on CO2 intensive coal and lignite plants. If the targets of the 2030 Framework16 for Energy and Climate of the EU is to be achieved, these plants will certainly need to be gradually decommissioned17. Renewables though increasing rapidly are unlikely to fully fill the gap.
Finally, while it is clear that gas-fired generation will play an important role in the ongoing energy transition, many stakeholders have questioned the ability of energy-only markets18 to properly remunerate generation capacity (especially gas plants) and provide efficient long-term incentives for investments19. This concern has led some countries to adapt their market designs consequently by implementing so called ‘capacity mechanisms’, which are an additional source of income for generation assets.
12 European Network of Transmission System Operators for gas.13 European Network of Transmission System Operators for electricity.14 Platts (2018).15 IEA and OECD (2017). World Energy Outlook 2017.16 For more details, see: https://ec.europa.eu/clima/policies/strategies/2030_en17 In that same logic, another positive stimulus for gas-fired plants could come from ageing nuclear fleet in Europe. Indeed, gas could play an important role when
nuclear plants will be decommissioned. 18 In reference to markets in which generation capacity is remunerated solely based on the energy it produces and sell (and other ancillary services).19 See for instance: https://www.sciencedirect.com/science/article/pii/S0301421515302500 https://www.sciencedirect.com/science/article/pii/S0301421517306316
Figure 6. Forecast scenarios for power generation gas demand
Source: Platts (2018)
due to Chinese coal production control policies (which have increased Chinese coal imports and lifted international prices). Chinese policy makers have repeatedly stated their discontent of the effect their policies have with respect to creating windfall profits outside China. A policy change to disadvantage imported coal vis-à-vis domestic coal is on the cards and that could trigger a downward correction in coal prices.
Power generation demand for gas could rise by more than 70% between 2020 and 2025 if the merit-order between gas and coal switches back to the advantage of gas.
The global gas market is currently undergoing a significant shift towards LNG with a large-scale expansion in LNG export capacity underway in the United States and Australia (and a few others).
Furthermore, regardless of pure economic considerations, gas is a relatively clean and flexible source of power generation and can thus play an important role in decarbonizing power generation.

18
Newsletter Power & Utilities
5. ReferencesAgora and Sanddag (2018). The European Power Sector in 2017. Available at: https://sandbag.org.uk/wp-content/uploads/2018/01/EU-power-sector-report-2017.pdf
Caldecott, B., Tilbury, J., Carey, C., (2014). Stranded generation assets: Implications for European capacity mechanisms, energy markets and climate policy. Available at:http://www.smithschool.ox.ac.uk/research/sustainable-finance/publications/Stranded-Generation-Assets.pdf
Eurostat (2018). Electricity and heat statistics in Europe. Available at: http://ec.europa.eu/eurostat/statistics-explained/index.php/Electricity_and_heat_statistics
IAE (2017). Tracking Clean Energy progress. Available at: https://www.iea.org/publications/freepublications/publication/TrackingCleanEnergyProgress2017.pdf
IEA and OECD (2017). World Energy Outlook 2017. Available at:https://www.iea.org/weo2017/
IRENA (2018). IRENA’s data and statistics website. Available at: http://resourceirena.irena.org/gateway/dashboard/
OFGEM (2018). OFGEM’s website. Available at: https://www.ofgem.gov.uk/data-portal/spark-and-dark-spreads-gb
Platts (2018). Power in Europe, Issue 771.
RTE (2014). Mécanisme de capacité : rapport d’accompagnement de la proposition de règles. Available at:http://www.rte-france.com/sites/default/files/20140410-mecanisme-capacite.pdf

Newsletter Power & Utilities
Policy and Regulation RadarThis section summarizes the key changes respectively in the EU or in the country regulation that may significantly affect the power and utilities companies.
What is changing in the EU regulation?
European Commission’s proposal: 873 million euros in energy infrastructure
Key features Insights
On 25th January, EU Member States agreed on the European Commission’s proposal to invest €873 million in key European energy infrastructure projects.
In total, 17 projects were selected following a call for proposals under the Connecting Europe Facility (CEF), an EU funding pro-gramme for infrastructure:
• 8 in the electricity sector (€680 million), • 9 in the gas sector (€193 million)
The selected projects will contribute to achieve the Energy Union’s goals by connect-ing European energy networks, increasing security of energy supply, and contributing to sustainable development by integrating renewable energy sources across the EU.
In the electricity sector, the allocated grants will cover, among others:
• The construction of the Biscay Gulf France-Spain interconnection (EU support €578 million). The project, with a 280 km long offshore section, incorporates technologically innovative solutions regarding the design of the route, which is fully underground. This new link:
- will double the interconnection capacity between both countries – increasing it from 2,800 MW to 5,000 MW;
- will bring Spain closer to the 10% interconnection target from the current level of 6%;- will allow for an enhanced incorporation of renewable energies.
• The construction of the SuedOstLink in Germany (EU support €70 million). The project consists of 580 kilometres of high-voltage cables laid fully underground. The power line:
- will create an urgently needed link between the wind power generated in the north and the consumption centres in the south of Germany;
- will ensure better integration of renewable energies; - will enhance the cross-border exchange of energy.
• The construction of a new 400 kV internal power line between Cernavoda and Stalpu (RO) (EU support €27 million). The power line:
- will contribute to increase the interconnection capacity between Romania and Bulgaria;- will help integrate wind power from the Black Sea coast.
Next steps
On 19th March, the European Commission has made available €200 million of funding for projects in the areas of electricity, smart grids, cross-border carbon dioxide network and gas infrastructure, as part of the first call for proposals under the Connecting Europe Facility (CEF) Energy in 2018. Projects submitted in response to this call will be evaluated in the coming months, and the results will be communicated in August 2018. A further call will also be launched in June 2018.
Link: 873 million euros in energy infrastructure
19

20
Newsletter Power & Utilities
New rules for improving the energy performance of buildings
Key features Insights
On 19th December 2017, an agreement on new rules for improving the energy performance of buildings was reached between the European Parliament, the Council and the Commission.
Based on the Commission proposals, they agreed to add a series of measures to the current Directive aimed at accelerating the cost-effective renovation of existing buildings. The added measures also introduce a smartness indicator for buildings, simplify the inspections of heating and air condition systems and promote electro-mobility by creating parking spaces for electric vehicles.
The European Parliament and the Council formally approved the legal text on 31st January 2018.
The building sector in the EU is the largest single energy consumer in Europe, absorbing 40% of final energy, and about 75% of buildings are energy inefficient. By improving the existing rules, taking advantage of recent technological developments and encouraging further energy efficiency, the EU makes a major step towards fulfilling its 2020 and 2030 energy efficiency targets.
It is part of the Clean energy package presented by the Commission on 30 November 2016 as a concrete proposal to implement the Energy Union strategy.
Main achievements included:
• Creates a clear path towards a low and zero emission building stock in the EU by 2050 underpinned by national roadmaps to decarbonise buildings.
• Encourages the use of information and communication technology (ICT) and smart technologies to ensure buildings operate efficiently for example by introducing auto-mation and control systems.
• Supports the rollout of the infrastructure for e-mobility in all buildings by setting minimum requirements in buildings with more than ten parking spaces to roll out re-charging points for electric cars. In new non-residential buildings and non-residential building undergoing major renovations, the installation of at least one recharging point, and ducting infrastructure to enable the installation of recharging points for electric ve-hicles, will be required for at least one in every five parking space.
• Introduces a “smartness indicator” which will measure the buildings’ capacity to use new technologies and electronic systems to optimise its operation and interact with the grid.
• Integrates long term building renovation strategies.
• Mobilises public and private financing and investment.
• Helps combatting energy poverty and reducing the household energy bill by reno-vating older buildings.
In relation with this issue, on 6th February, the Board of the European Investment Bank (EIB) approved the creation of a brand new financial instrument, the Smart Finance for Smart Buildings initiative. The aim is to make investments in energy efficiency proj-ects in residential buildings more attractive to private investors, through the intelligent use of EU grants as a guarantee.
Next steps
Member States will have to transpose the new elements of the Directive into national law after 20 months.
Link: Energy efficient buildings
21
Newsletter Power & Utilities
EU Emissions Trading System reform
Key features Insights
On 27th February, the European Council for-mally approved the reform of the EU emis-sions trading system (ETS) for the period after 2020.
The revised ETS directive is a significant step towards the EU reaching its target of cutting greenhouse gas emissions by at least 40% by 2030, as agreed under the EU’s 2030 climate and energy framework, and fulfilling its com-mitments under the Paris Agreement.
In addition to contributing to emission re-ductions in a cost-effective way, the re-formed system will encourage innovation and promote the use of low-carbon tech-nologies. In doing so, it will help create new opportunities for jobs and growth while pre-serving the necessary safeguards to protect industrial competitiveness in Europe.
The emissions trading system is reformed by introducing the following elements:
• The cap on the total volume of emissions will be reduced annually by 2.2% start-ing in 2021 (linear reduction factor).
• The number of allowances to be placed in the market stability reserve will be dou-bled temporarily until the end of 2023 in order to mop up excess emission allowances on the market. This measure will increase the price and provide an incentive to reduce emissions.
• A new mechanism to limit the validity of allowances in the market stability re-serve above a certain level will operate in 2023.
The revised ETS directive also contains a number of new provisions to protect industry against the risk of carbon leakage and the risk of application of a cross-sectoral cor-rection factor:
• The share of allowances to be auctioned will be 57%, with a conditional lowering of the auction share by 3% if the cross-sectoral correction factor is applied (consistently across the sectors).
• Revised free allocation rules will enable better alignment with the actual production levels of companies, and the benchmark values used to determine free allocation will be updated.
• The sectors at highest risk of relocating their production outside the EU will receive full free allocation. The free allocation rate for sectors less exposed to carbon leakage will amount to 30%. A gradual phase-out of that free allocation for the less exposed sectors will start after 2026, with the exception of the district heating sector.
• The new entrants’ reserve will initially contain unused allowances from the 2013-2020 period and 200 million allowances from the market stability reserve. Up to 200 million allowances will be returned to the market stability reserve if not used during the period 2021-2030.
• Member states can continue to provide compensation for indirect carbon costs in line with state aid rules.
In addition, two funds are intended to help foster innovation and stimulate the transition to a low-carbon economy.• A modernisation fund will help to upgrade energy systems in lower-income EU mem-
ber states. The fund will not be used for coal-fired projects, except for district heating in the poorest member states.
• An innovation fund will provide financial support for renewable energy, carbon cap-ture and storage and low-carbon projects.
Next steps
This formal approval at the Council is the final step in the legislative process. The revised ETS directive is a significant step towards the EU reaching its target of cutting greenhouse gas emissions by at least 40% by 2030
Link: EU Emissions Trading System reform

22
Newsletter Power & Utilities
What is changing in country regulation?
United KingdomTopic Key features Insights Next Steps
RIIO-2 framework consultation
• Ofgem has issued a consultation document on the framework for the next price control (RIIO-2). RIIO is Ofgem’s approach to ensuring the monopoly companies who run the gas and electricity networks in Great Britain have enough revenue to run an efficient network that delivers what customers need. RIIO stands for Revenues = Incentives + Innovation + Outputs.
• The current RIIO price controls for the gas distribution and gas and electricity transmission are due to finish in 2021. Therefore, Ofgem is consulting on the framework it will apply in the next price control review period (RIIO-2).
• Ofgem will make its decision on the framework in summer 2018.
• The combined proposals included in the consultation document will deliver lower returns to the network companies that are covered by the RIIO price controls from the early 2020s. This is being achieved through an expected lower cost of capital (driven by a lower cost of equity range of 3% to 5%), and by refining how Ofgem sets the cost of debt.
• Ofgem is also consulting on a number of other changes, including reducing the price control period to 5 years (down from the current 8 years), greater requirement for consultation of the proposed business plans by companies with stakeholders, opening up high value upgrades to the network to competition and measures to ensure customers do not pay for capacity which is not used.
• Overall, Ofgem expects that the combination of measures will lead to savings of over £5billion for household customers, equivalent to around £15-£25 per year for a dual fuel household bill.
Consultation is ongoing and invites responses by 2 May 2018
Update on Ofgem plans for retail energy price caps
• In October 2017, the UK Government announced that it would introduce legislation to cap the energy bills of around 11 million customers on poor value tariffs. This legislation was presented to Parliament on 26 February 2018 - the Domestic Gas and Electricity (Tariff Cap) Bill. The aim is to introduce a temporary cap on standard variable tariffs (SVTs) and default tariffs, with the measure expected to be in place until at least 2020. This cap could be extended up to 2023 if Ofgem deems that competition is not working.
• On 6 March 2018, Ofgem published a letter outlining its understanding of its proposed new duties under the legislation, and sets out Ofgem’s plan over the next six months to fulfil its new duties.
• The legislation places a duty on Ofgem to design and implement the tariff cap (the ‘default tariff cap’), and to introduce the default tariff cap as soon as practical. The framework in which Ofgem is required to design the default tariff cap is also set in the proposed legislation. Ofgem will need to take into account a number of factors, such as who the price cap should be applied to, how the level of the price cap will be reviewed (the minimum frequency will be at least every six months), and the process for removing the price cap.
• Following the introduction of the second tariff cap by Ofgem in the last 18 months (the first one applying to pre-payment meter customers), the proposed default tariff cap will be the widest ranging in terms of customers impacted. It reflects increasing intervention by regulators and a change in government policy towards greater regulation on energy tariffs, which were fully liberalized in Great Britain over 15 years ago.
• The expected impact on energy suppliers is likely to be greater on the larger suppliers (referred to as the ‘Big Six’) as they typically have the highest proportion of customers on these types of tariffs. The cap will reduce the tariff levels that are currently charged to customers on SVTs and default tariffs, reducing revenues for these type of customers.
• Impact on smaller suppliers that have a much lower proportion of customers on SVT/default tariffs is expected to be much smaller.
Ofgem will publish a series of working papers in April to June 2018, with a formal consultation expected in August 2018

23
Newsletter Power & Utilities
Topic Key features Insights Next Steps
Working with communities: implementing geological disposal for higher activity radioactive waste
• The UK Government is seeking views from stakeholders and the general public on its proposed policy for working with communities in the siting process for the Geological Disposal Facility (GDF) for higher activity radioactive waste. Based on international experience, the process for identifying and selecting a site for the GDF, together with the required detailed technical work, is estimated to take around 15 to 20 years. The actual construction and operation of the facility will run for more than 100 years.
• One of the principles outlined in the consultation is that the facility will only proceed in an area if the community gives explicit consent through a positive test of public support.
• The proposals are still at an early stage and the purpose of the document is to gather views on how communities should be engaged and represented in a siting process for a GDF. They build on overseas experiences where geological disposal facility site selection processes have been successfully delivered. It also takes into account recommendations of the original committee on Radioactive Waste Management.
• In the short term, this will have limited impact on power and utility companies, but it is an important part of the process for developing a GDF in the UK. It will provide longer-term storage for higher activity radioactive waste, which will support the long-term storage of radiative waste from existing and future nuclear power generators in the UK.
Consultation is ongoing and invites responses by the closing date of 19 April 2018
Proposals regarding setting standards for smart appliances
• The UK Government is consulting and seeking views on proposals for setting standards for smart appliances, to support the transition towards a smarter, more flexible, cleaner and more affordable energy system. In this case, ‘smart appliances’ are those that are connected and able to change their electricity consumption in response to signals for ‘demand side response’ (DSR).
• The preferred option is to transition from voluntary to mandatory standards for smart appliances in 2020s.
• The proposals are for the Government to work with industry to set standards for smart appliances based on a set of principles outlined in the consultation paper.
• This intervention seeks to address a potential barrier to the deployment of smart appliances by having different standards adopted by different manufacturers (a coordination failure). Therefore, this change represents an opportunity for industry to influence the debate and agree common standards that will be mandated.
• This will provide greater certainty in the sector, will enable a greater level of interoperability between smart appliances, faster adoption and deliver the benefits to consumers sooner. It will also allow energy suppliers and aggregators to develop smart tariffs from an expected increase in demand from smart appliances.
Consultation is ongoing and invites responses by 8 June 2018

24
Newsletter Power & Utilities
FranceTopic Key features Insights Next Steps
Compensation of costs beard by supplier for the management of single contract customers
• The majority of electricity consumers have a single contract with their energy supplier including provision and access to distribution networks. It exempts consumers to have a separate contract with the DNO. In this context, the energy supplier manages on behalf of the DNO a part of his contractual relationship with users concerning access to public distribution networks (management of user files, subscription and modification of tariff formulas, telephone reception, billing and bill collection, etc...).
• About three years ago some energy retailers introduced a claim to be compensated for the service performed on behalf of the DNO. In 2018 the French State Court ”Conseil d’Etat” ruled that “the contract concluded between the DNO and the electricity suppliers must not leave to the latter’s expense the costs borne by them for the account of the network manager”. As a result, the customer management activity performed by the suppliers on behalf of the DNOs should be compensated by the DNO.
• On January 18, 2018 the French Energy Regulation Authority (CRE) released the terms and condition of the compensation.
• Such regulation is also in place for gas.
• The compensation are based on the costs of a normally efficient supplier, without exceeding the costs avoided by the customers.
• The reference levels are €156 in HV-A, €78 in LV> 36 kVA and €6.8 in LV<36 kVA per connection point per year. However, for the mass market of customers in LV< 36 kVA, the CRE has retained a transition period until July 31, 2022 to differentiate management of clients with a regulated tariff or a market offer because the relative “passivity” of clients with a regulated tariff constitutes for a source of savings unrelated to his own efficiency.
• It should increase the margin of retailers. However, the impact for DNO should be neutral because the compensation would be included in the tariff billed to final customers.
The CRE anticipate to will review as necessary the relevance and levels of the transitional measures.
Reform of natural gas storage
• The French energy regulatory body (CRE) implemented a reform of the natural gas storage
• CRE’s decision foresees France’s security of supply by ensuring the proper filling of storage facilities, at the level set by the multiannual energy program (138 TWh, an increase of 50% in volumes compared to last year). The total cost of storage in 2018 should amount to around € 715 million, a drop of nearly 30% in storage unit costs. These are reduced to € 5.2 / MWh (instead of € 7.5 / MWh on average in 2016).
• The deliberation of the CRE define a two-step mechanism:
- It set the terms for the marketing, via auctions, of storage capacities with a zero reserve price to maximize the subscribed capacity.
- It establishes a guaranteed authorized income for each storage operator. They will benefit from a compensation between the income received through the auction and their guaranteed income. CRE thus sets the price framework for this compensation.
• The regulation intends to avoid a double remuneration of the gas injected for the operation of the storage plants (cushion gas). It has also set the average cost of capital (WACC) at 5.75%, considering the specific risks related to the storage activity.
• CRE set the amortization period for cushion gas at 75 years, to give visibility to storage operators and the sustainability of their activity.
• Finally, CRE has planned an incentive regulation on gas marketing, by granting a bonus to the most attractive capacities for the market: an operator who has sold all of its capacities will thus retain 5% of the auction income it has generated.
The auction begun on March 5th.
Newsletter Power & Utilities
25
SpainTopic Key features Insights Next Steps
Committee of Experts: Ener-gy Transition Report
• Last July, a Committee of Experts was created in order to elaborate a report about different scenarios in energy transition and different alternatives in energy policy (see Newsletter of September 2017).
• Now, after six months of work, the Committee of Experts has presented the final report. It includes some proposals on energy policy to meet the EU’s climate change targets for 2030 and 2050, taking into account their environmen-tal and economic impact.
• Firstly, the Committee has developed several scenarios on the evolution of the energy sector in Spain up to 2030 and 2050. Based on these scenarios, the Committee has simulated different energy policy proposals to meet EU’s targets.
• According to the Committee’s projections on the Spanish energy mix, coal will almost completely disappear by 2030. However, natural gas will play an important role in 2030, but its importance will be reduced in 2050. In 2050 Spanish electricity generation will be based on wind, photovoltaic, hydroelectric and storage facilities.
• In addition, the report estimates that the early (2030) closure of the Spanish nuclear power plants would increase CO2 emissions in the electricity sector by around 90% and it would increase the cost of electricity generation by around 20%.
• The report highlights taxation as one of the key tools for achieving Spain’s targets. In particular, it proposes replacing the current taxes with others that consider the environmental damage and adequately re-flect the environmental cost incurred. The report also proposes that each en-ergy product should finance its own infrastructures (networks for electricity and gas, and road infrastructure for petrol and diesel fuels).
• The Commission estimates that these tax changes would reduce the price of elec-tricity (6.8% for domestic consumers) and would increase the price of petroleum products, especially diesel (28.6%).
• In addition, the Commission has made reflections and suggestions in other energy policy areas such as:
- Functioning of the electricity market: distributed generation and demand ag-gregation.
- Sustainable mobility: electrification of the car fleet, role of biofuels, measures to facilitate modal shift in freight transport, decarbonisation of rail freight transport, and maritime and air domestic transport.
- Energy consumption in the building and industrial sectors.
- The role of networks in the energy tran-sition.
- Energy poverty.
• Finally, the Commission has proposed the creation of a Council for Energy Transi-tion and Climate Change in Spain. It will be responsible for carrying out a rigorous, independent and continuous evaluation of the energy transition in Spain.
This report will be used by the Government as a basis for the elaboration of the new climate change and en-ergy transition law.

26
Newsletter Power & Utilities
ItalyTopic Key features Insights Next Steps
Capacity bidding zone configuration review
• With this resolution, ARERA formalizes the start of the capacity bidding zone configuration review of the national system (the current bidding zone configuration is in force until 31 December 2018) and defines the methods of execution of future configuration reviews.
• ARERA is the first European regulator to launch a review of national bidding zones pursuant to Regulation EU 2015/12 22 (Capacity Allocation and Congestion Management – CACM), which establishes the guidelines on capacity allocation and congestion management.
• In particular, the regulation requires that:
- Terna (Electricity Transmission Grid Op-erator) consults the final report containing the bidding zone configuration proposals developed using expert-based analysis, organizing for this purpose a seminar open to market operators.
- Terna sends the Authority, and publishes on the internet, the proposal for the new bidding zone configuration (or the proposal to con-firm the existing configuration), together with the observations gathered during consulta-tion and its own evaluations.
• The purpose of the bidding zone configuration review is to promote the efficiency of electricity markets, by avoiding potentially high re-dispatching costs on the Dispatching Service Market (MSD).
• This measure only concerns the grid managed by Terna (Electricity Transmission Grid Operator) and has an insignificant impact on the neighbouring TSOs.
Terna will send the proposal for the new bidding zone configura-tion by 15 May 2018.
Billing and measure-ment
• This resolution defines the measures for the implementation of the Italian 2018 Budget Law in the field of billing and measurement for the electricity sector.
• The seller is obliged to issue the invoice doc-ument for the adjustments made based on the adjustments to the measurement data within 45 days from the time the adjustment becomes available in the Integrated Infor-mation System (IIS).
• In the event of significant delays in invoicing by suppliers, the customer may object to the so-called brief requirement (which has changed from 5 to 2 years) and pay only the last 24 months invoiced. The supplier will be required to inform the customer of the possibility of doing so at the time of issuing the invoice with these characteristics, and in any case at least 10 days prior to the payment due date.
• This resolution initiates a procedure for the complete definition of the necessary inter-ventions. The aim is to spread the knowledge and transparency of the service conditions for the benefit of users.
• The law aims to increase the competition in the electricity sector: not only energy service companies, demand aggregators and IT operators will enter the market, but also the traditional retail energy vendors who intend to gain new market shares and to diversify their business with joint energy offers.
• In this context of market liberalization, the development of smart meters and the non-discriminatory access to con-sumer information become essential for retail markets. At the same time, the guarantee of privacy and data securi-ty is a key condition for the competitive development of the sector.
The procedure for the complete definition of the necessary interventions is expected to be completed by December 31, 2018.

27
Newsletter Power & Utilities
Snapshot on surveys and publications
Deloitte
2018 Power and Utilities Industry Outlook: Trends and opportunities in a changing industry This report point out ways to harness emerging opportunities in a period of technological, regulatory, and competitive changes. What will that change look like and how will the industry manage it? Link to the survey
2018 Renewable Energy Industry Outlook This report outlines the unusual degree of policy uncertainty, but also some strong tailwinds that will likely promote longer-term growth. Which policies could have the most impact on the industry in 2018 and beyond? And which factors can help drive long-term growthLink to the survey
Agencies or research institutes
European CommissionMitigating climate change: renewables in the EU : cutting greenhouse gas emissions through renewables. Volume 2 – 2017This report provides a concise overview of CO2 and aggregated emissions (in both the ETS and the ESD sectors) including recent trends in the EU as a whole, an individual EU countries and an assessment of the role played by renewables in mitigating climate change in the EU and individual countries between 2009 and 2014.Link to the survey
Global energy and climate outlook 2017 This study reveals the value of climate policy in lowering air pollution impacts. The ambitions climate action will decouple economic growth from fossil fuel combustion transforming the way energy is produced, reducing greenhouse gases and emissions of local air pollutants.Link to the survey
Energy efficiency and CO2 – January 2018This statistical report is designed to propose five policy recommendations, to foster the transition to cleaner industry in order to improve and track energy efficiency policies.Link to the survey
PV Status Report 2017The PV Status Report provides comprehensive and relevant information on this dynamic sector. The Compound Annual Growth Rate over the last decade was over 40 %, thus making photovoltaics one of the fastest growing industries at present.Link to the survey
EurelectricDesign the electricity market of the future - 2017This e-book, is an attempt to provide insights for the public discussion and to inspire future debates on different scenarios for 2050. In the midst of this energy transition, Europe needs to ensure secure, sustainable, affordable and competitive energy for all its citizens and businesses.Link to the survey
Flexibility in the energy transition: a toolbox for Electricity DSOs – February 2018The reports provide clear recommendations to policymakers on how the regulatory framework should evolve to make better use of flexibility as a tool to operate their grids in a cost-efficient way, both by the DSOs as well as by other stakeholders. The work focus on how DSOs can use flexibility and contribute to the transition towards a more decarbonized and sustainable European energy sector. Link to the survey

28
Newsletter Power & Utilities
Oxford institute for EnergyElectricity Networks: Technology, Future Role and Economic Incentives for Innovation – December 2017This paper reviews the evolution of electricity grids from the technological and organisational perspectives and analyses the efficacy of existing incentive models in encouraging innovation.Link to the survey
Gazprom in Europe – two “Anni Mirabiles”, but can it continue?- March 2018This Oxford Energy Insight assesses the sources of Gazprom’s success over the past two years, addresses the key issues that the company faces over the next two years, and outlines the key challenges faced by both the company and by European customers and politicians as they address the dilemma of Russian gas.Link to the survey
Rolland BergerPower to the People – November 2017This paper undertook a study involving input from 50 experts to determine and evaluate the most important factors influencing the development of a European decentralized energy system until 2035. Four scenarios are also developed, based on the key political and market variables that the experts thought most likely to affect the transition to decentralized energy systems. Link to the survey
Artificial Intelligence for Utilities – March 2018This report aims to provide specific insights into Artificial Intelligence for the utility sector with a focus on the tangible, near term applications offered by the technology. Link to the survey

Newsletter Power & Utilities
Deloitte fait référence à un ou plusieurs cabinets membres de Deloitte Touche Tohmatsu Limited (DTTL), société de droit anglais (« private company limited by guarantee »), et à son réseau de cabinets membres constitués en entités indépendantes et juridiquement distinctes. DTTL (ou « Deloitte Global ») ne fournit pas de services à des clients. Pour en savoir plus sur notre réseau global de firmes membres : www.deloitte.com/about. En France, Deloitte SAS est le cabinet membre de Deloitte Touche Tohmatsu Limited, et les services professionnels sont rendus par ses filiales et ses affiliés.
Deloitte185, avenue Charles-de-Gaulle92524 Neuilly-sur-Seine CedexTél. : 33 (0)1 40 88 28 00 - Fax : 33 (0)1 40 88 28 28
© 2018 Deloitte & Associés - Une entité du réseau Deloitte - All rights reservedStudio Graphique Neuilly
Newsletter contacts
Global Power Leadership contacts
Véronique LaurentPartner France - E&R [email protected]
Nuria FernandezSenior [email protected]
François LévêqueSenior [email protected]
Sébastien DouguetManager EnergyDeloitte Economic [email protected]
Emmanuel [email protected]
Global Power Leadership Name Contact DetailsGlobal Power Leader Felipe Requejo [email protected] Power Leader Veronique Laurent [email protected] Global Renewable Energy Leader Jane Allen [email protected]
Global E&R Function Leadership Name Contact DetailsGlobal E&R Consulting Leader Anton Botes [email protected] E&R Tax Leader Brad Seltzer [email protected] E&R Financial Advisory Services Leader Rajeev Chopra [email protected] E&R Enterprise Risk Services Leader Paul Zonneveld [email protected] E&R Audit & Accounting Leader Véronique Laurent [email protected]
Thomas Gounel