newsletter as an email marketing tool in ngos:...
TRANSCRIPT

1
Newsletter as an Email Marketing Tool in
NGOs: The Case of Telecentre-Europe
Data analysis of newsletters in May 2011 – July 2014
Ilona Griniute
Communication and Campaign Specialist,
Telecentre-Europe AISBL
August 2014

2
Table of contents
Introduction: Telecentre Europe and its newsletters ...................................................................................... 3
Analysis of most successful newsletters............................................................................................................ 4
KPI: Open Rate ................................................................................................................................................. 4
Email subject line ............................................................................................................................................ 5
KPI: Click Rate ................................................................................................................................................. 7
Analysis of the audience: subscribers with most opens ................................................................................. 10
Analysis of content: top stories of the last 10 newsletters ............................................................................ 12
Conclusions based on data analysis ................................................................................................................. 14
Recommendations ............................................................................................................................................. 16
Screenshots of most successful Telecentre Europe newsletters ................................................................... 19
Table of figures
Figure 1 Open rate for all newsletters in 2011-2014 .......................................................................................................... 5
Figure 2 Click rate for all newsletters in 2011-2014 ........................................................................................................... 9
Figure 3 Subscribers with most opens by gender .............................................................................................................. 11
Figure 4 The best position for a news item in a 3-column newsletter with 3 items ........................................... 13

3
Introduction: Telecentre Europe and its newsletters
Telecentre-Europe AISBL (further Telecentre Europe or TE) is a European non-for-profit
organisation (NGO) and a member-based association established in 2010 in Brussels,
Belgium. The organisation represents publicly funded telecentres and their networks, ICT
learning centres, adult education centres and libraries across Europe where children and
adults can access the Internet, learn the latest digital skills and keep up to date with
technology and community developments. Telecentre Europe aims to increase the impact,
effectiveness and profile of all European telecentres and other NGOs working with digital
inclusion and e-skills in order to bridge the digital – and technological – divide.
Since Telecentre Europe counts over 43 members in its network and is constantly growing,
regular communication with members is one of the Telecentre Europe existing pillars.
More importantly, online communication is of great importance to reach members
operating in other European countries. Among communication tools Telecentre Europe
uses regular newsletters to keep its members informed about its activities, news and
events in the ICT and digital inclusion field.
Its first newsletter was published in May 2011. Since then 33 newsletters were published
before August 2014 with the number of total subscribers growing from 379 in 2011 to 809
in 2014. Therefore, it is important to reflect on the performance of newsletters having this
sufficient data. This analysis should help to identify the most successful newsletters in
terms of KPIs, understand the content, the audience and their reading dynamics. The
analysis will be the basis to draw conclusions and suggest recommendations to improve
future newsletters.

4
Analysis of most successful newsletters Period: May 2011 – July 2014
KPI: Open Rate Open rate is a percentage of total recipients (successful deliveries) who opened a
newsletter. It helps to measure subscriber engagement. Yet it is important to consider the
accuracy of this KPI. Open rate tracking in MailChimp is based on the invisible web graphic
in the bottom of the HTML email and only works in HTML email where recipients choose to
load images when viewing the newsletter. Because some email clients automatically block
this feature from displaying, it is not possible to track open rate unless recipients manually
choose otherwise.1 The 3 most successful Telecentre Europe newsletters based on the open
rate tracking are:
Newsletter Open rate
November 2011 24.05 %
July 2011 23.80 %
May 2014 23.53 %
Table 1 Top 3 newsletters with the best open rate
All three newsletters were sent on a different weekday with Monday proving to give
slightly better open rate results. Two of the newsletters, namely July 2011 and May 2014,
were sent in the morning before 10 am whereas November 2011 was sent in the afternoon
at 16:36. Day of the month for the first two newsletters falls on the same 21st and May 2014
newsletter was sent on 3rd of the month which doesn’t seem to affect open rates.
Newsletter Open rate Weekday Sent Day of the month
November 2011 24.05 % Monday 16:36 21/11
July 2011 23.80 % Thursday 09:53 21/07
May 2014 23.53 % Tuesday 09:45 03/06
Table 2 Top 3 newsletters with best open rates in detail
1 MailChimp Support: About Open Tracking (05/27/2014). Link: http://kb.mailchimp.com/article/about-open-
tracking Accessed on: 08/01/2014

5
The reason why November 2011 newsletter was the most successful of all times could be
the fact that this issue covered TE Summit, an annual event which gathered most of the
organisation’s members and took place just the month before. Subscribers, especially those
who participate, were waiting to see pictures and find out about the event results. In
addition to this, 2011 was the first year of TE newsletter, thus, both curiosity and
excitement of subscribers were still at their peak.
Considering all newsletters, the average open rate since the first newsletter is 19.84%. In
comparison with the non-profit industry average which is 25.12%,2 TE newsletters are
below this average. Compared to the average of 22.49% in education and training
industry2, it is below the average but only by 2.65%. There is no significant tendency in
open rate throughout the history of all newsletters published by TE (see Figure 1). Yet, one
can conclude that from the very start the open rate was the highest in 2011 compared to
other periods. There is a slight recovery seen in 2014, most likely because of the change of
the newsletter format in April.
Email subject line The subject of the email of the newsletter plays a key role in triggering subscribers to open
it. The majority of TE newsletters have very short and simple subject lines, e.g. Newsletter
November 2012. To pick a few examples with more descriptive subject lines, May 2013
newsletter had “May Newsletter: Spark conference, Digital Agenda, events and more”;
October 2013 said “Annual Summit in Malta roundup, Map of eInclusion actors, TEDx
Brussels and Microsoft vouchers”. Did these subject lines attract a higher attention in terms
of open rate? Not exactly. The open rate of October 2013 newsletter was 21.34 %
2 MailChimp research: Email Marketing Benchmarks. Link: http://mailchimp.com/resources/research/email-
marketing-benchmarks/ Accessed on: 08/06/2014
Figure 1 Open rate for all newsletters in 2011-2014

6
compared to the highest open rate of November 2011 with 24.05 %. Most likely, the
success of October 2013 newsletter was determined by other factors, such as the annual
summit that took place that month where all members were invited to participate. The
open rate of May 2013 newsletter was 19.43% which is below the total average (19.84%).
The other two: July 2013 with a subject line “July Newsletter: Telecentre-Europe Summit
2013, Unite-IT first annual conference and more” hit 17.69% only while June 2013 with a
subject line “June Newsletter: Digital Agenda Assembly, Local Coalitions and more” reached
16.99%, both below the average open rate (19.84%).
However, email marketing practice suggests that choosing the right words for the subject
line can result in higher open rates.3 According to one study that MailChimp carried out,
people tend to open emails with subject lines including words like urgent, important,
announcement, or invitation.3 Yet, it can be a completely new story in the case of a
newsletter which comes once a month and, therefore, subscribers know they will receive it.
Based on the analysis and comparison of 40 million emails sent through MailChimp, it is
clear that most successful subject lines were rather short and straightforward, e.g.
[COMPANYNAME] Sales & Marketing Newsletter, Eye on the [COMPANYNAME] Update (Oct
31 - Nov 4) and [COMPANYNAME] Newsletter - February 2006 are among the top five.4
Among other relevant subject lines October 2005 Newsletter, [COMPANYNAME] Jan/Feb
2006 Newsletter or Upcoming Events at [COMPANYNAME] also proved to generate a better
success in terms of open rate. Another interesting fact regarding the connection between
newsletters and their open rates is that usually newsletters start very well, but over some
time their open rates drop.5 This could be influenced by many factors like irrelevant
content, inactive subscribers, frequency, emails in junk/spam folders to name a few. But
one important change is how email clients handle images. More and more of them tend to
block images by default or show only plain text whereas open rate calculation is based on a
tiny graphic image in the email. So in these cases even though subscribers opened a
newsletter, it will not count.6 On one hand, it is important to establish continuity and
branding and keep the content fresh, on the other hand, subject lines should ideally vary by
3 Subject Line Data: Choose Your Words Wisely (11/13/2013). Link: http://blog.mailchimp.com/subject-line-data-
choose-your-words-wisely/ Accessed on: 08/27/2014
4 Subject Line Comparison: The Best and Worst Open Rates on MailChimp. Link:
http://mailchimp.com/resources/research/email-marketing-subject-line-comparison/ Accessed on: 09/02/2014
5 Best Practices for Email Subject Lines (07/09/2014). Link: http://kb.mailchimp.com/article/best-practices-in-
writing-email-subject-lines Accessed on: 09/02/2014
6 The Basics of Email Metrics: Are Your Campaigns Working? (10/2008) Link:
http://www.idealware.org/articles/email_metrics.php Accessed on: 11/18/2014

7
indicating the added value: that is to answer the question of what is inside of this particular
newsletter that is of interest to subscribers.7
KPI: Click Rate Click rate is a percentage of total recipients (successful deliveries) who clicked any tracked
link in the newsletter. Click rate reveals whether the content is relevant and interesting to
subscribers so they want to click links provided in the content to find out more.8 The three
best TE newsletters in terms of their click rate are the following:
Newsletter Click rate Weekday Sent Day of the month
July 2011 10.54 % Thursday 09:53 21/07
November 2011 9.11 % Monday 16:36 21/11
September 2011 8.61 % Wednesday 12:31 14/9
Table 3 Three most successful TE newsletters based on the click rate
All three newsletters were sent on different weekdays as well as times (see Table 4). This
may lead to a general conclusion that the time and the day of newsletter delivery are rather
not a determining factor for its success. Other dynamics might have a stronger impact on
the click rates. Let us have a look at each newsletter’s content to determine possible
reasons.
Top most clicks in the July 2011 issue were: link to www.telecentre-europe.org
(1251), registration form to participate at the TE Summit (13), links to two hotels
Aqua (12) and Argus (12). Total clicks account to 1,344.
Top most clicks in the November 2011 issue: a group photo from Telecentre
Europe Summit (16), Telecentre-Europe's Impact Assessment Survey PARTICIPATE
AND HELP US DISSEMINATE (8), telecentreeurope.ning.com (8), Global Photo Essay
Contest My Telecentre@Work (6), and www.telecentre-europe.org (5). Total clicks
57.
Top most clicks in the September 2011 issue: Telecentre Europe Summit
registration (7), Announcement of Telecentre Europe Summit 2011 (6), Call for 7 Best Practices for Email Subject Lines (07/09/2014). Link: http://kb.mailchimp.com/article/best-practices-in-
writing-email-subject-lines Accessed on: 09/02/2014
8 MailChimp Support: About click tracking (08/11/2014). Link: http://kb.mailchimp.com/article/about-click-
tracking/#clickreports Accessed on: 08/20/2014
8
proposals to support partnerships in the field of youth (6), Skills for Employability
Awards 2011 APPLY NOW AND WIN 5000€ (5), Skills for Employability Awards
2011 Application form (3). Total clicks 41.
The success of July 2011 content was determined by the launch of the new TE website,
hence, resulted in so many clicks. Other two newsletters covered pre- event information
(announcement and registration) and post- event news with photos bringing a lot of
attention from the subscribers and those who participated. From the above clicks one can
conclude that information about: (1) events, event announcements and photos, (2)
contests/ competitions/ open calls, (3) relevant studies/ surveys, and (4) campaign reports
is most likely to bring a better success to the newsletters in terms of click rate.
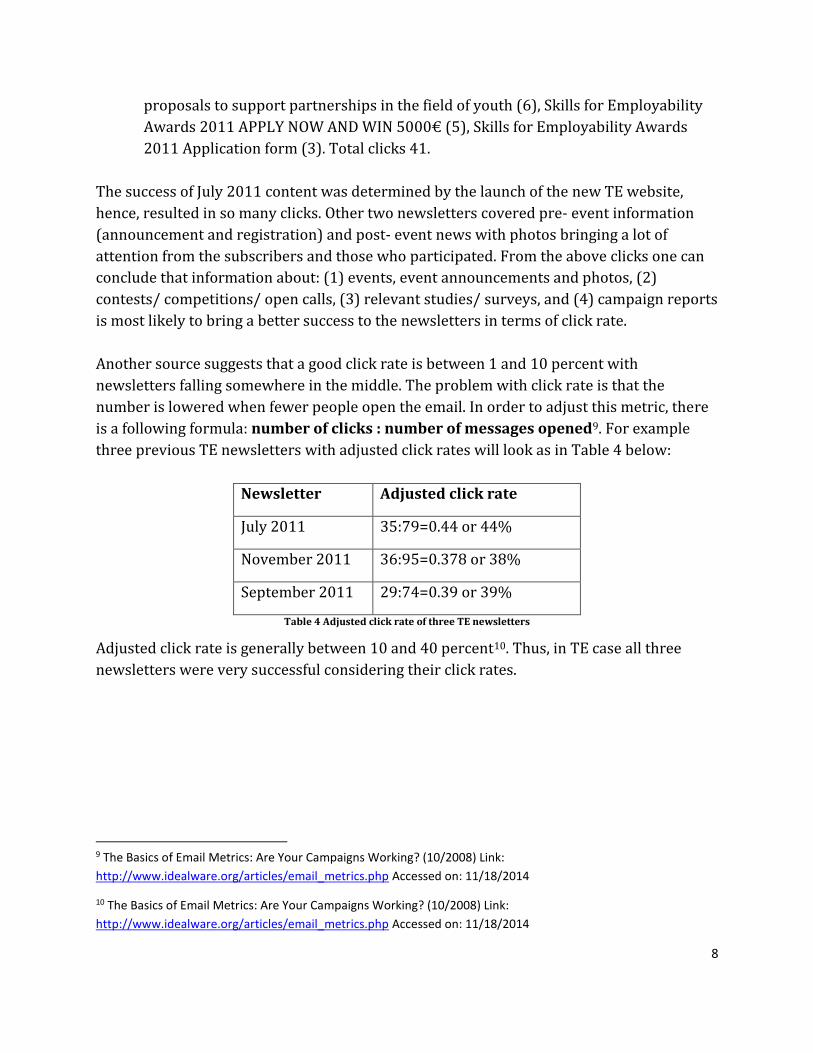
Another source suggests that a good click rate is between 1 and 10 percent with
newsletters falling somewhere in the middle. The problem with click rate is that the
number is lowered when fewer people open the email. In order to adjust this metric, there
is a following formula: number of clicks : number of messages opened9. For example
three previous TE newsletters with adjusted click rates will look as in Table 4 below:
Newsletter Adjusted click rate
July 2011 35:79=0.44 or 44%
November 2011 36:95=0.378 or 38%
September 2011 29:74=0.39 or 39%
Table 4 Adjusted click rate of three TE newsletters
Adjusted click rate is generally between 10 and 40 percent10. Thus, in TE case all three
newsletters were very successful considering their click rates.
9 The Basics of Email Metrics: Are Your Campaigns Working? (10/2008) Link:
http://www.idealware.org/articles/email_metrics.php Accessed on: 11/18/2014
10 The Basics of Email Metrics: Are Your Campaigns Working? (10/2008) Link:
http://www.idealware.org/articles/email_metrics.php Accessed on: 11/18/2014

9
Figure 2 Click rate for all newsletters in 2011-2014
Figure 2 reveals the decreasing trend of click rate since the launch of TE newsletter in
2011: from 10.5% in July 2011 to 3.16% in June 2013 with the overall average of 5.48%.
This could be explained by the following assumptions:
1. At the launch of newsletter, subscribers were excited and curious to read the very
first content. However the curiosity and excitement of something new naturally
have declined during the following editions of the newsletter so less people were
interested to click hyperlinks.
2. The content and its layout have undergone changes, e.g. the way hyperlinks are
emphasized in the text or having less links, and this could have triggered a change in
subscribers’ behaviour.
3. The number of subscribers during almost 4 years has doubled (increased by 2.12
times). The open rate has not changed and rather stayed the same throughout years
which means that new subscribers also open TE newsletter emails. However,
considering the drop in click rate this implies that even though more subscribers
open newsletter emails, yet not all of those who open then click the hyperlinks in
the content. This is closely tied with the next assumption regarding the behavioural
changes.
4. A general change in subscribers’ behaviour and the way they consume information
could be a cause for lower click rates: too much information from other sources; too
many other newsletters; people tend to skim rather then read content so they have
become more selective; newsletter has become less important source of information
as other communication channels like social media take over, etc.

10
Analysis of the audience: subscribers with most opens Based on the open rate of 3 most successful newsletters
It is equally important to identify the most active subscribers who are opening TE
newsletters in order to define the profile and answer questions that could help to improve
the overall concept of TE newsletter. Questions to address are:
1. Do TE members open newsletters mostly or people from other organisations?
2. From what countries does the audience open TE newsletters the most?
3. Are there any subscribers from the European Commission opening TE newsletters?
4. Is it women or men more interested in TE newsletters?
1. Having analysed the data it is clear that TE newsletters are being opened both by many
of TE member organisations as well as other organisations from Europe and even other
continents. Among these are United Nations (ITU, UN ESCAP), Workers’ Educational
Association in UK, World Vision International in USA, Agriculture Information Study
and Consultancy Center in Nepal, Digital Europe in Belgium, Liberty Global in the
Netherlands, Radioexpert in USA, Work and Technology Research Centre in Belgium,
CEPIS in Belgium, National Information Society Agency in South Korea, ECDL in
Belgium, UK Online, VoxWorld.Coop in Ireland, to name a few.
Most active members come from Educating for an Open Society Foundation (EOS)
Romania, Langas I Ateiti Lithuania, Information Society Development Foundation
Poland, Dedalo Foundation for the Information Society Spain, Maks vzw Belgium,
Digipolis Belgium, TEB Association Spain, Association Creatif France, etc. By analysing
top five subscribers with most opens, one can conclude that not only TE member
organisations are interested in TE newsletters. Yet the activity also depends on
additional events happening around the time of the newsletter launch, e.g. TE annual
conference (previously Summit) which attracts a lot of attention.
2. Considering subscribers by countries for the three most successful newsletters based
on open rate, subscribers from Spain and UK are the most active openers (see Table 4).
Among other active countries, we find readers from Belgium, Romania, Italy, France,
Poland, Hungary, USA and Ireland.

11
Country July 2011 November 2011 May 2014 Total
Spain 4 8 15 27
UK 2 16 9 27
Belgium 2 6 18 26
Romania 8 0 11 19
Italy 2 2 13 17
France 3 4 9 16
Poland 2 3 10 15
Hungary 5 2 7 14
USA 2 3 5 10
Ireland 2 2 4 8
Table 5 Most active subscribers by countries (top 10)
3. Yes, there are a few subscribers from the European Commission opening TE
newsletters regularly, however not many. This calls for a better distribution and
networking to involve more subscribers on the policy making level or tailor the content
to suit their interests.
4. After analysing the subscribers that were identified, it is clear that more men than
women tend to open TE newsletters. The difference is the following:
July 2011 newsletter: Male – 30, Female – 22
November 2011: M – 55, F – 28
May 2014: M – 84, F – 77
The total percentage by gender is shown in the below Figure 3:
Figure 3 Subscribers with most opens by gender

12
Analysis of content: top stories of the last 10 newsletters
Sample period: July 2013 – July 2014
(note: no newsletters in Aug 2013, Feb 2014, and Mar 2014)
Top most clicked content in each newsletter of the given period was:
1. July 2013: Registration form online for Telecentre-Europe Summit 2013
2. September 2013: Registration form online for Telecentre-Europe Summit 2013
(note: summit was taking place in October 2013)
3. October 2013: Read the blogpost by Karolina Jasvinaite (TE Summit 2013 in Malta
posted on Unite IT website)
4. November 2013: Get Online Week 2014 (link to a concept doc)
5. December 2013: Letter from our Director (position 1 in the layout)
6. January 2014: Microsoft to continue working with TE on helping fight youth
unemployment (link to a blogpost Grand Opening of the Microsoft Centre in
Brussels); Get Online Week website (both got the same number of clicks)
7. April 2014: link to www.telecentre-europe.org website (possibly because of the first
cover image which links to the TE website); a blogpost YouRock: where young people
meet employers
8. May 2014: Survey from 24 countries shows that many adults still lack basic ICT
knowledge (link to a blogpost on TE website Survey from 24 countries reveals that
many adults still lack basic ICT knowledge)
9. June 2014: Engaging Seniors in ICT: Best Practice Package (posted on Unite IT
website)
10. July 2014: Is Your Coding Event on the Map? (link to EU press release about the
coding activities in relation to the Code Week)
From the above, one can conclude that circumstances influence the popularity of the
content: events and related news, e.g. event registration forms, happening at the time boost
the click rate. In terms of the position in the layout, the majority of the news items were
placed as #1 in 2013 newsletters with the previous long content structure before the
change (exception: November 2013 with the most successful #2 news item). January 2014
newsletter is also an exception where most clicked content came #2 and #3. By looking at
the last four newsletters in April – July with a new 3-column structure, the best position for
content was #1 and #2 (or the first two positions in the center column, see the image
below).

13
Figure 4 The best position for a news item in a 3-column newsletter with 3 items
One more assumption can be made in what regards the success of the news item: an image
is not a main factor in triggering clicks, but rather a supporting element. In the above 5 top
stories out of 10 subscribers clicked on links: to websites, to other blogposts, to documents
to be downloaded.

14
Conclusions based on data analysis
After analysing TE newsletters in the given period based on MailChimp data, one can draw
the following conclusions:
1. Newsletters sent in the beginning of the week give slightly better open rate results
compared to other weekdays. The time of delivery and the day of the month do not
affect opening of newsletters.
2. With the average open rate of 19.84% TE newsletters are below the average of non-
profit industry which is 25.12% and below the average of education and training
industry which is 22.49%.
3. TE newsletters that were analysed have rather short and simple email subject lines.
Based on the suggestions of one MailChimp analysis of emails, short and
straightforward subject lines were the most successful and should normally fit into
50 characters.
4. In terms of click rate, information about events (upcoming event announcements,
post event summaries, photos related to events), contests or competitions, relevant
studies and survey results, and reports of organization’s campaigns determine
higher number of clicks and drive better subscribers’ engagement.
5. Since the launch of TE newsletter in 2011 one can see a decreasing trend in the click
rate numbers: from 10.5% in July 2011 down to 3.16% in June 2013. This could be
due to various factors, such as a natural, over-time decrease in open rates which in
turn results in lower click rates, the profile and interests of subscribers that change
where a newsletter is not able to keep up with relevant information tailored for all
target groups.
6. Analysis of the audience of the most successful TE newsletters shows that among TE
members who are opening newsletters, there are also other European and global
organisations opening them. Yet most active readers come from European countries
(Spain, UK, Belgium, Romania, Italy, France, Poland, Hungary, Ireland) and USA.
7. Most popular stories of the last ten TE newsletters were from event registration
forms to survey results to various news items. In terms of the position in the layout,
the majority of these news items were placed as #1 in 2013 newsletters with a few

15
exceptions. Images seem to play a supporting role because 50/50 clicks were on the
links of websites and other blogposts, on documents to be downloaded.

16
Recommendations
General recommendations to improve TE newsletter are these:
Subject lines could vary between the months indicating a few keywords of what is
expected in each newsletter to generate higher open rates (tell the reader what is
inside this time?). People also like to be thanked for their contribution and,
whenever possible, this could be part of the subject line. Examples of keywords
could include but not limited to: invitation to x event, announcement of x conference,
thank you for x, urgent…, update…, invitation from Telecentre Europe, website news…,
etc.
A/B testing is a good way to understand what type of newsletters work better. The
idea is to split a subscriber list in half and send two different newsletters to measure
their performance: the difference could be in writing two different subject lines
which will then indicate how this affects open rates and if another strategy for
subject lines is needed.11 Another option could be a change in content to determine
click rate, for example, by underlining hyperlinks in two different colors. There can
be more options and even small changes like font color, call out boxes, buttons or
specific keywords can count when using A/B testing.
A list of subscribers could be revised and possible segmented lists could be created
in order to address different needs of target groups, e.g. formal members vs.
European institutions officers. In this case it would help to tailor the right content to
the right audience, yet this would require additional time and effort.
In terms of relevance, it is always useful to check what links people clicked the most
on in previous editions to determine successful – relevant – content. Another way
could be to carry out a short survey to ask subscribers what content they like and
what content they miss in newsletters. The survey could be open on the website for
those willing to contribute.
It is important to know the profile of subscribers to be able to determine what kind
of information is useful and how to go about planning the content. This could
include information about the type of company they work for (public, private, NGO,
11 Email Open Rates Woes: Why not to be fooled by email open rate? Link:
http://emailmarketing.comm100.com/email-marketing-tutorial/email-open-rate.aspx Accessed on: 09/30/2014

17
etc.), their job position, the country, and more specific demographics. Hence, the
best way of getting this information is by asking it in the subscription form.
Low number of policy makers opening TE newsletters calls for a better networking
and relationship management in order to involve more subscribers from the policy
making level or tailor the content to suit their interests.
As the new column layout allows, TE should identify the most important news item
to be placed at the top of the content. This will ensure easier content reading and
will help subscribers to get a quick idea of what is the highlight of this newsletter
edition.
Events is one global topic that always interests people and draws their attention.
Hence, TE newsletter could include a dedicated section (a call out box, a calendar
like list, etc.) to highlight upcoming events.
Frequency of newsletters should also be evaluated. Poor open rates might indicate
that newsletters are sent too often (or too rarely). Depending on the content being
created every month newsletters could be sent out on special occasions, e.g. after
General Assembly in January-February; after one major TE Get Online Week
campaign in March; one summer edition in May-June; after TE Annual Conference in
September-October and finally one winter edition in December.
The hyperlink text could be more descriptive and informative by tailoring a
standard phrase “click here” depending on the context, e.g. “read more”, “answer
this survey”, “download a position paper”, “give your feedback”, “share the news”,
etc. The rule of thumb: the more the links, the higher the chances of someone
clicking them.
Make the content easily shared on social media channels by including social media
buttons, and if possible, even next to each news item.
Social media channels are good drivers of getting new subscribers. Since TE does
not have a strong visibility on YouTube, this channel with more videos in the future
could also help to get more people to find out about and subscribe to the newsletter.
A few other ideas:
o A dedicated landing page on the website for TE newsletter
o Messages from newsletter content on Twitter to attract retweets
o Actively participate in related forums and LinkedIn group discussions to get
a chance to spread the word

18
o Encourage TE members to share the newsletters
o Offer some benefit, for instance, a downloadable report, a position paper, a
video, an infographic on a hot topic
o Promote the newsletter in email signatures.

19
Screenshots of most successful Telecentre Europe newsletters
July 2011 newsletter

20
November 2011 newsletter

21
May 2014 newsletter